

Chapter 4.2: Fiscal Outlook
Table of Contents  Previous
 Next
Next
To ensure objectivity and transparency, the economic forecast underlying the Government's fiscal projections is based on an average of private sector economic forecasts. This process has been followed for two decades and has been endorsed by the International Monetary Fund. Economic Action Plan 2014 maintains that approach.
However, as described in Chapter 2, although the December 2013 private sector survey is considered to be a reasonable basis for fiscal planning purposes, the global economic outlook remains uncertain. As a result, the Government has judged it appropriate to continue to include a $20-billion downward adjustment to the private sector forecast for nominal gross domestic product (GDP) over the 2014–15 to 2018–19 period. With this adjustment for risk, the revenue projections are reduced by $3.0 billion in each year from 2014–15 to 2018–19 (Table 4.2.1).
As Economic Action Plan 2014 is being released in February, only three quarters of economic accounts from 2013 are available and final fiscal results are only available until November. To reflect this, the downward adjustment for 2013 nominal GDP used in the November 2013 Update of Economic and Fiscal Projections (Fall Update) is maintained in Economic Action Plan 2014 at $10 billion, or $1.5 billion in revenue for 2013–14.
| 2013–2014 | 2014–2015 | 2015–2016 | 2016–2017 | 2017–2018 | 2018–2019 | |
|---|---|---|---|---|---|---|
| Adjustment for risk to revenues | -1.5 | -3.0 | -3.0 | -3.0 | -3.0 | -3.0 |
Fiscal Outlook Before the Measures Announced in Economic Action Plan 2014
While the Canadian economy has recovered from the global recession better than other Group of Seven (G-7) economies, the global economic environment remains fragile and risks continue to weigh on global growth prospects. Canada is not immune to these external developments. Since the Fall Update, projections for nominal GDP—the broadest single measure of the tax base—and short-term interest rates have been revised down somewhat.
These economic developments, together with fiscal developments since the Fall Update, have resulted in an overall improvement to the fiscal outlook, as lower projected budgetary revenues have been more than offset by lower projected program expenses and public debt charges in most years. Table 4.2.2 provides a summary of the changes in the fiscal projections between the Fall Update and Economic Action Plan 2014.
| Projection | |||||||
|---|---|---|---|---|---|---|---|
| 2012–2013 | 2013–2014 | 2014–2015 | 2015–2016 | 2016–2017 | 2017–2018 | 2018–2019 | |
| 2013 Fall Update budgetary balance | -18.9 | -17.9 | -5.5 | 3.7 | 5.0 | 5.7 | 9.8 |
| Revenue effect of adjustment for risk | 1.5 | 3.0 | 3.0 | 3.0 | 3.0 | 3.0 | |
| 2013 Fall Update budgetary balance before adjustment for risk | -18.9 | -16.4 | -2.5 | 6.7 | 8.0 | 8.7 | 12.8 |
| Impact of economic and fiscal developments1 | |||||||
| Budgetary revenues | -1.3 | -1.7 | -1.6 | -1.2 | -1.2 | -1.4 | |
| Program expenses | |||||||
| Major transfers to persons | 0.4 | 0.5 | 0.5 | 0.3 | 0.3 | 0.3 | |
| Major transfers to other levels of government | 0.0 | 0.0 | -0.1 | -0.1 | -0.1 | -0.1 | |
| Direct program expenses | 0.4 | 1.1 | 1.0 | 1.1 | 2.0 | 1.1 | |
| Total | 0.7 | 1.7 | 1.4 | 1.4 | 2.3 | 1.3 | |
| Public debt charges | 0.1 | 0.5 | 0.6 | 0.8 | 0.3 | 0.1 | |
| Total economic and fiscal developments | -0.4 | 0.5 | 0.4 | 0.9 | 1.4 | 0.0 | |
| Revenue effect of adjustment for risk | -1.5 | -3.0 | -3.0 | -3.0 | -3.0 | -3.0 | |
| Revised status quo budgetary balance (before budget measures) | -18.9 | -18.3 | -5.0 | 4.1 | 6.0 | 7.1 | 9.8 |
| Note: Totals may not add due to rounding. 1 A negative number implies a deterioration in the budgetary balance (lower revenues or higher spending). A positive number implies an improvement in the budgetary balance (higher revenues or lower spending). |
|||||||
Compared to the Fall Update, projected budgetary revenues are lower over the forecast horizon, reflecting the downward revisions to the projections for nominal GDP and short-term interest rates, which reduce tax revenues and other revenues, respectively. Projected budgetary revenues are further lowered in the near term by flow-through items, such as transfers to provinces in respect of natural resource revenues, which give rise to an equal and offsetting reduction in total expenses with no impact on the budgetary balance.
Expenses are expected to be below the level projected in the Fall Update over the forecast horizon in most categories.
Major transfers to persons are projected to be lower due to lower expected inflation and year-to-date results.
Major transfers to other levels of government are expected to be higher than projected in the Fall Update, mainly due to higher projected transfers to the territories and lower recoveries under the Alternative Payments for Standing Programs.
Direct program expenses are expected to be lower than projected in the Fall Update. A number of factors are driving this decrease, including:
- Lower projected public service pension and benefit expenses, reflecting better-than-expected investment performance by the Public Sector Pension Investment Board in 2013–14 and higher projected long-term interest rates since Budget 2013.
- Lower projected flow-through expenses, such as transfers to provinces in respect of natural resource revenues, resulting in an equal and offsetting reduction in total revenues with no impact on the budgetary balance.
- Lower projected costs for refundable tax credits, which are reported as expenses in the Public Accounts.
The outlook for direct program expenses has also been revised to reflect changes in expected infrastructure spending, as well as changes to the forecast for capital amortization expenses.
Public debt charges are expected to be lower than projected in the Fall Update over the forecast horizon, largely due to lower projected short-term interest rates and inflation, and lower projected interest expenses on net pension and benefit liabilities. The decrease in projected interest expenses on net pension and benefit liabilities reflects higher projected long-term interest rates since Budget 2013, which have resulted in a lower estimated benefit obligation, as well as a higher rate of return on Public Sector Pension Investment Board investments in 2013–14.
Fiscal Impact of Measures Announced in Economic Action Plan 2014
Table 4.2.3 sets out the impact of the measures introduced in Economic Action Plan 2014.
| Projection | ||||||||
|---|---|---|---|---|---|---|---|---|
| 2013–2014 | 2014–2015 | 2015–2016 | 2016–2017 | 2017–2018 | 2018–2019 | |||
| 2013 Fall Update budgetary balance | -17.9 | -5.5 | 3.7 | 5.0 | 5.7 | 9.8 | ||
| Economic and fiscal developments | -0.4 | 0.5 | 0.4 | 0.9 | 1.4 | 0.0 | ||
| Revised status quo budgetary balance (before budget measures) | -18.3 | -5.0 | 4.1 | 6.0 | 7.1 | 9.8 | ||
| Budget measures1 | ||||||||
| Actions to support jobs and growth | -0.1 | -0.7 | -1.0 | -1.2 | -1.2 | -1.6 | ||
| Restoring the effectiveness of the excise duty on tobacco products | 0.1 | 0.7 | 0.7 | 0.6 | 0.6 | 0.6 | ||
| Responsible management of National Defence capital funding | 0.6 | 0.6 | 0.9 | 1.1 | 0.0 | 0.0 | ||
| Managing compensation costs | 1.1 | 1.5 | 1.4 | 1.2 | 1.1 | 1.0 | ||
| Improving the fairness and integrity of the tax system, and strengthening tax compliance | 0.0 | 0.0 | 0.4 | 0.4 | 0.4 | 0.5 | ||
| Total budget measures | 1.7 | 2.1 | 2.3 | 2.2 | 1.0 | 0.5 | ||
| Budgetary balance (after budget measures) | -16.6 | -2.9 | 6.4 | 8.1 | 8.1 | 10.3 | ||
| Note: Totals may not add due to rounding. 1 A negative number implies a deterioration in the budgetary balance (lower revenues or higher spending). A positive number implies an improvement in the budgetary balance (higher revenues or lower spending). |
||||||||
Economic Action Plan 2014 makes investments totalling $5.8 billion over six years to support jobs and growth by connecting Canadians with available jobs; fostering job creation, innovation and trade; developing resources responsibly, conserving Canada's natural heritage and investing in infrastructure and transportation; and supporting families and communities.
As discussed in Chapter 3.4, Economic Action Plan 2014 also proposes to restore the effectiveness of the excise duty on tobacco products by adjusting the domestic rate of excise duty on such products to account for inflation and eliminating the preferential excise duty treatment of tobacco products available through duty free markets. It is estimated that these measures will increase federal tax revenues by about $3.3 billion over six years.
Further, to ensure that funding for vital National Defence equipment is available for planned requirements, the Government is shifting $3.1 billion of National Defence funding for major capital procurements to future years in which key purchases will be made.
In addition, Economic Action Plan 2014 continues to ensure that overall public service employee compensation is reasonable and affordable, as well as aligned with that offered by other public and private employers. The Government will take steps to ensure that the costs of the Public Service Health Care Plan for retirees are shared fairly between them and the Government as employer. To this end, the Government intends to transition from currently paying 75 per cent of benefit costs to equal cost sharing for retired federal employees under the Public Service Health Care Plan, and increase from two to six the number of years of service required to be eligible to participate in the Plan in retirement except for current pensioners. As a result of the need to reduce the recorded liability for future pensioner health care expenses under accrual accounting, this measure is projected to improve the budgetary balance by $7.4 billion over six years.
As discussed in Chapter 4.1 and Annex 2, Economic Action Plan 2014 proposes a number of measures to continue to improve the fairness and integrity of the tax system and strengthen tax compliance. These measures are expected to increase federal tax revenues by $1.8 billion over six years.
New policy measures in this budget improve the budgetary balance over the projection period. Over six years, measures taken in Economic Action Plan 2014 will improve the budgetary balance by $9.8 billion.
Summary Statement of Transactions
Table 4.2.4 summarizes the Government's financial position over the forecast horizon. These projections are based on the average private sector forecast for the economy and take into account the adjustment for risk discussed above.
| Projection | |||||||
|---|---|---|---|---|---|---|---|
| 2012–2013 | 2013–2014 | 2014–2015 | 2015–2016 | 2016–2017 | 2017–2018 | 2018–2019 | |
| Budgetary revenues | 256.6 | 264.0 | 276.3 | 293.3 | 306.8 | 317.7 | 332.4 |
| Program expenses | 246.4 | 251.2 | 250.2 | 256.9 | 266.5 | 275.2 | 286.3 |
| Public debt charges | 29.2 | 29.3 | 29.0 | 30.0 | 32.1 | 34.4 | 35.8 |
| Total expenses | 275.6 | 280.5 | 279.2 | 286.9 | 298.7 | 309.7 | 322.1 |
| Budgetary balance | -18.9 | -16.6 | -2.9 | 6.4 | 8.1 | 8.1 | 10.3 |
| Federal debt1 | 602.4 | 616.0 | 618.9 | 612.4 | 604.3 | 596.2 | 586.0 |
| Per cent of GDP | |||||||
| Budgetary revenues | 14.1 | 14.1 | 14.3 | 14.5 | 14.5 | 14.4 | 14.4 |
| Program expenses | 13.5 | 13.5 | 13.0 | 12.7 | 12.6 | 12.5 | 12.4 |
| Public debt charges | 1.6 | 1.6 | 1.5 | 1.5 | 1.5 | 1.6 | 1.6 |
| Budgetary balance | -1.0 | -0.9 | -0.1 | 0.3 | 0.4 | 0.4 | 0.4 |
| Federal debt | 33.1 | 33.0 | 32.0 | 30.3 | 28.6 | 27.0 | 25.5 |
| Note: Totals may not add due to rounding. 1 The projected level of federal debt for 2013–14 includes an estimate of other comprehensive income. |
|||||||
Including the measures announced in Economic Action Plan 2014, the deficit is projected to fall to $16.6 billion in 2013–14 and $2.9 billion in 2014–15. A surplus of $6.4 billion is projected for 2015–16, after taking into account the $3.0-billion annual adjustment for risk. As a result, the Government remains on track to achieve its goal of returning to balanced budgets in 2015.
Achieving this result will help ensure that the federal debt-to-GDP ratio remains on a downward path. Indeed, the federal debt-to-GDP ratio is expected to fall below its low, pre-recession level in 2017–18, putting the Government well on its way towards achieving its target of 25 per cent of GDP by 2021, announced at the September 2013 G-20 Leaders' Summit in St. Petersburg, Russia. Lower debt levels mean lower debt-servicing costs, which results in lower taxes for Canadians and a strong investment climate that supports job creation and economic growth.
The planned reduction in federal debt will help to ensure that Canada's total government net debt (which includes that of the federal, provincial/territorial and local governments as well as the net assets of the Canada Pension Plan and the Québec Pension Plan) will remain the lowest, by far, of any G-7 country and among the lowest of the advanced G-20 countries.
| Projection | |||||||
| 2012–2013 | 2013–2014 | 2014–2015 | 2015–2016 | 2016–2017 | 2017–2018 | 2018–2019 | |
| Income taxes | |||||||
| Personal income tax | 125.7 | 130.1 | 137.8 | 145.8 | 153.2 | 160.5 | 167.7 |
| Corporate income tax | 35.0 | 35.0 | 37.0 | 39.5 | 42.2 | 44.5 | 46.5 |
| Non-resident income tax | 5.1 | 5.5 | 5.7 | 6.0 | 6.5 | 6.9 | 7.3 |
| Total income tax | 165.8 | 170.6 | 180.4 | 191.2 | 201.9 | 211.9 | 221.5 |
| Excise taxes/duties | |||||||
| Goods and Services Tax | 28.8 | 29.9 | 31.3 | 33.2 | 35.1 | 36.7 | 38.3 |
| Customs import duties | 4.0 | 4.2 | 4.4 | 5.0 | 4.7 | 4.9 | 5.1 |
| Other excise taxes/duties | 10.8 | 10.6 | 11.3 | 11.3 | 11.3 | 11.4 | 11.4 |
| Total excise taxes/duties | 43.6 | 44.8 | 47.0 | 49.5 | 51.1 | 53.0 | 54.8 |
| Total tax revenues | 209.3 | 215.3 | 227.5 | 240.7 | 253.0 | 264.9 | 276.3 |
| Employment Insurance premium revenues | 20.4 | 21.5 | 22.7 | 23.6 | 23.0 | 19.4 | 20.2 |
| Other revenues | 26.9 | 27.1 | 26.2 | 29.0 | 30.8 | 33.4 | 35.8 |
| Total budgetary revenues | 256.6 | 264.0 | 276.3 | 293.3 | 306.8 | 317.7 | 332.4 |
| Per cent of GDP | |||||||
| Personal income tax | 6.9 | 7.0 | 7.1 | 7.2 | 7.3 | 7.3 | 7.3 |
| Corporate income tax | 1.9 | 1.9 | 1.9 | 2.0 | 2.0 | 2.0 | 2.0 |
| Goods and Services Tax | 1.6 | 1.6 | 1.6 | 1.6 | 1.7 | 1.7 | 1.7 |
| Total tax revenues | 11.5 | 11.5 | 11.8 | 11.9 | 12.0 | 12.0 | 12.0 |
| Employment Insurance premium revenues | 1.1 | 1.2 | 1.2 | 1.2 | 1.1 | 0.9 | 0.9 |
| Other revenues | 1.5 | 1.5 | 1.4 | 1.4 | 1.5 | 1.5 | 1.6 |
| Total budgetary revenues | 14.1 | 14.1 | 14.3 | 14.5 | 14.5 | 14.4 | 14.4 |
| Note: Totals may not add due to rounding. | |||||||
Table 4.2.5 sets out the Government's projection for budgetary revenues reflecting both Economic Action Plan 2014 measures, including actions to close tax loopholes and improve the fairness and integrity of the tax system, and the adjustment for risk, which for planning purposes is applied proportionally to tax revenues and other revenues, net of flow-through revenues. Budgetary revenues are expected to increase by 2.9 per cent in 2013–14 based on year-to-date fiscal results and the economic projections. Over the remainder of the forecast horizon, budgetary revenues are projected to grow at an average annual rate of 4.7 per cent.
Personal income tax revenues—the largest component of budgetary revenues—are projected to increase by $4.4 billion, or 3.5 per cent, to $130.1 billion in 2013–14. Over the remainder of the projection period, personal income tax revenues increase somewhat faster than growth in nominal GDP, averaging 5.2 per cent annual growth, reflecting the progressive nature of the income tax system combined with projected real income gains.
Corporate income tax revenues are projected to be $35.0 billion in 2013–14. Over the remainder of the projection period, corporate income tax revenues are forecast to grow at an annual rate of 5.9 per cent, based on projected profit growth and actions to close tax loopholes and improve the fairness and integrity of the tax system, as well as improvements to the Canada Revenue Agency's compliance programs.
Non-resident income tax revenues are income taxes paid by non-residents of Canada on Canadian-sourced income, notably dividends and interest payments. Reflecting strong year-to-date growth, they are projected to increase by $0.4 billion, or 7.6 per cent, to $5.5 billion in 2013–14. Over the remainder of the projection period, non-resident income tax revenues increase at an average annual rate of 5.9 per cent.
Goods and Services Tax (GST) revenues are projected to grow by 3.9 per cent in 2013–14 based on projected growth in taxable consumption and year-to-date results. Over the remainder of the projection period, GST revenues are projected to grow by 5.1 per cent per year on average, based on projected growth in taxable consumption and in the GST Credit.
Customs import duties are projected to increase 4.9 per cent in 2013–14, reflecting year-to-date results and projected growth in imports. The growth in customs import duties is expected to increase to 5.8 per cent in 2014–15 and 12.9 per cent in 2015–16 due to growth in imports and previously announced measures, but decline by 5.7 per cent in 2016–17, reflecting the expected introduction of the Canada-European Union Comprehensive Economic and Trade Agreement. Over the last two years of the projection period, annual growth in customs import duties is projected to average 4.5 per cent, based on projected growth in imports.
Other excise taxes and duties are projected to decline slightly to $10.6 billion in 2013–14, reflecting year-to-date results and recent trends. However, they are expected to increase by $0.7 billion, or 6.3 per cent, to $11.3 billion in 2014–15, mostly due to the adjustment of the excise duty rate for tobacco announced in this budget. Other excise taxes and duties are then expected to remain stable over the remainder of the projection period.
Employment Insurance (EI) premium revenues are projected to grow by 5.4 per cent in 2013–14, in line with the projected growth in insurable earnings and the EI premium rate of $1.88 per $100 of insurable earnings in both 2013 and 2014. For 2015 and 2016, the Government has announced that the EI premium rate will be set no higher than $1.88. For the purposes of fiscal planning, a rate of $1.88 has been assumed. As a result, from 2013–14 to 2015–16, the cumulative deficit in the EI Operating Account accumulated during the recession will be eliminated as EI premium revenues are projected to grow by 4.7 per cent per year on average, based on projected growth in wages and salaries. Given the planned introduction of the seven-year break-even rate mechanism in 2017, EI premium rates are expected to fall to $1.47 in that year, bringing expected declines in EI premium revenues of 2.6 per cent in 2016–17 and 15.4 per cent in 2017–18. EI premium revenues are expected to resume their upward trend in 2018–19 based on projected growth in wages and salaries.
| 2012–2013 | 2013–2014 | 2014–2015 | 2015–2016 | 2016–2017 | 2017–2018 | 2018–2019 | ||||||||
|---|---|---|---|---|---|---|---|---|---|---|---|---|---|---|
| EI premium revenues | 20.4 | 21.5 | 22.7 | 23.6 | 23.0 | 19.4 | 20.2 | |||||||
| EI benefits1 | 17.1 | 17.0 | 17.7 | 18.4 | 19.1 | 19.7 | 20.4 | |||||||
| 2012 | 2013 | 2014 | 2015 | 2016 | 2017 | 2018 | ||||||||
| EI Operating Account annual balance2 | 1.0 | 3.1 | 3.6 | 3.9 | 4.0 | -1.7 | -1.5 | |||||||
| EI Operating Account cumulative balance2 | -8.1 | -5.1 | -1.5 | 2.4 | 6.4 | 4.7 | 3.2 | |||||||
| Reference: | ||||||||||||||
| Projected premium rate (per $100 of insurable earnings) |
1.83 | 1.88 | 1.88 | 1.88 | 1.88 | 1.47 | 1.47 | |||||||
| 1 EI benefits include regular EI benefits, sickness, maternity, parental, compassionate care, fishing and work-sharing benefits, and employment benefits and support measures. These represent 90 per cent of total EI program expenses. The remaining EI costs relate mainly to administration and are included in direct program spending. 2 The EI Operating Account annual and cumulative balances are on a calendar-year basis since the EI premium rate is set on a calendar-year basis. |
||||||||||||||
The global recession led to an increase in EI benefit expenditures over a relatively short period of time. As a result, the EI Operating Account, which records all amounts received or paid out under the Employment Insurance Act, reached a cumulative deficit of $9.2 billion in 2011. The EI Operating Account is now on track to return to cumulative balance without requiring premium rate increases above the current level of $1.88. As a result, in September 2013 the EI premium rate for 2014 was frozen at the 2013 level of $1.88 per $100 of insurable earnings and it was announced that the rate will be set no higher than $1.88 for 2015 and 2016.
For fiscal planning purposes, an EI premium rate of $1.88 is assumed for 2015 and 2016, which leads to the projection of a cumulative surplus in the EI Operating Account. Any accumulated surplus will be gradually eliminated after the introduction of the seven-year break-even rate mechanism in 2017. This new rate-setting mechanism will ensure that EI premiums are no higher than needed to pay for the EI program over time, which is expected to result in a significant reduction in the premium rate in 2017. After the move to the seven-year break-even rate in that year, annual adjustments to the rate will be limited to 5 cents.
Other revenues include revenues from consolidated Crown corporations, net income from enterprise Crown corporations, returns on investments, foreign exchange revenues and proceeds from the sales of goods and services. These revenues are generally volatile, owing principally to the impact of interest rates on returns on investments and the assets in the Exchange Fund Account, and the net gains or losses from enterprise Crown corporations. These revenues are also affected by the impact of exchange rate movements on the Canadian-dollar value of foreign-denominated assets as well as flow-through items that give rise to an offsetting expense and therefore do not impact the budgetary balance.
Other revenues are projected to increase by $0.2 billion to $27.1 billion in 2013–14, as the increases in revenues from the sale of some of the Government's shares in General Motors and the sale of Macdonald House, a Canadian High Commission property in London, are expected to be largely offset by lower revenues from Crown corporations. Growth in other revenues is expected to average 5.7 per cent per year over the remainder of the projection period based on projected profiles of interest rates and nominal GDP and the provision for future asset sales.
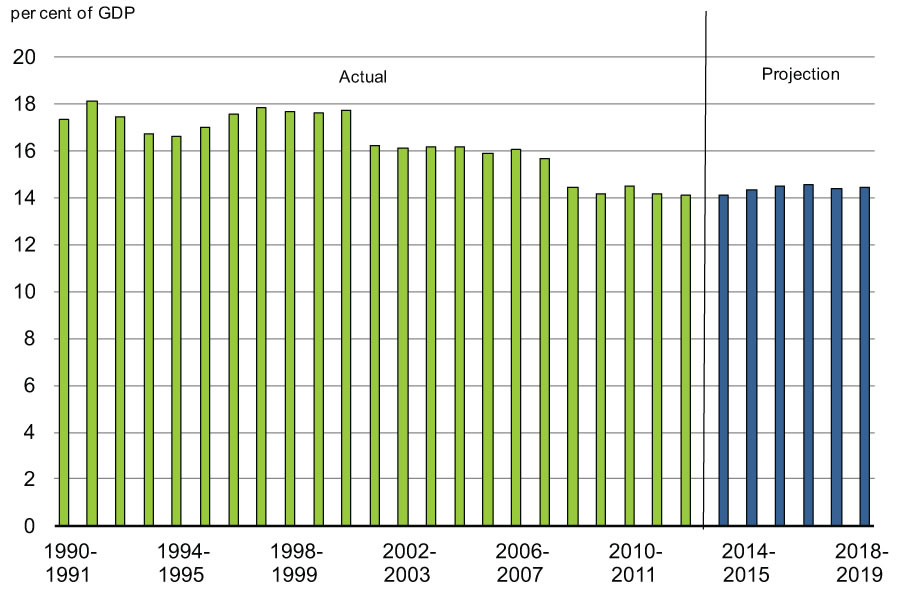
The revenue-to-GDP ratio declined substantially after 2006–07, and is at its lowest level in more than 50 years, averaging just over 14 per cent since 2008–09 (Chart 4.2.1). This decline is due primarily to broad-based tax cuts and targeted tax relief for individuals, families and businesses. Over the forecast horizon, the revenue-to-GDP ratio is projected to remain relatively stable around its current level.
| Projection | |||||||
|---|---|---|---|---|---|---|---|
| 2012–2013 | 2013–2014 | 2014–2015 | 2015–2016 | 2016–2017 | 2017–2018 | 2018–2019 | |
| Major transfers to persons | |||||||
| Elderly benefits | 40.3 | 41.8 | 43.8 | 46.1 | 48.6 | 51.3 | 54.1 |
| Employment Insurance benefits1 | 17.1 | 17.0 | 17.7 | 18.4 | 19.1 | 19.7 | 20.4 |
| Children's benefits | 13.0 | 13.2 | 13.2 | 13.3 | 13.5 | 13.7 | 13.8 |
| Total | 70.3 | 72.0 | 74.7 | 77.8 | 81.2 | 84.6 | 88.3 |
| Major transfers to other levels of government | |||||||
| Canada Health Transfer | 28.6 | 30.3 | 32.1 | 34.0 | 36.1 | 37.7 | 39.3 |
| Canada Social Transfer | 11.9 | 12.2 | 12.6 | 13.0 | 13.3 | 13.7 | 14.2 |
| Fiscal arrangements2 | 17.8 | 18.7 | 19.4 | 20.1 | 20.8 | 21.7 | 22.5 |
| Gas Tax Fund | 2.0 | 2.1 | 2.0 | 2.0 | 2.1 | 2.1 | 2.2 |
| Other major transfers3 | 1.5 | 0.7 | 0.2 | 0.2 | 0.1 | 0.1 | 0.0 |
| Alternative Payments for Standing Programs4 | -3.4 | -3.5 | -3.7 | -3.9 | -4.1 | -4.3 | -4.5 |
| Total | 58.4 | 60.5 | 62.6 | 65.3 | 68.3 | 71.0 | 73.8 |
| Direct program expenses | |||||||
| Operating expenses | 78.0 | 76.2 | 71.7 | 73.0 | 73.9 | 75.8 | 78.7 |
| Transfer payments | 34.9 | 37.4 | 35.8 | 35.0 | 36.9 | 37.4 | 38.6 |
| Capital amortization | 4.9 | 5.1 | 5.5 | 5.9 | 6.1 | 6.4 | 7.0 |
| Total | 117.7 | 118.7 | 113.0 | 113.9 | 117.0 | 119.6 | 124.2 |
| Total program expenses | 246.4 | 251.2 | 250.2 | 256.9 | 266.5 | 275.2 | 286.3 |
| Per cent of GDP | |||||||
| Major transfers to persons | 3.9 | 3.9 | 3.9 | 3.9 | 3.8 | 3.8 | 3.8 |
| Major transfers to other levels of government | 3.2 | 3.2 | 3.2 | 3.2 | 3.2 | 3.2 | 3.2 |
| Direct program expenses | 6.5 | 6.4 | 5.8 | 5.6 | 5.5 | 5.4 | 5.4 |
| Total program expenses | 13.5 | 13.5 | 13.0 | 12.7 | 12.6 | 12.5 | 12.4 |
| Note: Totals may not add due to rounding. 1 EI benefits include regular EI benefits, sickness, maternity, parental, compassionate care, fishing and work-sharing benefits, and employment benefits and support measures. These represent 90 per cent of total EI program expenses. The remaining EI costs relate mainly to administration and are part of operating expenses. 2 Fiscal arrangements include Equalization, Territorial Formula Financing, the Youth Allowances Recovery and statutory subsidies. 3 Other major transfers to other levels of government include transitional payments; transfer protection payments in 2012–13 and 2013–14; payments under the 2005 Offshore Accords; assistance regarding sales tax harmonization; and other health-related transfers. 4 Alternative Payments for Standing Programs represent a recovery from Quebec of an additional tax point transfer above and beyond the tax point transfer under the Canada Health Transfer and the Canada Social Transfer. |
|||||||
Table 4.2.6 provides an overview of the projections for program expenses by major component, including the measures announced in Economic Action Plan 2014. Program expenses consist of major transfers to persons, major transfers to other levels of government and direct program expenses.
Major transfers to persons increase steadily over the forecast horizon, with spending expected to increase from $72.0 billion in 2013–14 to $88.3 billion in 2018–19.
Major transfers to persons consist of elderly, EI and children's benefits.
Elderly benefits are comprised of Old Age Security, Guaranteed Income Supplement and Allowance payments to qualifying seniors, with Old Age Security payments representing approximately 75 per cent of these expenditures. Elderly benefits are projected to grow from $41.8 billion in 2013–14 to $54.1 billion in 2018–19, or approximately 5.3 per cent per year—faster than nominal GDP, which is projected to grow on average by 4.3 per cent per year. This increase is due to consumer price inflation, to which benefits are fully indexed, and a projected increase in the seniors' population from 5.4 million in 2013–14 to 6.4 million in 2018–19, an average increase of 3.5 per cent per year.
EI benefits are projected to decline by 0.3 per cent to $17.0 billion in 2013–14 based on year-to-date results. Over the remainder of the projection period, EI benefits are projected to grow moderately, averaging 3.7 per cent annually, despite the projected reduction in the number of unemployed. This reflects the expectation that the share of unemployed who receive EI benefits will gradually increase to approach pre-recession levels and that average benefits paid to EI recipients will continue to increase based on growth in average earnings.
Children's benefits, which consist of the Canada Child Tax Benefit and the Universal Child Care Benefit, are projected to increase moderately over the forecast horizon, reflecting growth in the eligible population and adjustments for inflation.
Major transfers to other levels of government are expected to increase over the forecast horizon, from $60.5 billion in 2013–14 to $73.8 billion in 2018–19. As described in the box below, the projections reflect the completion of the legislative renewal of four major transfers to provinces and territories, which is set to take effect in 2014–15.
Major transfers to other levels of government include transfers in support of health and social programs, Equalization and Territorial Formula Financing, and the Gas Tax Fund, among others. The Canada Health Transfer (CHT) is projected to grow from $30.3 billion in 2013–14 to $39.3 billion in 2018–19. Starting in 2017–18, the CHT will grow in line with a three-year moving average of nominal GDP growth, with funding guaranteed to increase by at least 3 per cent per year. The Canada Social Transfer will continue to grow at 3 per cent per year. The Gas Tax Fund is currently $2 billion per year. Starting in 2014–15, these payments will be indexed at 2 per cent per year, with increases applied in $100-million increments.
Economic Action Plan 2014 reaffirms that the legislative renewal of four major federal transfers to provinces and territories is now complete, providing record support in 2014–15 and future years.
The Government continues to recognize the important role major transfers play within the federation in helping to fund Canadian priorities such as health care and education. Economic Action Plan 2014 reaffirms the Government's commitment to continued, predictable and fiscally sustainable growth in the Canada Health Transfer (CHT), the Canada Social Transfer (CST), Equalization and Territorial Formula Financing (TFF).
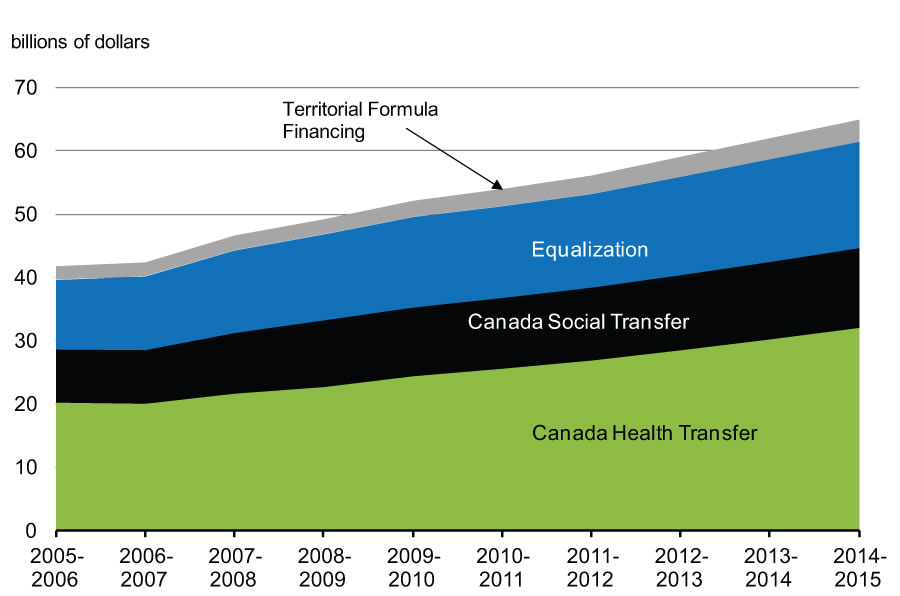
Over the past two years, the Government has taken steps to ensure that the legislative renewal of these four major transfers, set to take effect in 2014–15, provides long-term, growing transfers to provinces and territories. Together, these four transfers will total a record of almost $65 billion in 2014–15, an increase of $3 billion over 2013–14.
Ensuring a strong, publicly funded health care system remains a priority for the Government. This is why federal government support provided through the CHT to provinces and territories will continue to grow to record levels over the coming years, exceeding the current growth rate of provincial health care spending. The CHT will grow at an annual rate of 6 per cent for three more years. Beginning in 2017–18, the CHT will grow in line with nominal GDP with a guaranteed minimum growth rate of 3 per cent per year. The CST will continue to grow at its current rate of 3 per cent annually in 2014–15 and beyond.
Comparable treatment for all Canadians is fundamental to the Government. Through Budget 2007, the Government legislated an equal per capita cash allocation for the CHT and the CST. The CHT equal per capita cash allocation will become effective in fiscal year 2014–15. In order to ensure that no province or territory is unduly affected by this change, Economic Action Plan 2012 put in place protection to ensure that no province or territory experiences a decline in their CHT cash entitlements relative to their 2013–14 cash levels.
Programs that help address fiscal disparities among provinces and territories are important components of Canada's system of fiscal federalism. This is why the Government continues to provide significant and growing support through both the Equalization and TFF programs. As a result of this funding, the Equalization program has grown by 53 per cent, and the TFF program by 70 per cent, over the 2005–06 to 2014–15 period.
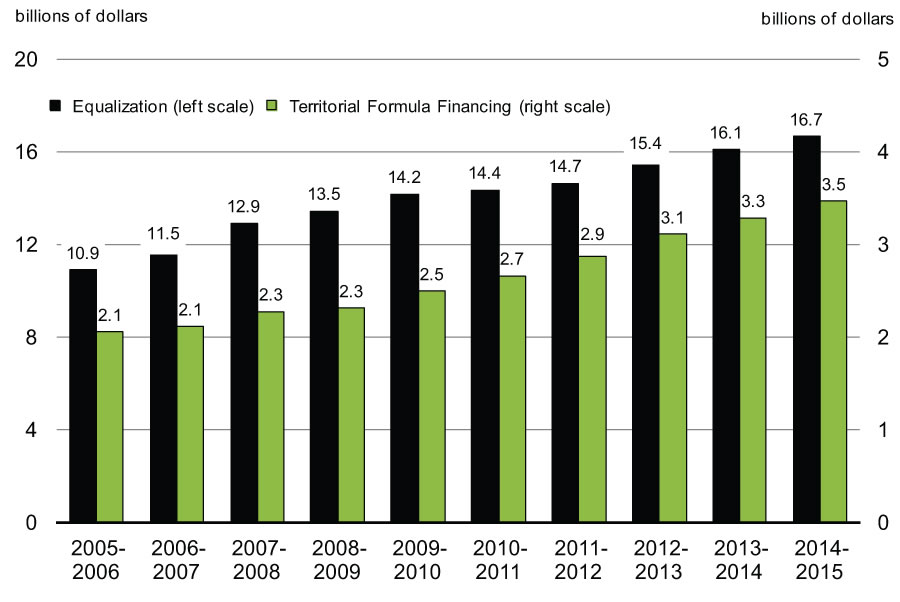 Source: Department of Finance.
In Economic Action Plan 2012, the Government renewed and strengthened the Equalization and TFF programs. The Government confirmed that Equalization would continue to grow in line with Canada's GDP, and TFF would continue to grow based on its current formula. To complete the renewal of these two programs, Economic Action Plan 2013 announced a set of technical improvements to the two programs that were implemented through the Economic Action Plan 2013 Act, No. 1.
The legislative renewal of all four major transfer programs to provinces and territories is now complete. The Equalization and TFF programs are legislated for a five-year period through fiscal year 2018–19, and the CHT and CST will be reviewed in 2024. By setting transfers on a stable and sustainable growth path, the Government is confident that the social programs most valued by Canadians will be safeguarded going forward.
The Government is committed to controlling the spending of federal departments. In fact, direct program expenses have fallen over the last three years, decreasing from $122.8 billion in 2009–10 to $117.7 billion in 2012–13. Moreover, planned restraint in the growth of direct program expenses will result in projected direct program expenses for 2018–19 remaining broadly in line with expenses in 2010–11. Over the forecast horizon, direct program expenses are expected to decrease as a percentage of GDP, reaching a historic low of 5.4 per cent of GDP in 2017–18.
Direct program expenses include operating expenses, transfers administered by departments and capital amortization.
Operating expenses reflect the cost of doing business for more than 100 government departments and agencies. The current projection reflects savings from the operating budget freeze announced in the Speech from the Throne. Operating expenses are broadly stable over the forecast horizon, with spending decreasing from $78.0 billion in 2012–13 to $71.7 billion in 2014–15, then returning to just above last fiscal year's level in 2018–19. The decrease between 2013–14 and 2014–15 is largely attributable to:
- Departmental spending reductions implemented in earlier budgets.
- The proposed transition to equal cost sharing of the Public Service Health Care Plan between the Government as employer and retired federal employees, as discussed in Chapter 4.1.
- Lower projected public service pension and benefit expenses, reflecting better-than-expected investment performance by the Public Sector Pension Investment Board in 2013–14 and higher projected long-term interest rates since Budget 2013.
Transfer payments administered by departments are broadly stable over the forecast horizon, decreasing from $37.4 billion in 2013–14 to $35.8 billion in 2014–15, then returning to roughly this fiscal year's level in 2017–18. The decrease between 2013–14 and 2014–15 is largely the result of one-time costs in 2013–14 associated with federal disaster assistance for the flooding in Alberta.
Amounts for capital expenses are presented on an accrual basis. The amount of capital amortization is expected to increase modestly from $5.1 billion in 2013–14 to $7.0 billion in 2018–19 as a result of new investments and upgrades to existing capital.
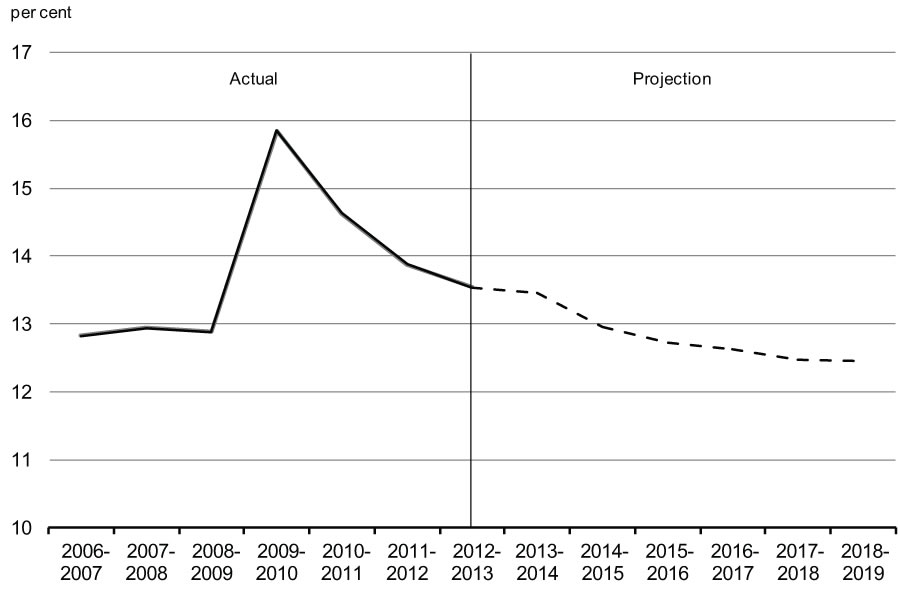
As a share of GDP, program expenses are projected to decline from 13.5 per cent in 2012–13 to 12.4 per cent in 2018–19, which is below its pre-recession level (Chart 4.2.2).
Financial Source/Requirement
The budgetary balance is presented on a full accrual basis of accounting, recording government revenues and expenses when they are earned or incurred, regardless of when the cash is received or paid.
In contrast, the financial source/requirement measures the difference between cash coming in to the Government and cash going out. This measure is affected not only by the budgetary balance but also by the Government's non-budgetary transactions. These include changes in federal employee pension accounts; changes in non-financial assets; investing activities through loans, investments and advances; changes in other financial assets and liabilities; and foreign exchange activities.
| Projection | |||||||
|---|---|---|---|---|---|---|---|
| 2012–2013 | 2013–2014 | 2014–2015 | 2015–2016 | 2016–2017 | 2017–2018 | 2018–2019 | |
| Budgetary balance | -18.9 | -16.6 | -2.9 | 6.4 | 8.1 | 8.1 | 10.3 |
| Non-budgetary transactions | |||||||
| Pensions and other accounts | 7.3 | 4.9 | -0.2 | -0.1 | -1.0 | -1.5 | -1.9 |
| Non-financial assets | -1.0 | -3.0 | -3.3 | -2.7 | -2.4 | -1.9 | -2.1 |
| Loans, investments and advances | |||||||
| Enterprise Crown corporations | -5.8 | -4.7 | -4.2 | -4.3 | -4.1 | -4.3 | -4.0 |
| Insured Mortgage Purchase Program | 3.2 | 41.7 | 9.9 | 0.0 | 0.0 | 0.0 | 0.0 |
| Other | -0.9 | 0.0 | -0.5 | -0.4 | -0.6 | -0.9 | -0.8 |
| Total | -3.5 | 37.0 | 5.2 | -4.7 | -4.7 | -5.2 | -4.8 |
| Other transactions | -14.3 | -2.6 | -0.2 | -0.5 | -0.8 | -0.8 | 0.3 |
| Total | -11.5 | 36.4 | 1.5 | -8.0 | -8.9 | -9.5 | -8.4 |
| Financial source/requirement | -30.5 | 19.8 | -1.4 | -1.5 | -0.7 | -1.4 | 1.8 |
| Note: Totals may not add due to rounding. | |||||||
As shown in Table 4.2.7, with the exception of 2013–14 when a financial source of $19.8 billion is projected, a small financial requirement is generally projected for most of the forecast period. The financial source expected in 2013–14 mainly reflects the repayment of principal on assets maturing under the Insured Mortgage Purchase Program. The small projected financial requirements are generally due to expected cash requirements associated with non-budgetary transactions.
The financial requirement associated with pensions and other accounts is expected to be $0.2 billion in 2014–15. Pensions and other accounts include the activities of the Government of Canada's employee pension plans, as well as those of federally appointed judges and Members of Parliament. Since April 2000, the net amount of contributions less benefit payments related to post-March 2000 service has been invested in capital markets. Contributions and payments pertaining to pre-April 2000 service are recorded in the pension accounts. The Government also sponsors a variety of future benefit plans, such as health care and dental plans and disability and other benefits for war veterans and others.
Financial requirements for non-financial assets mainly reflect the difference between cash outlays for the acquisition of new tangible capital assets and the amortization of capital assets included in the budgetary balance. They also include disposals of tangible capital assets and changes in inventories and prepaid expenses. A net cash requirement of $3.3 billion is estimated for 2014–15.
Loans, investments and advances include the Government's investments in enterprise Crown corporations, such as Canada Mortgage and Housing Corporation (CMHC), Export Development Canada, the Business Development Bank of Canada (BDC) and Farm Credit Canada (FCC). They also include loans, investments and advances to national and provincial governments and international organizations, and for government programs. The requirements for enterprise Crown corporations projected from 2014–15 to 2018–19 reflect the Government's decision in Budget 2007 to meet all the borrowing needs of CMHC, BDC and FCC through its own domestic debt issuance, as well as retained earnings of enterprise Crown corporations. The financial source in the projection period under the Insured Mortgage Purchase Program is due to the winding down in March 2010 of purchases of insured mortgage pools under the plan and the subsequent repayments of principal as the assets under the plan mature.
Other transactions include the payment of tax refunds and other accounts payable, the collection of taxes and other accounts receivable, the conversion of other accrual adjustments included in the budgetary balance into cash, as well as foreign exchange activities.
Risks to the Fiscal Projections
Risks to the economic outlook are the greatest source of uncertainty to the fiscal projections. To help quantify these risks, tables illustrating the sensitivity of the budgetary balance to a number of economic shocks are provided below.
Beyond the economic outlook, there remain upside and downside risks associated with the fiscal projections, as several key drivers of the fiscal outlook are not directly linked to economic variables (such as the relationship between personal income taxes and personal income or the extent to which departments and agencies do not fully use all of the resources appropriated by Parliament).
Sensitivity of the Budgetary Balance to Economic Shocks
Changes in economic assumptions affect the projections for revenues and expenses. The following tables illustrate the sensitivity of the budgetary balance to a number of economic shocks:
- A one-year, 1-percentage-point decrease in real GDP growth driven equally by lower productivity and employment growth.
- A decrease in nominal GDP growth resulting solely from a one-year, 1-percentage-point decrease in the rate of GDP inflation (assuming that the Consumer Price Index (CPI) moves in line with GDP inflation).
- A sustained 100-basis-point increase in all interest rates.
These sensitivities are generalized rules of thumb that assume any decrease in economic activity is proportional across income and expenditure components, and are meant to provide a broad illustration of the impact of economic shocks on the outlook for the budgetary balance. Actual economic shocks may have different fiscal impacts. For example, they may be concentrated in specific sectors of the economy or cause different responses in key economic variables (e.g. GDP inflation and CPI inflation may have different responses to a given shock).
| Year 1 | Year 2 | Year 5 | |
|---|---|---|---|
| Federal revenues | |||
| Tax revenues | |||
| Personal income tax | -2.5 | -2.6 | -3.0 |
| Corporate income tax | -0.3 | -0.4 | -0.5 |
| Goods and Services Tax | -0.3 | -0.4 | -0.4 |
| Other | 0.0 | -0.1 | -0.2 |
| Total tax revenues | -3.1 | -3.5 | -4.1 |
| Employment Insurance premiums | -0.2 | -0.2 | -0.2 |
| Other revenues | 0.0 | 0.0 | -0.1 |
| Total budgetary revenues | -3.2 | -3.7 | -4.4 |
| Federal expenses | |||
| Major transfers to persons | |||
| Elderly benefits | 0.0 | 0.0 | 0.0 |
| Employment Insurance benefits | 0.6 | 0.8 | 0.9 |
| Children's benefits | 0.0 | 0.0 | 0.1 |
| Total | 0.6 | 0.8 | 0.9 |
| Other program expenses | -0.1 | -0.1 | -0.2 |
| Public debt charges | 0.0 | 0.1 | 0.9 |
| Total expenses | 0.5 | 0.8 | 1.6 |
| Budgetary balance | -3.7 | -4.5 | -6.0 |
| Note: Totals may not add due to rounding. | |||
A 1-percentage-point decrease in real GDP growth proportional across income and expenditure components reduces the budgetary balance by $3.7 billion in the first year, $4.5 billion in the second year and $6.0 billion in the fifth year (Table 4.2.8).
- Tax revenues from all sources fall by a total of $3.1 billion in the first year and by $3.5 billion in the second year. Personal income tax revenues decrease as employment and wages and salaries fall. Corporate income tax revenues fall as output and profits decrease. GST revenues decrease as a result of lower consumer spending associated with the fall in employment and personal income.
- EI premium revenues decrease as employment and wages and salaries fall. In order to isolate the direct impact of the economic shock and provide a general overview of the fiscal impacts, the EI premium revenue impacts do not include changes in the premium rate.
- Expenses rise, mainly reflecting higher EI benefits (due to an increase in the number of unemployed) and higher public debt charges (reflecting a higher stock of debt due to the lower budgetary balance). This rise is partially offset by lower other program expenses (as certain programs are tied directly to growth in nominal GDP).
| Year 1 | Year 2 | Year 5 | |
|---|---|---|---|
| Federal revenues | |||
| Tax revenues | |||
| Personal income tax | -2.3 | -1.7 | -1.3 |
| Corporate income tax | -0.3 | -0.4 | -0.5 |
| Goods and Services Tax | -0.4 | -0.4 | -0.4 |
| Other | -0.1 | -0.2 | -0.2 |
| Total tax revenues | -3.0 | -2.6 | -2.4 |
| Employment Insurance premiums | -0.1 | -0.2 | -0.2 |
| Other revenues | -0.1 | -0.1 | -0.1 |
| Total budgetary revenues | -3.2 | -2.9 | -2.8 |
| Federal expenses | |||
| Major transfers to persons | |||
| Elderly benefits | -0.3 | -0.5 | -0.6 |
| Employment Insurance benefits | -0.1 | -0.1 | -0.1 |
| Children's benefits | 0.0 | 0.0 | 0.0 |
| Total | -0.3 | -0.6 | -0.7 |
| Other program expenses | -0.3 | -0.3 | -0.8 |
| Public debt charges | -0.4 | 0.1 | 0.3 |
| Total expenses | -1.1 | -0.8 | -1.2 |
| Budgetary balance | -2.1 | -2.1 | -1.6 |
| Note: Totals may not add due to rounding. | |||
A 1-percentage-point decrease in nominal GDP growth proportional across income and expenditure components resulting solely from lower GDP inflation (assuming that the CPI moves in line with GDP inflation) lowers the budgetary balance by $2.1 billion in the first and second years and by $1.6 billion in the fifth year (Table 4.2.9).
- Lower prices result in lower nominal income and, as a result, personal income tax revenues decrease, reflecting declines in the underlying nominal tax base. As the parameters of the personal income tax system are indexed to inflation and automatically adjust in response to the shock, the fiscal impact is smaller than under the real shock. For the other sources of tax revenue, the negative impacts are similar under the real and nominal GDP shocks.
- EI premium revenues, absent any change in the premium rate, decrease in response to lower earnings. In order to isolate the direct impact of the economic shock and provide a general overview of the fiscal impacts, the EI premium revenue impacts do not include changes in the premium rate.
- Other revenues decline slightly as lower prices lead to lower revenues from the sales of goods and services.
- Partly offsetting lower revenues are the declines in the cost of statutory programs that are indexed to inflation, such as elderly benefit payments and the Canada Child Tax Benefit, and downward pressure on federal program expenses. Payments under these programs are smaller if inflation is lower. In addition, other program expenses are also lower as certain programs are tied directly to growth in nominal GDP.
- Public debt charges decline in the first year due to lower costs associated with Real Return Bonds, then rise due to the higher stock of debt.
| Year 1 | Year 2 | Year 5 | |
|---|---|---|---|
| Federal revenues | 1.3 | 1.7 | 2.4 |
| Federal expenses | 1.6 | 2.7 | 3.9 |
| Budgetary balance | -0.3 | -1.0 | -1.5 |
| Note: Totals may not add due to rounding. | |||
An increase in interest rates decreases the budgetary balance by $0.3 billion in the first year, $1.0 billion in the second year and $1.5 billion in the fifth year (Table 4.2.10). The decline stems entirely from increased expenses associated with public debt charges. The impact on debt charges rises through time as longer-term debt matures and is refinanced at higher rates. Moderating the overall impact is an increase in revenues associated with the increase in the rate of return on the Government's interest-bearing assets, which are recorded as part of other revenues. The impacts of changes in interest rates on public sector pension and benefit expenses are excluded from the sensitivity analysis.