

Annex 1 - Debt Management Strategy for 2014–15
Table of Contents  Previous
 Next
Next
Purpose
The Debt Management Strategy sets out the Government of Canada’s objectives, strategy and plans for the management of its domestic and foreign debt, other financial liabilities and related assets. Borrowing activities support the ongoing refinancing of government debt coming to maturity, the execution of the budget plan and other financial operations of the Government. This includes investing in financial assets needed to establish a prudent liquidity position and borrowing on behalf of some Crown corporations.
The Financial Administration Act requires that the Government table in Parliament, prior to the start of the fiscal year, a report on the anticipated borrowing to be undertaken in the year ahead, including the purposes for which the money will be borrowed.
Highlights of the Federal Debt Management Strategy
- Overall borrowing needs are projected to decline over the medium term as a result of the improving fiscal track and inflows arising from maturing mortgage-backed securities purchased under the Insured Mortgage Purchase Program (IMPP) in 2008 and 2009. During the transition to lower debt issuance, the medium-term debt strategy will continue to be focused on stability and the reduction of financial risk.
- Since 2010–11, the stock of treasury bills has been largely maintained in a range of $160 billion to $180 billion to accommodate IMPP asset maturities of roughly $41 billion in 2013–14 and $10 billion in 2014–15. In accordance with this plan, the stock of treasury bills is projected to fall to around $152 billion at the end of March 2014, and fall a further $22 billion to approximately $130 billion by the end of 2014–15, reducing the Government’s refinancing risk.
- Gross bond issuance is planned to rise by about $7 billion to $95 billion in 2014–15 and then stabilize around $85 billion over the medium term. At the end of 2014–15, the stock of marketable bonds is projected to be about $497 billion.
- As long-term yields remain well below their historical average and demand for long-term bonds remains strong, the debt strategy for 2014–15 maintains issuance of 10- and 30-year bonds in line with 2013–14 levels. In addition, the Government may issue bonds with a maturity of 50 years, subject to favourable market conditions.
- The prudential liquidity plan, announced in Budget 2011, was fully implemented on June 21, 2013, well in advance of the original target date of March 2014. The Government’s overall liquidity levels now cover at least one month of net projected cash flows, including coupon payments and debt refinancing needs.
- The Government lends out excess cash balances on a short-term basis to financial institutions through a competitive auction process held twice each business day. Amendments to the terms and conditions governing the morning auction, effective April 1, 2014, will reduce the Government’s exposure to credit risk.
Context
Demand for Government of Canada Debt Securities Continues to Be Strong
On June 28, 2013, the International Monetary Fund expanded its Currency Composition of Official Foreign Exchange Reserves and began reporting on central bank holdings denominated in Canadian dollars. This reflects the growing importance of Canadian-dollar holdings in the world economy and Canada’s well-earned reputation for responsible fiscal, economic and financial sector management.
Alone among the Group of Seven (G-7) countries, Canada continues to receive the highest possible credit ratings, with a stable outlook, from all the major credit rating agencies.
Medium-Term Debt Strategy
The Government’s medium-term debt strategy is informed by modelling analysis that reflects a wide range of economic and interest rate scenarios drawn from historical experience. The medium-term debt strategy is aimed at gradually transitioning the debt structure towards a more even distribution across maturity sectors (Chart A1.1), while improving cost-risk characteristics and reducing exposure to debt rollover risk.
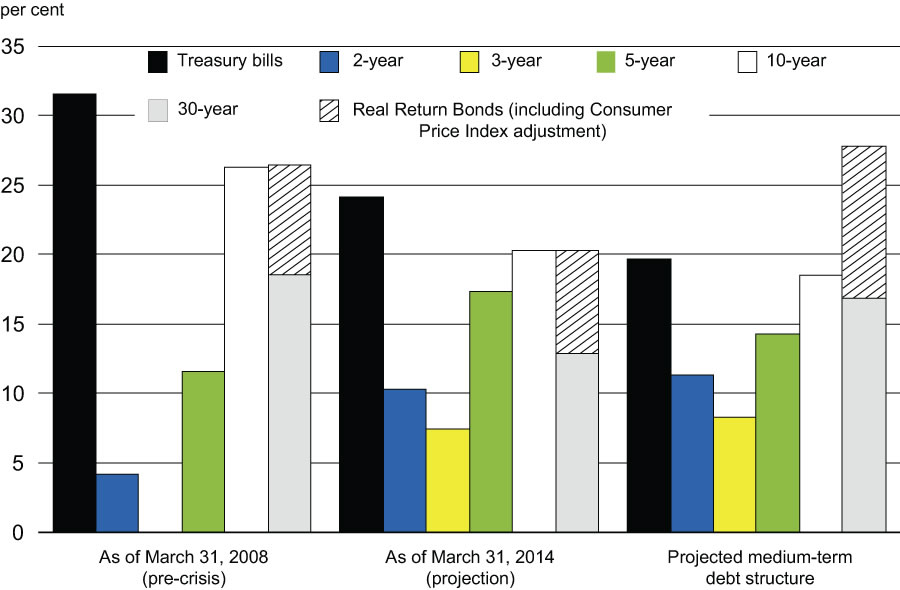
With long-term yields remaining well below their historical average and demand for long-term bonds continuing to be strong, the debt strategy for 2014–15 maintains issuance of 10- and 30-year nominal bonds in line with 2013–14 levels.
Over the next decade, the share of bonds with original terms of 30 years is expected to increase from about 20 per cent to 28 per cent of the stock of market debt outstanding. Similarly, the share of bonds with original terms of 10 years or more is projected to increase from about 41 per cent to around 46 per cent.
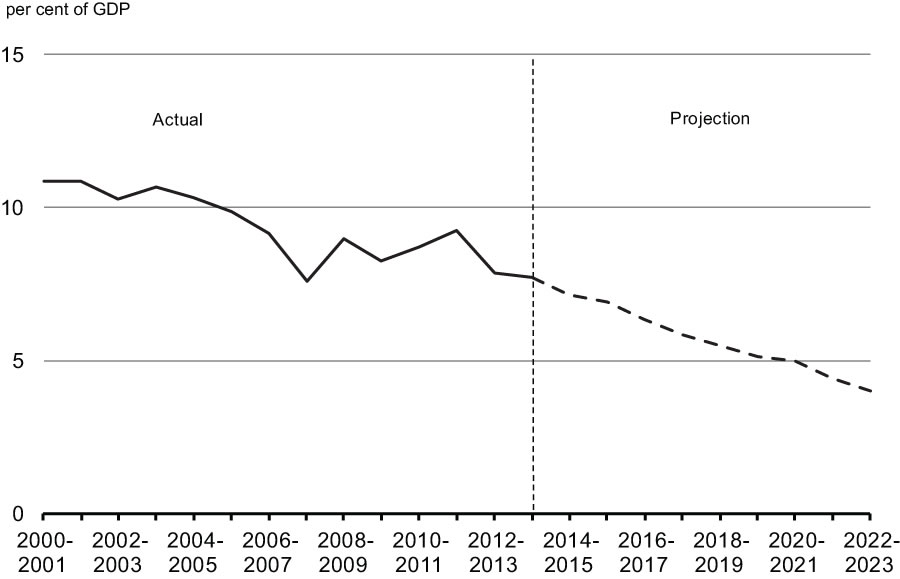
The level of refinancing risk of domestic market debt is projected to decline over the medium term. The net annual refixing amount of domestic market debt as a percentage of gross domestic product (GDP), which measures the amount of all domestic market debt that matures within one year relative to Canada’s GDP, is projected to decline from about 7 per cent in 2014–15 to approximately 4 per cent over1 the coming decade (Chart A1.2).
as a Percentage of GDP Is Expected to Decline
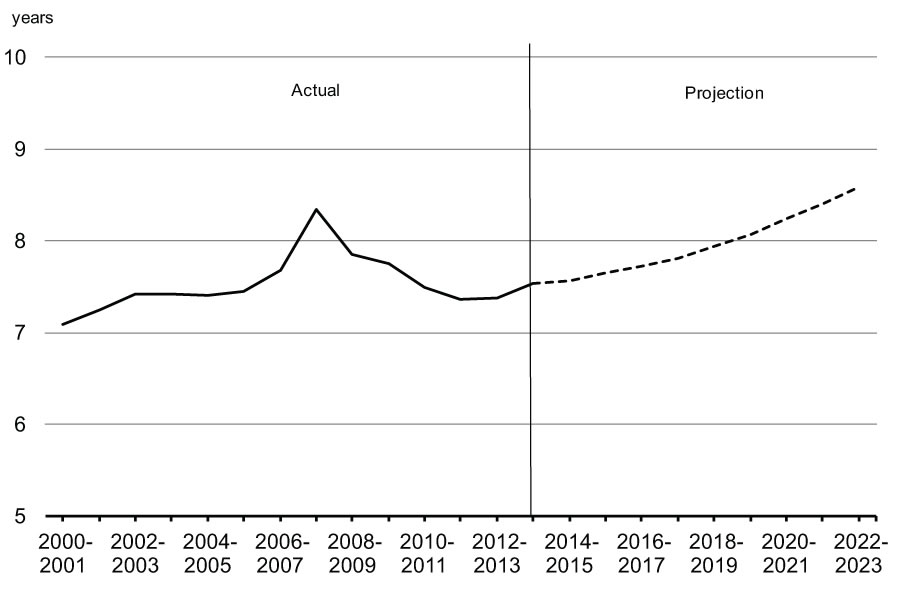
Consistent with this, the average term to maturity of the market debt, net of financial assets, will gradually increase (Chart A1.3).
Will Gradually Increase
Planned Borrowing Activities for 2014–15
Borrowing Authority
For 2014–15, the aggregate borrowing limit requested from the Governor in Council to meet Economic Action Plan 2014 financial requirements and provide a margin for prudence is $270 billion, $30 billion lower than in 2013–14.
Actual borrowings and uses of funds compared with those forecast will be reported in the 2014–15 Debt Management Report, and detailed information on outcomes will be provided in the 2015 Public Accounts of Canada. Both documents will be tabled in Parliament in the Fall of 2015.
Sources of Borrowings
The aggregate principal amount of money required to be borrowed by the Government from financial markets in 2014–15 to finance Economic Action Plan 2014 refinancing needs and other financial requirements is projected to be $232 billion.
Uses of Borrowings
Refinancing Needs
Refinancing needs, projected to be $231 billion during the year, are mainly comprised of $152 billion for maturing treasury bills and $71 billion for maturing bonds.
Financial Source/Requirement
The other main determinant of borrowing needs is the Government’s financial source or requirement. If the Government has a financial source, it can use the source for some of its refinancing needs. If it has a financial requirement, then it must meet that requirement along with its refinancing needs.
The financial source/requirement measures the difference between cash coming into the Government and cash going out. This measure is affected not only by the budgetary balance but also by the Government’s non-budgetary transactions.
Non-budgetary transactions include changes in federal employee pension accounts; changes in non-financial assets; investing activities through loans, investments and advances (including loans to three Crown corporations—the Business Development Bank of Canada, Farm Credit Canada and Canada Mortgage and Housing Corporation); and other transactions (e.g., changes in other financial assets and liabilities, and foreign exchange activities).
For 2014–15, a financial requirement of approximately $1 billion is projected. As the prudential liquidity plan, announced in Budget 2011, was fully implemented on June 21, 2013, the Government is planning no change to the year-end cash balance. As a result, the amount the Government plans to borrow is projected to be equal to the planned uses of borrowings (Table A1.1).
Actual borrowing for the year may differ from the forecast due to uncertainty associated with economic and fiscal projections, the timing of cash transactions and other factors, such as changes in foreign reserve needs and Crown borrowings. Thus, the aggregate borrowing limit of $270 billion requested for 2014–15 includes a margin for prudence, enabling debt management operations to respond to changing circumstances without the need for frequent resubmissions to the Governor in Council.
| Sources of Borrowings | |
|---|---|
| Payable in Canadian currency | |
| Treasury bills1 | 130 |
| Bonds | 95 |
| Retail debt | 2 |
| Total payable in Canadian currency | 226 |
| Payable in foreign currencies | 6 |
| Total cash raised through borrowing activities | 232 |
| Uses of Borrowings | |
| Refinancing needs | |
| Payable in Canadian currency | |
| Treasury bills | 152 |
| Bonds | 71 |
| Of which: | |
| Regular bond buybacks | 0.4 |
| Cash management bond buybacks | 16 |
| Retail debt | 2 |
| Canada Pension Plan bonds and notes | 0 |
| Total payable in Canadian currency | 226 |
| Payable in foreign currencies | 5 |
| Total refinancing needs | 231 |
| Financial source/requirement | |
| Budgetary balance | 3 |
| Non-budgetary transactions | |
| Pension and other accounts | 0 |
| Non-financial assets | 3 |
| Loans, investments and advances | |
| Of which: | |
| Enterprise Crown corporations | 4 |
| Insured Mortgage Purchase Program (net of redemptions) | -10 |
| Other | 1 |
| Total loans, investments and advances | -5 |
| Other transactions2 | 0 |
| Total non-budgetary transactions | -2 |
| Total financial source/requirement | 1 |
| Total uses of borrowings | 232 |
| Other unmatured debt transactions3 | 0 |
| Net Increase or Decrease (-) in Cash | 0 |
| Notes: Numbers may not add due to rounding. A negative sign denotes a financial source.
1 These securities are rolled over, or refinanced, a number of times during the year. This results in a larger number of new issues per year than the stock outstanding at the end of the fiscal year, which is presented in the table. 2 Other transactions primarily comprise the conversion of accrual adjustments into cash, such as tax and other account receivables, provincial and territorial tax collection agreements, tax payables and other liabilities, and changes in foreign exchange accounts. 3 These transactions comprise cross-currency swap revaluation, unamortized discounts on debt issues and obligations related to capital leases and other unmatured debt. |
|
Debt Management Strategy for 2014–15
Objectives
The fundamental objective of debt management is to raise stable and low-cost funding to meet the financial needs of the Government of Canada. An associated objective is to maintain a well-functioning market in Government of Canada securities, which helps to keep debt costs low and stable.
Raising Stable Low-Cost Funding
Achieving stable low-cost funding involves striking a balance between the cost and the risk associated with the debt structure.
Over the medium term, debt management decisions will be taken with a view to keeping debt costs low and maintaining refinancing risks at prudent levels, while reserving sufficient flexibility to adapt to changing circumstances.
Maintaining a Well-Functioning Government Securities Market
Having access to a well-functioning government securities market ensures that funding can be raised efficiently to meet the Government’s needs regardless of economic conditions. To support a liquid and well-functioning Government of Canada securities market, the Government strives to maintain transparent, regular and diversified borrowing programs.
Market Consultations
As in previous years, market participants were consulted periodically in 2013–14 as part of the process to develop and manage the debt strategy. The most recent set of consultations were held in October and November 2013 and were focused on obtaining feedback on a broad range of topics, including the functioning of the Government of Canada treasury bill and bond market, the terms of participation governing Government of Canada securities auctions, and retail investor demand for and access to wholesale Government of Canada securities.
Further details on the subjects of discussion and the views expressed during the consultations can be found on the Bank of Canada website.
Long-Term Yields Remain Below Historical Levels
The Government has pursued a tactical strategy of reallocating short-term issuance towards long-term bonds since 2012–13.1
Although long-term yields have risen from the absolute low levels seen in 2012, they remain well below their historical average. Given the current yield environment and strong demand for long-term bonds, it continues to remain advantageous and prudent for the Government to lock in additional long-term funding.
Thus, in 2014–15, the Government plans to maintain issuance of 10- and 30-year bonds in line with 2013–14 levels. Notably, there will be five 10-year bond operations (the additional auction will be conducted in the first quarter of 2014–15) and three 30-year nominal bond operations (no 30-year auction will be conducted in the second quarter of 2014–15).
Overall, the additional long-term issuance will contribute to a reduction in refinancing risk at a low cost, which is consistent with the key objectives of the medium-term debt strategy.
Additionally, informed by consultations with market participants and ultra-long provincial issuance over the past year, the Government may issue bonds with a maturity of 50 years in 2014–15. Any decision to issue an ultra-long bond would be subject to favourable market conditions and would be communicated by the Government to market participants during the course of the fiscal year.
Composition of Market Debt
The stock of market debt reached a peak of $668 billion in 2012–13 and is projected to fall to about $647 billion at the end of 2013–14. In 2014–15, the stock of market debt is projected to be $648 billion (Table A1.2).
| 2010–11 Actual |
2011–12 Actual |
2012–13 Actual |
2013–14 Projected |
2014–15 Planned |
|
|---|---|---|---|---|---|
| Marketable bonds | 416 | 448 | 469 | 474 | 497 |
| Treasury bills | 163 | 163 | 181 | 152 | 130 |
| Foreign debt | 8 | 11 | 11 | 14 | 15 |
| Retail debt | 10 | 9 | 7 | 6 | 6 |
| Total market debt | 597 | 631 | 668 | 647 | 648 |
| Note: Numbers may not add due to rounding. | |||||
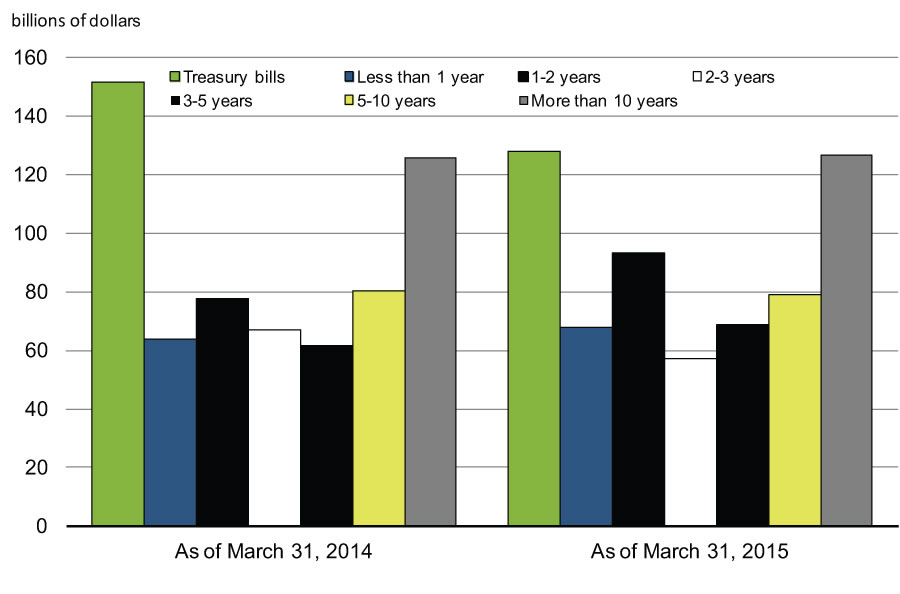
Debt management strategy decisions taken over the past few years have been aimed at gradually transitioning the debt structure towards a more even distribution across maturity sectors to improve its cost-risk characteristics and to reduce exposure to debt rollover risk.
The projected decline in the stock of treasury bills, from about $152 billion at the start of the fiscal year to approximately $130 billion by the end of 2014–15 is an effective means to improve refinancing and rollover risks (Chart A1.4).
Bond Program
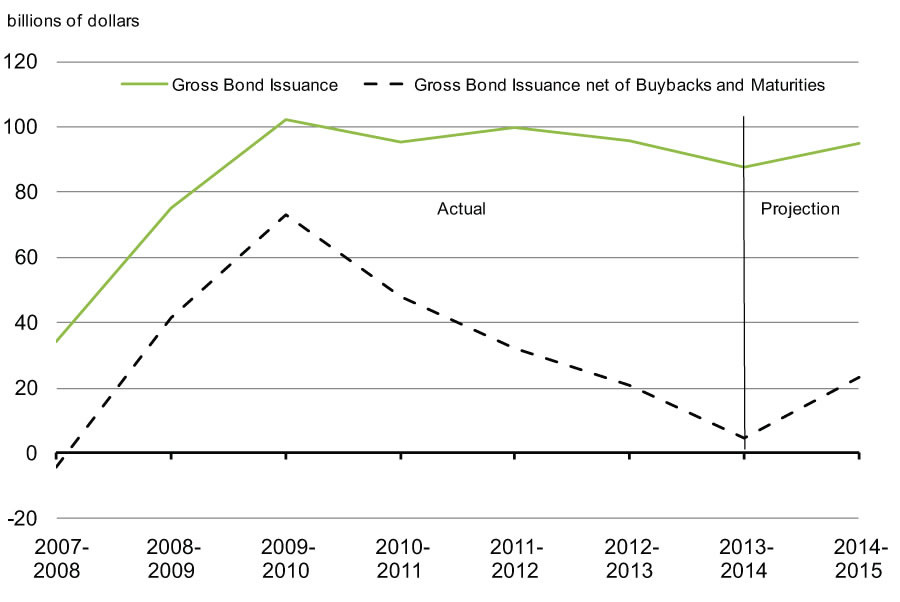
Annual gross bond issuance has ranged between $88 billion and $100 billion since 2010–11. In 2014–15, gross bond issuance is planned to be $95 billion, an increase of about $7 billion from 2013–14 levels (Table A1.3). A portion of this increase in issuance will be allocated to the 2-year sector.
Issuance in the 10- and 30-year sectors will be maintained in line with 2013-14 levels as long-term interest rates remain well below the historical average.
| 2010–11 Actual |
2011–12 Actual |
2012–13 Actual |
2013–14 Projected |
2014–15 Planned |
|
|---|---|---|---|---|---|
| Gross bond issuance | 96 | 100 | 96 | 88 | 95 |
| Buybacks | -4 | -6 | -1.5 | -0.8 | -0.4 |
| Net issuance | 92 | 94 | 94 | 87 | 95 |
| Maturing bonds and adjustments1 | -44 | -62 | -73 | -82 | -71 |
| Change in bond stock | 48 | 32 | 21 | 5 | 23 |
| Note: Numbers may not add due to rounding. 1 Includes cash management bond buybacks and the inflation adjustment for Real Return Bonds. |
|||||
Gross bond issuance net of buybacks and maturities, or the net new supply of bonds, will temporarily increase in 2014–15 (Chart A1.5). Over the medium term, annual gross bond issuance is projected to decline and eventually stabilize around $85 billion as a result of diminishing financial requirements.
Increase in 2014–15
Maturity Dates and Benchmark Bond Target Range Sizes
For 2014–15, no changes to the bond maturity pattern and benchmark target range sizes are planned (Table A1.4). These amounts do not include coupon payments.
| Feb. | Mar. | May | June | Aug. | Sept. | Nov. | Dec. | |
|---|---|---|---|---|---|---|---|---|
| 2-year | 8-12 | 8-12 | 8-12 | 8-12 | ||||
| 3-year | 8-12 | 8-12 | ||||||
| 5-year | 10-13 | 10-13 | ||||||
| 10-year | 10-14 | |||||||
| 30-year | 12-15 | |||||||
| Real Return Bond1 | 10-16 | |||||||
| Total | 16-24 | 10-13 | 8-12 | 10-14 | 16-24 | 10-13 | 8-12 | 10-16 |
| 1 Includes estimate for inflation adjustment. The 30-year nominal bond and Real Return Bond do not mature in the same year. | ||||||||
Bond Auction Schedule
In 2014–15, there will be quarterly auctions of 2-, 3-, 5- and 10-year bonds and Real Return Bonds.
Five 10-year bond auctions will occur, with the additional 10-year auction being held in the first quarter of 2014–15. Three 30-year nominal bond auctions will occur—one in each of the first, third and fourth quarters of 2014–15. The order of bond auctions within each quarter may be adjusted to support the borrowing program, and there may be multiple auctions of the same bonds in some quarters. The dates of each auction will continue to be announced through the Quarterly Bond Schedule that is published on the Bank of Canada website prior to the start of each quarter.
Bond Buyback Programs
Two types of bond buyback operations will be conducted in 2014–15: regular bond buybacks on a switch basis and cash management bond buybacks.
Regular Bond Buyback Operations
Buyback operations on a switch basis will be continued in the 30-year sector and will be conducted in the second quarter of 2014–15. No regular buyback operations on a cash basis are planned for 2014–15.
Cash Management Bond Buyback Operations
Weekly cash management bond buyback operations will be continued in 2014–15. The cash management bond buyback program helps to manage government cash requirements by reducing the high levels of cash balances needed ahead of large bond maturities.
Treasury Bill Program
Since 2010–11, the stock of treasury bills has been largely maintained in a range of $160 billion to $180 billion to accommodate IMPP asset maturities of roughly $41 billion in 2013–14 and $10 billion in 2014–15.
In accordance with this plan, the stock of treasury bills is projected to fall to about $152 billion at the end of March 2014, and fall a further $22 billion to approximately $130 billion by the end of 2014–15.
Over the medium term, the stock of treasury bills will be managed down to eventually represent about 20 per cent of total market debt. In 2014–15, the share of treasury bills is projected to fall from about 24 per cent to about 21 per cent. This decline is consistent with the medium-term debt strategy and maintains issuance stability in the bond program.
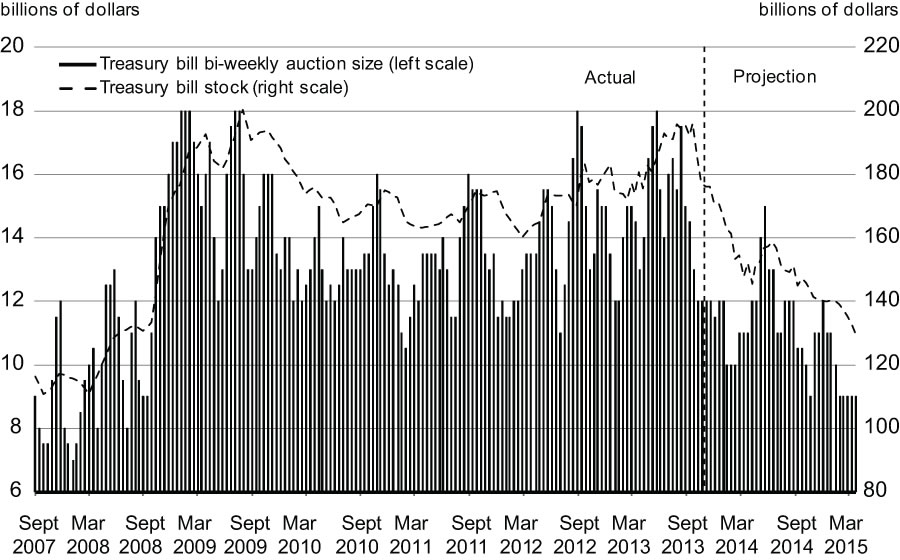
Bi-weekly issuance of 3-, 6- and 12-month maturities will be continued in 2014–15, with bi-weekly auction sizes projected to be largely in the $9 billion to $12 billion range (Chart A1.6).
Cash management bills (i.e., short-dated treasury bills) help manage government cash requirements in an efficient manner. These instruments will also continue to be used in 2014–15.
Prudential Liquidity and Cash Management
Prudential Liquidity
The Government holds liquid financial assets in the form of domestic cash deposits and foreign exchange reserves to safeguard its ability to meet payment obligations in situations where normal access to funding markets may be disrupted or delayed. This also supports investor confidence in Canadian government debt.
The prudential liquidity plan, announced in Budget 2011, was fully implemented on June 21, 2013, well in advance of the original target date of March 2014. The Government’s overall liquidity levels now cover at least one month of net projected cash flows, including coupon payments and debt refinancing needs.
Cash Management
The Bank of Canada, as fiscal agent for the Government, manages the Receiver General Consolidated Revenue Fund, from which the balances required for the Government’s day-to-day operations are drawn. The core objective of cash management is to ensure that the Government has sufficient cash available at all times to meet its operating requirements.
Cash consists of moneys on deposit with the Bank of Canada, chartered banks and other financial institutions. Cash with the Bank of Canada includes operational balances and balances held for the prudential liquidity plan. Receiver General cash balances in 2014–15 are projected to be in line with 2013–14 levels (Table A1.5).
| 2011–12 Actual |
2012–13 Actual |
2013–14 Projected |
2014–15 Planned |
|
|---|---|---|---|---|
| Callable deposits with Bank of Canada | 4 | 15 | 20 | 20 |
| Balances with Bank of Canada | 2 | 3 | 2 | 2 |
| Balances with financial institutions | 7 | 6 | 4 | 4 |
| Total | 13 | 24 | 26 | 26 |
| Note: Numbers may not add due to rounding. | ||||
The Government lends out excess cash balances on a short-term basis to financial institutions through a competitive auction process held twice each business day.
Amendments to the terms and conditions governing the morning auction, effective April 1, 2014, will reduce the Government’s exposure to credit risk. These changes include amendments to participant eligibility requirements, moving all transactions to a repo framework (i.e., fully secured reverse repurchase agreements), and ensuring eligible securities closely align with those accepted under the Bank of Canada’s Standing Liquidity Facility. These changes will also reduce reliance on credit rating agency ratings for funds management activities, in accordance with G-20 Leaders’ call for accelerated progress in this area. Further information can be found on the Bank of Canada website.
Periodic updates on the liquidity position are available in The Fiscal Monitor.
Retail Debt
Around 2.5 million Canadians hold Canada Savings Bonds (CSBs) or Canada Premium Bonds (CPBs). CSBs are offered exclusively through the Payroll Savings Program while CPBs are available for sale through financial institutions and dealers. Investors repeatedly cite the safety and security of CSBs and CPBs as key attributes, with payroll deduction providing a convenient, simple and free automatic savings option.
Further information on the Retail Debt Program is available on the Canada Savings Bonds website.
Foreign Currency Funding
The purpose of the Exchange Fund Account (EFA) is to aid in the control and protection of the external value of the Canadian dollar. Assets held in the EFA are managed to provide foreign currency liquidity, support market confidence, and promote orderly conditions for the Canadian dollar in the foreign exchange markets, if required. Liquid foreign exchange reserves are maintained at a level at or above 3 per cent of nominal GDP.
The Government plans to fund the purchase of foreign currency assets through multiple sources. These include a short-term US-dollar paper program (Canada bills), international bond issues, purchases and sales of Canadian dollars in foreign exchange markets, and cross-currency swaps involving the exchange of domestic liabilities for foreign-currency-denominated liabilities. In addition, the Government successfully launched a new medium-term note program in November 2013, which provides increased funding flexibility.
The debt management strategy for 2014–15 assumes that all foreign liabilities maturing during the year will be refinanced. The actual amount of gross foreign currency funding may vary from this assumption, depending on market conditions and the Government’s foreign currency needs. The mix of funding sources used to finance the reserves in 2014–15 will depend on a number of considerations, including relative cost, market conditions and the objective of maintaining a prudent foreign-currency-denominated debt maturity structure.
Further information on foreign currency funding and the foreign reserve assets is available in the Report on the Management of Canada’s Official International Reserves and in The Fiscal Monitor.