

Chapter 2: Economic Developments and Prospects
Table of Contents  Previous
 Next
Next
Highlights
- The Canadian economy has experienced one of the best performances among the Group of Seven (G-7) countries over the recovery in terms of both output and job creation.
- Over 1 million more Canadians are working now than at the end of the recession, the strongest job growth among G-7 countries over this period.
- Business investment has fuelled growth over the recovery and Canada’s business investment performance has been by far the strongest in the G-7 during the recession and recovery.
- However, Canada is not immune to developments from beyond our borders, which have translated into weak export markets, lower commodity prices and low inflation since early 2012.
- Private sector economists, surveyed by the Department of Finance in early December 2013, expect real gross domestic product (GDP) growth to strengthen and economy-wide price inflation to pick up in 2014 and 2015, resulting in an improvement in nominal GDP growth from its modest pace of 3.2 per cent in 2013.
- Private sector economists agree that risks to the outlook remain tilted to the downside but have lessened since the November 2013 Update of Economic and Fiscal Projections, reflecting recent positive developments in the United States.
- For fiscal planning purposes, the Government is maintaining the downward adjustment of the private sector forecast for nominal GDP to reflect continued risks to the global economic outlook.
Notes: This chapter incorporates data available up to and including February 7, 2014, unless otherwise indicated. All rates are reported at annual rates unless otherwise noted.
Introduction
Almost five years into the recovery from the global recession, the external economic environment remains fragile. Global economic growth remained weak in 2013, primarily due to slower growth in emerging economies. Growth in advanced economies showed signs of stabilizing, but at a relatively modest pace. While recent economic developments in the U.S. have been more encouraging, growth in the euro area remains weak and financial market volatility has risen among some emerging economies.
Despite this external weakness, the Canadian economy has continued to expand, albeit at a modest pace, enjoying one of the best performances among G-7 countries over the recovery. Since the end of the global recession, over 1 million net new jobs have been created in Canada, with economic growth driven by solid private domestic demand.
However, Canada is not immune to external economic developments. Canada’s economic growth has been restrained by weak export markets, declines in crude oil and other commodity prices, as well as sustained softness in domestic inflation since early 2012. Together, these factors have restrained the growth of nominal GDP, which is the broadest single measure of the tax base.
Looking forward, private sector economists expect real GDP growth to pick up this year and next, reflecting stronger global demand, especially from the United States. This, together with projected increases in inflation from current low levels, is expected to result in a notable improvement in nominal GDP growth by 2015.
This chapter reviews major global and Canadian economic developments over the past year, presents the December 2013 average private sector economic forecast that forms the basis for the fiscal projections presented in Economic Action Plan 2014, and discusses the risks and uncertainties surrounding this economic forecast.
Global Economic Developments and Outlook
Global growth remained weak in 2013, largely reflecting a deceleration in growth among emerging economies, stemming from tighter financial conditions, while growth in advanced economies showed signs of stabilizing at a relatively modest pace. However, recent economic developments have been more positive, particularly for the U.S., with the International Monetary Fund (IMF) expecting a pick-up in global growth this year.
United States
U.S. economic growth has shown signs of stronger underlying momentum. Real GDP growth strengthened to an average of 3.3 per cent over the final three quarters of 2013, following an average increase of just 0.6 per cent in the preceding two quarters. Indeed, private demand in the U.S. has firmed through 2013, with growth in household and business spending picking up to 2.9 per cent in the final quarter of the year.
The strength in private demand has come in spite of considerable uncertainty over U.S. fiscal policy. Last Fall, the U.S. Congress failed to reach agreements on both renewing federal spending authority, culminating in a partial shutdown of federal government operations in early October, and on raising the debt ceiling for the U.S. federal government, which raised the possibility of an unprecedented U.S. sovereign default. An agreement was ultimately reached on October 16 to temporarily extend spending authority and suspend the debt ceiling until February 7, 2014.
A subsequent bi-partisan accord reached this past December extended the government’s spending authority until September 2015. Although this removed some of the uncertainty surrounding U.S. fiscal policy, the current agreement to suspend the federal debt ceiling expired on February 7. As a result, it is critical that legislators reach an agreement on raising the debt ceiling, as the U.S. Treasury has stated it will only be able to use extraordinary measures to postpone reaching the ceiling until sometime in late February. Moreover, U.S. authorities have yet to reach an agreement to reduce the debt burden, which will help to ensure that country’s longer-term fiscal sustainability.
Planned U.S. federal deficit reduction measures should weigh less on U.S. economic activity this year. Growth in the U.S. will also be supported by monetary policy, which is expected to remain highly accommodative over the medium term. The Federal Reserve began to reduce its purchases of U.S. treasury securities and mortgage-backed securities in January and February and announced that, if economic conditions continue to improve, it will likely reduce them further in coming months. However, the Federal Reserve also strengthened its forward guidance, stating that it expects to maintain short-term interest rates close to the lower bound well beyond the point at which the unemployment rate falls to 6.5 per cent.
For 2014, growth in the U.S. is expected to pick up to 2.7 per cent from 1.9 per cent in 2013, with quarterly growth gradually rising to 3 per cent over the course of 2014, and to further strengthen to 3.1 per cent in 2015. Growth over the near term is expected to be driven by strong business investment, continued recovery in the housing market, a pick-up in consumer spending and a further easing of fiscal headwinds (Chart 2.1). This outlook is broadly unchanged from that presented in the November 2013 Update of Economic and Fiscal Projections (Fall Update).
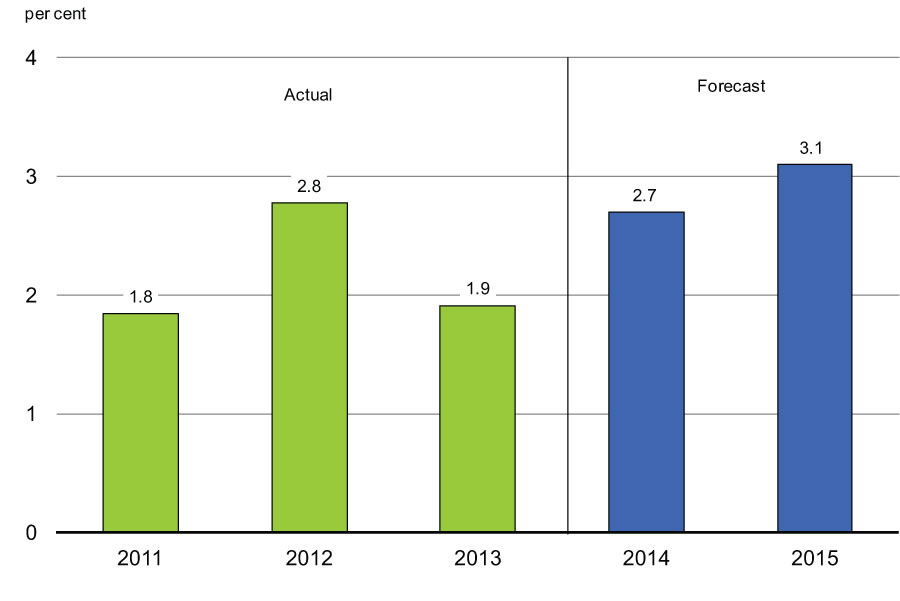
Sources: U.S. Bureau of Economic Analysis; Department of Finance December 2013 survey of private sector economists.
Europe
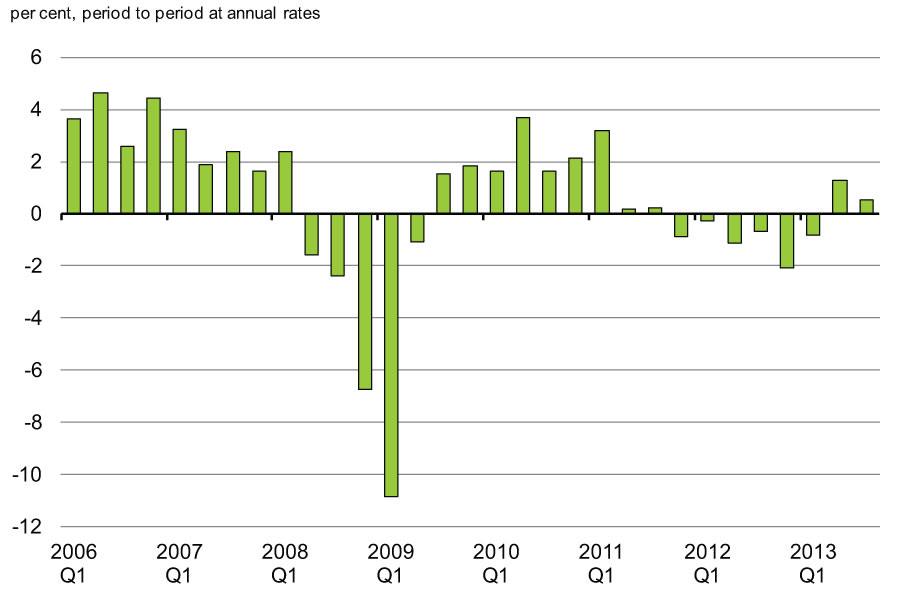
In Europe, growth prospects have remained less promising. While the euro area emerged from a year-and-a-half-long recession in the second quarter of 2013 (Chart 2.2), the recovery has been tepid, with growth averaging just 0.9 per cent over the second and third quarters of 2013. Moreover, disparities remain within the euro area: while the German economy has grown moderately over the past year, growth elsewhere either remains weak or negative. As well, inflation in the euro area has trended down since late 2011 and remains subdued. Overall, economic growth is still being constrained by record high unemployment and restrictive lending to the private sector, especially in more fragile economies.
The European Central Bank (ECB) has taken some steps to boost growth, cutting its policy rate twice in 2013, bringing the benchmark rate to a record low of 0.25 per cent and signalling last July that it would keep its policy rate at low levels for “an extended period of time.”
A key source of weakness in the euro area has been the ongoing uncertainty about the health of euro-area banks. Some progress has been made, with the ECB set to become the single banking supervisor in the Fall of 2014. The ECB has also started to conduct a comprehensive assessment of euro-area banks. However, more work is needed to establish a credible banking union and resolution mechanism for failing banks.
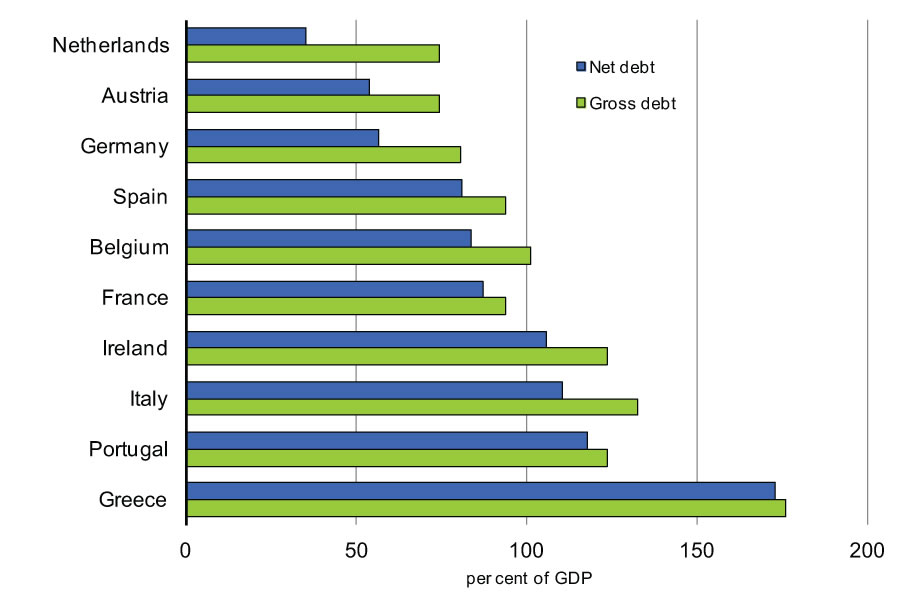
Moreover, while European countries with high debt levels have made some progress in reducing their fiscal deficits, further progress is needed to put sovereign debt burdens on a sustainable path (Chart 2.3). With these challenges in mind, the IMF expects that growth in the euro area will remain tepid, with growth of only 1.0 per cent in 2014 and 1.4 per cent in 2015.
Outside continental Europe, developments in the United Kingdom have been encouraging with stronger private domestic demand contributing to a pick-up in economic growth in 2013. The IMF expects U.K. growth to continue to strengthen in 2014 to 2.4 per cent from 1.7 per cent in 2013.
Japan
Japan has continued to recover from its mid-2012 recession, with growth supported by fiscal stimulus and highly accommodative monetary policy. However, growth softened to 1.1 per cent in the third quarter of 2013, following quarterly growth averaging 4 per cent in the first half of the year, reflecting both weaker exports and a moderation in private domestic demand growth. Looking ahead, the IMF projects GDP growth in Japan of 1.7 per cent in 2014, decelerating to 1.0 per cent in 2015.
Emerging Economies
In emerging economies, growth eased further in 2013. This appears to reflect both cyclical slowing and weaker trend growth, including the effects of the run-up in global long-term interest rates that started in the Spring of 2013 and triggered a general repricing of risk. More challenging access to capital for some emerging economies in turn led to a greater focus on existing vulnerabilities, such as high inflation, fiscal and current account deficits and financial stability concerns. The consequence has been exchange rate depreciation, rising interest rates and falling equity prices, particularly for India, Indonesia, Turkey, South Africa and Brazil. Many of these countries need to address vulnerabilities through structural reforms, which should translate into sustainably stronger growth over the longer run.
In China, real GDP grew by 7.7 per cent in 2013, the same pace as in 2012. Going forward, the IMF expects growth in China to ease to 7.3 per cent by 2015. This would be its slowest pace of growth since 1990, and well below the average annual growth rate of about 10 per cent recorded over the decade preceding the global recession. The IMF outlook is consistent with Chinese authorities’ stated desire to safeguard financial stability and shift the economy to a more balanced and sustainable growth path by promoting domestic consumption and relying less on investment and exports.
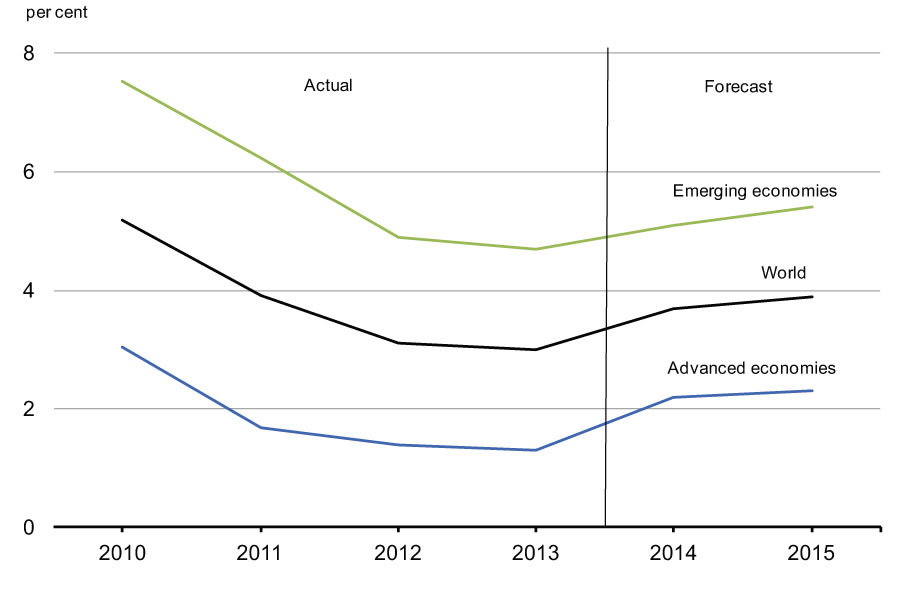
Overall, the IMF global outlook has changed little since the Fall Update. The IMF expects global growth to accelerate to 3.7 per cent in 2014 from 3.0 per cent in 2013, reflecting a pick-up in growth across both advanced and emerging economies (Chart 2.4).
Diversifying Canada’s Trading Partnerships
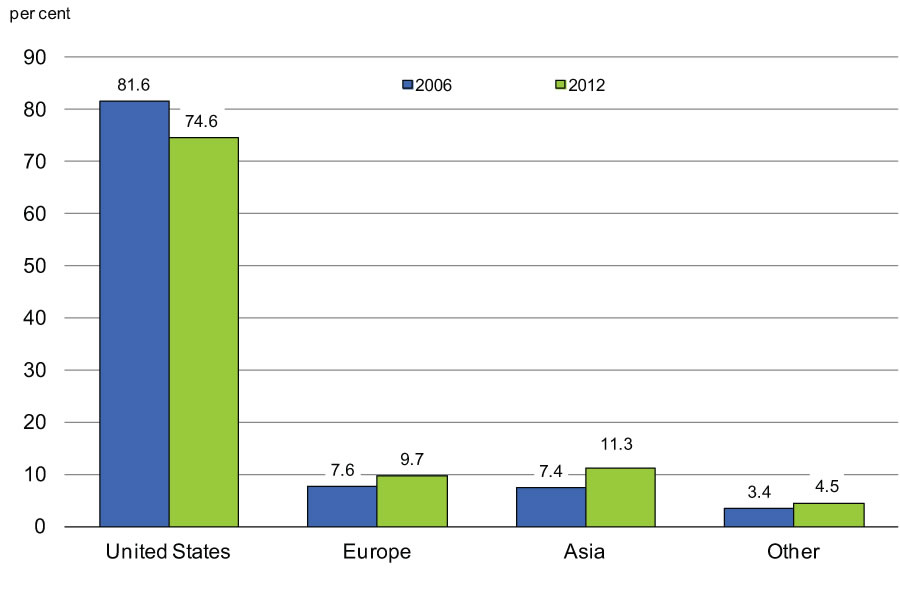
Despite the recent deceleration of growth in emerging economies, it is clear that they will remain the engine of global growth. Along with ongoing uncertainty over the global economic outlook, this underscores the need for Canada to diversify its export markets. In 2012, 75 per cent of Canada’s goods exports were destined for the U.S., down from 82 per cent in 2006. Canada continues to increase exports to Europe, emerging Asia and other markets (Chart 2.5). In order to continue to reduce Canada’s dependency on the U.S., take advantage of the world’s fastest growing economies and ensure fair prices for our commodity exports, Canada will need to continue to develop export markets in regions such as Europe, Asia and Latin America.
In October 2013, Canada and the European Union (EU) reached an agreement in principle on a comprehensive trade agreement that will significantly boost trade and investment ties, creating jobs and opportunities for Canadians. The Agreement will provide Canada with greater market access to the EU. As a result, Canada will be one of only a few developed economies to have preferential access to the world’s two largest markets, the EU and the United States, which together represent more than 800 million consumers and almost half of global GDP.
Financial Market Developments
As of early February, most advanced economy equity market indices were little changed from their levels at the time of the Fall Update, following a period of notable improvement earlier in 2013 (Chart 2.6). Markets had risen modestly through late January 2014 on expectations of stronger economic growth, particularly in the United States. However, these gains were largely reversed in late January, as increased capital outflows and rising concerns over financial market vulnerability among some emerging economies added to uncertainty in global financial markets.
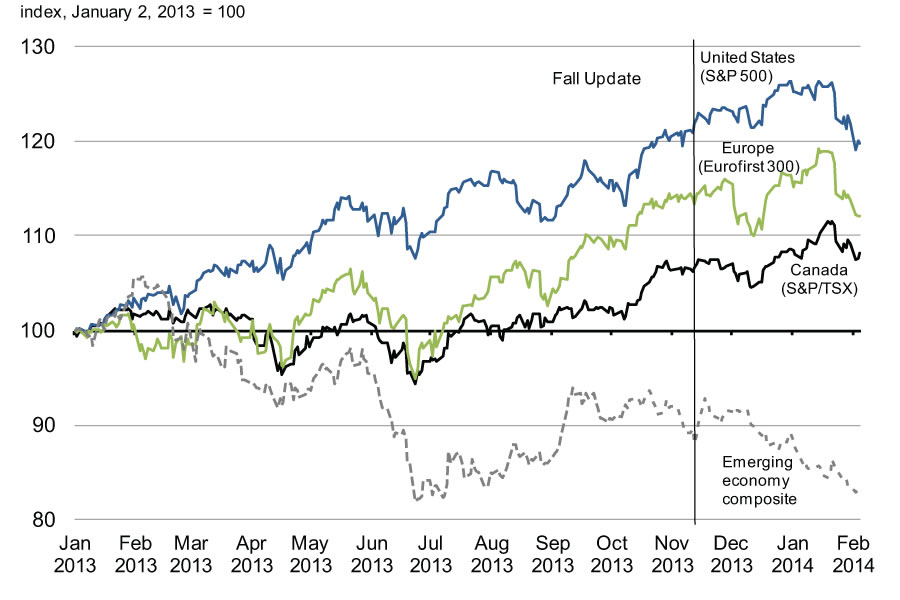
Source: Haver Analytics.
Improving U.S. economic prospects boosted bond yields between the time of the Fall Update and early January. More recently, however, increased financial market uncertainty has been reflected in a flight to quality to the U.S. and other advanced economies, including Canada, resulting in lower bond yields in these countries (Chart 2.7).
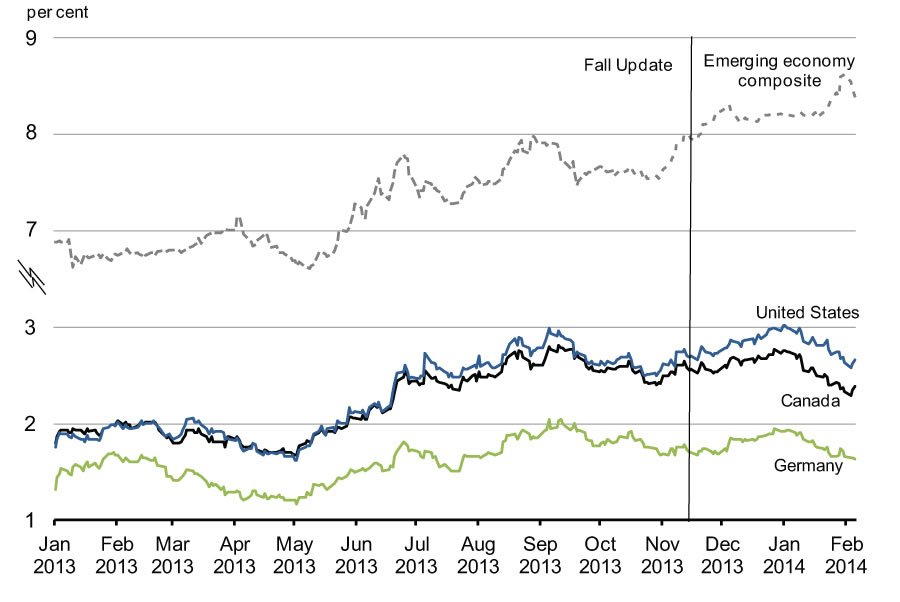
Sources: Bloomberg; Thomson Reuters.
Commodity Prices
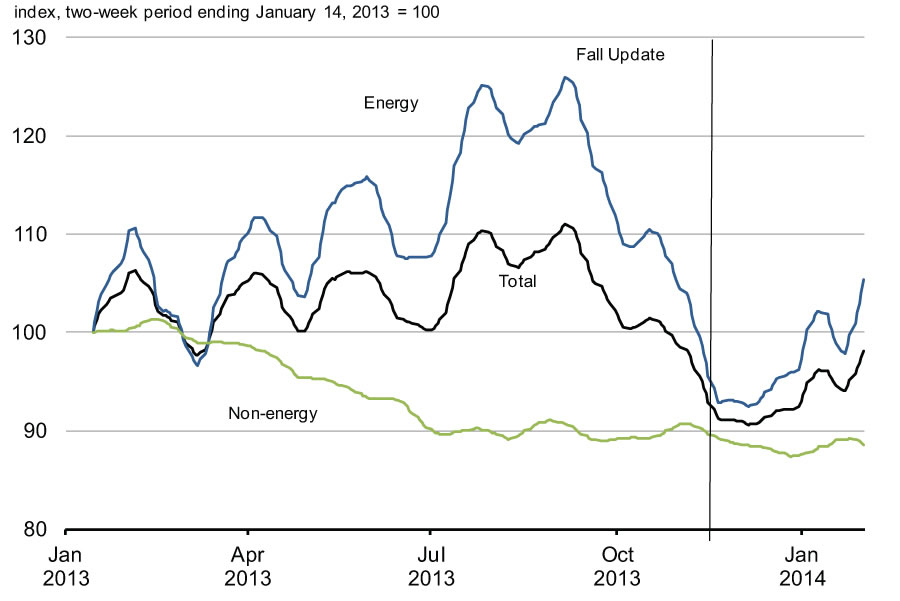
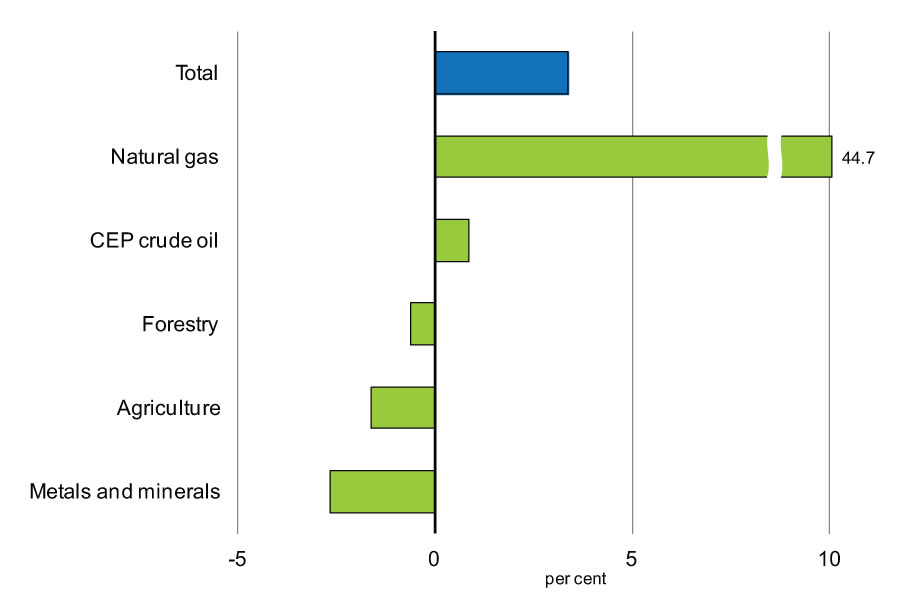
Overall, commodity prices are up slightly since the Fall Update. Non-energy commodity prices have continued to decline, with base metal prices dampened by ongoing weakness in emerging economies, while agriculture prices have also lost ground reflecting above-normal harvest volumes in many producing countries, including Canada (Chart 2.8). While natural gas prices have risen significantly since the Fall Update, this has a much more modest impact on the overall commodity price index than in the past due to the declining share of natural gas in Canadian commodity production and exports.
Crude oil represents about half of Canada’s overall commodity production, and is now Canada’s single most important export. Canadian crude oil prices have remained volatile over the past year and declined markedly over the second half of 2013. This decline reflected several refinery shutdowns and continued growth in both Canadian and U.S. crude oil production. As a result, by December 2013, the discount for Canadian crude oil relative to the global Brent benchmark had risen to its highest level on record on a monthly basis. While this gap narrowed slightly in January, it remains well above its average over the 2005-2010 period (Chart 2.9).
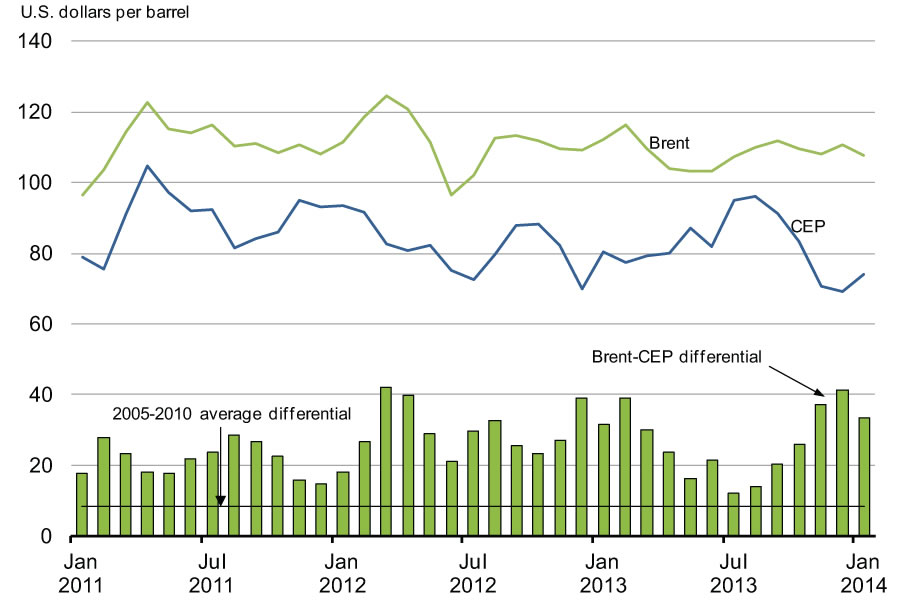
Sources: Commodity Research Bureau; Natural Resources Canada; Department of Finance calculations.
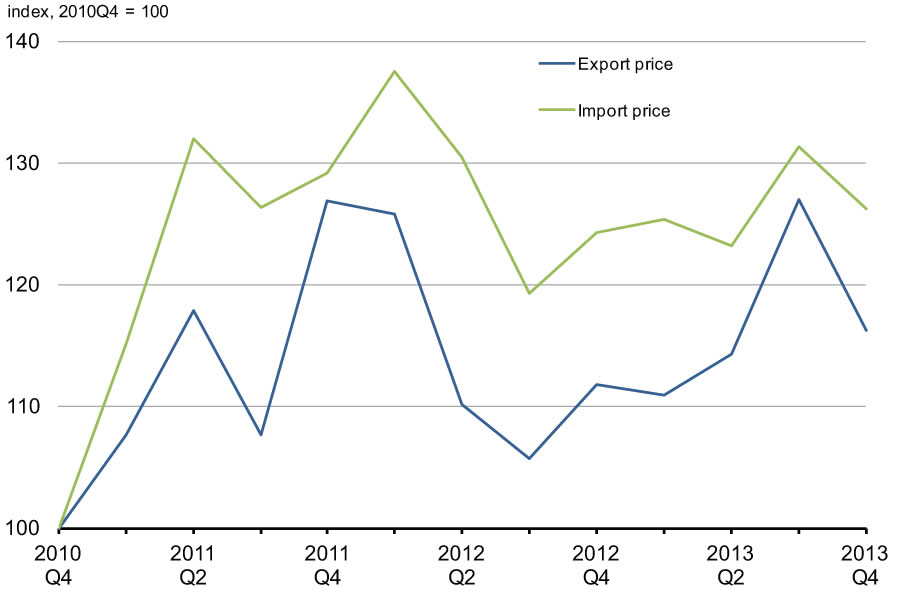
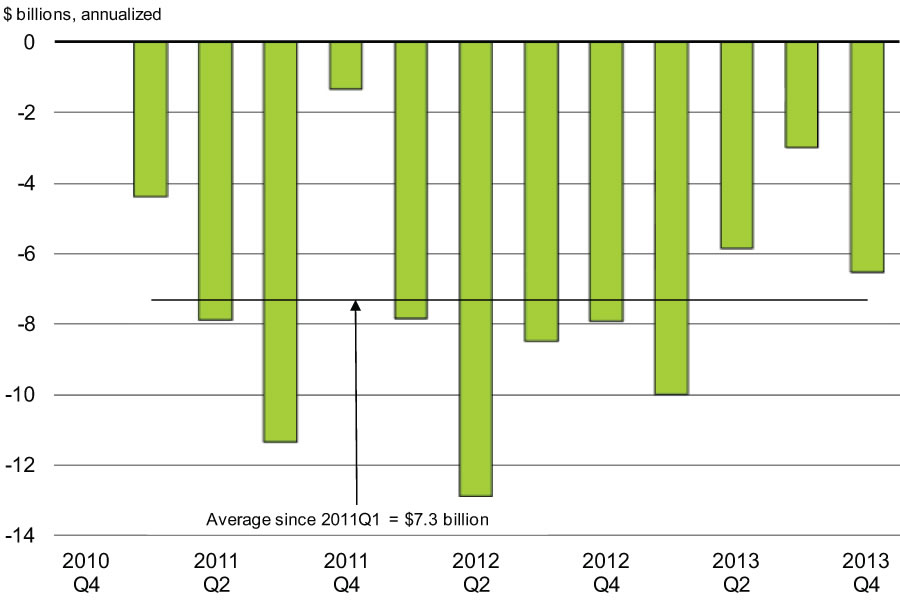
Low Canadian crude oil export prices relative to import prices, which tend to follow global benchmarks, have significantly dampened export values since the end of 2010. As shown in Chart 2.10, if export prices for Canadian crude oil had kept pace with those for imported oil from early 2011 through the end of 2013, the value of Canada’s crude oil exports would have been approximately $7.3 billion higher per year, on average, over the period. This represents a cumulative loss of $21.9 billion, or 1 per cent of nominal GDP. While this impact eased in mid-2013, recent benchmark price data point to reduced crude oil export values once again in the fourth quarter of 2013.
Going forward, anticipated continued increases in U.S. and Canadian oil production, along with pipeline capacity constraints, mean that Canadian crude oil producers will likely face prices that are both more volatile and lower than those prevailing globally. In order to obtain fair market value for Canadian crude oil, additional transportation infrastructure is required to reach global markets.
For natural gas, the lack of access to global markets has had an even more significant negative impact in recent years. Since 2008, strong growth in natural gas production from shale formations in the United States, combined with limited export capacity from liquefied natural gas facilities, has pushed North American prices far below those prevailing in Asia and Europe (Chart 2.11). Low North American prices have in turn dampened Canadian natural gas exploration and drilling activity, resulting in markedly lower production and exports. With both export volumes and prices falling, the value of Canadian natural gas exports—which are entirely destined for the United States—declined by two-thirds between 2008 and 2013.
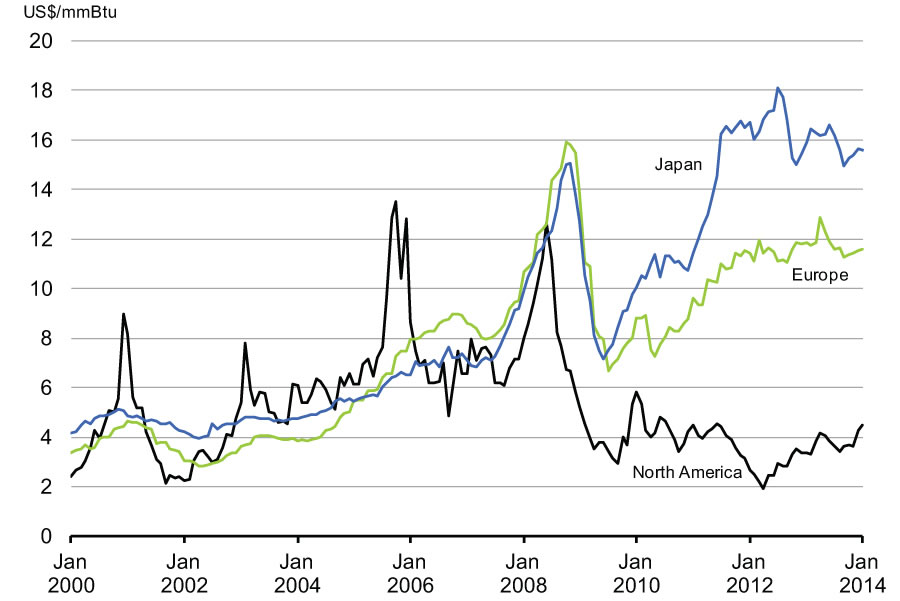
Source: World Bank.
There is a need for improved infrastructure to gain access to global markets and reduce Canada’s dependence on the North American market for the export of energy commodities.
Canada’s Recent Economic Performance
Despite these challenges, the Canadian economy has been resilient. Canada’s economic performance has been reflected in a solid job creation performance since the beginning of the recovery, with over 1 million more Canadians working today than at the time of the trough in employment in July 2009—an increase of 6.3 per cent. Canada has outperformed all other G-7 economies in job creation over this period (Chart 2.12). Solid employment growth lowered the unemployment rate to 7.0 per cent in January 2014.
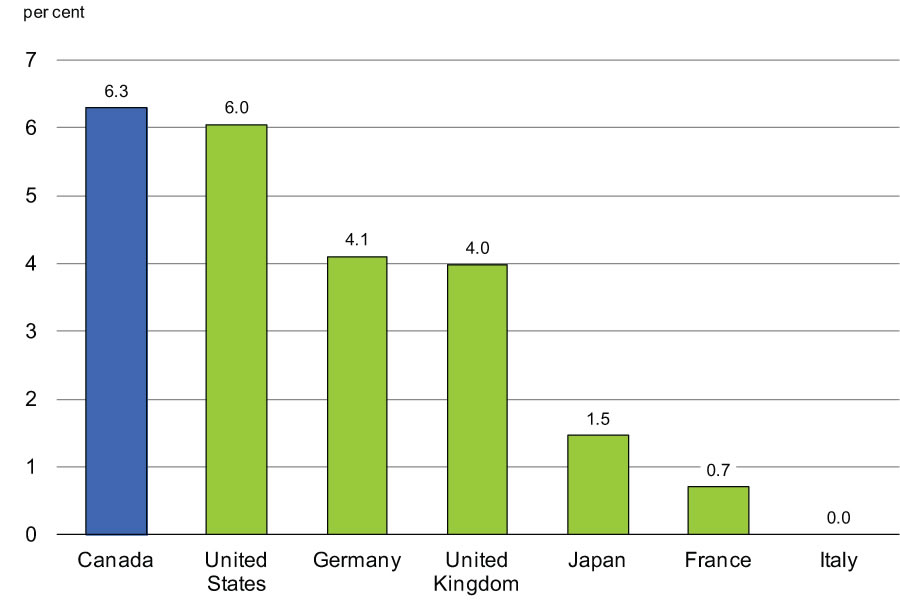
Sources: Haver Analytics; Department of Finance calculations.
Over the recovery, over 85 per cent of all jobs created have been full-time positions with more than two-thirds in high-wage industries (Chart 2.13). Encouragingly, the private sector has been the main source of job creation since the end of the recession, an essential condition for a sustained recovery and expansion, generating 80 per cent of all new jobs since July 2009.
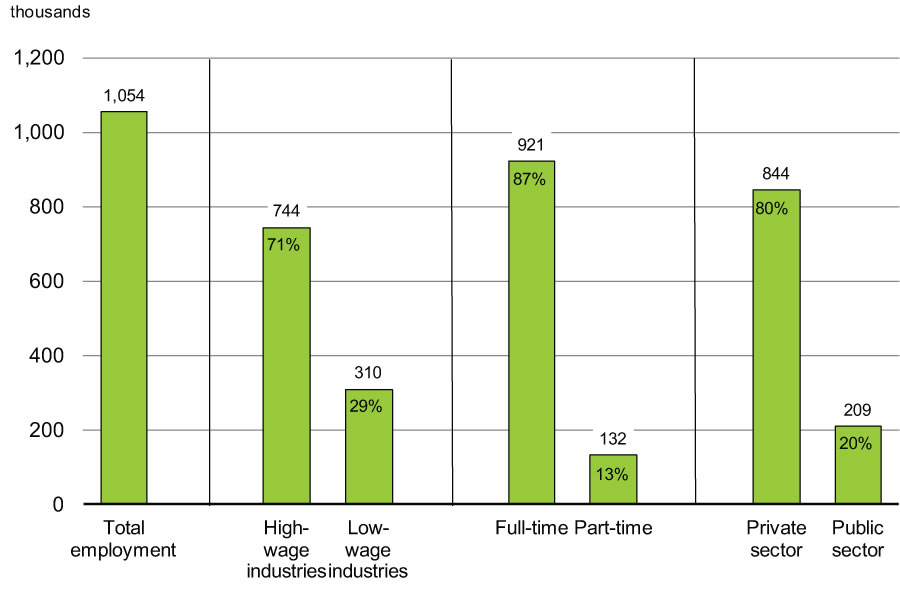
Sources: Statistics Canada; Department of Finance calculations.
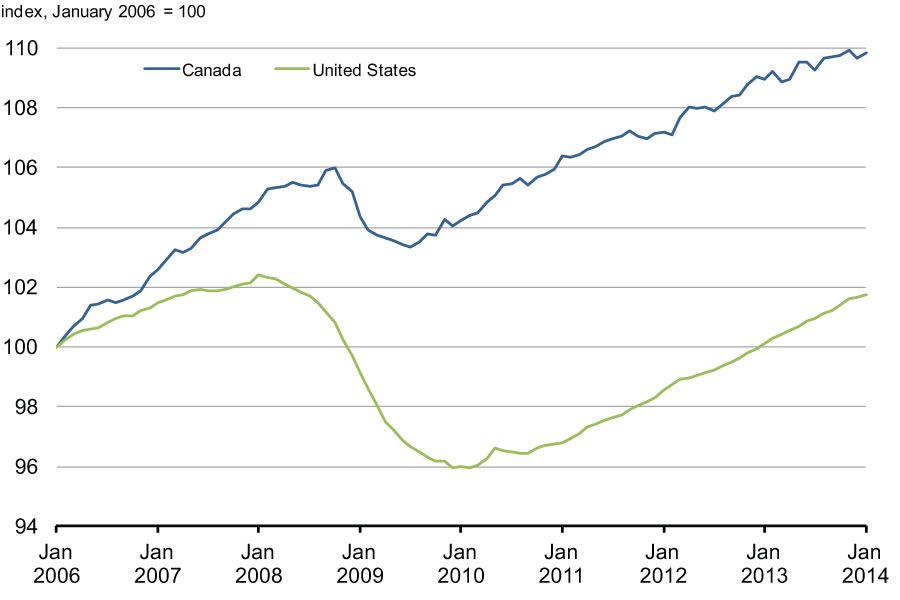
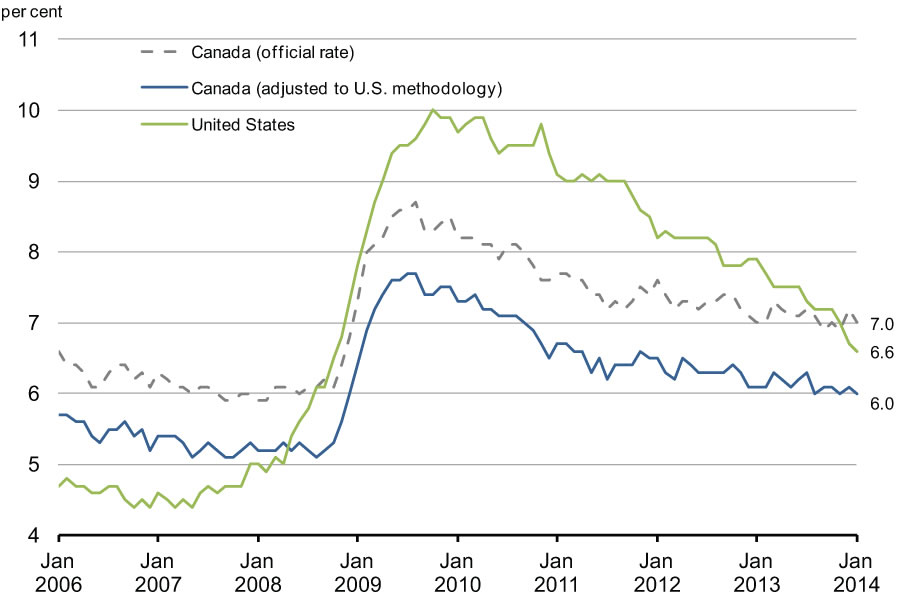
The employment situation in Canada contrasts sharply with that of the U.S., where employment remains below pre-recession levels almost five years after the end of the global recession (Chart 2.14). When Canadian unemployment is measured on the same basis as in the U.S., the unemployment rate in the U.S. would be 0.6 percentage points higher than in Canada.[1]
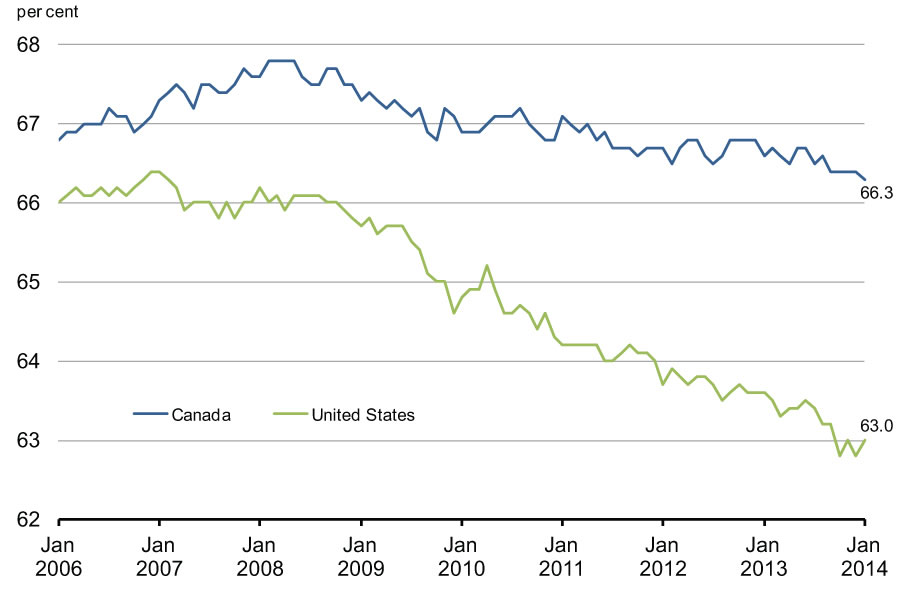
Moreover, the Canadian labour market has maintained a much higher labour force participation rate (the share of the population 15 and over in Canada, and 16 and over in the United States, either working or actively seeking work), which indicates that there are fewer discouraged workers in Canada, as more of the unemployed are seeking work and finding it. In contrast, the U.S. participation rate has declined sharply and stands near its lowest level in more than 35 years, reflecting a significant increase in the number of discouraged workers that have quit the labour market. As these discouraged workers are no longer considered to be unemployed, this has resulted in a somewhat artificial reduction in the U.S. unemployment rate. In fact, if the change in the U.S. participation rate had matched that in Canada, its unemployment rate would stand at about 9 per cent.[2]
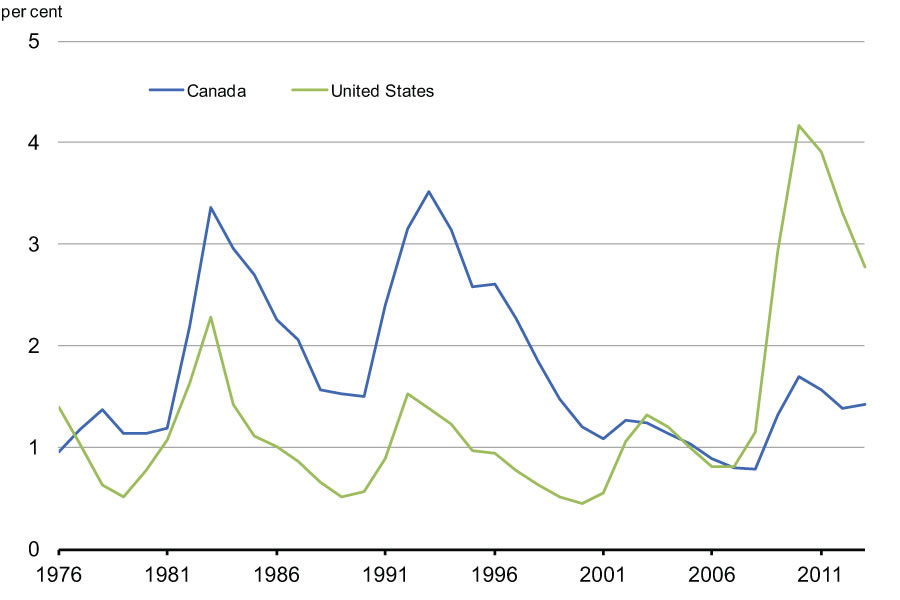
The stronger performance of the Canadian labour market is also reflected in the long-term unemployment rate (the number of people unemployed for a period of at least 27 weeks as a share of the labour force). Canada’s long-term unemployment rate stood at 1.4 per cent in 2013, below its historical average since 1976 and well below the U.S. level of 2.8 per cent, which remains more than double its average over the same period.
that of the United States
While Canada’s labour market has performed well, particularly relative to that of the United States, imbalances between unemployment and job vacancies have risen over the recovery. Canadian firms are experiencing more difficulty in hiring than the unemployment situation would normally warrant. Canada’s unemployment rate is 7 per cent, about 1 percentage point above its pre-recession level, whereas the job vacancy rate (the share of jobs available that are unfilled) reached 4.2 per cent in January 2014, a level similar to its pre-recession level (Chart 2.15). Unemployed individuals have more difficulty filling vacant positions.
Employers and business associations across the country are expressing growing concerns about the difficulty in finding skilled workers. For instance, the Canadian Manufacturing Coalition and the Canadian Federation of Independent Business (CFIB) report that about a third of businesses surveyed—double the level recorded by the CFIB in 2010—are experiencing skills shortages restricting their expansion.
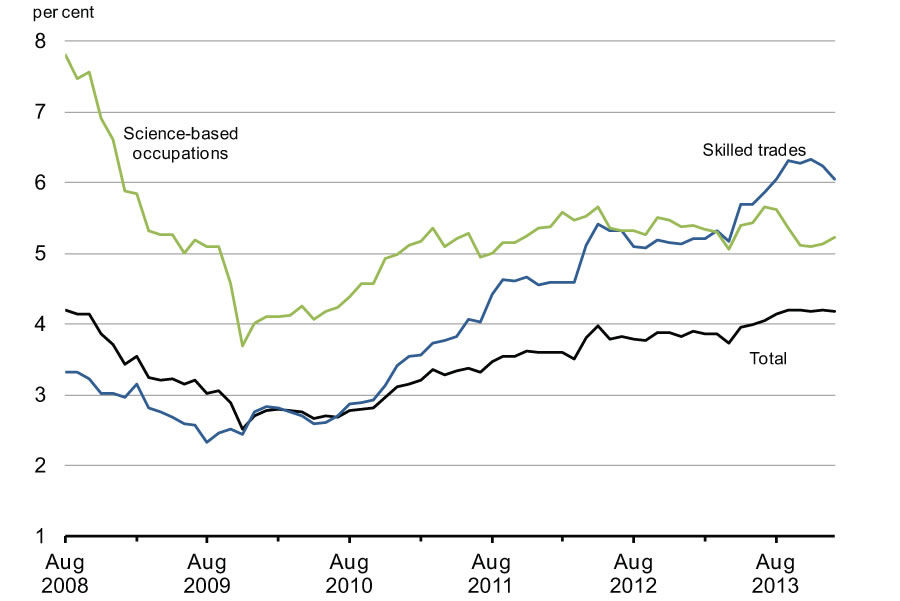
Acute labour shortages are currently concentrated in specific sectors and regions of the Canadian economy, partly explaining the absence of widespread wage pressures. Recruitment difficulties and wage pressures are particularly severe in skilled trades occupations in sectors such as mining, oil and gas extraction and construction. Canadian employers also have ongoing difficulty hiring high-skilled professionals in science-based occupations such as engineers and architects.
The number of firms reporting labour shortages is expected to continue to increase as the economy improves further and the unemployment rate returns to pre-recession levels. In addition, population aging and the associated weaker growth in labour supply could exacerbate these labour shortages over the medium term.
Greater skills development and mobility, as well as business innovation and adaptation of new technologies, are necessary to respond to these growing recruitment difficulties and ensure they do not impede our competitiveness. Skills development, mobility and business innovation allow for higher productivity and wages and help realign labour demand and supply.
Further details on Canada’s labour market situation can be found in the accompanying Jobs Report—The State of the Canadian Labour Market.
Sources: Number of online job postings: WANTED Analytics Inc. Employment: Statistics Canada; Department of Finance calculations.
Canada’s strong labour market performance over the recovery has been driven by a resilient economy. Indeed, Canada has recorded one of the strongest increases in real GDP among G-7 countries during the recession and the recovery, with real GDP up 6.2 per cent relative to its pre-recession peak (Chart 2.16).
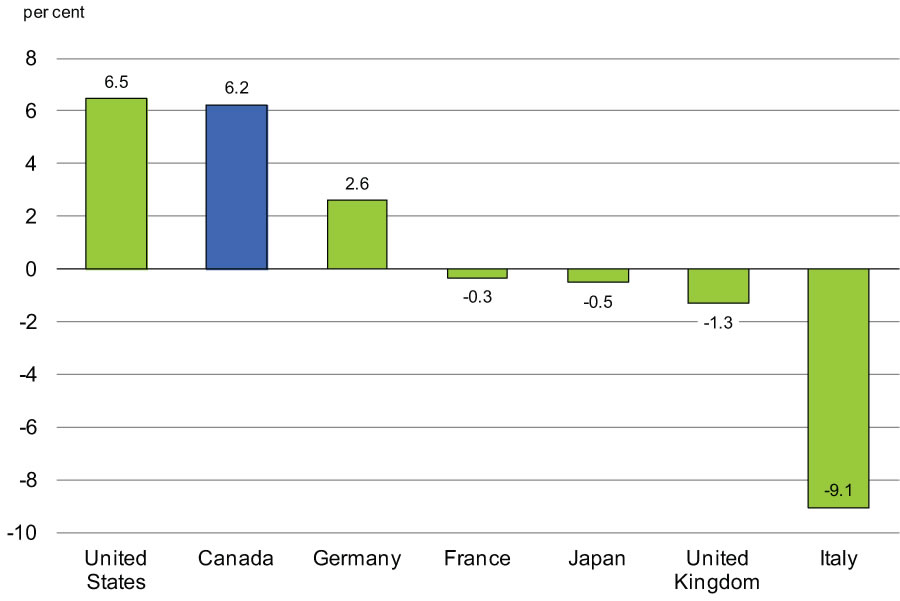
Sources: Haver Analytics; Department of Finance calculations.
This strong economic performance has translated into income gains for Canadians. In 2011, families in all major income quintiles had a higher income (after taxes, transfers and inflation) than prior to the recession.
Economic growth in Canada has been driven by real private domestic demand, that is, the sum of spending by Canadian households and businesses (Chart 2.17). In fact, Canada is the only G-7 country to have recorded continuous growth in real private domestic demand since the end of the recession.
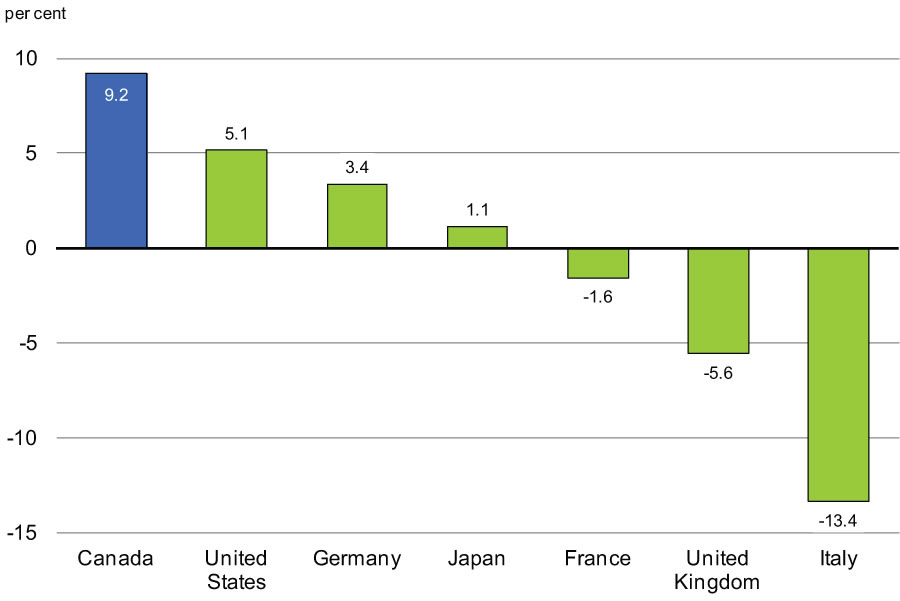
Sources: Statistics Canada; United Kingdom Office for National Statistics; German Federal Statistical Office; Haver Analytics; Department of Finance calculations.
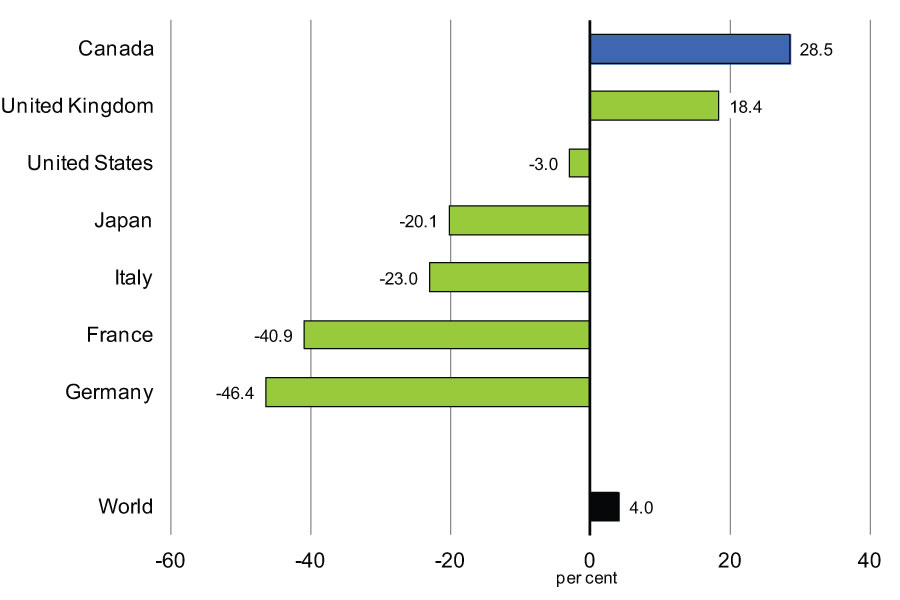
The sustained growth in real private domestic demand has been led by robust business non-residential investment, which has increased at an average annual rate of 7.6 per cent over the recovery. Canada’s performance has been by far the strongest among G-7 economies over that period. Indeed, the recovery in Canada’s business investment is significantly ahead of that in the U.S., which is the only other G-7 country to have more than fully recovered business investment lost during the recession (Chart 2.18).
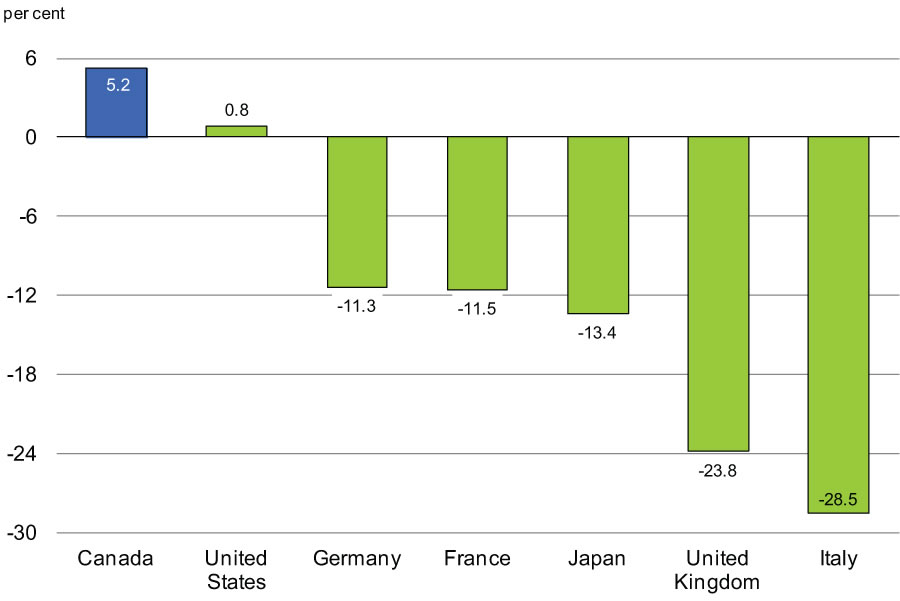
Sources: Statistics Canada; United Kingdom Office for National Statistics; German Federal Statistical Office; Haver Analytics; Department of Finance calculations.
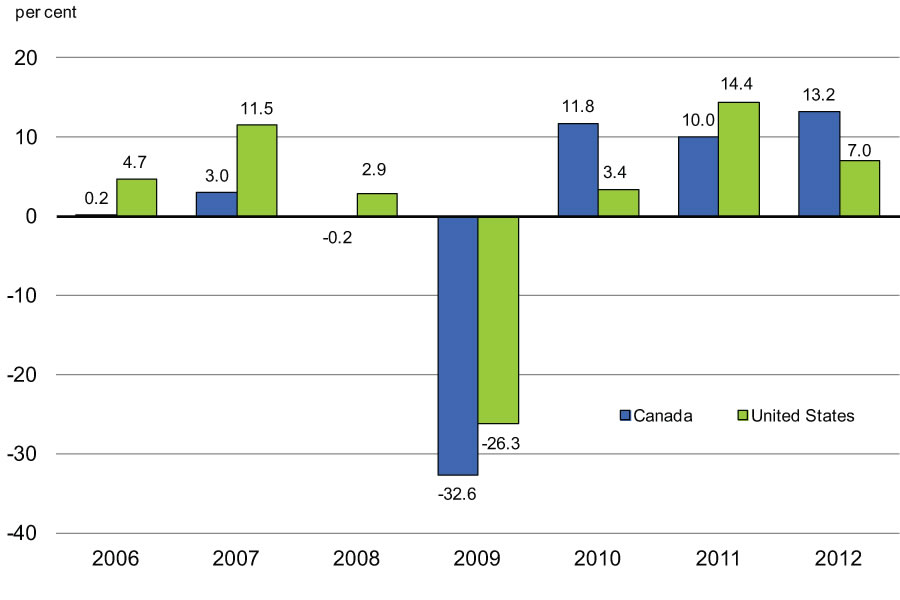
Canada’s strong investment performance has been broad-based, with most sectors posting stronger growth than their U.S. counterparts. Notably, business investment in Canada’s manufacturing sector has risen strongly, with almost all industries posting very strong growth in machinery and equipment (M&E) investment (Chart 2.19). Overall, investment in M&E by Canadian manufacturers has grown by about 40 per cent over the recovery, outpacing that in the U.S., after lagging in prior years.
Canada’s track record of steady economic growth over the recovery has also led foreign investors to invest in Canadian industries. Canada has been successful in attracting foreign direct investment (FDI), which has helped to bolster GDP growth and to create jobs. Indeed, since 2009, inflows of FDI in Canada have grown at an average annual rate of almost 30 per cent compared to average growth in global FDI inflows of 4 per cent (Chart 2.20). As a result, Canada’s performance since the beginning of the recovery is the best among G-7 countries.
Sources: Organisation for Economic Co-operation and Development; Department of Finance calculations.
However, continued global economic uncertainty has weighed on business investment growth since early 2012. Real business investment growth slowed to 4.9 per cent in 2012 from an average pace of 11.5 per cent earlier in the recovery. Growth in 2013 moderated further, leaving real business investment in the first three quarters of 2013 up only 1.2 per cent relative to the same period a year earlier.
Residential investment has also been an important contributor to growth over the recovery, driven primarily by Canadian households taking advantage of low interest rates to invest in housing assets.
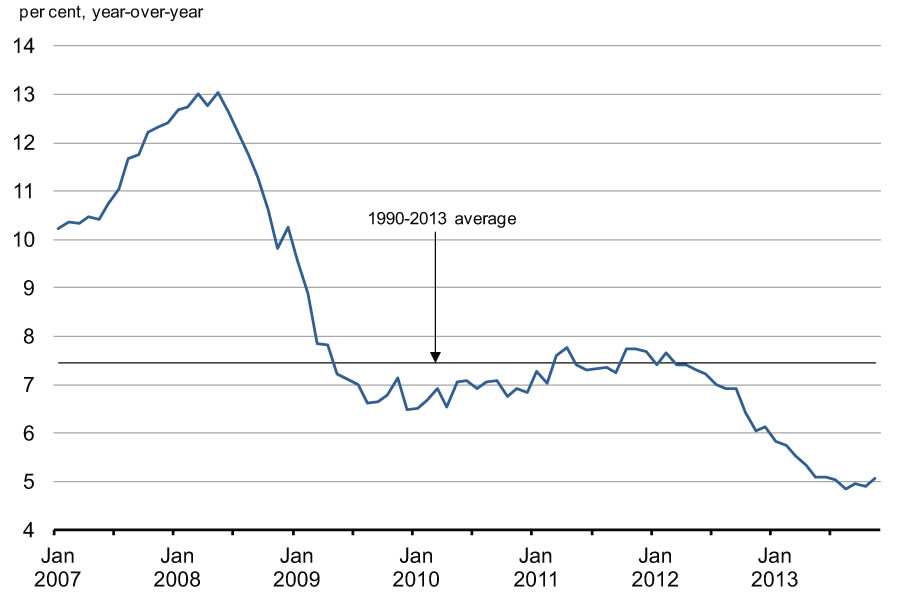
Following the most recent round of mortgage rule changes in July 2012, new housing construction and resale market activity moderated until early 2013. Consistent with this moderation in housing activity, the growth in residential mortgage credit continued to cool (Chart 2.21).
Resale activity and prices have picked up modestly since mid-2013. However, in contrast to the national price gains from 2001 to 2007 which were broad-based, the most recent national price appreciation has been driven by developments in Vancouver and Toronto. The strength in resale prices in these two cities reflects stronger price gains in the single- and semi-detached market segments that are more sensitive to land scarcity.
Recent developments suggest that actions taken to ensure the long-term stability of the Canadian housing market have been effective. The Government remains vigilant in monitoring the sector and is willing to take further action should the situation warrant.
Moreover, the most recent increase in housing activity and prices has not been accompanied by an acceleration in residential mortgage credit growth. This suggests that homebuyers are purchasing homes with larger down payments and that existing homeowners are taking advantage of low interest rates to pay off their mortgages at a faster rate.
Sources: Bank of Canada; Department of Finance calculations.
In spite of the strength of Canada’s domestic economy, overall real GDP growth has been dampened by a weak external environment, which has contributed to slow export growth. This was particularly true in 2012, as growth in private domestic demand remained positive, though modest, with quarterly growth averaging 2.4 per cent, while real exports declined by an average of 2.6 per cent per quarter. While exports showed some improvement over the first half of 2013, they declined again in the third quarter of the year, and remain below their level at the end of 2011 (Chart 2.22).
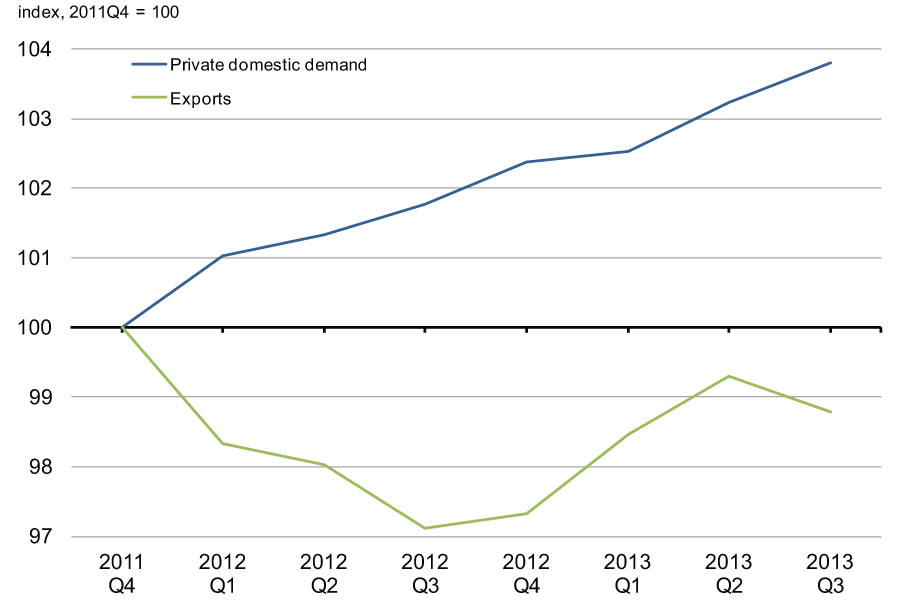
Sources: Statistics Canada; Department of Finance calculations.
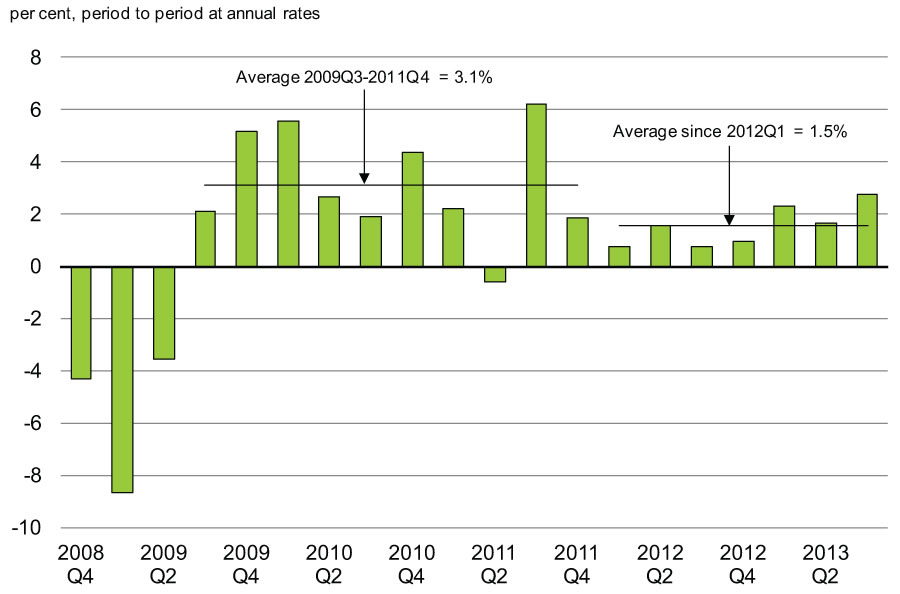
On balance, Canadian real GDP growth has remained stable since early 2012, averaging a modest 1.5 per cent per quarter, after average growth of 3.1 per cent over the earlier part of the recovery (Chart 2.23). However, growth has gained strength more recently, averaging 2.2 per cent over the first three quarters of 2013, with growth in the third quarter rising to 2.7 per cent, its strongest pace since mid-2011. Although growth in the third quarter was temporarily boosted by reconstruction activity following the Alberta flood and a rebound in construction activity in Quebec after a major strike in the second quarter, the recent pick-up in real growth is encouraging.
Modest domestic growth since early 2012 has also been reflected in lower consumer price inflation, which is consistent with the experience in most advanced economies (Chart 2.24). While consumer price inflation in Canada has picked up slightly since late 2012, to a pace similar to that in the U.S. and euro area, it remains very subdued, at 1.2 per cent year-over-year in the third quarter of 2013.
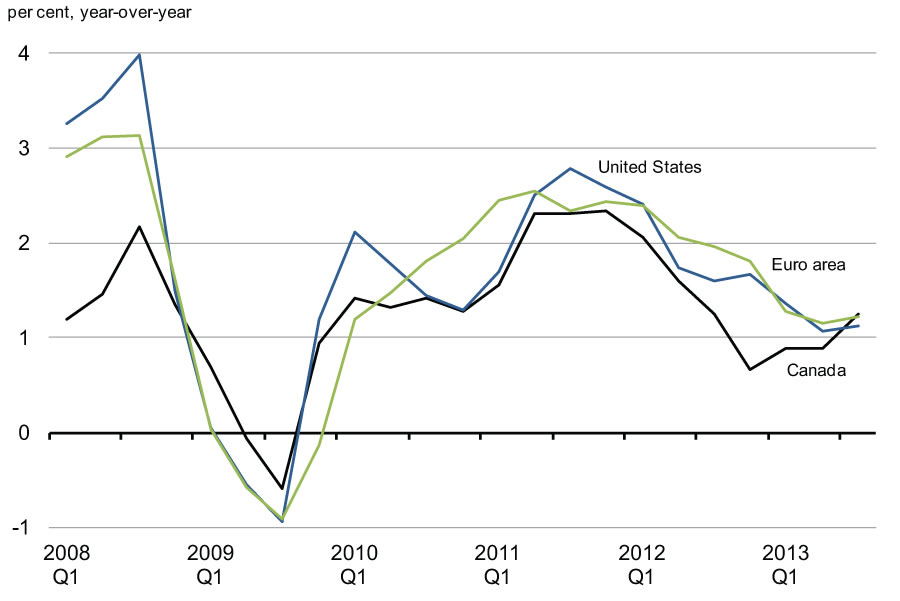
Source: Haver Analytics.
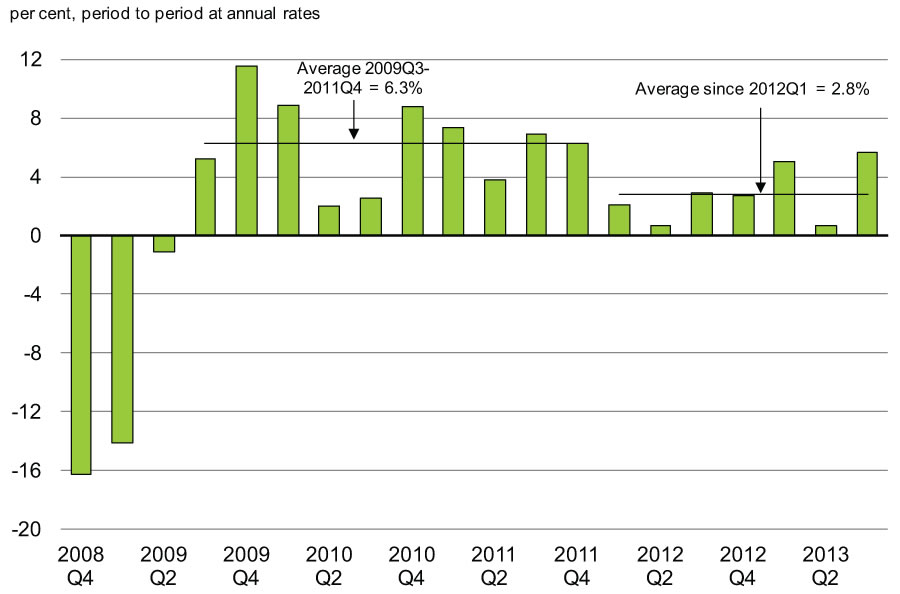
As well, continued price declines for some of our globally traded commodities have dampened Canada’s terms of trade, or the price of our exports relative to our imports. Together with low domestic inflation, this has pushed down GDP inflation, the broadest measure of economy-wide prices, since early 2012. Along with weaker real GDP growth, this has resulted in slower growth in nominal GDP, the broadest single measure of the tax base (Chart 2.25). Nominal GDP growth has averaged just 2.8 per cent per quarter since the beginning of 2012, compared to 6.3 per cent over the earlier part of the recovery. While nominal GDP growth picked up somewhat in the third quarter of 2013, the decline in Canadian crude oil prices since September will likely translate into weaker nominal GDP growth in the fourth quarter of the year.
Canadian Economic Outlook—Private Sector Forecasts
The average of private sector economic forecasts has been used as the basis for fiscal planning since 1994 and introduces an element of independence into the Government’s fiscal forecast. This practice has been supported by international organizations such as the IMF.
The Department of Finance regularly surveys private sector economists on their views on the outlook for the Canadian economy. The economic forecast presented in this section is based on a survey conducted in December 2013, and includes the views of 14 private sector economists.
The December 2013 survey of private sector economists included:
- BMO Capital Markets;
- Caisse de dépôt et placement du Québec;
- Canadian Federation of Independent Business;
- CIBC World Markets;
- The Conference Board of Canada;
- Desjardins;
- Deutsche Bank of Canada;
- IHS Global Insight;
- Laurentian Bank Securities;
- National Bank Financial Group;
- Royal Bank of Canada;
- Scotiabank;
- TD Bank Financial Group; and
- the University of Toronto (Policy and Economic Analysis Program).
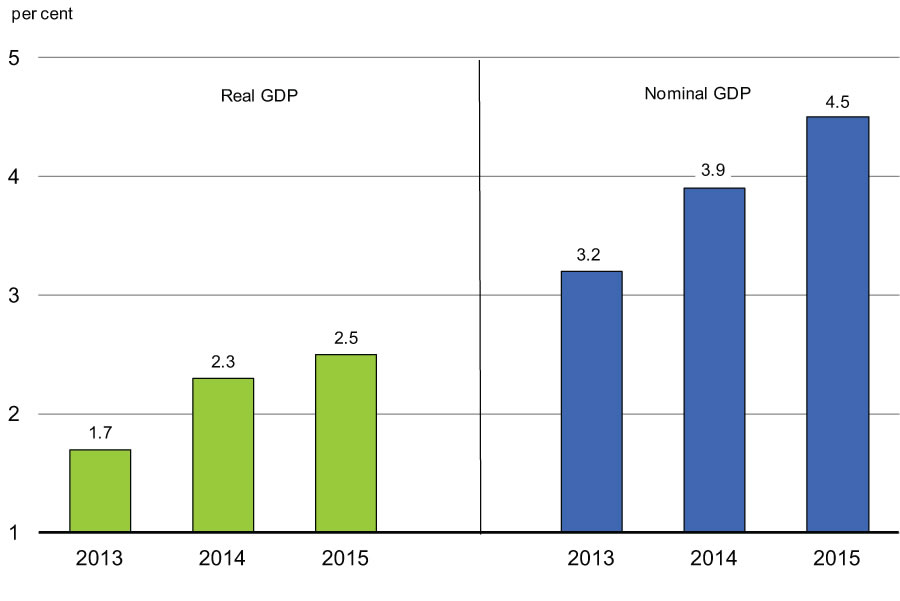
Private sector economists expect real GDP growth to improve over this year and next from its weak pace in 2013 (Chart 2.26). Economists expect growth of 2.0 per cent in the fourth quarter of 2013, rising to 2.4 per cent on average over the first half of 2014. The economists also expect GDP inflation (the broadest measure of economy-wide price inflation) to pick up from its slow pace in 2013, resulting in an acceleration in nominal GDP growth to 4.5 per cent by 2015.
The economists’ current outlook for nominal GDP growth is slightly below that presented in the Fall Update. As a result, the level of nominal GDP between 2014 and 2018 is expected to be about $4 billion lower on average per year than in the Fall Update.
The economists expect GDP inflation to strengthen in 2014 and 2015, supported by stronger Consumer Price Index (CPI) inflation, which they anticipate will increase from 1.0 per cent in 2013 to 2.0 per cent in 2016. This outlook is consistent with CPI inflation returning to the mid-point of the Bank of Canada’s inflation target range by late 2015.
With relatively weak inflationary pressures, private sector economists expect short-term interest rates to remain at their current low levels in 2014. The economists’ forecast is consistent with the first increase in the Bank of Canada’s policy rate occurring during the second quarter of 2015.
The economists expect the unemployment rate to continue to gradually decline over the forecast horizon and reach 6.2 per cent in 2018, in line with the average rate prevailing in the years leading up to the 2008–09 recession.
| 2013 | 2014 | 2015 | 2016 | 2017 | 2018 | 2014– 2018 |
|
|---|---|---|---|---|---|---|---|
| Real GDP growth | |||||||
| Economic Action Plan 2013/March 2013 survey | 1.6 | 2.5 | 2.6 | 2.4 | 2.3 | – | – |
| 2013 Fall Update/September 2013 survey | 1.7 | 2.4 | 2.6 | 2.4 | 2.3 | 2.2 | 2.4 |
| Economic Action Plan 2014/December 2013 survey | 1.7 | 2.3 | 2.5 | 2.5 | 2.3 | 2.2 | 2.4 |
| GDP inflation | |||||||
| Economic Action Plan 2013/March 2013 survey | 1.7 | 2.1 | 2.0 | 2.0 | 2.0 | – | – |
| 2013 Fall Update/September 2013 survey | 1.3 | 1.8 | 2.0 | 2.0 | 2.0 | 2.0 | 2.0 |
| Economic Action Plan 2014/December 2013 survey | 1.4 | 1.6 | 2.0 | 2.0 | 2.0 | 2.0 | 1.9 |
| Nominal GDP growth | |||||||
| Economic Action Plan 2013/March 2013 survey | 3.3 | 4.7 | 4.7 | 4.4 | 4.3 | – | – |
| 2013 Fall Update/September 2013 survey | 3.0 | 4.2 | 4.6 | 4.5 | 4.4 | 4.3 | 4.4 |
| Economic Action Plan 2014/December 2013 survey | 3.2 | 3.9 | 4.5 | 4.5 | 4.4 | 4.2 | 4.3 |
| Nominal GDP level (billions of dollars) | |||||||
| Economic Action Plan 2013/March 2013 survey | 1,878 | 1,966 | 2,058 | 2,149 | 2,241 | – | – |
| 2013 Fall Update/September 2013 survey | 1,875 | 1,954 | 2,044 | 2,136 | 2,229 | 2,324 | – |
| Economic Action Plan 2014/December 2013 survey | 1,878 | 1,952 | 2,040 | 2,132 | 2,226 | 2,320 | – |
| Difference between Economic Action Plan 2014 and 2013 Fall Update |
3 | -2 | -4 | -4 | -3 | -4 | – |
| 3-month treasury bill rate | |||||||
| Economic Action Plan 2013/March 2013 survey | 1.0 | 1.3 | 2.2 | 3.3 | 3.8 | – | – |
| 2013 Fall Update/September 2013 survey | 1.0 | 1.1 | 1.8 | 3.1 | 3.7 | 4.0 | 2.7 |
| Economic Action Plan 2014/December 2013 survey | 1.0 | 1.0 | 1.5 | 2.7 | 3.6 | 4.0 | 2.6 |
| 10-year government bond rate | |||||||
| Economic Action Plan 2013/March 2013 survey | 2.1 | 2.8 | 3.5 | 4.1 | 4.6 | – | – |
| 2013 Fall Update/September 2013 survey | 2.3 | 3.1 | 3.5 | 4.1 | 4.6 | 4.8 | 4.0 |
| Economic Action Plan 2014/December 2013 survey | 2.3 | 3.0 | 3.5 | 4.1 | 4.6 | 4.8 | 4.0 |
| Exchange rate (US cents/C$) | |||||||
| Economic Action Plan 2013/March 2013 survey | 98.9 | 100.7 | 100.9 | 99.3 | 98.8 | – | – |
| 2013 Fall Update/September 2013 survey | 97.3 | 96.8 | 97.2 | 98.0 | 97.7 | 98.1 | 97.6 |
| Economic Action Plan 2014/December 2013 survey | 96.8 | 93.7 | 95.3 | 95.9 | 96.2 | 96.3 | 95.5 |
| Unemployment rate | |||||||
| Economic Action Plan 2013/March 2013 survey | 7.1 | 6.9 | 6.7 | 6.5 | 6.4 | – | – |
| 2013 Fall Update/September 2013 survey | 7.1 | 6.9 | 6.6 | 6.4 | 6.3 | 6.2 | 6.5 |
| Economic Action Plan 2014/December 2013 survey | 7.1 | 6.8 | 6.6 | 6.4 | 6.3 | 6.2 | 6.5 |
| Consumer Price Index inflation | |||||||
| Economic Action Plan 2013/March 2013 survey | 1.3 | 2.0 | 2.0 | 2.0 | 2.0 | – | – |
| 2013 Fall Update/September 2013 survey | 1.2 | 1.8 | 2.0 | 2.0 | 2.0 | 2.0 | 2.0 |
| Economic Action Plan 2014/December 2013 survey | 1.0 | 1.5 | 1.9 | 2.0 | 2.0 | 2.0 | 1.9 |
| U.S. real GDP growth | |||||||
| Economic Action Plan 2013/March 2013 survey | 1.9 | 2.9 | 3.1 | 3.0 | 2.8 | – | – |
| 2013 Fall Update/September 2013 survey | 1.6 | 2.9 | 3.1 | 3.1 | 2.9 | 2.7 | 2.9 |
| Economic Action Plan 2014/December 2013 survey | 1.7 | 2.7 | 3.1 | 3.0 | 2.9 | 2.6 | 2.9 |
| Sources: Department of Finance March, September and December 2013 surveys of private sector economists. | |||||||
Risk Assessment
On January 27, 2014, the Minister of Finance met with the private sector economists to discuss the economic projections resulting from the December 2013 survey, as well as the risks surrounding the outlook. At that time, the economists agreed that the average forecast from the December survey was a reasonable basis for fiscal planning. The economists also continue to view risks to the outlook as largely external to the Canadian economy and tilted to the downside. However, they felt overall downside risk had lessened since the Fall Update, reflecting recent positive economic developments in the United Sates.
In the U.S., the economic recovery appears to be gaining more traction. The recently reached agreement on government funding has lifted some of the uncertainty that weighed on growth over the last two years. Nonetheless, the risk of further divisive debates occurring in the future over the direction of fiscal policy remains, and in that respect it is key that an agreement to raise the debt ceiling is reached. Overall, while downside risks to the U.S outlook remain, these risks are closer to being balanced than they have been for some time.
The expected pick-up in U.S. growth, together with the recent decline in the value of the Canadian dollar, should support Canadian exports going forward.
However, the risks to global growth are still present. In particular, if the ongoing repricing of global risk further exposes financial market vulnerabilities among some emerging economies, this could translate into weaker-than-expected growth for these countries and increase volatility in global capital markets. Furthermore, while the risk of a sovereign debt crisis in Europe has diminished, greater financial market volatility would place additional stress on those euro-area economies which are continuing to experience lacklustre growth.
In addition, volatility in commodity prices remains a risk to the outlook. In particular, benchmark prices for Canadian crude oil declined markedly in the fourth quarter of 2013, with the discount on Canadian crude vis-à-vis global benchmarks rising to a record high. In general, lower commodity prices reduce the value of Canada’s exports, which in turn puts downward pressure on nominal GDP growth.
More generally, weaker growth has led to lower inflation across most advanced economies, including Canada, over the last two years. If the global economy does not pick up as expected, this could, in addition to slower real GDP growth in Canada, lead to continued weak inflation in Canada, translating into weaker nominal GDP growth.
High levels of household debt also continue to present a risk to the outlook. In particular, in the event of a significant negative external shock resulting in higher unemployment, Canadian consumers would likely cut back spending to a greater degree than if they had lower debt levels, which would restrain real GDP growth.
Planning Assumptions
In light of these risks, for fiscal planning purposes, the Government has maintained the downward adjustment for risk to the private sector forecast for nominal GDP at $10 billion for 2013, and $20 billion for 2014 through 2018 (Table 2.2).
The downward adjustment for 2013 has been maintained at the same level as in the Fall Update to account for the risk that nominal GDP growth may be weaker than expected in the fourth quarter of 2013. The Government will continue to evaluate economic developments and risks to determine whether or not it would be appropriate to maintain this adjustment for risk in the future. The fiscal outlook is presented in Chapter 4.2.
| 2013 | 2014 | 2015 | 2016 | 2017 | 2018 | |
|---|---|---|---|---|---|---|
| December 2013 survey of private sector economists | 1,878 | 1,952 | 2,040 | 2,132 | 2,226 | 2,320 |
| Economic Action Plan 2014 fiscal planning assumption | 1,868 | 1,932 | 2,020 | 2,112 | 2,206 | 2,300 |
| Adjustment for risk | -10 | -20 | -20 | -20 | -20 | -20 |
| Addendum | ||||||
| Adjustment for risk in 2013 Fall Update | -10 | -20 | -20 | -20 | -20 | -20 |
[1] Conceptual differences raise the Canadian unemployment rate relative to the U.S. rate. In particular, Statistics Canada considers as unemployed those passively looking for work (e.g. reading want ads) as well as those who will begin work in the near future, while the U.S. Bureau of Labor Statistics does not include either group in the labour force. In addition, the Canadian methodology includes 15-year-olds (who have a higher-than-average unemployment rate), while the U.S. does not.
[2] For example, the U.S. participation rate has fallen by 2.5 percentage points since July 2009, whereas Canada’s participation rate has declined by 0.8 percentage points over the same period. If the U.S. participation rate had fallen by the same amount as Canada’s, and the level of U.S. employment had stayed the same, the U.S. unemployment rate would currently be 9.1 per cent.