

Archived information
Archived information is provided for reference, research or recordkeeping purposes. It is not subject to the Government of Canada Web Standards and has not been altered or updated since it was archived. Please contact us to request a format other than those available.
Chapter 4.2: Fiscal Planning Framework
Approach to Budget Planning
To ensure objectivity and transparency, the economic forecast underlying the Government's fiscal projections is based on an average of private sector economic forecasts. This process has been followed for nearly two decades and has been endorsed by the International Monetary Fund. Economic Action Plan 2013 maintains that approach.
Although the March 2013 private sector survey is considered to be a reasonable basis for fiscal planning purposes, the global economic outlook remains highly uncertain. As a result, the Government has judged it appropriate to continue to include a downward adjustment to the private sector forecast for nominal gross domestic product (GDP). With this adjustment for risk, the revenue projections are reduced by $3.0 billion in each year from 2013-14 to 2017-18 (Table 4.2.1).
| 2013-14 | 2014-15 | 2015-16 | 2016-17 | 2017-18 | |
|---|---|---|---|---|---|
| Adjustment for risk to revenues | -3.0 | -3.0 | -3.0 | -3.0 | -3.0 |
Fiscal Outlook Before the Measures Announced in Economic Action Plan 2013
Table 4.2.2 provides a summary of the changes in the fiscal projections between the 2012 Fall Update and Economic Action Plan 2013. The $25.8 billion deficit projected for 2012-13, before measures announced in Economic Action Plan 2013, is $0.2 billion lower than the $26.0 billion deficit projected in the Fall Update. This is due to the absorption of the $1.0 billion adjustment for risk included in the Fall Update as well as lower projected Employment Insurance and elderly benefits, reflecting lower than expected unemployment and inflation. In addition, public debt charges are projected to be lower by $0.5 billion, largely reflecting lower inflation adjustments on real return bonds. However, this is partly offset by projected revenues that are lower by $1.2 billion as a result of recent moderation in economic growth. In addition, program expenses are higher as a result of an expected increase in Atomic Energy of Canada Limited's liability for decommissioning and legacy waste management.
The projected budgetary balance for 2013-14 has declined since the Fall Update, as lower program expenses are only expected to partly offset lower revenues. The situation is reversed for the remainder of the projection period, to the extent that a surplus of $0.1 billion is projected for 2015-16 before measures announced in Economic Action Plan 2013.
| 2012-13 | 2013-14 | 2014-15 | 2015-16 | 2016-17 | 2017-18 | |
|---|---|---|---|---|---|---|
| 2012 Fall Update budgetary balance | -26.0 | -16.5 | -8.6 | -1.8 | 1.7 | 3.4 |
| Revenue effect of adjustment for risk | -1.0 | -3.0 | -3.0 | -3.0 | -3.0 | -3.0 |
| 2012 Fall Update budgetary balance before adjustment for risk | -25.0 | -13.5 | -5.6 | 1.2 | 4.7 | 6.4 |
| Impact of economic and fiscal developments | ||||||
| Budgetary revenues | -1.2 | -3.4 | -3.2 | -2.3 | -1.9 | -2.8 |
| Program expenses1 | ||||||
| Major transfers to persons | 1.0 | 1.3 | 1.1 | 0.9 | 1.0 | 1.2 |
| Major transfers to other levels of government | 0.0 | 0.0 | 0.2 | 0.4 | 0.4 | 0.4 |
| Direct program expenses | -1.3 | 0.1 | 2.5 | 2.4 | 2.0 | 2.1 |
| Total | -0.2 | 1.5 | 3.8 | 3.7 | 3.3 | 3.7 |
| Public debt charges1 | 0.5 | 0.0 | 0.7 | 0.5 | 0.6 | 0.3 |
| Total economic and fiscal developments | -0.8 | -1.8 | 1.3 | 1.9 | 2.1 | 1.2 |
| Revenue effect of adjustment for risk | -3.0 | -3.0 | -3.0 | -3.0 | -3.0 | |
| Revised status quo budgetary balance (before budget measures) |
-25.8 | -18.3 | -7.2 | 0.1 | 3.8 | 4.5 |
| Note: Totals may not add due to rounding.
1 A negative number implies an increase in spending and a deterioration in the budgetary balance. A positive number implies a decrease in spending and an improvement in the budgetary balance. |
||||||
Budgetary revenues have been revised down over the entire projection period since the Fall Update. This is a result of year-to-date fiscal results and downward revisions to nominal GDP. In addition, lower projected interest rates and lower expected revenues of consolidated Crown corporations have marginally lowered the projection for other revenues.
Starting in 2013-14, expenses are expected to be below the level projected in the Fall Update in the remaining years of the projection period. This is the result of lower projections for major transfers to persons, major transfers to other levels of government, direct program expenses and public debt charges.
The forecast for major transfers to persons has been reduced as a result of lower expected inflation, which affects the forecasts for elderly and children's benefits that are indexed to the Consumer Price Index (CPI), and lower expected levels of unemployment, which reduce the forecast for Employment Insurance benefits. Major transfers to other levels of government are also projected to be lower, reflecting lower projected nominal GDP and other economic and fiscal developments.
Direct program expenses are expected to be lower than projected in the Fall Update as a result of lower forecasted expenses of consolidated Crown corporations, lower transfers to provinces in respect of natural resource revenues, lower projected costs for refundable tax credits, and lower projected costs for essential services (e.g., contract policing, corrections, leases, and utility costs) and compensation.
In addition, the projection for direct program expenses includes an increase of the estimated amount of planned spending that does not proceed in any given year—the so-called lapse. In recent years, lapsed spending has been at historically high levels due to, for example, significant infrastructure spending, which often requires reprofiling in light of revised project schedules. The lapse reached about $10 billion or 10 per cent of planned spending in 2011-12 (Chart 4.2.1). Over the forecast horizon, this lapse amount is projected to decline to about $5 billion. By 2017-18, the lapse as a proportion of appropriations is projected to be about 5 per cent, which is close to post-2000 historical lows. The assumption that the lapse trends towards post-2000 historical lows introduces an element of prudence into the fiscal projection.
Differences between planned and actual departmental spending are expected to return to post-2000 historical lows
Chart 4.2.1 Historical and Projected Lapses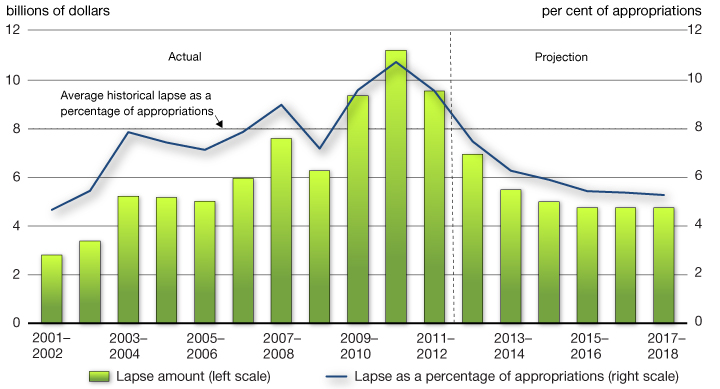
Note: Historical lapses are presented on a cash basis as they are presented in the Public Accounts of Canada. Projected lapses are presented on an accrual basis to be consistent with the fiscal projections. The projected lapses are divided by projected appropriations on a cash basis.
Sources: Public Accounts of Canada; Department of Finance.
The projection also reflects changes to the profile of existing infrastructure spending as well as revisions to pension and benefit expenses in light of changes in expected interest rates. In 2013-14, these changes offset the decrease in spending from the other changes discussed above. Fiscal planning provisions to address potential future spending were also adjusted based on recent information.
Public debt charges are expected to be lower than projected in the Fall Update over the entire forecast horizon, mainly reflecting lower forecasted inflation and lower forecasted interest rates. The interest rate and inflation effects are partially offset by higher pension interest expense as a result of lower market returns on the funded portion of public sector pension plans.
Fiscal Impact of Measures Announced in Economic Action Plan 2013
Table 4.2.3 sets out the impact of the measures introduced in this budget.
| 2012-13 | 2013-14 | 2014-15 | 2015-16 | 2016-17 | 2017-18 | Total | |
|---|---|---|---|---|---|---|---|
| 2012 Fall Update budgetary balance | -26.0 | -16.5 | -8.6 | -1.8 | 1.7 | 3.4 | |
| Economic and fiscal developments (including change to adjustment for risk) | 0.2 | -1.8 | 1.3 | 1.9 | 2.1 | 1.2 | |
| Revised status quo budgetary balance (before budget measures) | -25.8 | -18.3 | -7.2 | 0.1 | 3.8 | 4.5 | |
| Budget measures | |||||||
| Actions to support jobs and growth1 | -0.1 | -0.9 | -0.9 | -1.2 | -2.0 | -1.7 | -6.9 |
| Closing tax loopholes and improving the fairness of the tax system | 0.0 | 0.3 | 0.8 | 0.9 | 1.1 | 1.2 | 4.4 |
| Canada Revenue Agency: compliance programs | 0.0 | 0.1 | 0.6 | 0.6 | 0.6 | 0.6 | 2.4 |
| General Preferential Tariff | 0.0 | 0.0 | 0.1 | 0.3 | 0.3 | 0.3 | 1.1 |
| Spending restraint and transformation of government1 | 0.0 | 0.1 | 0.1 | 0.1 | 0.1 | 0.1 | 0.6 |
| Total budget measures | 0.0 | -0.4 | 0.6 | 0.8 | 0.1 | 0.5 | 1.6 |
| Budgetary balance (after budget measures) | -25.9 | -18.7 | -6.6 | 0.8 | 3.9 | 5.1 | |
| Note: Totals may not add due to rounding.
1 A negative number implies an increase in spending and a deterioration in the budgetary balance. A positive number implies a decrease in spending and an improvement in the budgetary balance. |
|||||||
Economic Action Plan 2013 makes investments totalling $6.9 billion over this and the next five years to support jobs, growth and long-term prosperity by:
- Connecting Canadians with available jobs by equipping them with the skills and training they require to obtain high-quality jobs.
- Helping manufacturers and businesses succeed in the global economy by enhancing the conditions for creating and growing businesses, including measures to support a globally competitive manufacturing sector, build on Canada's financial sector advantage, increase and diversify our exports, and develop our natural resources in a safe, responsible and secure way, in order to protect and create high-quality, value-added jobs.
- Creating a new Building Canada plan that adds to the unprecedented investments in public infrastructure since 2006 with a new infrastructure plan focused on projects that create jobs and economic growth and provide a high quality of life for Canadian families.
- Investing in world-class research and innovation and fostering a vibrant entrepreneurial culture where new ideas are translated into the marketplace.
- Supporting families and communities by expanding opportunities for Canadians to succeed and enjoy a high quality of life.
At the same time, Economic Action Plan 2013 takes further action to close tax loopholes and improve the fairness and integrity of the tax system. These actions will increase revenues by a total of $4.4 billion over the next five years. Economic Action Plan 2013 also makes changes to the Canada Revenue Agency's compliance programs, which will increase revenues by $2.4 billion over the next five years.
In addition, Economic Action Plan 2013 takes action to modernize Canada's General Preferential Tariff regime, effective January 1, 2015, generating $1.1 billion over five years.
Finally, Economic Action Plan 2013 also announces a number of common sense improvements to government administration and service delivery, such as increasing the use of telepresence, expanding access to e-publications, streamlining and consolidating the Government's web presence, and standardizing software licences. These actions will improve the budgetary balance by $0.6 billion over the next five years.
With the exception of 2013-14, new policy measures in this budget improve the budgetary balance over the projection period. Over the next five years, measures taken in Economic Action Plan 2013 will improve the budgetary balance by $1.6 billion.
The fiscal projections in Chart 4.2.2 show that the Government remains on track to eliminate the deficit and return to balanced budgets by 2015-16.
The Government is on track to return to balanced budgets by 2015-16
Chart 4.2.2 Budgetary Balance After Measures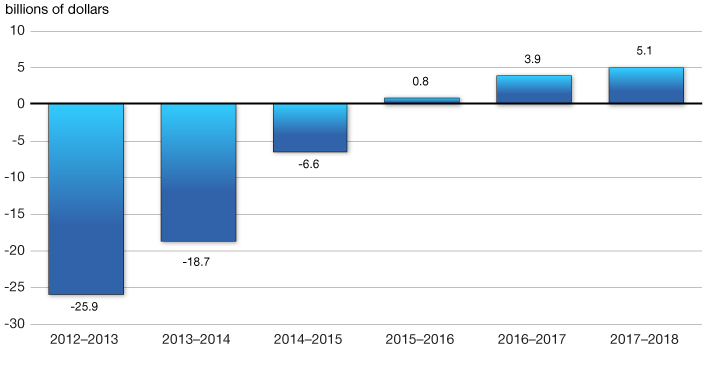
Summary of Statement of Transactions
Table 4.2.4 summarizes the Government's financial position, including measures announced in Economic Action Plan 2013.
| Projection | |||||||
|---|---|---|---|---|---|---|---|
| 2011-121 | 2012-13 | 2013-14 | 2014-15 | 2015-16 | 2016-17 | 2017-18 | |
| Budgetary revenues | 248.8 | 254.2 | 263.9 | 279.6 | 294.9 | 308.1 | 318.9 |
| Program expenses | 244.0 | 251.0 | 252.9 | 256.0 | 262.6 | 270.4 | 278.1 |
| Public debt charges | 31.0 | 29.0 | 29.7 | 30.2 | 31.5 | 33.8 | 35.7 |
| Total expenses | 275.0 | 280.1 | 282.6 | 286.2 | 294.1 | 304.2 | 313.9 |
| Budgetary balance | -26.2 | -25.9 | -18.7 | -6.6 | 0.8 | 3.9 | 5.1 |
| Federal debt2 | 582.2 | 608.7 | 627.4 | 634.0 | 633.2 | 629.3 | 624.2 |
| Per cent of GDP | |||||||
| Budgetary revenues | 14.1 | 14.0 | 14.2 | 14.4 | 14.5 | 14.5 | 14.4 |
| Program expenses | 13.8 | 13.8 | 13.6 | 13.2 | 12.9 | 12.7 | 12.5 |
| Public debt charges | 1.8 | 1.6 | 1.6 | 1.6 | 1.5 | 1.6 | 1.6 |
| Budgetary balance | -1.5 | -1.4 | -1.0 | -0.3 | 0.0 | 0.2 | 0.2 |
| Federal debt | 33.0 | 33.5 | 33.8 | 32.6 | 31.1 | 29.6 | 28.1 |
| Note: Totals may not add due to rounding.
1 Budgetary revenues and program expenses in 2011-12 have been adjusted to reflect the new accounting standard for tax revenues issued by the Public Sector Accounting Board of the Canadian Institute of Chartered Accountants. 2 The projected level of federal debt for 2012-13 includes an estimate of other comprehensive income. |
|||||||
The actions taken in this and previous budgets to return to balanced budgets in 2015 are projected to lead to an improvement in the budgetary balance from a deficit of $25.9 billion in 2012-13 to a surplus of $0.8 billion in 2015-16 and a surplus of $5.1 billion in 2017-18. As a percentage of GDP, the budgetary balance is projected to improve from a deficit of 1.4 per cent in 2012-13 to a surplus of 0.2 per cent in 2017-18.
An important indicator of fiscal sustainability is the debt-to-GDP ratio. Prior to the global financial crisis, the Government was able to reduce taxes and invest in infrastructure while also eliminating over $37 billion in federal debt. The resulting reductions in the debt-to-GDP ratio positioned Canada to emerge from the recession faster and stronger than virtually any other major advanced country. Returning to balanced budgets by 2015-16 will ensure that the federal debt, measured in relation to the size of the economy, resumes its downward track (Chart 4.2.3). The debt ratio is projected to fall to 28.1 per cent in 2017-18, in line with its pre-recession level.
As a result, Canada expects to achieve its Group of 20 (G-20) commitments to halve deficits by 2013 and stabilize or reduce the total government debt-to-GDP ratio by 2016, as agreed to by G-20 Leaders at their summit in Toronto in June 2010.
The debt-to-GDP ratio is projected to resume its downward track
Chart 4.2.3 Debt-to-GDP Ratio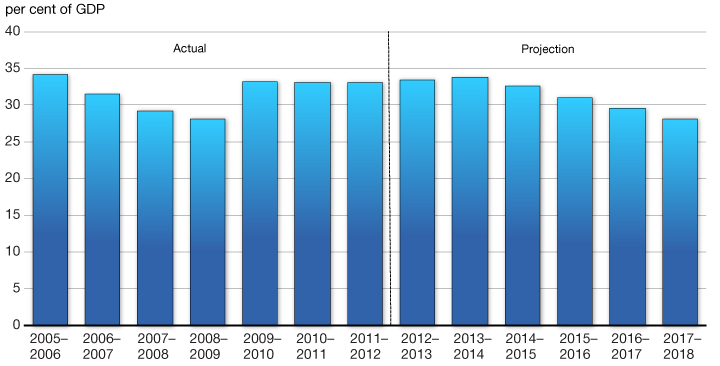
Outlook for Budgetary Revenues
| Projection | |||||||
|---|---|---|---|---|---|---|---|
| 2011-121 | 2012-13 | 2013-14 | 2014-15 | 2015-16 | 2016-17 | 2017-18 | |
| Income taxes | |||||||
| Personal income tax | 120.5 | 126.2 | 131.5 | 140.3 | 148.6 | 156.2 | 164.1 |
| Corporate income tax | 34.0 | 33.0 | 34.6 | 37.3 | 38.9 | 41.1 | 43.1 |
| Non-resident income tax | 5.3 | 5.2 | 5.4 | 5.7 | 6.3 | 6.7 | 7.0 |
| Total income tax | 159.8 | 164.5 | 171.5 | 183.3 | 193.8 | 204.0 | 214.3 |
| Excise taxes/duties | |||||||
| Goods and Services Tax | 28.4 | 28.9 | 29.9 | 31.7 | 33.3 | 35.0 | 36.7 |
| Customs import duties | 3.9 | 4.0 | 4.0 | 4.3 | 4.7 | 4.9 | 5.1 |
| Other excise taxes/duties | 10.9 | 11.2 | 10.9 | 10.9 | 10.8 | 10.7 | 10.7 |
| Total excise taxes/duties | 43.1 | 44.1 | 44.9 | 46.9 | 48.9 | 50.6 | 52.5 |
| Total tax revenues | 202.9 | 208.5 | 216.4 | 230.2 | 242.7 | 254.6 | 266.8 |
| Employment Insurance premium revenues |
18.6 | 20.1 | 21.9 | 23.8 | 25.1 | 24.2 | 20.7 |
| Other revenues | 27.3 | 25.5 | 25.6 | 25.6 | 27.1 | 29.3 | 31.4 |
| Total budgetary revenues | 248.8 | 254.2 | 263.9 | 279.6 | 294.9 | 308.1 | 318.9 |
| Per cent of GDP | |||||||
| Personal income tax | 6.8 | 6.9 | 7.1 | 7.2 | 7.3 | 7.3 | 7.4 |
| Corporate income tax | 1.9 | 1.8 | 1.9 | 1.9 | 1.9 | 1.9 | 1.9 |
| Goods and Services tax | 1.6 | 1.6 | 1.6 | 1.6 | 1.6 | 1.6 | 1.7 |
| Total tax revenues | 11.5 | 11.5 | 11.6 | 11.8 | 11.9 | 12.0 | 12.0 |
| Employment Insurance premium revenues |
1.1 | 1.1 | 1.2 | 1.2 | 1.2 | 1.1 | 0.9 |
| Other revenues | 1.5 | 1.4 | 1.4 | 1.3 | 1.3 | 1.4 | 1.4 |
| Total budgetary revenues | 14.1 | 14.0 | 14.2 | 14.4 | 14.5 | 14.5 | 14.4 |
| Note: Totals may not add due to rounding.
1 2011-12 figures have been adjusted to reflect the new accounting standard for tax revenues issued by the Public Sector Accounting Board of the Canadian Institute of Chartered Accountants. |
|||||||
Table 4.2.5 sets out the Government's projection for budgetary revenues reflecting both Economic Action Plan 2013 measures and the adjustment for risk, which for planning purposes is applied proportionally to tax revenues and other revenues, net of flow-through revenues. Revenues are expected to increase by 2.2 per cent in 2012-13 based on year-to-date fiscal results and the economic projections. Over the remainder of the forecast horizon, revenues are projected to grow at an average annual rate of 4.6 per cent based on expected growth in tax bases. The revenue outlook takes into account measures announced in this budget, including changes to Canada Revenue Agency's compliance programs, and actions to close tax loopholes and improve the fairness and integrity of the tax system.
Personal income tax revenues—the largest component of budgetary revenues—are projected to increase by $5.7 billion, or 4.7 per cent, to $126.2 billion in 2012-13. Over the remainder of the projection period, personal income tax revenues increase on average by 5.4 per cent annually, reflecting the progressive nature of the income tax system combined with real income gains.
Corporate income tax revenues are projected to be $33.0 billion in 2012-13. Over the remainder of the projection period, corporate income tax revenues are projected to grow at an average annual rate of 5.5 per cent, based on projected profit growth, actions to close tax loopholes and improve the fairness and integrity of the tax system, and changes to the Canada Revenue Agency's compliance programs.
Non-resident income tax revenues are taxes paid by non-residents of Canada on Canadian-sourced income, notably dividends and interest payments. They are projected to grow at an average annual rate of 4.9 per cent over the forecast horizon.
Goods and Services Tax (GST) revenues are projected to grow by 1.8 per cent in 2012-13 based on relatively weak growth in consumption in the latter part of 2012-13. For the remainder of the projection period, GST revenues are projected to grow by 4.9 per cent per year on average, reflecting projected growth in taxable consumption.
Revenues from customs import duties are projected to increase by 3.5 per cent in 2012-13, reflecting year-to-date results. Over the remainder of the projection period, annual growth in customs import duties is projected to average 5.1 per cent, based, in large part, on projected growth in imports.
Based on year-to-date results, revenues from other excise taxes and duties are projected to be $11.2 billion in 2012-13. They are projected to decline slowly over the remainder of the projection period, in line with trends over the last five years.
Employment Insurance (EI) premium revenues are projected to grow by 8.6 per cent in 2012-13, in line with the growth in insurable earnings and the EI premium rate of $1.88 per $100 of insurable earnings in 2013. From 2012-13 to 2015-16, it is projected that the annual growth in EI premium revenues will average 7.6 per cent until the EI Operating Account is returned to cumulative balance in 2016. As described in the box below, a significant reduction of the EI premium rate in 2017 is expected to lead to declining EI premium revenues over the final two fiscal years of the forecast horizon.
Employment Insurance Operating Account
| 2012-2013 | 2013-2014 | 2014-2015 | 2015-2016 | 2016-2017 | 2017-2018 | |
|---|---|---|---|---|---|---|
| EI premium revenues | 20.1 | 21.9 | 23.8 | 25.1 | 24.2 | 20.7 |
| EI benefits1 | 17.5 | 18.3 | 19.2 | 19.6 | 20.0 | 20.3 |
| 2012 | 2013 | 2014 | 2015 | 2016 | 2017 | |
| EI Operating Account annual balance2 | 0.5 | 1.4 | 2.8 | 4.1 | 4.0 | -1.4 |
| EI Operating Account cumulative balance2 | -8.6 | -7.2 | -4.5 | -0.4 | 3.7 | 2.3 |
| Reference: | ||||||
| Projected premium rate (per $100 of insurable earnings) | 1.83 | 1.88 | 1.93 | 1.98 | 1.93 | 1.53 |
| 1 EI benefits include regular EI benefits, sickness, maternity, parental, compassionate care, fishing and work-sharing benefits, and employment benefits and support measures. These represent 90 per cent of total EI program expenses. The remaining EI costs relate mainly to administration and are included in direct program spending.
2 The EI Operating Account annual and cumulative balances are on a calendar-year basis since the EI premium rate is set on a calendar-year basis. |
||||||
In response to the global recession, the Government froze the EI premium rate in 2010 at the lowest level since 1982. In order to help protect Canadian jobs during a fragile global recovery, Economic Action Plan 2012 ensured stable and predictable EI premium rates by limiting rate increases to 5 cents each year until the EI Operating Account is returned to balance.
The global recession increased total benefit expenditures over a relatively short period of time, bringing the cumulative deficit in the EI Operating Account to $9.2 billion in 2011. To eliminate this cumulative deficit, the premium rate is expected to increase by the maximum 5 cents per year until 2015 to reach $1.98 per $100 of insurable earnings. Then, as the maximum decrease in the premium rate is also limited to 5 cents per year, the premium rate is expected to decline to $1.93 in 2016, when the EI Operating Account is expected to return to a cumulative surplus of $3.7 billion.
As announced in Economic Action Plan 2012, once the EI Operating Account has achieved balance, the EI premium rate will be set annually at a seven-year break-even rate to ensure that EI premiums are no higher than needed to pay for the EI program over that seven-year period. This results in a significant reduction in the premium rate in 2017, to an expected $1.53 per $100 of earnings.
Other revenues include the external revenues of consolidated Crown corporations, net income from enterprise Crown corporations, foreign exchange revenues, returns on investments and proceeds from the sales of goods and services. These revenues are volatile owing principally to the impact of interest rates on interest-earning assets, the impact of exchange rate movements on the Canadian-dollar value of foreign-denominated assets, and the sensitivity of Crown revenues to market conditions.
Other revenues are projected to fall by $1.7 billion, to $25.5 billion in 2012-13, due primarily to lower projected revenues from Crown corporations and a decrease in offshore resource royalties collected on behalf of the provinces. This decline in other revenues only partially impacts the budgetary balance as offshore resource royalties are transferred to the provinces, and this gives rise to an offsetting reduction in expenses. Growth in other revenues is expected to average 4.2 per cent per year over the remainder of the projection period.
Chart 4.2.4 shows that the revenue-to-GDP ratio has decreased from 16.0 per cent in 2006-07 to 14.1 per cent in 2011-12 and will remain broadly stable over the forecast horizon.
Revenue-to-GDP ratio has fallen since 2006
Chart 4.2.4 Revenue-to-GDP Ratio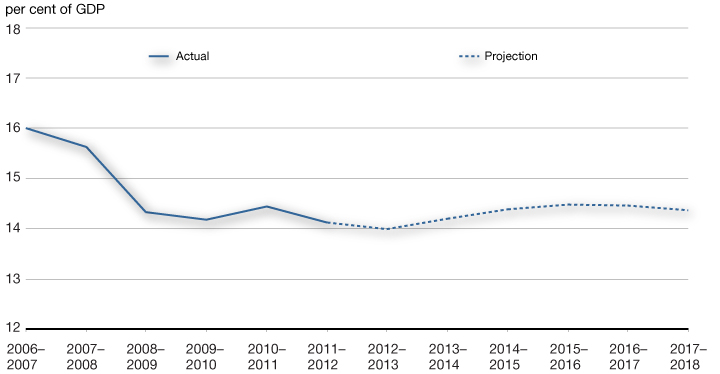
Outlook for Program Expenses
| Projection | |||||||
|---|---|---|---|---|---|---|---|
| 2011-121 | 2012-13 | 2013-14 | 2014-15 | 2015-16 | 2016-17 | 2017-18 | |
| Major transfers to persons | |||||||
| Elderly benefits | 38.0 | 40.1 | 42.0 | 44.2 | 46.6 | 49.2 | 51.8 |
| Employment Insurance benefits2 | 17.6 | 17.5 | 18.3 | 19.2 | 19.6 | 20.0 | 20.3 |
| Children's benefits | 12.7 | 12.9 | 13.1 | 13.3 | 13.5 | 13.7 | 13.9 |
| Total | 68.4 | 70.4 | 73.4 | 76.7 | 79.7 | 82.9 | 86.0 |
| Major transfers to other levels of government |
|||||||
| Canada Health Transfer | 27.0 | 28.6 | 30.3 | 32.1 | 34.0 | 36.1 | 37.7 |
| Canada Social Transfer | 11.5 | 11.9 | 12.2 | 12.6 | 13.0 | 13.3 | 13.7 |
| Other health and social transfers3 | 0.2 | 0.3 | 0.2 | 0.0 | 0.0 | 0.0 | 0.0 |
| Fiscal arrangements4 | 16.9 | 17.8 | 18.6 | 19.3 | 19.9 | 20.7 | 21.6 |
| Gas Tax Fund5 | 2.2 | 2.1 | 2.0 | 2.0 | 2.0 | 2.1 | 2.1 |
| Other major transfers6 | 2.3 | 1.2 | 0.4 | 0.3 | 0.2 | 0.1 | 0.1 |
| Alternative Payments for Standing Programs7 |
-3.2 | -3.3 | -3.5 | -3.8 | -4.0 | -4.2 | -4.4 |
| Total | 56.8 | 58.5 | 60.3 | 62.5 | 65.1 | 68.2 | 70.8 |
| Direct program expenses | |||||||
| Operating expenses | 76.1 | 80.5 | 76.5 | 74.0 | 75.2 | 75.9 | 77.8 |
| Transfer payments | 38.1 | 36.7 | 37.4 | 37.1 | 36.5 | 37.0 | 36.9 |
| Capital amortization | 4.6 | 4.9 | 5.3 | 5.7 | 6.0 | 6.4 | 6.6 |
| Total | 118.8 | 122.1 | 119.2 | 116.7 | 117.7 | 119.3 | 121.3 |
| Total program expenses | 244.0 | 251.0 | 252.9 | 256.0 | 262.6 | 270.4 | 278.1 |
| Per cent of GDP | |||||||
| Major transfers to persons | 3.9 | 3.9 | 3.9 | 3.9 | 3.9 | 3.9 | 3.9 |
| Major transfers to other levels of government |
3.2 | 3.2 | 3.2 | 3.2 | 3.2 | 3.2 | 3.2 |
| Direct program expenses | 6.7 | 6.7 | 6.4 | 6.0 | 5.8 | 5.6 | 5.5 |
| Total program expenses | 13.8 | 13.8 | 13.6 | 13.2 | 12.9 | 12.7 | 12.5 |
| Note: Totals may not add due to rounding.
1 2011-12 figures have been adjusted to reflect the new accounting standard for tax revenues issued by the Public Sector Accounting Board of the Canadian Institute of Chartered Accountants. 2 EI benefits include regular EI benefits, sickness, maternity, parental, compassionate care, fishing and work-sharing benefits, and employment benefits and support measures. These represent 90 per cent of total EI program expenses. The remaining EI costs relate mainly to administration and are part of operating expenses. 3 Other health and social transfers include the Wait Time Reduction Transfer and other health-related transfers. 4Fiscal arrangements include Equalization, Territorial Formula Financing, the Youth Allowances Recovery and statutory subsidies. 5 The Gas Tax Fund is a component of the Community Improvement Fund. 6 Other major transfers to other levels of government include transitional payments; transfer protection payments in 2011-12, 2012-13 and 2013-14; payments under the 2005 Offshore Accords; and assistance regarding sales tax harmonization. 7 The Alternative Payments for Standing Programs represent a recovery from Quebec of an additional tax point transfer above and beyond the tax point transfer under the Canada Health Transfer and the Canada Social Transfer. |
|||||||
Table 4.2.6 provides an overview of the projections for program expenses by major component, including the measures announced in Economic Action Plan 2013. Program expenses consist of major transfers to persons, major transfers to other levels of government and direct program expenses.
Major transfers to persons consist of elderly, EI and children's benefits.
Elderly benefits are comprised of Old Age Security, Guaranteed Income Supplement and Spousal Allowance payments to qualifying seniors, with Old Age Security payments representing approximately 75 per cent of these expenditures. Elderly benefits are projected to grow from $40.1 billion to $51.8 billion over the projection period, or approximately 5.3 per cent per yearsignificantly faster than nominal GDP, which averages 4.3 per cent growth per year. This increase is due to consumer price inflation, to which elderly benefits are fully indexed, and a projected increase in the seniors population from 5.2 million to 6.2 million over the projection period, or an average increase of 3.5 per cent per year.
EI benefits are projected to decrease slightly to $17.5 billion in 2012-13, as increases in average benefits are offset by the impact of the reduction in the number of unemployed. Over the remainder of the projection period, EI benefits are projected to grow by 3.1 per cent per year on average, reflecting higher average benefits which are only partially offset by lower unemployment.
Children's benefits, including the Canada Child Tax Benefit and the Universal Child Care Benefit, are projected to increase moderately over the forecast horizon, reflecting population growth and adjustments for inflation.
Major transfers to other levels of government include transfers in support of health and social programs, Equalization and Territorial Formula Financing (TFF), among others. The Canada Health Transfer (CHT) will grow from $28.6 billion in 2012-13 to $37.7 billion in 2017-18, exceeding the current growth rate of provincial health care spending. Starting in 2017-18, the CHT will grow in line with a three-year moving average of nominal GDP growth, with funding guaranteed to increase by at least 3 per cent per year. The Canada Social Transfer (CST) will continue to grow at 3 per cent per year. The Government has also confirmed that Nova Scotia has qualified for an extension of its 2005 offshore arrangements for the eight-year period up to March 31, 2020.
Economic Action Plan 2013 reaffirms the Government's commitment to continued, predictable and fiscally sustainable growth in the CHT, CST, Equalization and TFF. In light of the expiry of current legislation governing the Equalization and TFF programs on March 31, 2014, federal, provincial and territorial officials undertook a review of these programs. At the conclusion of this review, a small set of technical improvements was announced at the federal, provincial and territorial Finance Ministers Meeting in December 2012. The Government will introduce legislation to implement its commitments related to transfer renewal and growth.
Other major transfers to other levels of government include transitional assistance for sales tax harmonization to the Government of Prince Edward Island in 2012-13 as well as total transfer protection payments to provinces in 2011-12, 2012-13 and 2013-14.
Direct program expenses are broadly stable over the forecast horizon, with spending falling from $122.1 billion in 2012-13 to $116.7 billion in 2014-2015, then rising to $121.3 billion in 2017-18. As a share of GDP, direct program expenses decline over the projection period from 6.7 per cent in 2012-13 to 5.5 per cent in 2017-18.
Direct program expenses include operating expenses, transfers administered by departments and capital amortization.
Operating expenses reflect the costs of doing business for more than 100 government departments and agencies, including National Defence. This category includes expenses such as leasing and utility costs; wages, salaries, and benefits of federal employees; and the costs for materials and supplies. Expenses of consolidated Crown corporations are also included in this category.
These expenses are broadly stable over the forecast horizon, with spending decreasing from $80.5 billion in 2012-13 to $74.0 billion in 2014-15, then rising to $77.8 billion in 2017-18. The decrease in the early years of the forecast is largely attributable to departmental spending reductions implemented in earlier budgets. As a share of GDP, operating expenses decline over the projection period from 4.4 per cent in 2012-13 to 3.5 per cent in 2017-18.
Transfer payments, which include assistance to farmers, students and businesses as well as support for infrastructure, are stable over the forecast horizon.
Amounts for capital expenses are presented on an accrual basis. The amount of capital amortization is expected to increase over the next five years as a result of new investments and upgrades to existing capital.
Savings Measures Achieved Since Budget 2010
Following the successful stimulus phase of Canada's Economic Action Plan to counter the effects of the global recession, Budget 2010 and subsequent budgets, including Economic Action Plan 2013, have introduced significant actions in order to achieve a return to balanced budgets by 2015-16.
As illustrated in Table 4.2.7, these savings measures will have improved the budgetary balance by approximately $15.8 billion annually by 2015-16 and beyond and result in cumulative savings of more than $84 billion over the 2010-11 to 2017-18 period. Over 75 per cent of these savings have resulted from measures to control direct program spending.
| Projection | |||||||||
|---|---|---|---|---|---|---|---|---|---|
| 2010- 2011 |
2011- 2012 |
2012- 2013 |
2013- 2014 |
2014- 2015 |
2015- 2016 |
2016- 2017 |
2017- 2018 |
Total | |
| Budget 2010 | |||||||||
| Spending restraint | 452 | 1,586 | 3,481 | 4,425 | 5,130 | 5,130 | 5,130 | 5,130 | 30,464 |
| Closing tax loopholes | 260 | 350 | 420 | 455 | 475 | 505 | 515 | 530 | 3,510 |
| Total for Budget 2010 | 712 | 1,936 | 3,901 | 4,880 | 5,605 | 5,635 | 5,645 | 5,660 | 33,974 |
| Budget 2011 | |||||||||
| Spending restraint | 194 | 271 | 569 | 525 | 534 | 534 | 534 | 3,161 | |
| Closing tax loopholes | 255 | 750 | 1,115 | 1,060 | 1,010 | 1,135 | 440 | 5,765 | |
| Total for Budget 2011 | 449 | 1,021 | 1,684 | 1,585 | 1,544 | 1,669 | 974 | 8,926 | |
| Economic Action Plan 2012 | |||||||||
| Spending restraint | -900 | 1,762 | 3,481 | 5,332 | 5,175 | 5,219 | 5,222 | 25,290 | |
| Closing tax loopholes | 90 | 271 | 386 | 441 | 526 | 671 | 2,385 | ||
| Total for Economic Action Plan 2012 | -900 | 1,852 | 3,752 | 5,718 | 5,616 | 5,745 | 5,893 | 27,675 | |
| 2012 Update of Economic and Fiscal Projections | |||||||||
| Spending restraint | 341 | 572 | 791 | 999 | 1,231 | 1,436 | 5,370 | ||
| Subtotal: Savings announced prior to Economic Action Plan 2013 | 712 | 1,485 | 7,115 | 10,888 | 13,698 | 13,794 | 14,290 | 13,962 | 75,945 |
| Economic Action Plan 2013 | |||||||||
| Spending restraint | 68 | 114 | 145 | 145 | 145 | 617 | |||
| CRA compliance programs | 30 | 125 | 550 | 550 | 550 | 550 | 2,355 | ||
| Tax fairness and closing tax loopholes |
2 | 316 | 806 | 946 | 1,082 | 1,237 | 4,389 | ||
| General Preferential Tariff | 83 | 333 | 333 | 333 | 1,082 | ||||
| Total for Economic Action Plan 2013 |
32 | 509 | 1,554 | 1,974 | 2,110 | 2,265 | 8,443 | ||
| Total spending restraint | 452 | 880 | 5,855 | 9,115 | 11,892 | 11,983 | 12,259 | 12,466 | 64,902 |
| Total revenue measures1 | 260 | 605 | 1,292 | 2,282 | 3,360 | 3,785 | 4,141 | 3,761 | 19,486 |
| Grand Total | 712 | 1,485 | 7,147 | 11,397 | 15,252 | 15,768 | 16,400 | 16,227 | 84,389 |
| % of GDP | 0.0% | 0.1% | 0.4% | 0.6% | 0.8% | 0.8% | 0.8% | 0.7% | |
| Note: Totals may not add due to rounding.
1 Includes measures to improve the fairness and neutrality of the tax and tariff systems as well as the Canada Revenue Agency's compliance programs. |
|||||||||
An element of controlling direct program spending was the introduction of an operating budget freeze in Budget 2010. For 2011-12 and 2012-13, operating budgets of departments, as appropriated by Parliament, were frozen at 2010-11 levels. Some expenses subject to the operating freeze included: wages and salaries of federal employees; professional services contracts; telecommunications; and costs for materials and supplies. Along with planned reductions in departmental spending, the operating freeze was successful in containing administrative costs. The operating freeze contained the growth in operating expenses by forcing departments to find efficiencies to offset cost pressures occurring within their operations. At the same time, planned reductions in departmental spending lowered the overall level of operating expenses. Overall, operating expenses subject to freeze are estimated to be $54.5 billion in 2012-13, slightly below the $54.7 billion recorded in 2010-11.
The targeted savings achieved since Budget 2010 have strengthened the fiscal position of the Government. Chart 4.2.5 shows program expenses as a share of GDP. The stimulus phase of Canada's Economic Action Plan, which strengthened Canada's economy and supported Canadians during the global recession, resulted in a temporary increase in the program expenses-to-GDP ratio. However, as a result of the targeted savings measures achieved since Budget 2010, as well as additional measures to be implemented through Economic Action Plan 2013, program expenses as a share of GDP are projected to decline in all years of the forecast horizon.
As a share of GDP, program expenses are projected to decline from 13.8 per cent in 2011-12 to 12.5 per cent in 2017-18, which represents a return to pre-recession spending ratios.
Program expenses-to-GDP ratio to return to its pre-recession level
Chart 4.2.5 Program Expenses-to-GDP Ratio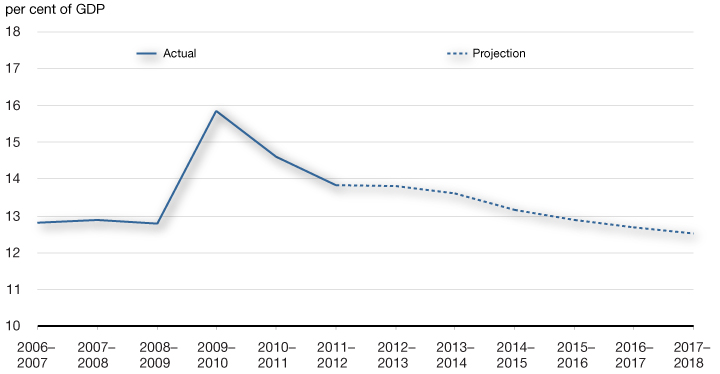
Financial Source/Requirement
The budgetary balance is presented on a full accrual basis of accounting, recording government revenues and expenses when they are earned or incurred, regardless of when the cash is received or paid.
In contrast, the financial source/requirement measures the difference between cash coming in to the Government and cash going out. This measure is affected not only by the budgetary balance but also by the Government's non-budgetary transactions. These include changes in federal employee pension accounts; changes in non-financial assets; investing activities through loans, investments and advances; changes in other financial assets and liabilities; and foreign exchange activities.
| Projection | |||||||
|---|---|---|---|---|---|---|---|
| 2011-12 | 2012-13 | 2013-14 | 2014-15 | 2015-16 | 2016-17 | 2017-18 | |
| Budgetary balance | -26.2 | -25.9 | -18.7 | -6.6 | 0.8 | 3.9 | 5.1 |
| Non-budgetary transactions | |||||||
| Pensions and other accounts | 5.7 | 7.5 | 7.1 | 6.1 | 4.5 | 3.7 | 2.8 |
| Non-financial assets | -1.4 | -2.4 | -2.2 | -1.2 | -1.4 | -1.0 | -0.8 |
| Loans, investments and advances | |||||||
| Enterprise Crown corporations | -4.0 | -6.2 | -4.4 | -4.7 | -5.6 | -5.2 | -5.1 |
| Insured Mortgage Purchase Program | 3.4 | 2.9 | 41.3 | 10.6 | 0.0 | 0.0 | 0.0 |
| Other | 0.6 | -0.5 | -0.4 | -0.5 | -0.4 | -0.6 | -0.5 |
| Total | 0.0 | -3.7 | 36.5 | 5.4 | -5.9 | -5.7 | -5.5 |
| Other transactions | -10.5 | -3.3 | -0.9 | 1.2 | 1.7 | 1.8 | 2.0 |
| Total | -6.2 | -1.9 | 40.5 | 11.5 | -1.1 | -1.2 | -1.5 |
| Financial source/requirement | -32.4 | -27.8 | 21.8 | 4.9 | -0.3 | 2.7 | 3.6 |
| Note: Totals may not add due to rounding. | |||||||
As shown in Table 4.2.8, a financial requirement of $27.8 billion is projected in 2012-13, followed by financial sources of $21.8 billion in 2013-14 and $4.9 billion in 2014-15, a financial requirement of $0.3 billion in 2015-16 and financial sources of $2.7 billion in 2016-17 and $3.6 billion in 2017-18. The requirement in 2012-13 mainly reflects the budgetary deficit, whereas the financial sources expected in 2013-14 and 2014-15 mainly reflect the repayment of principal on assets maturing under the Insured Mortgage Purchase Program. The financial sources expected over the 2016-17 to 2017-18 period mainly reflect the improvement in the budgetary balance.
The financial source associated with pensions and other accounts is expected to be $7.1 billion in 2013-14. Pensions and other accounts include the activities of the Government of Canada's employee superannuation plans, as well as those of federally appointed judges and Members of Parliament. Since April 2000, the net amount of contributions less benefit payments related to post-March 2000 service has been invested in capital markets. Contributions and payments pertaining to pre-April 2000 service are recorded in the pension accounts. The Government also sponsors a variety of future benefit plans, such as health care and dental plans and disability and other benefits for war veterans and others.
Financial requirements for non-financial assets mainly reflect the difference between cash outlays for the acquisition of new tangible capital assets and the amortization of capital assets included in the budgetary balance. They also include disposals of tangible capital assets and changes in inventories and prepaid expenses. A net cash requirement of $2.2 billion is estimated for 2013-14.
Loans, investments and advances include the Government's investments in enterprise Crown corporations, such as Canada Mortgage and Housing Corporation (CMHC), Canada Post Corporation, Export Development Canada and the Business Development Bank of Canada (BDC). They also include loans, investments and advances to national and provincial governments and international organizations, and for government programs. The requirements for enterprise Crown corporations projected from 2013-14 to 2017-18 reflect the Government's decision in Budget 2007 to meet all the borrowing needs of CMHC, BDC and Farm Credit Canada through its own domestic debt issuance, as well as retained earnings of enterprise Crown corporations. The financial source in the projection period under the Insured Mortgage Purchase Program is due to the winding down in March 2010 of purchases of insured mortgage pools under the plan and the subsequent repayments of principal as the assets under the plan mature.
Other transactions include the payment of tax refunds and other accounts payable, the collection of taxes and other accounts receivable, the conversion of other accrual adjustments included in the budgetary balance into cash, as well as foreign exchange activities. A portion of the $0.9 billion net cash requirement in 2013-14 reflects investments in financial assets to improve prudential liquidity management, announced as part of the prudential liquidity plan in Budget 2011.
Risks to the Fiscal Projections
Risks to the economic outlook are the greatest source of uncertainty to the fiscal projections. To help illustrate how the fiscal outlook could be affected by changes in the economic outlook, tables illustrating the sensitivity of the budgetary balance to a number of economic shocks are provided below.
Beyond the economic outlook, there remain upside and downside risks associated with the fiscal projections, as several key drivers of the fiscal outlook are not directly linked to economic variables (such as the relationship between personal income taxes and personal income or the extent to which departments and agencies do not fully use all of the resources appropriated by Parliament).
Sensitivity of the Budgetary Balance to Economic Shocks
Changes in economic assumptions affect the projections for revenues and expenses. The following tables illustrate the sensitivity of the budgetary balance to a number of economic shocks:
- A one-year, 1-percentage-point decrease in nominal GDP growth due to:
- A 1-percentage-point decrease in real GDP growth driven equally by lower productivity and employment growth.
- A 1-percentage-point decrease in the rate of GDP inflation.
- A sustained 100-basis-point increase in all interest rates.
These sensitivities are generalized rules of thumb and are meant to provide a broad illustration of the impact of economic shocks on the outlook for the budgetary balance. Actual economic shocks may have different fiscal impacts. For example, they may be concentrated in specific sectors of the economy or cause different responses in key economic variables.
| Year 1 | Year 2 | Year 5 | |
|---|---|---|---|
| Federal revenues | |||
| Tax revenues | |||
| Personal income tax | -2.2 | -2.4 | -2.8 |
| Corporate income tax | -0.3 | -0.4 | -0.4 |
| Goods and Services Tax | -0.3 | -0.4 | -0.4 |
| Other | -0.1 | -0.1 | -0.2 |
| Total tax revenues | -3.0 | -3.3 | -3.8 |
| Employment Insurance premiums | -0.2 | -0.2 | -0.2 |
| Other revenues | 0.0 | -0.1 | -0.1 |
| Total budgetary revenues | -3.2 | -3.5 | -4.1 |
| Federal expenses | |||
| Major transfers to persons | |||
| Elderly benefits | 0.0 | 0.0 | 0.0 |
| Employment Insurance benefits | 0.7 | 0.8 | 0.9 |
| Children's benefits | 0.0 | 0.0 | 0.1 |
| Total | 0.7 | 0.8 | 1.0 |
| Other program expenses | -0.1 | -0.1 | -0.2 |
| Public debt charges | 0.0 | 0.1 | 0.7 |
| Total expenses | 0.6 | 0.8 | 1.5 |
| Budgetary balance | -3.8 | -4.3 | -5.6 |
| Note: Totals may not add due to rounding. | |||
A 1-percentage-point decrease in real GDP growth proportional across income and expenditure components reduces the budgetary balance by $3.8 billion in the first year, $4.3 billion in the second year and $5.6 billion in the fifth year (Table 4.2.9).
- Tax revenues from all sources fall by a total of $3.0 billion in the first year and by $3.3 billion in the second year. Personal income tax revenues decrease as employment and wages and salaries fall. Corporate income tax revenues fall as output and profits decrease. GST revenues decrease as a result of lower consumer spending associated with the fall in employment and personal income.
- EI premium revenues decrease as employment and wages and salaries fall. In order to isolate the direct impact of the economic shock and provide a general overview of the fiscal impacts, the EI premium revenue impacts do not include changes in the premium rate that would be necessary to bring the EI Operating Account back into balance, as the rate changes would be very sensitive to the timing of the shock and cumulative balance in the Account.
- Expenses rise, mainly reflecting higher EI benefits (due to an increase in the number of unemployed) and higher public debt charges (reflecting a higher stock of debt due to the lower budgetary balance). This rise is partially offset by lower other program expenses (as certain programs are tied directly to growth in nominal GDP).
| Year 1 | Year 2 | Year 5 | |
|---|---|---|---|
| Federal revenues | |||
| Tax revenues | |||
| Personal income tax | -2.2 | -1.8 | -2.1 |
| Corporate income tax | -0.3 | -0.4 | -0.4 |
| Goods and Services Tax | -0.3 | -0.3 | -0.4 |
| Other | -0.1 | -0.1 | -0.2 |
| Total tax revenues | -3.0 | -2.6 | -3.0 |
| Employment Insurance premiums | -0.1 | -0.2 | -0.2 |
| Other revenues | -0.1 | -0.1 | -0.1 |
| Total budgetary revenues | -3.1 | -2.9 | -3.3 |
| Federal expenses | |||
| Major transfers to persons | |||
| Elderly benefits | -0.3 | -0.5 | -0.6 |
| Employment Insurance benefits | -0.1 | -0.1 | -0.1 |
| Children's benefits | 0.0 | 0.0 | -0.1 |
| Total | -0.4 | -0.6 | -0.8 |
| Other program expenses | -0.3 | -0.3 | -0.8 |
| Public debt charges | -0.4 | 0.1 | 0.3 |
| Total expenses | -1.1 | -0.9 | -1.3 |
| Budgetary balance | -2.0 | -2.0 | -2.0 |
| Note: Totals may not add due to rounding. | |||
A 1-percentage-point decrease in nominal GDP growth proportional across income and expenditure components resulting solely from lower GDP inflation (assuming that the Consumer Price Index moves in line with GDP inflation) lowers the budgetary balance by $2.0 billion in the first year, $2.0 billion in the second year and $2.0 billion in the fifth year (Table 4.2.10).
- Lower prices result in lower nominal income and, as a result, personal income tax revenues decrease, reflecting declines in the underlying nominal tax base. As the parameters of the personal income tax system are indexed to inflation and automatically adjust in response to the shock, the fiscal impact is smaller than under the real shock. For the other sources of tax revenue, the negative impacts are similar under the real and nominal GDP shocks.
- EI premium revenues, absent any change in the premium rate, decrease marginally in response to lower earnings. In order to isolate the direct impact of the economic shock and provide a general overview of the fiscal impacts, the EI premium revenue impacts do not include changes in the premium rate that would be necessary to bring the EI Operating Account back into balance, as the rate changes would be very sensitive to the timing of the shock and cumulative balance in the Account. EI benefits decline slightly due to lower average benefits.
- Other revenues decline slightly as lower prices reduce revenues from the sales of goods and services.
- Partly offsetting lower revenues are the declines in the cost of statutory programs that are indexed to inflation, such as elderly benefit payments and the Canada Child Tax Benefit, and downward pressure on federal program expenses. In addition, other program expenses are also lower as certain programs are tied directly to growth in nominal GDP.
- Public debt charges decline in the first year due to lower costs associated with Real Return Bonds, then rise due to the higher stock of debt.
| Year 1 | Year 2 | Year 5 | |
|---|---|---|---|
| Federal revenues | 1.2 | 1.6 | 2.2 |
| Federal expenses | 1.7 | 2.9 | 4.1 |
| Budgetary balance | -0.5 | -1.3 | -1.8 |
| Note: Totals may not add due to rounding. | |||
An increase in interest rates decreases the budgetary balance by $0.5 billion in the first year, $1.3 billion in the second year and $1.8 billion in the fifth year (Table 4.2.11). The decline stems entirely from increased expenses associated with public debt charges. The impact on debt charges rises through time as longer-term debt matures and is refinanced at higher rates. Moderating the overall impact is an increase in revenues associated with the increase in the rate of return on the Government's interest-bearing assets, which are recorded as part of other revenues. The impacts of changes in interest rates on public sector pension and benefit expenses are excluded from the sensitivity analysis.