

Archived information
Archived information is provided for reference, research or recordkeeping purposes. It is not subject to the Government of Canada Web Standards and has not been altered or updated since it was archived. Please contact us to request a format other than those available.
Chapter 2: Economic Developments and Prospects
Highlights
- The Canadian economy has experienced the best performance among the Group of Seven (G-7) countries over the recovery, with the strongest record of economic growth and job creation.
- Over 950,000 more Canadians are working now than at the end of the recession, the strongest job growth among G-7 countries over this period. This continues the strong performance that has resulted in close to 1.5 million net new jobs created since the beginning of 2006.
- Canada’s strong economic performance has in part been fuelled by business investment. Canada is the only G-7 country to have more than fully recovered business investment lost during the recession.
- However, global economic growth weakened in the second half of 2012. While the possibility of severe negative shocks has diminished somewhat, there are still some risks that continue to weigh on the global economy.
- Although the Canadian economy remained resilient in 2012, weak economic conditions throughout the world have led to decreased demand for Canadian products and affected Canada through lower exports and commodity prices.
- Further, overall export prices received by Canadian commodity producers are now slightly lower than at the time of the November 2012 Update of Economic and Fiscal Projections (Fall Update), reflecting a wider gap between prices received by Canadian crude oil exporters and global benchmarks.
- Indeed, lower prices for Canadian crude oil, as well as for natural gas, relative to global benchmarks are reducing gross domestic product (GDP) by about $28 billion per year, translating into over $4 billion annually in potential federal government revenues.
- The Department of Finance conducted a survey of private sector economists in early March 2013. On March 8, economists met with the Minister of Finance to discuss the economic forecast as well as the risks associated with the economic outlook.
- The private sector economists agreed that the average forecast from the March survey was a reasonable basis for fiscal planning.
- Private sector economists expect real GDP growth of 1.6 per cent in 2013, which is lower than at the time of the Fall Update. However, upward revisions to subsequent years leave the average outlook for real GDP growth over the 2013-2017 forecast period unchanged since the Fall Update.
- The economists expect lower inflation in 2013, reflecting recent softness in domestic prices.
- As a result, the outlook for the level of nominal GDP—the broadest single measure of the tax base—is almost $20 billion lower on average over the forecast period than anticipated at the time of the Fall Update.
- Consistent with the expectations of slower growth, the economists have revised down their outlook for interest rates over the forecast period, reducing the cost of servicing Canada's debt.
- Private sector economists agreed that near-term downside risks to the outlook have moderated somewhat since the Fall Update, but they continue to see global economic uncertainty related to the euro area sovereign debt and banking crisis and ongoing concerns over U.S. fiscal policy as the key downside risks.
- To reflect the negative risks to the global economic outlook, the Government is adjusting downward the private sector forecast for nominal GDP.
Notes: This chapter incorporates data available up to and including March 13, 2013, unless otherwise indicated. All rates are reported at annual rates unless otherwise noted.
Introduction
Almost five years after the global recession, the global economic environment remains fragile. The euro area is once again in recession and considerable risk remains over the region’s ability to follow through with needed reforms. In addition, uncertainty regarding U.S. fiscal policy continues to weigh on growth prospects.
Nonetheless, the Canadian economy continues to expand, albeit at a modest pace, enjoying the best performance among G-7 countries over the recovery. Since the end of the global recession, over 950,000 new jobs have been created in Canada, and economic growth has been driven by a strong domestic economy, including robust business investment. As a result, Canada is the only G-7 country to have more than recovered the business investment lost during the recession.
However, Canada is not immune to external developments. Growth in the second half of 2012 was dampened by weaker growth in advanced economies, and the private sector forecast for real GDP continues to point to modest growth ahead.
Further, Canada continues to suffer from limited access to global markets, particularly for our energy exports. This has resulted in lower prices for Canadian exports of crude oil and natural gas than those prevailing outside North America, which is having a significant negative impact on economic activity and government revenues.
This chapter reviews major global and Canadian economic developments since the 2012 Fall Update, presents the March 2013 private sector economic forecast that forms the basis for the fiscal projections, and discusses the risks and uncertainties surrounding this economic forecast.
Global Economic Developments and Outlook
Policy actions have helped to diminish downside risks to the global economy, as euro area leaders have made some progress containing the sovereign debt and banking crisis, while U.S. authorities reached an agreement to avert more than half of the ‘‘fiscal cliff”. This has led to some improvement in financial markets. Nonetheless, the global economy remains fragile, with growth in advanced economies slower than expected at the time of the 2012 Fall Update, particularly in the last quarter of 2012.
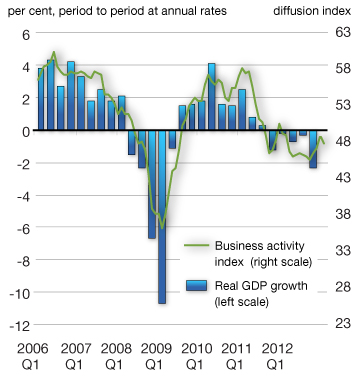
The euro area is once again in recession, while the United Kingdom has seen economic activity contract in four of the last five quarters. Euro area real GDP contracted by 2.3 per cent in the fourth quarter of 2012, and revised data show that the euro area economy has now contracted for five consecutive quarters (Chart 2.1). Economic output is now 3.0 per cent below its peak reached prior to the 2008-2009 recession. Among the region’s 17 member countries, eight are currently in recession (including Italy, Spain, Greece and Portugal), while the largest economies—Germany and France—saw economic activity contract in the fourth quarter. Moreover, survey data on business activity suggest that euro area real GDP will contract again in the first quarter of 2013.
Private sector forecasters expect the euro area to return to weak positive growth by the second half of 2013, although they expect real GDP to contract modestly for the year as a whole. This outcome is based on the assumption that the sovereign debt and banking crisis continues to be contained.
Some further progress has been made on policy measures to contain the euro area sovereign debt and banking crisis, most importantly the announcement by the European Central Bank last September that it will purchase the sovereign debt of stressed euro area countries that commit to an adjustment program, as well as the successful renegotiation of the Greek bailout plan, an agreement to create a common bank supervisory framework, and the establishment of plans for significant fiscal and structural reform. European markets have reacted favourably, with notable gains in equity prices, as well as a fall in government bond yields for at-risk euro area countries (Chart 2.1). However, problems remain within the euro area, which could lead to a renewed flare-up of the region’s crisis. These include a still-fragile banking system, particularly in Spain and Cyprus, which continues to impair lending to the private sector; slower-than-expected progress on achieving deeper and longer-term economic and fiscal integration, notably with respect to a banking union; and political uncertainty in Italy.
Policy actions have reduced the risk of a severe negative outcome but the euro area recession continues
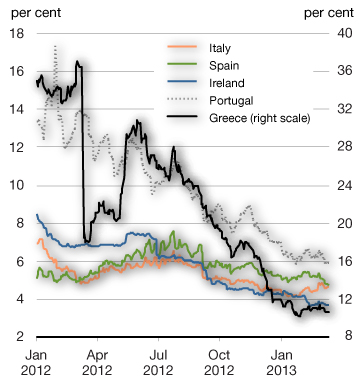
Notes: The series for Ireland is the 8-year government bond rate. Daily data up to and including March 13, 2013.
In the United States, the modest recovery has continued, with growth averaging slightly over 2 per cent per quarter since the second half of 2009. Although economic activity in the fourth quarter of 2012 remained virtually unchanged, rising by just 0.1 per cent, this reflected a reversal of temporary factors that boosted third-quarter growth (including a rise in inventories and a significant increase in government defence expenditures), as well as some modest negative impacts from Hurricane Sandy, which masked underlying healthy spending by U.S. consumers and businesses.
There are signs that some of the headwinds that have restrained U.S. growth over the recovery are beginning to abate. In particular, the housing market continues to recover, as house prices have risen for 11 consecutive months following almost two years of declines, while housing starts have increased sharply in recent months (Chart 2.2). As well, households have continued to make progress in repairing their balance sheets, as the debt-to-income ratio has fallen to its lowest level since the end of 2002, while net worth as a percentage of disposable income has continued to rise.
The U.S. housing market is picking up and household balance sheets continue to improve
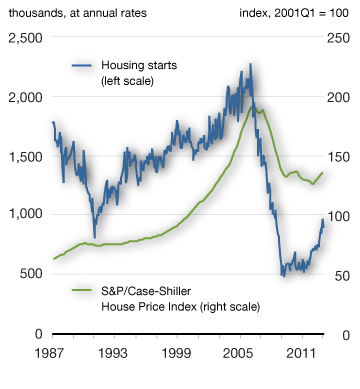
Note: Last data point is 2012Q4 for house prices and January 2013 for housing starts.
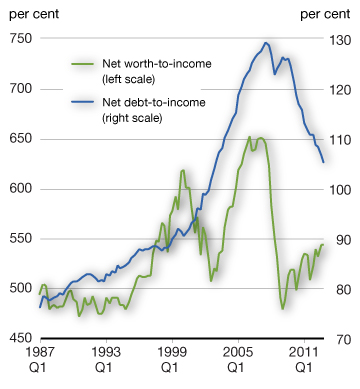
Notes: Last data point is 2012Q4. U.S. balance sheet ratios include the unincorporated business sector and are therefore not comparable to Canada.
The U.S. Federal Reserve continues to provide substantial policy accommodation. At its December meeting, the Fed announced plans to purchase a further US$45 billion per month in Treasury securities (effectively replacing “Operation Twist” that recently ended), in addition to the ongoing purchases of US$40 billion per month of mortgage-backed securities. It also indicated that it does not expect to increase its policy rate at least as long as the unemployment rate remains above 6.5 per cent, provided projected inflation over the following two years is no more than 2.5 per cent and longer-term inflation expectations remain well anchored at 2 per cent. The March 2013 private sector survey shows that the Fed is not expected to begin raising rates until the first half of 2015.
In addition, on January 1, 2013, U.S. authorities reached an agreement to avert more than half of the ‘‘fiscal cliff’’—a number of tax increases and spending reduction measures representing about 4 per cent of U.S. GDP, which were scheduled to come into force automatically at the beginning of 2013. The agreement implies a fiscal tightening of about 1.5 per cent of GDP in 2013, indicating that fiscal policy will continue to weigh on U.S. growth this year. The agreement was in line with what private sector economists had been expecting, and consequently forecasters continue to anticipate growth of about 2 per cent for 2013, broadly unchanged from their expectations in the 2012 Fall Update. As well, authorities reached agreement in late January 2013 to temporarily suspend the statutory U.S. federal debt limit.
Although these agreements have diminished risks regarding U.S. fiscal policy, significant uncertainty still remains. In the near term, automatic spending reductions (known as ‘‘sequestration”) representing about 0.4 per cent of GDP in 2013 formally took effect on March 1, after authorities failed to reach agreement to avert them. [1] This will weigh on U.S. growth over the near term. However, an agreement may be reached in the coming weeks to delay or soften the sequestration. Another source of near-term uncertainty stems from the expiry on March 27 of spending authority for federal agencies, although there have been positive signs recently that an agreement would be reached to avoid a shutdown of non-essential government operations. As well, the federal debt limit will have to be raised again by mid-Summer, which could negatively impact the economy by weakening confidence and creating volatility in financial markets.
Beyond the near term, the fiscal risk in the U.S. relates to the need to develop a credible medium-term plan to reduce the federal debt burden. According to the Congressional Budget Office’s baseline projection, the U.S. federal debt ratio will remain relatively stable for the next decade, at more than double its pre-crisis level. However, in the absence of further actions, the debt ratio is expected to begin rising again thereafter, as age-related expenditures are expected to pick up and a projected rise in interest rates results in higher debt service costs. This could lead to a rise in uncertainty and a fall in confidence, inducing U.S. households and businesses to reduce spending and investment, with harmful effects on the U.S. and global economies.
Looking ahead, U.S. growth is expected to remain modest in the first half of this year. However, growth is expected to pick up to an above-trend pace in the second half of the year. This acceleration should be driven by a continued recovery in the housing market, as excess supply has narrowed significantly, affordability is very good, and mortgage lending standards are expected to gradually ease. U.S. growth should also be helped by a pickup in consumer spending, reflecting progress in reducing household debt levels, rising house prices and an improving labour market. Overall, private sector forecasters expect U.S. real GDP growth of 1.9 per cent in 2013, rising to 2.9 per cent in 2014 (Chart 2.3).
U.S. growth is expected to remain modest in 2013, but pick up in 2014
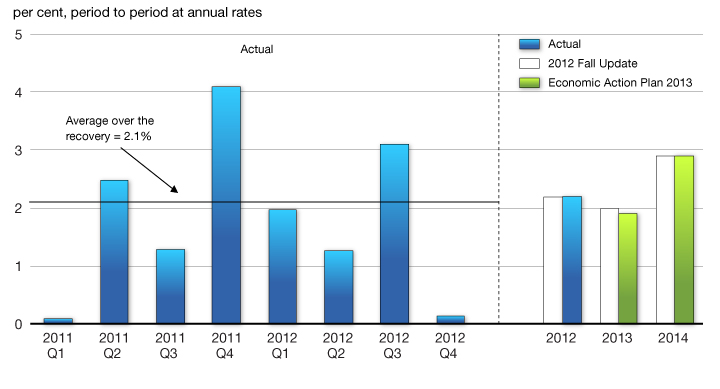
Sources: U.S. Bureau of Economic Analysis; Department of Finance October 2012 and March 2013 surveys of private sector economists.
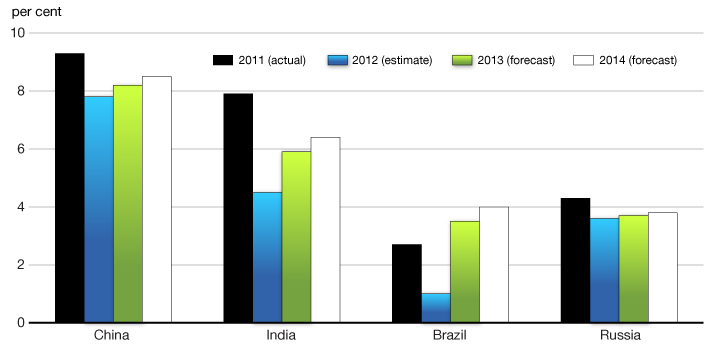
In emerging and developing economies, including the BRIC countries—Brazil, Russia, India and China—the pace of economic activity is expected to improve in 2013 from its relatively weak pace in 2012 (Chart 2.4). In China, economic growth strengthened over the course of 2012, due in part to the introduction of modest monetary and fiscal stimulus by the Chinese authorities last year. Growth in 2013 is expected to be slightly stronger than last year, reflecting a gradual improvement in external demand as the euro area economic situation stabilizes and U.S. growth picks up to an above-trend pace.
In India, policy reforms introduced last Fall have helped to restore investors’ confidence and avoid a ratings downgrade, while the central bank cut its policy rate by 25 basis points in late January in response to persistent weakness in aggregate demand and lower inflation. In Brazil, the central bank has gradually lowered its benchmark rate by a total of 525 basis points since mid-2011 in response to faltering growth, while the government has deployed targeted consumer tax rebates and investment and credit measures, all of which are expected to support economic activity in 2013. In Russia, economic activity is expected to remain moderate, although further structural reforms to diversify the economy and strengthen the investment climate will help improve growth prospects. However, in addition to external risks, there are downside risks to the outlook for the BRIC countries if domestic demand does not strengthen as expected.
Growth in the BRICs is expected to pick up modestly
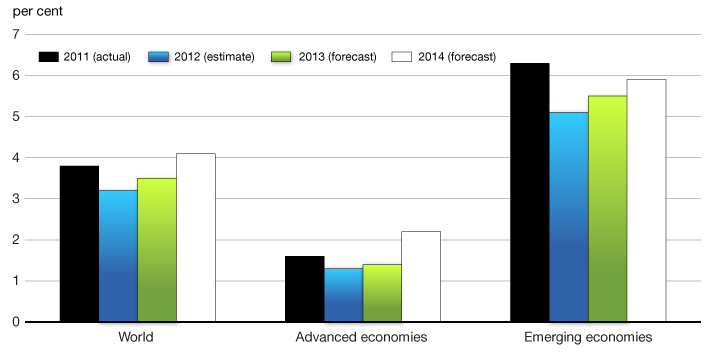
Overall, weakness in the euro area and only a modest pace of recovery in the U.S. are expected to continue to weigh on global growth in the first half of the year. For 2013, global growth is expected to be slightly weaker than expected at the time of the 2012 Fall Update, mainly reflecting the deeper and longer-than-expected downturn in the euro area. However, the pace of global growth is expected to pick up modestly in the second half of the year as the euro area returns to weak positive growth and U.S. growth strengthens. Overall, the IMF projects real global GDP growth to pick up from 3.2 per cent in 2012 to 3.5 per cent this year and to 4.1 per cent in 2014 (Chart 2.5).
Global growth is expected to gradually improve this year and next
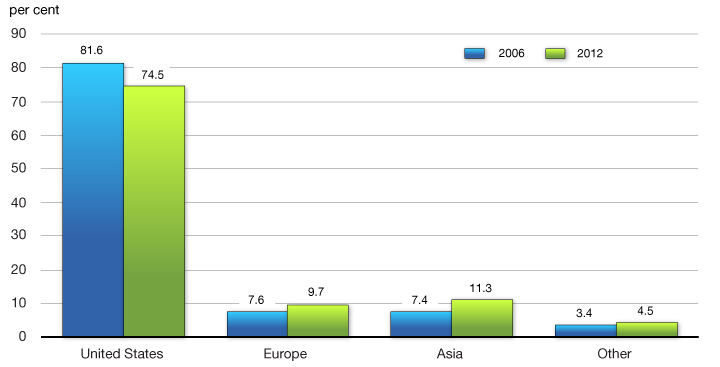
The slowdown in growth in advanced economies, particularly in the U.S., underscores the need for Canada to build on its recent success in diversifying its export markets. Since 2006, Canada’s exports of goods to the U.S. have decreased by 5.7 per cent. Canada’s goods exports have increased by 57 per cent to Asia, 31 per cent to Europe and 36 per cent to the rest of the world. As a result, the share of Canada’s total exports to the U.S. has declined since 2006, while those to Asia and Europe have risen (Chart 2.6). With growth in the U.S. expected to remain relatively modest going forward, it is clear that Canada will need to continue to increase its exports to other markets, such as Asia and Europe, to foster growth in coming years. Diversifying trade will help Canada access a broader range of new and growing markets.
Canada must continue to diversify its export markets to foster growth in coming years
Financial Market Developments
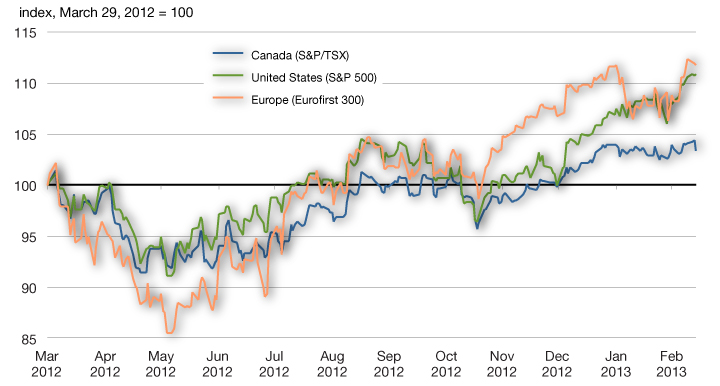
Global financial market conditions have improved since the Summer of 2012, reflecting the important policy actions taken by policy makers in Europe and the United States (Chart 2.7). In particular, the September announcement by the European Central Bank of the ‘‘Outright Monetary Transactions” measures (its plan to purchase sovereign bonds of stressed euro area countries that commit to an adjustment program), coupled with the December agreement by euro area finance ministers to disburse funds to Greece, has resulted in a rebound in equities on European financial markets. Despite this recent increase, European equity market indexes remain over 30 per cent below their pre-recession levels, in large part reflecting the ongoing fundamental issues of weak growth and high public debt that are underpinning the euro area sovereign debt and banking crisis.
North American equity markets have also benefitted from easing global uncertainty associated with the euro area crisis, with both Canadian and U.S. equity indexes gaining ground since last Fall. U.S. equities were further boosted by the avoidance of more than half of the U.S. “fiscal cliff”in early January, leaving the S&P 500 index 6 per cent above its pre-recession level. Canadian equity price growth has been more muted, however, in part reflecting weakness in energy sector equity prices due to declines in Canadian crude oil prices since last Fall (see the following section on commodity price developments for further details).
These positive policy steps have also been reflected in lower government bond yields for at-risk euro area countries. In particular, yields on Spanish government bonds have declined by over 280 basis points since the Summer of 2012, while those for Italy have declined by about 190 basis points. This has also been reflected in modestly higher government bond yields for Germany, the U.S. and Canada, partially offsetting the flight to quality which drove bond rates for these governments to historical lows in mid-2012.
Financial markets have regained some ground since the 2012 Fall Update
Source: Bloomberg.
Commodity Prices
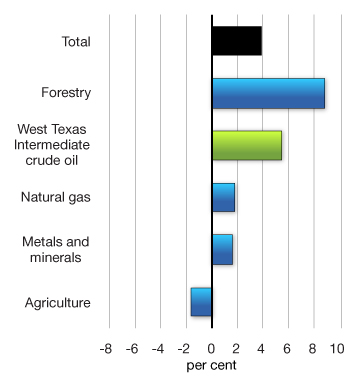
In conjunction with the improvement in global equity markets, global commodity prices have climbed by about 4 per cent since the time of the 2012 Fall Update (Chart 2.8). In particular, global crude oil prices have gained ground, as have prices for many base metals and minerals, reflecting solid demand from emerging economies and signs of reduced financial market instability related to euro area and U.S. fiscal concerns. In addition, ongoing signs of renewed strength in the U.S. housing market have supported lumber prices, which continue to rebound from record lows seen during the recession. Agriculture prices, which rose through much of 2012, in part reflecting U.S.-drought-driven grain price increases, have declined modestly since the Fall of 2012, albeit from relatively high levels. While natural gas prices have risen modestly since the time of the Fall Update, they remain very low relative to historical averages, reflecting significant increases in U.S. supplies of shale gas.
Prices for global commodities have risen since the 2012 Fall Update but remain volatile
(in U.S. dollars)
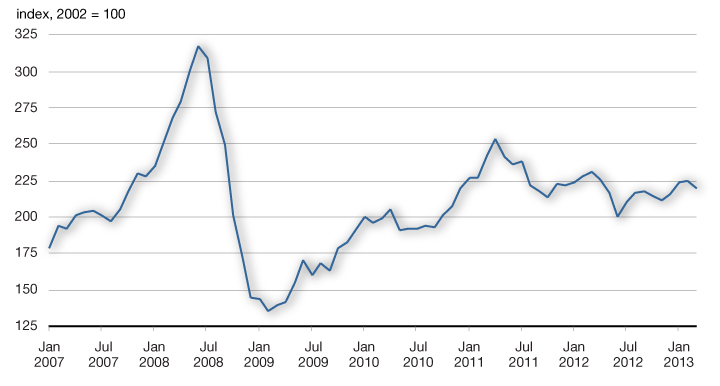
Sources: Commodity Research Bureau; Department of Finance calculations.
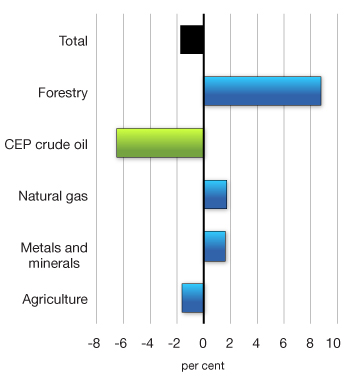
However, Canada has not reaped the full benefits of recent global commodity price increases, as a result of a wider gap between prices received by Canadian crude oil exporters and global benchmarks, reflecting the fact that almost all of Canada’s crude oil exports are destined for the United States. Rising North American crude oil production, particularly from the Bakken shale formation in North Dakota and from the Canadian oil sands, combined with limited pipeline capacity around the main U.S. oil distribution hub of Cushing, Oklahoma, have pushed Canadian crude oil prices down relative to global benchmarks. Canadian prices have also faced significant volatility and additional downward pressure due to unplanned maintenance shutdowns of U.S. refineries and a temporary shutdown of a major
Canada-U.S. pipeline. As a result, overall prices received by Canadian crude oil producers are now 6.5 per cent lower than at the time of the 2012 Fall Update, while the U.S. West Texas Intermediate (WTI) price is up 5.4 per cent (Chart 2.9).
Commodity prices received by Canadian producers have been dampened by relatively weak crude oil export prices
Looking forward, analysts expect the gap between Canadian prices and global benchmarks to gradually narrow towards historical norms, reflecting expectations of additional north-south pipeline capacity in the United States.[2] This is also reflected in recent futures prices, which show a reduction of the Canada-U.S. price gap to close to its historical average by mid-2014.
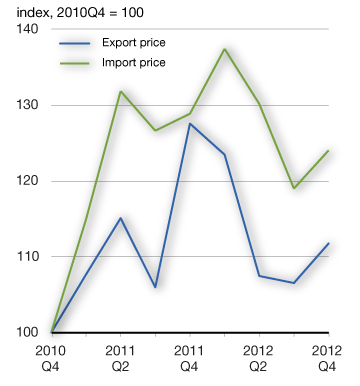
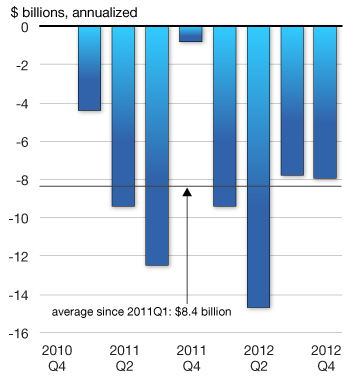
Low prices for Canadian crude oil exports relative to global benchmarks over the past two years have had significant consequences for the Canadian economy. Chart 2.10 shows the evolution of Canadian export and import prices for crude oil since the fourth quarter of 2010. While both export and import crude oil prices rose over the period, import prices climbed by more. Had export prices kept pace with import prices over this period, the value of Canada’s crude oil exports (and hence nominal GDP) would have been approximately $8.4 billion higher, or 1.5 per cent, on average, over the 2011-2012 period.
Low prices for Canadian crude oil have dampened the value of exports over the past two years
Gaining access to global energy markets represents a significant opportunity for Canada going forward.
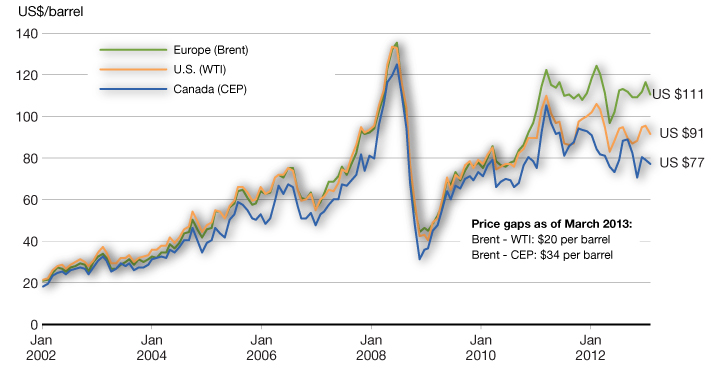
For crude oil, pipeline projects underway or planned will provide increased access to the U.S. Gulf Coast, where Canadian crude oil can compete directly with higher-priced imported (sea-borne) Brent crude (Chart 2.11). This is likely to boost Canadian prices while also dampening prices for Brent. For example, if WTI and Brent prices were to converge to the average of their two current prices (about US$100 per barrel) and Canadian crude oil prices were to return to historical norms relative to this benchmark, this would boost Canadian prices by approximately 12 per cent, translating into an increase in exports of approximately $8 billion per year, assuming no change in production from 2012 levels.
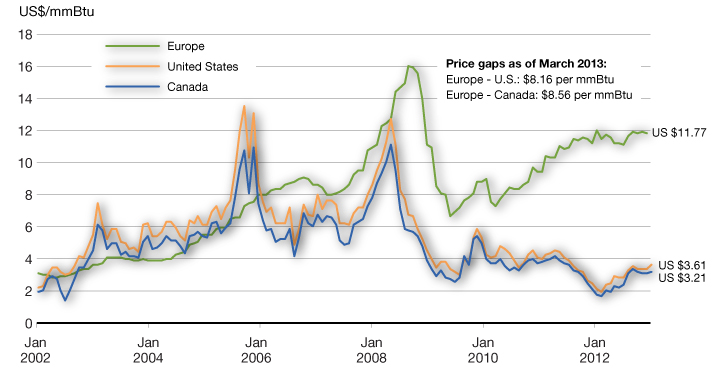
The comparable impact from natural gas is potentially even more significant, as sharp increases in natural gas production from shale formations in the United States, combined with limited export capacity from liquefied natural gas facilities, has pushed North American prices far below those prevailing in Europe. If Canadian natural gas exporters received even half the price prevailing in Europe, this would represent an increase of about $20 billion annually in exports, based on 2012 export volumes.
Together, the impact of this increase in exports could be very significant, translating into an increase of about $28 billion per year in Canada’s GDP, and over $4 billion annually in additional federal government revenues. Indeed, this estimate understates the true impact of better global distribution of Canadian energy products, as it does not account for increased economic activity resulting from increased investment and production that would follow higher Canadian prices.
Increased access to global energy markets represents a significant opportunity going forward
Canada’s Recent Economic Performance
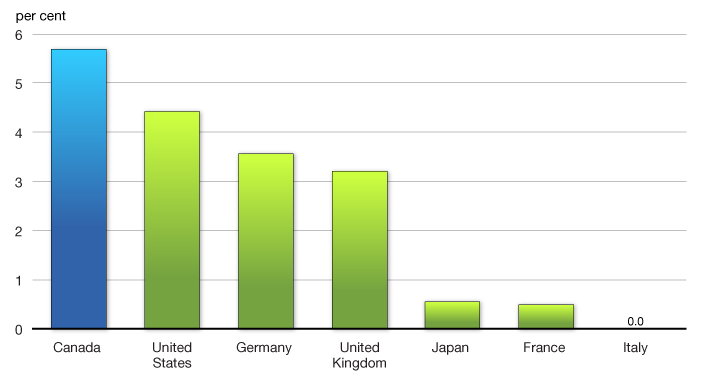
Despite a challenging external environment, the Canadian economy has been resilient. Canada’s economic performance has been reflected in a solid job creation performance, with employment recording solid gains since late Summer of 2012 and the unemployment rate declining to 7.0 per cent, its lowest level in more than four years. Over 950,000 more Canadians are working today than at the time of the trough in employment in July 2009—an increase of 5.7 per cent. Canada has outperformed all other G-7 economies in job creation over this period (Chart 2.12).
Canada has outperformed all other G-7 economies in job creation over the recovery
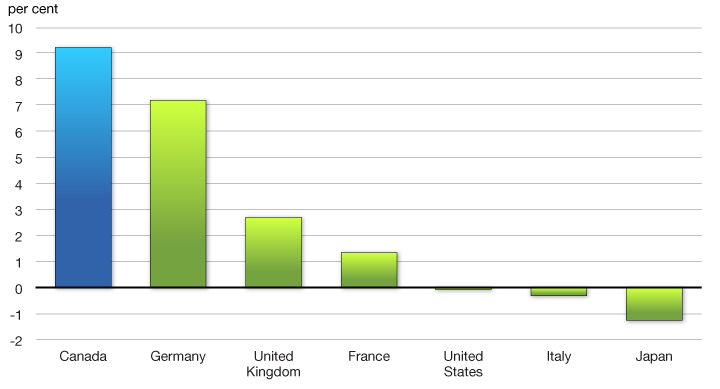
Canada has also posted the strongest labour market performance among all G-7 economies since the beginning of 2006. Over this period, the number of employed Canadians has risen by almost 1.5 million—a gain of 9.2 per cent (Chart 2.13).
Canada has also outperformed all other G-7 economies in job creation since 2006
Sources: Haver Analytics; Department of Finance calculations.
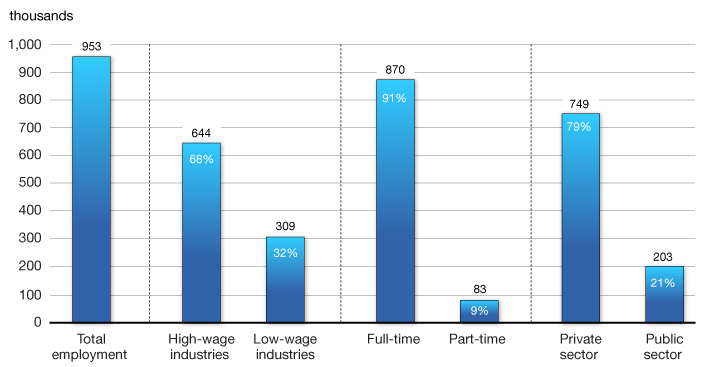
Over 90 per cent of all jobs created over the recovery have been full-time positions with more than two-thirds in high-wage industries (Chart 2.14). Encouragingly, the private sector has been the main source of job creation since the end of the recession, an essential condition for a sustained recovery and expansion, generating more than three-quarters of all new jobs since July 2009.
Job creation during the recovery has been in high-wage, full-time, private-sector employment
July 2009 to February 2013
Sources: Statistics Canada; Department of Finance calculations.
The employment situation in Canada contrasts sharply with that of the U.S., where employment remains significantly below pre-recession levels (Chart 2.15). As a result, the Canadian unemployment rate is more than half a percentage point below that of the United States. The U.S. unemployment rate has exceeded the Canadian rate since October 2008, a phenomenon not seen on a sustained basis since the mid-1970s. Furthermore, when Canadian unemployment is measured on the same basis as in the U.S., the unemployment rate gap between the two countries increases to over 1 percentage points,[3] demonstrating the strength of the recovery in Canada.
The stronger performance of the Canadian labour market is also reflected in the long-term unemployment rate (the number of people unemployed for a period of at least 27 weeks as a share of the labour force). Canada’s long-term unemployment rate stood at 1.4 per cent in 2012, slightly below its historical average since 1976 and well below the U.S. level of 3.3 per cent, which remains more than twice as large as its average over the same period.
Moreover, the Canadian labour market has maintained a much higher labour force participation rate (the share of the population 15 and over in Canada, and 16 and over in the United States, either working or actively seeking work), which indicates that there are fewer discouraged workers in Canada, as more of the unemployed are seeking work and finding it. In contrast, the U.S. participation rate has declined sharply and now stands at its lowest level in more than three decades. As a result, the labour force participation rate gap between the two countries has widened to 3.2 percentage points as of February 2013, the largest on record. In the absence of such a marked decline in the U.S. labour force participation rate, the U.S. unemployment rate would have remained near its post-recession level of about 10 per cent.[4]
Canada’s labour market continues to outperform that of the United State
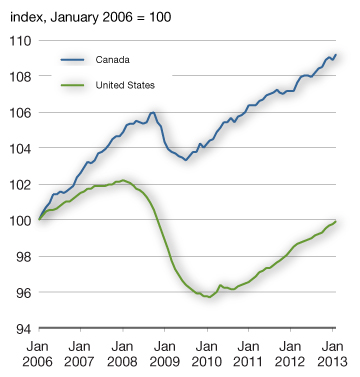
Note: Last data point is February 2013.
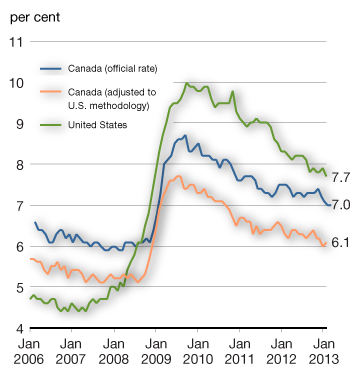
Note: Last data point is February 2013.
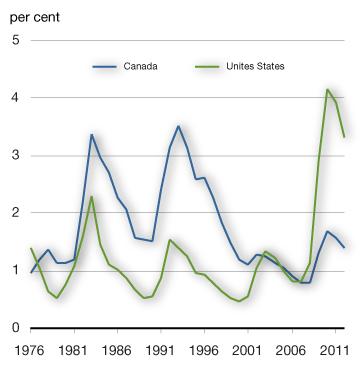
Note: The long-term unemployment rate is the ratio of the number of people unemployed for a period of at least 27 weeks to the labour force.
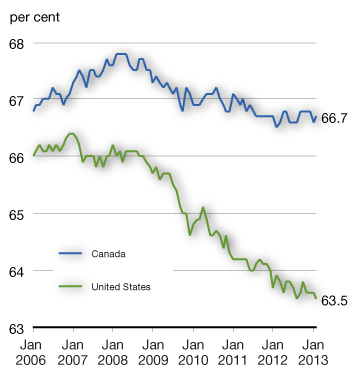
Notes: The participation rate is the share of the working-age population who are either working or actively seeking work. Last data point is February 2013.
While Canada’s labour market is functioning relatively well, the unemployment rate remains high, particularly in some regions. Moreover, large imbalances persist between the number of unemployed and vacant jobs across occupational groups. Reports of labour shortages have increased, particularly in the mining, oil and gas extraction, and construction sectors with skilled tradespeople, among others, being in short supply (Chart 2.16). These shortages are expected to rise in coming years as the economy further improves and the population ages.
This suggests that some Canadians remain unemployed because they do not have the right skills for the available jobs in high demand sectors. A key challenge is therefore to ensure that there is an adequate supply of skilled workers to meet the needs of Canadian employers. Greater skills development and participation in training, including through apprenticeships, will improve the process of matching people with jobs and jobs with people and help alleviate potential future skills shortages.
Canadian employers are experiencing increased difficulty hiring skilled trades workers
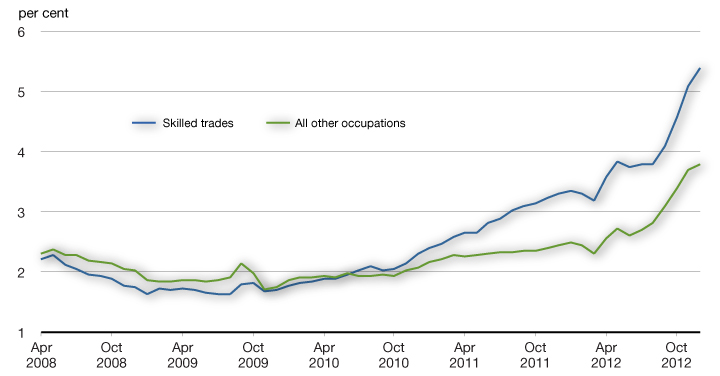
online job postings plus occupied positions (total employment). Last data point is December 2012.
Sources: Statistics Canada; WANTED Analytics Inc.; Department of Finance calculations.
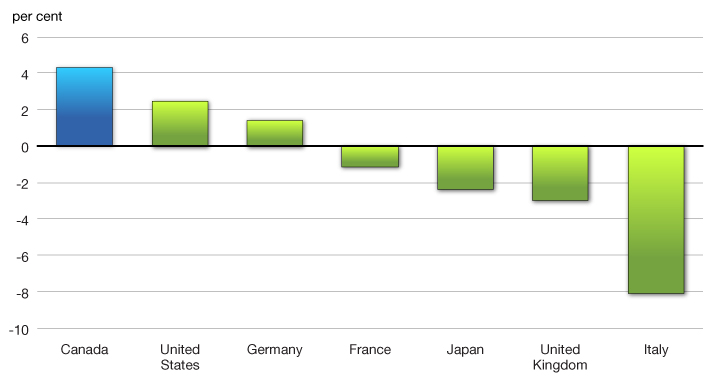
The resilience of the domestic economy has driven the solid performance of the Canadian labour market. Economic growth in Canada over the recovery has been largely driven by sustained growth in private domestic demand—the sum of spending by Canadian households and businesses. Growth in real private domestic demand accelerated to 2.6 per cent in the fourth quarter of 2012. The sustained growth in real private domestic demand has been largely driven by robust business non-residential investment, which increased at an average annual rate of 9.9 per cent over the recovery. As a result, Canada is the only G-7 country to have more than fully recovered business investment lost during the recession (Chart 2.17).
Canada is the only G-7 country to have more than fully recovered business investment lost during the recession
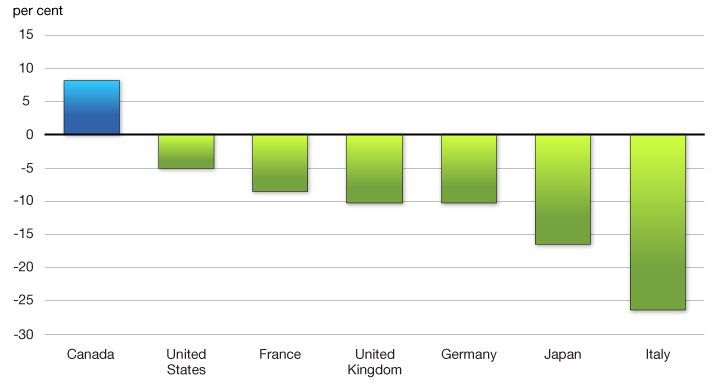
Sources: Statistics Canada; U.K. Office for National Statistics; German Federal Statistical Office; Haver Analytics; Department of Finance calculations.
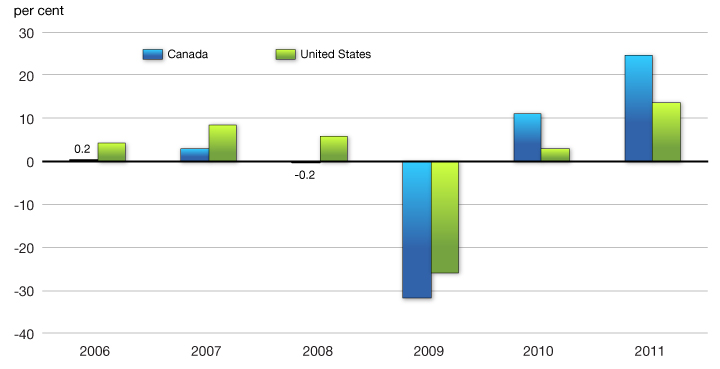
This strength in business investment over the recovery has reflected growth in investment in both structures (construction of plants and commercial buildings, for example) and machinery and equipment (M&E). Moreover, Canada’s strong investment performance has been broad-based, with most sectors posting stronger growth than their U.S. counterparts. Notably, business investment in Canada’s manufacturing sector has risen strongly, with almost all industries posting very strong growth in M&E investment. Indeed, investment in M&E by Canadian manufacturers grew by 11.1 per cent in 2010 and 24.8 per cent in 2011, greatly outpacing that in the United States over the recovery, after lagging in prior years (Chart 2.18).
Machinery and equipment investment in the Canadian manufacturing sector has been stronger than in the U.S. over the recovery
Further, Canadian businesses have made up the loss in investment in just three years, or less than half the time as in previous major recessions, despite a downturn in investment among the steepest of any recession since the early 1950s (Chart 2.19)—suggesting that Canadian firms are reacting to lower taxes and tariffs implemented by the Government, among other factors (see below). This, together with strong non-financial corporate balance sheets, suggests that Canadian businesses are in a good position to continue to invest and support economic growth in the future.
Canadian businesses have recouped the loss in investment in less than half the time as in previous major recessions
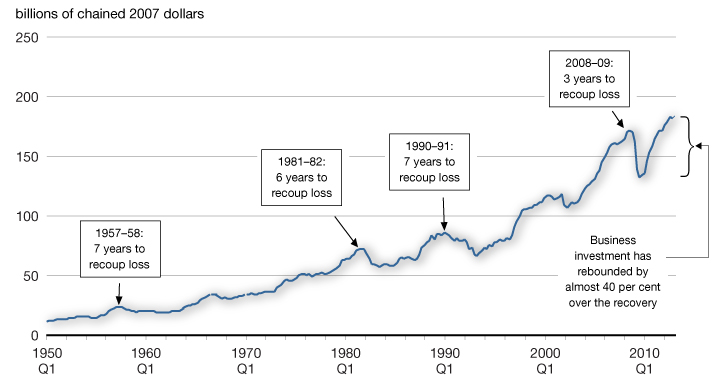
Sources: Statistics Canada; Department of Finance calculations.
The Government’s Low-Tax Plan Is Giving Businesses Strong Incentives to Invest in Canada
The Government has implemented a low-tax plan that supports business investment and innovation. This includes:
- Reducing the federal general corporate income tax rate to 15 per cent in 2012 from 22.12 per cent in 2007.
- Eliminating the federal capital tax in 2006, and providing provinces with a financial incentive to encourage them to eliminate their capital taxes. The last of the provincial general capital taxes was eliminated in 2012.
- Eliminating all tariffs on imported machinery and equipment and manufacturing inputs to make Canada a tariff-free zone for industrial manufacturers.
- Providing temporary accelerated capital cost allowance treatment for new investments in manufacturing or processing machinery and equipment since 2007.
A number of provinces have also taken important actions to enhance Canada’s tax competitiveness and contribute to a strong foundation for future growth. As a result of federal and provincial business tax changes, Canada's overall tax rate on new business investment has been reduced to the lowest among G-7 countries and below the average of the member countries of the Organisation for Economic Co-operation and Development.
In addition to these policy changes, the strong value of the Canadian dollar has lowered the price of imported machinery and equipment, providing a further incentive for Canadian firms to invest.
Robust business investment suggests that businesses are reacting positively to Canada’s tax and tariff advantages.
Canada’s domestic economy, however, has been dampened by slow export growth, reflecting the slow global recovery and the economic challenges faced by some of our largest trading partners. As shown in Chart 2.20, growth in private domestic demand remained positive through 2012, with quarterly growth rates averaging 2.4 per cent, while real exports declined by an average of 2.1 per cent per quarter over the same period. A decline in exports in the third quarter of 2012 in part reflected a decline in the volume of energy exports due to unplanned shutdowns of U.S. refineries, as discussed above, as well as extended maintenance shutdowns at Canadian offshore oil platforms that resulted in a decline in oil production.
The resilience of private domestic demand has been dampened by weak demand for Canadian exports
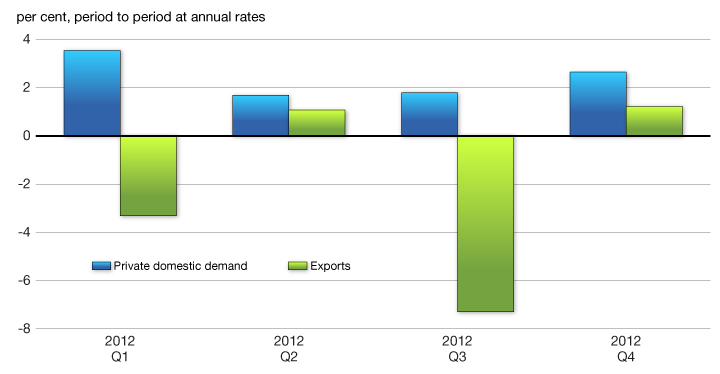
Sources: Statistics Canada; Department of Finance calculations.
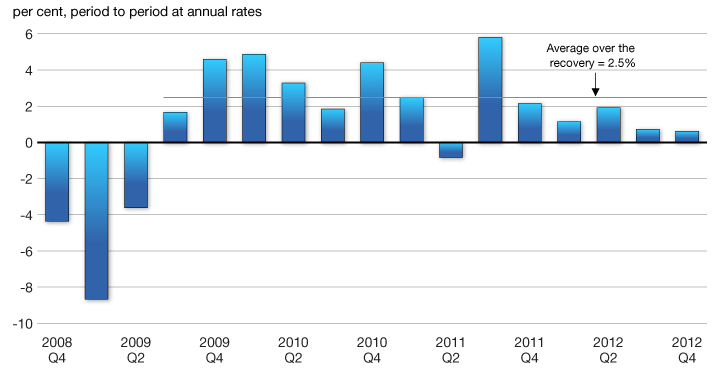
As a result, Canadian real GDP growth has been modest, averaging 1.3 per cent over the last five quarters compared to average growth of 2.5 per cent over the recovery as a whole (Chart 2.21). In particular, real GDP growth slowed markedly in the final two quarters of 2012 as Canadian real exports subtracted 0.9 percentage points, on average, from overall growth during this period.
Ongoing weakness in the global economy has been reflected in modest real GDP growth in Canada
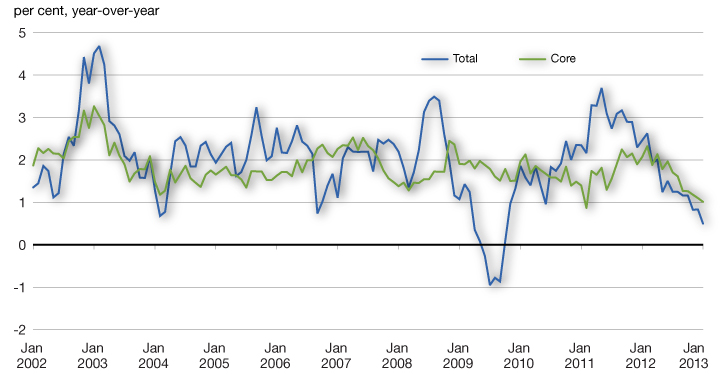
Recent slower real GDP growth has also been reflected in a deceleration in consumer price inflation. In January 2013, total Consumer Price Index (CPI) inflation was 0.5 per cent year-over-year, its slowest pace since the recession (Chart 2.22). While this in part reflected declines in energy prices, which can be volatile even on a year-over-year basis, the pace of core inflation also eased to 1 per cent, reflecting slower price increases for a broad range of goods and services. With household spending representing approximately half of total GDP, the moderation in CPI inflation is also dampening growth in economy-wide prices and therefore nominal GDP.
Weakness in real GDP growth has been reflected in slower CPI inflation
Despite the challenging global environment, the Canadian economy has shown resilience: Canada posted the strongest growth in real GDP in the G-7 during the global recession and the recovery (Chart 2.23). This reflects Canada’s strong economic, fiscal and financial sector fundamentals.
Canada has performed better than other G-7 economies during the global recession and the recovery
Sources: Haver Analytics; Department of Finance calculations.
Canadian Economic Outlook—Private Sector Forecasts
The average of private sector economic forecasts has been used as the basis for fiscal planning since 1994 and introduces an element of independence into the Government’s fiscal forecast. This practice has been supported by international organizations such as the IMF.
The Department of Finance regularly surveys private sector economists on their views on the outlook for the Canadian economy. The economic forecast presented in this section is based on a survey conducted in March 2013, and includes the views of 13 private sector economists.
The March 2013 survey of private sector economists included
- BMO Capital Markets,
- Caisse de dpt et placement du Qubec,
- CIBC World Markets,
- The Conference Board of Canada,
- Desjardins,
- Deutsche Bank of Canada,
- IHS Global Insight,
- Laurentian Bank Securities,
- National Bank Financial Group,
- Royal Bank of Canada,
- Scotiabank,
- TD Bank Financial Group, and
- the University of Toronto (Policy and Economic Analysis Program).
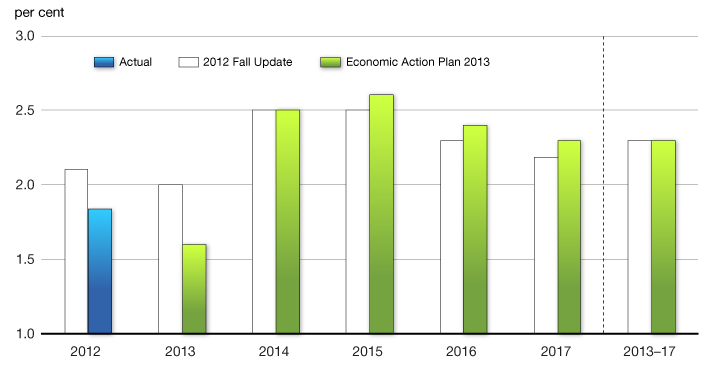
The economists’ outlook for Canadian real GDP growth over the 2013-2017 forecast period is unchanged, on average, from their expectations at the time of the 2012 Fall Update. However, reflecting weaker economic momentum at the end of 2012, economists now expect growth of 1.6 per cent in 2013, revised down from 2.0 per cent in the Fall Update. Offsetting this, real growth is expected to be stronger over the 2015 to 2017 period, leaving the average rate of growth between 2013 and 2017 unchanged (Chart 2.24 and Table 2.1).
The average outlook for real GDP growth over 2013-2017 is unchanged since the 2012 Fall Update
Economists expect GDP inflation of 1.7 per cent in 2013, revised down from 2.0 per cent at the time of the Fall Update. The outlook for GDP inflation is slightly lower over the remainder of the forecast horizon.
Weaker-than-expected real GDP growth in the second half of 2012, along with expectations for modestly lower real GDP growth and GDP inflation in 2013, have reduced the projected level of nominal GDP for 2013 by about $17 billion compared to the Fall Update outlook. The downward revision to the expected level of nominal GDP rises to $21 billion by 2017 as a result of lower expected GDP inflation.
Private sector economists expect that the unemployment rate will be slightly lower in 2013, compared to the Fall Update outlook, but they still expect it to gradually fall to 6.4 per cent by 2017, unchanged from the Fall Update.
Economists expect total CPI inflation of just 1.3 per cent in 2013 but project it will return to the 2-per-cent midpoint of the Bank of Canada’s inflation target range thereafter, unchanged from the 2012 Fall Update.
Consistent with the weaker outlook for growth, the economists’ expectations for both short and long-term interest rates have been lowered relative to the Fall Update. The economists continue to expect the Canadian dollar to remain near parity with the U.S. dollar over the forecast horizon.
| 20121 | 2013 | 2014 | 2015 | 2016 | 2017 | 2013- 2017 |
|
|---|---|---|---|---|---|---|---|
| Real GDP growth | |||||||
| March 2012 survey/Economic Action Plan 2012 | 2.1 | 2.4 | 2.4 | 2.4 | 2.2 | ||
| October 2012 survey/2012 Fall Update | 2.1 | 2.0 | 2.5 | 2.5 | 2.3 | 2.2 | 2.3 |
| March 2013 survey/Economic Action Plan 2013 | 1.8 | 1.6 | 2.5 | 2.6 | 2.4 | 2.3 | 2.3 |
| GDP inflation | |||||||
| March 2012 survey/Economic Action Plan 2012 | 2.4 | 2.0 | 2.1 | 2.0 | 2.0 | ||
| October 2012 survey/2012 Fall Update | 1.3 | 2.0 | 2.1 | 2.1 | 2.1 | 2.1 | 2.1 |
| March 2013 survey/Economic Action Plan 2013 | 1.3 | 1.7 | 2.1 | 2.0 | 2.0 | 2.0 | 2.0 |
| Nominal GDP growth | |||||||
| March 2012 survey/Economic Action Plan 2012 | 4.6 | 4.4 | 4.6 | 4.4 | 4.2 | ||
| October 2012 survey/2012 Fall Update | 3.4 | 4.0 | 4.7 | 4.7 | 4.4 | 4.3 | 4.4 |
| March 2013 survey/Economic Action Plan 2013 | 3.1 | 3.3 | 4.7 | 4.7 | 4.4 | 4.3 | 4.3 |
| Nominal GDP level (billions of dollars) | |||||||
| March 2012 survey/Economic Action Plan 20122 | 1,844 | 1,925 | 2,013 | 2,102 | 2,190 | ||
| October 2012 survey/2012 Fall Update | 1,822 | 1,895 | 1,984 | 2,078 | 2,169 | 2,262 | |
| March 2013 survey/Economic Action Plan 2013 | 1,818 | 1,878 | 1,966 | 2,058 | 2,149 | 2,241 | |
| Difference between Economic Action Plan 2013 and 2012 Fall Update |
-5 | -17 | -19 | -20 | -20 | -21 | |
| 3-month treasury bill rate | |||||||
| March 2012 survey/Economic Action Plan 2012 | 0.9 | 1.3 | 2.2 | 3.3 | 3.9 | ||
| October 2012 survey/2012 Fall Update | 1.0 | 1.2 | 1.8 | 2.6 | 3.4 | 3.9 | 2.6 |
| March 2013 survey/Economic Action Plan 2013 | 1.0 | 1.0 | 1.3 | 2.2 | 3.3 | 3.8 | 2.3 |
| 10-year government bond rate | |||||||
| March 2012 survey/Economic Action Plan 2012 | 2.2 | 2.8 | 3.6 | 4.3 | 4.5 | ||
| October 2012 survey/2012 Fall Update | 1.9 | 2.2 | 2.9 | 3.5 | 4.2 | 4.7 | 3.5 |
| March 2013 survey/Economic Action Plan 2013 | 1.9 | 2.1 | 2.8 | 3.5 | 4.1 | 4.6 | 3.4 |
| Exchange rate (US cents/C$) | |||||||
| March 2012 survey/Economic Action Plan 2012 | 99.6 | 101.8 | 101.1 | 100.5 | 100.2 | ||
| October 2012 survey/2012 Fall Update | 100.2 | 101.1 | 100.1 | 100.5 | 99.5 | 98.1 | 99.9 |
| March 2013 survey/Economic Action Plan 2013 | 100.1 | 98.9 | 100.7 | 100.9 | 99.3 | 98.8 | 99.7 |
| Unemployment rate | |||||||
| March 2012 survey/Economic Action Plan 2012 | 7.5 | 7.2 | 6.9 | 6.7 | 6.6 | ||
| October 2012 survey/2012 Fall Update | 7.3 | 7.2 | 6.8 | 6.6 | 6.5 | 6.4 | 6.7 |
| March 2013 survey/Economic Action Plan 2013 | 7.2 | 7.1 | 6.9 | 6.7 | 6.5 | 6.4 | 6.7 |
| Consumer Price Index inflation | |||||||
| March 2012 survey/Economic Action Plan 2012 | 2.1 | 2.0 | 2.0 | 2.0 | 2.0 | ||
| October 2012 survey/2012 Fall Update | 1.7 | 2.0 | 2.0 | 2.0 | 2.0 | 2.0 | 2.0 |
| March 2013 survey/Economic Action Plan 2013 | 1.5 | 1.3 | 2.0 | 2.0 | 2.0 | 2.0 | 1.8 |
| U.S. real GDP growth | |||||||
| March 2012 survey/Economic Action Plan 2012 | 2.3 | 2.4 | 2.8 | 2.9 | 2.8 | ||
| October 2012 survey/2012 Fall Update | 2.2 | 2.0 | 2.9 | 3.1 | 3.0 | 2.8 | 2.7 |
| March 2013 survey/Economic Action Plan 2013 | 2.2 | 1.9 | 2.9 | 3.1 | 3.0 | 2.8 | 2.7 |
| 1 Values for 2012 for the March 2013 survey/Economic Action Plan 2013 are actual. 2 These values have been restated to reflect the historical revision to the Canadian System of National Accounts released on October 1, 2012 by Statistics Canada. Sources: Statistics Canada; Department of Finance March 2012, October 2012 and March 2013 surveys of private sector economists. |
|||||||
Risk Assessment
On March 8, 2013, the Minister of Finance met with the private sector economists to discuss the economic projections resulting from the March 2013 survey, as well as the risks surrounding the outlook. At that time, the economists agreed that the average forecast from the March survey was a reasonable basis for fiscal planning.
The economists continue to identify the euro area sovereign debt and banking crisis as a risk to the near-term outlook. Renewed political uncertainty in Italy has highlighted the further work that needs to be done in order to improve the situation, including implementing structural reform plans to support and rebalance growth within the euro area. In light of actions taken by authorities, the economists feel that the risk of a severe negative economic outcome in the euro area has been somewhat reduced. However, in the end, they believe it may take years for fiscal and structural adjustments to fully take place.
The economists noted that agreements reached by U.S. lawmakers to avoid more than half of the “fiscal cliff” and suspend the debt limit until later this year have reduced U.S. fiscal policy uncertainty in the near term. As well, there are positive signs recently that agreement will be reached to avoid a government shutdown on March 27. Nevertheless, there remains uncertainty regarding U.S. fiscal policy, first over the impact of sequestration on growth in the near term and more fundamentally beyond that, due to the need to develop a credible plan to reduce the federal debt burden in the medium and longer term.
On the domestic front, the main risk to the outlook identified by the economists continues to be the exposure of Canadian households to elevated levels of debt. However, they noted that the recent proactive actions taken by the Government to tighten government-backed insured mortgage standards have started to take hold, and would help to prevent households from becoming overextended.
At the same time, the economists saw the potential for stronger-than-expected growth in the U.S., particularly given recent economic data, including ongoing improvements in the housing market and a strengthening labour market. More importantly, if U.S. policy makers are able to coordinate policy such that a government shutdown is avoided, the debt ceiling is again raised in a timely fashion, and agreement is reached on a medium-term plan to reduce government debt, this would remove the uncertainty surrounding U.S. fiscal policy and could result in stronger-than-expected U.S. growth.
Finally, world prices for the major commodities produced in Canada are key determinants of GDP inflation, and therefore nominal GDP. There are both upside and downside risks to the commodity price outlook, particularly in the short term. The private sector expectation for GDP inflation is consistent with only modest growth in commodity prices, averaging less than 2 per cent annually over the forecast horizon (Table 2.2).
| Current Price1 | 2013 | 2014 | 2015 | 2016 | 2017 | |
|---|---|---|---|---|---|---|
| Prices consistent with the March 2013 survey | ||||||
| Commodity price index (2002 = 100) | 220.6 | 230.8 | 234.5 | 236.2 | 237.6 | 238.5 |
| Crude oil (West Texas Intermediate, US$/barrel) | 91 | 92 | 94 | 96 | 97 | 97 |
| Crude oil (Canadian effective price, US$/barrel)2 | 77 | 80 | 82 | 83 | 84 | 85 |
| Natural gas (Henry Hub, US$/MMBtu) | 3.6 | 3.5 | 3.6 | 3.7 | 3.7 | 3.8 |
| 1 Average of two weeks ending March 13, 2013. 2 Canadian crude prices are assumed to grow at the same pace as West Texas Intermediate crude prices over 2013 to 2017. Note that this is a simple assumption for illustration only and should not be interpreted as a projection. |
||||||
Overall, given the reduced level of risk in the euro area, the avoidance of more than half of the U.S. ‘‘fiscal cliff’’, and the prospects of possible stronger-than-expected U.S. real GDP growth, the risks surrounding the private sector outlook have become more balanced than they have been for some time. Nonetheless, given the potential for a further flare-up in the euro area sovereign debt and banking crisis, as well as continued uncertainty over U.S. fiscal policy, risks to the outlook remain tilted to the downside.
Planning Assumptions
In light of these risks, for fiscal planning purposes, the Government has maintained the downward adjustment for risk to the private sector forecast for nominal GDP at $20 billion for 2013 through 2017 (Table 2.3). The Government will continue to evaluate economic developments and risks to determine whether or not it would be appropriate to maintain this adjustment for risk in the future. The fiscal outlook is presented in Chapter 4.
| 2013 | 2014 | 2015 | 2016 | 2017 | |
|---|---|---|---|---|---|
| March 2013 survey of private sector economists | 1,878 | 1,966 | 2,058 | 2,149 | 2,241 |
| Economic Action Plan 2013 fiscal planning assumption | 1,858 | 1,946 | 2,038 | 2,129 | 2,221 |
| Adjustment for risk | -20 | -20 | -20 | -20 | -20 |
| Addendum | |||||
| Adjustment for risk in the 2012 Fall Update | -20 | -20 | -20 | -20 | -20 |
[1] According to the Congressional Budget Office (CBO), sequestration represents a reduction in budgetary resources of US$85 billion or 0.5 per cent of GDP in fiscal year 2012-13 (October 1, 2012 to September 30, 2013). However, the reduction in actual spending is expected to be about US$60 billion or 0.4 per cent of GDP in calendar year 2013. The difference reflects two factors. First, the cut in budgetary resources, according to the CBO, would overstate the actual impact on the economy this year, as not all of those resources would have been spent had sequestration not occurred (for example, some would have been used to finance longer-term projects). Second, the expected cuts to actual spending are put on a calendar-year basis, rather than a U.S. fiscal-year basis, so that their impact on growth in 2013 can be better determined.
[2] However, a sizeable gap between Canadian and global prices will continue to persist, as an “average” barrel of Canadian crude oil is denser (i.e. of lower quality) than either the Brent or WTI benchmark crude, and as a result normally sells at a discount (10 to 12 per cent on average since 2002).
[3] Conceptual differences raise the Canadian unemployment rate relative to the U.S. rate. In particular, Statistics Canada considers as unemployed those passively looking for work (e.g. reading want ads) as well as those who will begin work in the near future, while the U.S. Bureau of Labor Statistics does not include either group in its unemployment calculations. In addition, the Canadian methodology includes 15-year-olds (who have a higher-than-average unemployment rate), while the U.S. does not.
[4] The U.S. unemployment rate would have remained at about 10 per cent if the labour force participation rate had declined by about the same as in Canada, assuming that the number of employed remained the same.