


Archived information
Archived information is provided for reference, research or recordkeeping purposes. It is not subject to the Government of Canada Web Standards and has not been altered or updated since it was archived. Please contact us to request a format other than those available.
Chapter 2: Economic Developments and Prospects
Highlights
- The global economic recovery remains fragile. The European sovereign debt and banking crisis continues to weigh on global growth.
- The Canadian economy has remained resilient despite external weakness, reflecting sustained growth in the domestic economy.
- Canada has had the strongest economic growth over the recession and recovery among Group of Seven (G-7) countries. This reflects our solid economic fundamentals and the timely support of the stimulus phase of Canada’s Economic Action Plan.
- 610,000 more Canadians are working now than in July 2009, the strongest job growth among G-7 countries over the recovery. This continues the strong performance that has resulted in over 1.1 million new jobs created since the beginning of 2006.
- However, the fragile global economic environment will continue to be reflected in modest growth in Canada over the near term.
- The Department of Finance conducted a survey of private sector economists in early March 2012. On March 5, economists met with the Minister of Finance to discuss the economic forecast as well as the risks associated with the outlook.
- Private sector economists expect real gross domestic product (GDP) growth of 2.1 per cent in 2012 and 2.4 per cent in 2013, broadly unchanged from the November 2011 Update of Economic and Fiscal Projections.
- Economists also expect the level of nominal GDP—the broadest single measure of the tax base—to be above the level anticipated over the forecast period at the time of the November Update.
- Private sector economists agreed that near-term risks to the outlook have slightly moderated since the November Update, but continue to see global economic uncertainty as the key downside risk—in particular the potential for wider contagion of the sovereign debt and banking crisis in Europe.
- To reflect the downside risks surrounding the global economic outlook, the Government is adjusting the private sector forecast for nominal GDP downward by $20 billion in each year of the
2012–2016 forecast period.
Notes: This chapter incorporates data available up to and including March 23, 2012, unless otherwise indicated. All rates are reported at annual rates unless otherwise noted.
Introduction
The global economic environment remains highly uncertain. The key challenge currently facing the global recovery remains the European sovereign debt and banking crisis, which has weighed on financial markets and confidence and resulted in a deterioration of the global outlook. Nonetheless, the Canadian economy continues to expand, enjoying one of the best performances among G-7 countries over the global economic recession and recovery.
This chapter reviews:
- Major global economic developments since the November 2011 Update.
- Canada’s recent economic performance.
- Financial market and commodity price developments.
- The March 2012 private sector economic forecast that forms the basis for the fiscal projections, and the risks and uncertainties surrounding this economic forecast.
Global Economic Developments and Outlook
Uncertainty surrounding the global economic recovery increased in the second half of 2011, and the outlook for global growth has deteriorated. The key factor underlying this deterioration is the ongoing euro-area sovereign debt and banking crisis.
In Europe, strains in government debt markets rose between Spring 2011 and late last year, resulting in increased borrowing costs for many euro-area governments, including record highs for some countries. This led to severe funding pressures for most European banks, given their significant exposure to euro-area sovereign debt and large recapitalization needs. As a result, euro-area banks tightened credit standards and raised interest rates on loans to households and businesses, which weighed on consumer and business sentiment in the region. These developments pushed euro-area growth back into negative territory in the fourth quarter of 2011, with broad-based weakness across the region (Chart 2.1). Although indicators of business activity suggest that the euro-area economy has broadly stabilized in the first quarter of this year, the risk of further weakness remains.
Euro-area growth turned negative in the fourth quarter of 2011
European leaders have put in place significant policy measures to address the sovereign debt and banking crisis. The European Central Bank has provided significant liquidity for euro-area banks, and bank recapitalization plans are underway. In addition, Italy and Spain have introduced important fiscal and structural reforms, while progress has been made toward improving broader euro-area fiscal governance. In early March, Greece also completed its debt exchange with its private sector creditors, alleviating the near-term risk of a disorderly default.
Together, these policy actions have helped to reduce interest rates for euro-area governments and improve funding conditions for euro-area banks. However, it is clear that further concrete actions by European leaders are required, including following through on the implementation of announced fiscal restraint measures in order to stem the crisis, stabilize the current situation and set the stage for a return to sustained growth.
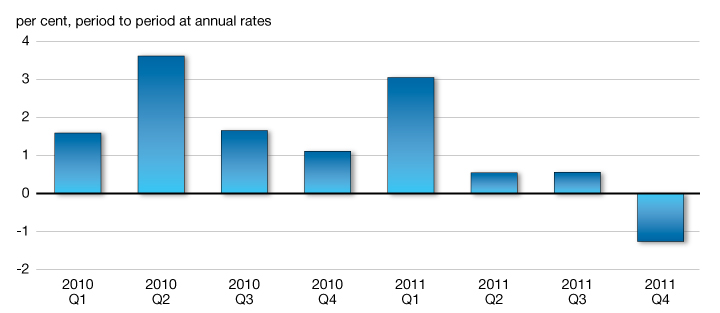
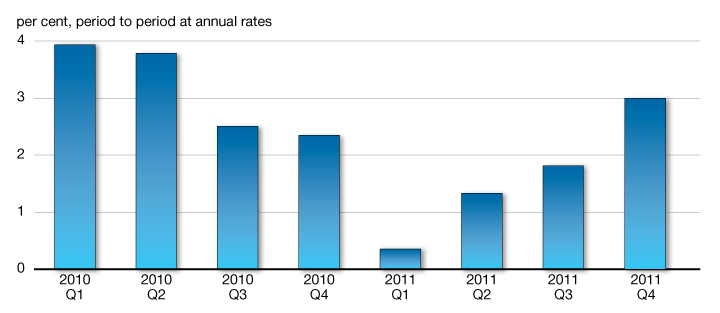
In the United States, the economy has shown signs of renewed momentum since Fall 2011, albeit relative to very weak growth in the first half of the year, as real GDP grew 3.0 per cent in the fourth quarter (Chart 2.2). Consumer confidence has generally increased since August, from near-record lows, while business survey data point to a pickup in both manufacturing and non-manufacturing output growth since Fall 2011.
U.S. economic growth has picked up recently
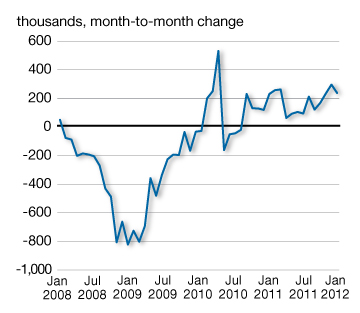
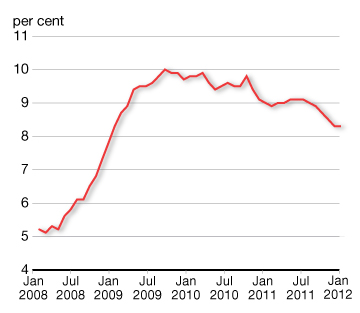
U.S. labour market conditions have improved, with employment gains averaging almost 250,000 jobs per month from December 2011 through February 2012 and the unemployment rate declining to a three-year low of 8.3 per cent in early 2012 (Chart 2.3). However, this recent improvement is relatively modest compared to the significant job losses suffered over the recession, while the declines in the unemployment rate also reflect workers exiting the labour market following long-term spells of unemployment.
U.S. labour market conditions have improved
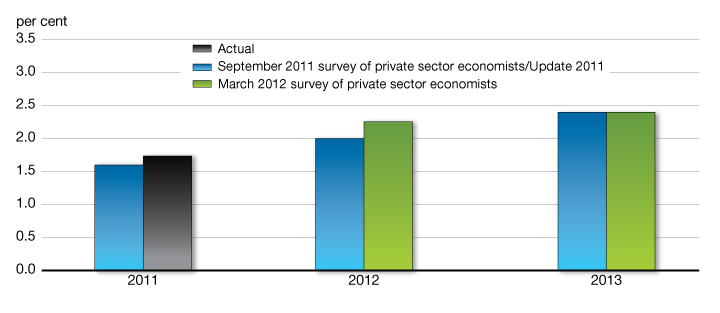
The U.S. economy continues to face significant challenges stemming from ongoing household deleveraging, necessary fiscal consolidation and spillover effects from the European sovereign debt and banking crisis. As a result, private sector economists continue to expect modest U.S. economic growth (Chart 2.4).
Economists continue to expect modest U.S. growth
In emerging and developing economies, growth has also slowed, reflecting the deterioration in the external environment as well as the effects of past tightening in domestic monetary policy. Nonetheless, growth remains strong, led by developing Asia. In China, economic growth has eased somewhat but remains solid. Looking ahead, slowing demand from advanced economies is expected to result in a gradual moderation toward a more sustainable, albeit still robust, pace of economic growth.
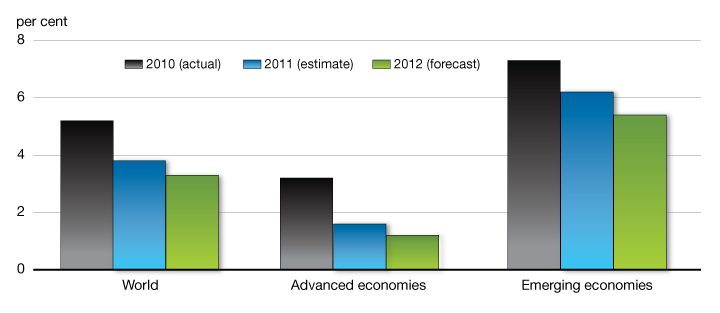
Reflecting the intensification of the euro-area sovereign debt and banking crisis in Fall 2011 and its impact on global trade and financial markets, the International Monetary Fund (IMF) has steadily downgraded its near-term global outlook over the past year. The IMF now expects global real GDP growth of 3.3 per cent in 2012, with growth in advanced economies expected to be just 1.2 per cent. The IMF also expects modestly slower growth in emerging economies, reflecting the worsening external environment and a slowdown in domestic demand in key emerging economies (Chart 2.5).
Global growth prospects have weakened
Canada’s Recent Economic Performance
Canada’s economic performance over the recession and recovery has been solid relative to our peer countries. This reflects Canada’s sound economic, fiscal and financial sector fundamentals, along with the significant and timely support provided under Canada’s Economic Action Plan. As a result, real GDP is now well above pre-recession levels—the best performance in the G-7 (Chart 2.6).
Canada has performed better than all other G-7 economies during the global recession and the recovery
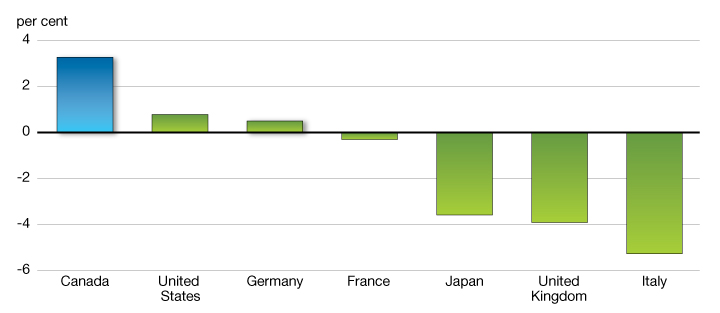
Sources: Haver Analytics; Department of Finance calculations.
The rapid turnaround of activity and vigorous domestic demand owes much to the government's rightly-sized and well-targeted macroeconomic stimulus.
— International Monetary Fund,
2010 Article IV Consultation Report on Canada
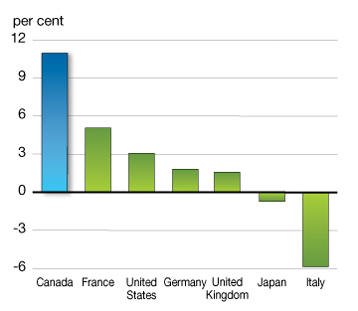
Employment and incomes have grown faster in Canada than any other G-7 country since 2006
In 2006, the Government launched a comprehensive economic plan to foster strong, sustainable, long-term economic growth, building on Canada’s key advantages. The Government followed through by implementing broad-based tax reductions, paying down debt, and investing in knowledge and infrastructure.
These actions put the Canadian economy on a solid foundation for sustainable, long-term economic growth. They also placed Canada in a stronger position than most other countries and allowed the Government to respond quickly and effectively to support the economy and protect Canadian jobs.
This has been reflected in a strong economic performance over the past five years, with over 1.1 million new jobs created since the beginning of 2006 and the strongest employment and income growth in the G-7 (Chart 2.7).
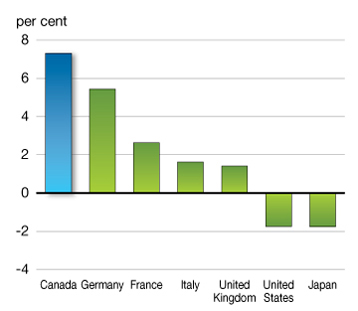
Note: Base year for calculations is 2005.
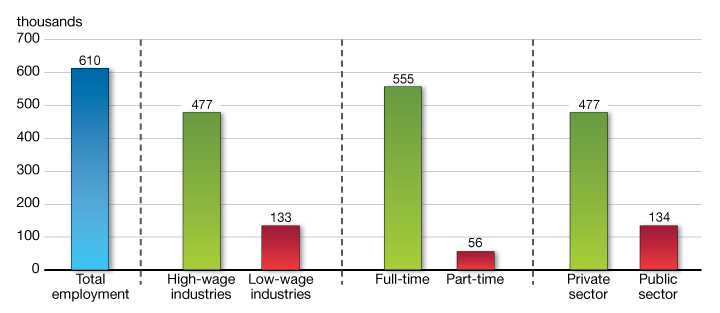
Canada has also posted, by far, the strongest growth in employment in the G-7 during the recovery. These employment gains have been high-quality jobs. 610,000 more Canadians are working today than in July 2009. Of these jobs, about 90 per cent are in full-time positions with over three-quarters in high-wage industries and in the private sector (Chart 2.8). It is an encouraging sign that Canadian businesses are continuing to hire as the temporary economic stimulus that the Government put into place during the recession is withdrawn.
Job creation during the recovery has been in high-wage, full-time, private-sector employment
Sources: Statistics Canada; Department of Finance calculations.
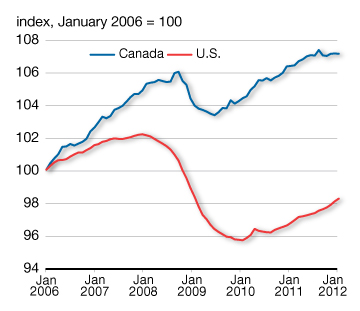
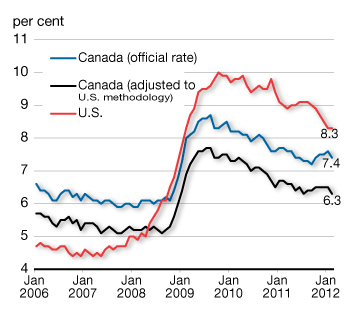
The employment situation in Canada contrasts sharply with that of the U.S., where employment remains significantly below pre-recession levels. As a result, the Canadian unemployment rate is now 0.9 percentage points below that of the United States. The U.S. unemployment rate has exceeded that of Canada since October 2008, a phenomenon not seen in nearly three decades. When Canadian unemployment is measured on the same basis as in the U.S., the unemployment rate gap between the two countries increases to 2.0 percentage points (Chart 2.9).[1]
Canada’s strong employment performance contrasts sharply with that of the United States
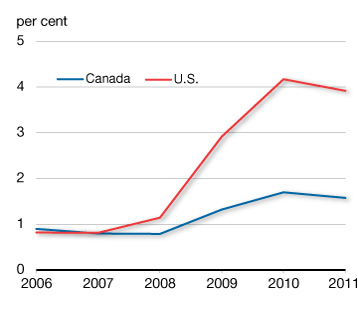
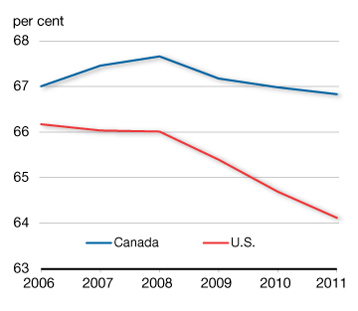
The relatively stronger performance of the Canadian labour market is also reflected in the long-term unemployment rate (the number of people unemployed for a period of at least 27 weeks as a share of the labour force). Canada’s long-term unemployment rate stood at 1.6 per cent in 2011, well below the U.S. level of 3.9 per cent. Moreover, the Canadian labour market is characterized by a much higher labour force participation rate (the share of the population 15 and over in Canada, and 16 and over in the United States, either working or actively seeking work). This indicates that there are fewer discouraged workers, as more of the unemployed are seeking work and finding it. In Canada, the labour force participation rate has remained relatively high through the recession and recovery, while it declined sharply in the U.S. to close to a three-decade low in 2011. As a result, the labour force participation rate gap between the two countries increased to over 2.5 percentage points last year, the largest gap on record (Chart 2.10).
Structural labour market characteristics remain solid in Canada
Since mid-2011 the labour market has been subdued. This, combined with more individuals entering the labour market and seeking employment, has resulted in a slight increase in the unemployment rate from a post-recession low of 7.2 per cent in September 2011 to 7.4 per cent in February 2012.
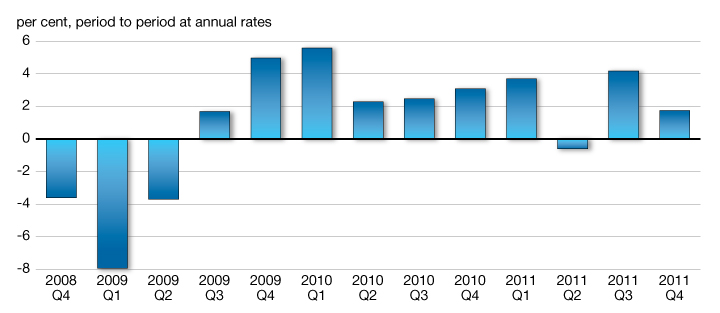
The more moderate pace of growth in employment since mid-2011 mirrors continued modest growth in real GDP, at 2.5 per cent in 2011. However, real growth showed considerable variation over the course of the year as a result of export volatility related to the Japanese earthquake and tsunami, as well as forest fire and maintenance-related disruptions in the energy sector (Chart 2.11). Household spending and business investment, on the other hand, remained resilient through this period.
Real GDP growth was modest but resilient through 2011
Financial Market Developments
The deterioration of the economic outlook, along with ongoing uncertainty related to the sovereign debt and banking crisis in Europe, continues to be reflected in financial market weakness.
Among the most at-risk European economies, Greece has been the focus of the crisis, as uncertainty over its fiscal sustainability and concerns over its ability to meet its debt obligations drove Greek bond rates up sharply late in 2011. In mid-March, Greece restructured its debt with private sector creditors. The restructuring of Greek debt, along with a massive liquidity injection into the euro-area banking system by the European Central Bank, has eased market fears to some extent. However, sovereign debt concerns remain elevated, especially for Greece, Portugal and Ireland (Chart 2.12).
Concerns over debt sustainability in Europe have pushed up borrowing costs
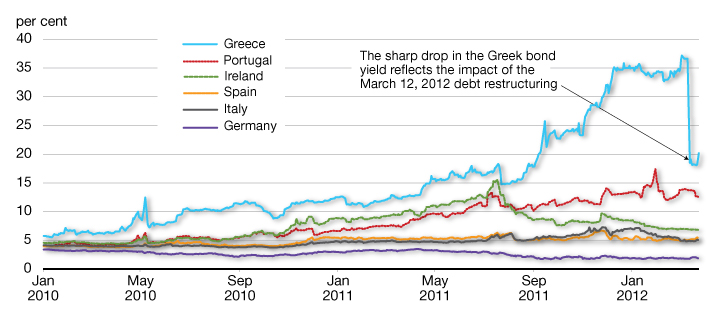
Source: Bloomberg.
More worrisome, however, has been instability in the sovereign debt markets of larger European economies. In particular, yields for both Italian and Spanish bonds rose to about 7 per cent in late 2011. The experience of Greece, Ireland and Portugal suggests that this yield may be near the threshold beyond which debt sustainability concerns escalate rapidly. While bond yields in Italy and Spain have since eased, markets continue to charge them a significant premium relative to sovereign bonds perceived as less risky (in particular German bonds).
The heightened level of uncertainty in Europe is affecting investor confidence globally. This has translated into significant weakness in equity markets worldwide, with most major global stock market indices at or below their levels of mid-2011 (Chart 2.13).
Investor uncertainty has translated into significant weakness in equity markets
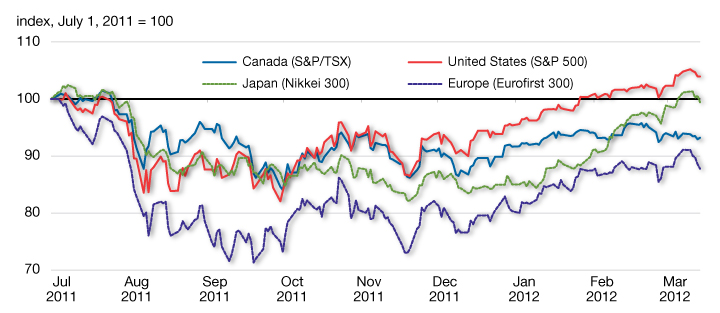
Source: Haver Analytics.
Commodity Prices
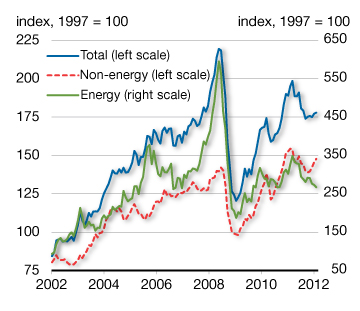
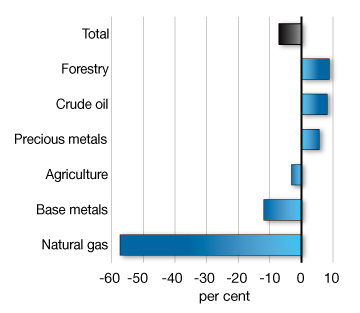
Slower-than-expected global growth and financial market weakness have also been reflected in commodity markets (Chart 2.14). Since Budget 2011, prices for base metals and agricultural products have fallen, while natural gas prices continue to be depressed by increased unconventional supply in the United States. Benchmark West Texas Intermediate crude oil prices, on the other hand, have risen since Budget 2011, reflecting increased geopolitical uncertainty related to political events in North Africa and prospects of an embargo of Iranian oil exports by Europe and other regions. Despite this rise, prices received by Canadian oil producers have fallen modestly since Budget 2011, as surplus supply in the U.S.—the market for virtually all of Canada’s oil exports—has constrained Canadian export volumes and prices.
Financial market uncertainty and weaker global growth have been reflected in volatile commodity prices
(in U.S. dollars)
(in U.S. dollars)
June 6, 2011 to March 16, 2012
Canadian Economic Outlook—Private Sector Forecasts
The average of private sector economic forecasts has been used as the basis for fiscal planning since 1994 and introduces an element of independence into the Government’s fiscal forecast. This practice has been supported by international organizations such as the IMF.
The Department of Finance regularly surveys private sector economists on their views on the outlook for the Canadian economy. The economic forecast presented in this section is based on a survey conducted in early March 2012 and includes the views of 14 private sector economists.
The March 2012 survey of private sector economists included Bank of America Merrill Lynch, BMO Capital Markets, Caisse de dépôt et placement du Québec, CIBC World Markets, the Conference Board of Canada, Desjardins, Deutsche Bank of Canada, Laurentian Bank Securities, National Bank Financial Group, Royal Bank of Canada, Scotiabank, TD Bank Financial Group, UBS Securities Canada, and the University of Toronto (Policy and Economic Analysis Program).
The outlook for Canadian real GDP growth remains largely unchanged from the November 2011 Update of Economic and Fiscal Projections (Table 2.1). Economists now expect real GDP to grow by 2.2 per cent in the first quarter of 2012 and 2.1 per cent, on average, over the remainder of the year, modestly below the pace expected in the November Update.
However, significantly stronger-than-expected GDP inflation in the latter half of 2011 has resulted in an upward revision of the average private sector forecast for the level of nominal GDP of about $17 billion, on average, over the 2012–2016 period compared to the forecast at the time of the November Update.
Private sector economists expect interest rates to be lower over most of the forecast horizon than was expected in the November Update, and continue to expect the Canadian dollar to remain near parity over the forecast horizon.
Economists expect the unemployment rate to gradually decline to 6.6 per cent by 2016, broadly in line with the Update forecast.
The private sector economic outlook is consistent with continued modest growth in the global economy. This implies an orderly, gradual resolution of the European sovereign debt crisis, with economic conditions in Europe gradually improving from weakness late in 2011 and early in 2012. Similarly, the private sector outlook is consistent with a moderate and gradual improvement of the U.S. fiscal situation.
| 20111 | 2012 | 2013 | 2014 | 2015 | 2016 | 2012–2016 | |
|---|---|---|---|---|---|---|---|
| Real GDP growth | |||||||
| March 2011 survey/Budget 2011 | 2.9 | 2.8 | 2.7 | 2.5 | 2.5 | 2.4 | 2.6 |
| September 2011 survey/Update 2011 | 2.2 | 2.1 | 2.5 | 2.5 | 2.5 | 2.3 | 2.4 |
| March 2012 survey/Budget 2012 | 2.5 | 2.1 | 2.4 | 2.4 | 2.4 | 2.2 | 2.3 |
| GDP inflation | |||||||
| March 2011 survey/Budget 2011 | 2.8 | 2.1 | 2.1 | 2.0 | 2.0 | 2.0 | 2.0 |
| September 2011 survey/Update 2011 | 3.0 | 2.0 | 2.0 | 2.0 | 2.0 | 2.0 | 2.0 |
| March 2012 survey/Budget 2012 | 3.3 | 2.4 | 2.0 | 2.1 | 2.0 | 2.0 | 2.1 |
| Nominal GDP growth | |||||||
| March 2011 survey/Budget 2011 | 5.8 | 5.0 | 4.9 | 4.5 | 4.5 | 4.4 | 4.7 |
| September 2011 survey/Update 2011 | 5.3 | 4.1 | 4.5 | 4.5 | 4.5 | 4.3 | 4.4 |
| March 2012 survey/Budget 2012 | 5.8 | 4.6 | 4.4 | 4.6 | 4.4 | 4.2 | 4.4 |
| Nominal GDP level (billions of dollars) | |||||||
| March 2011 survey/Budget 2011 | 1,719 | 1,804 | 1,893 | 1,979 | 2,068 | 2,158 | – |
| September 2011 survey/Update 2011 | 1,711 | 1,781 | 1,861 | 1,945 | 2,032 | 2,120 | – |
| March 2012 survey/Budget 2012 | 1,719 | 1,798 | 1,877 | 1,963 | 2,050 | 2,136 | – |
| Difference (March 2012 – September 2011) | 8 | 17 | 16 | 18 | 18 | 16 | 17 |
| 3-month treasury bill rate | |||||||
| March 2011 survey/Budget 2011 | 1.3 | 2.5 | 3.4 | 3.9 | 4.1 | 4.1 | 3.6 |
| September 2011 survey/Update 2011 | 0.9 | 1.2 | 2.0 | 2.9 | 3.5 | 3.7 | 2.7 |
| March 2012 survey/Budget 2012 | 0.9 | 0.9 | 1.3 | 2.2 | 3.3 | 3.9 | 2.3 |
| 10-year government bond rate | |||||||
| March 2011 survey/Budget 2011 | 3.5 | 4.0 | 4.6 | 4.8 | 5.0 | 5.1 | 4.7 |
| September 2011 survey/Update 2011 | 2.8 | 2.7 | 3.2 | 3.9 | 4.5 | 4.5 | 3.8 |
| March 2012 survey/Budget 2012 | 2.8 | 2.2 | 2.8 | 3.6 | 4.3 | 4.5 | 3.5 |
| Exchange rate (US cents/C$) | |||||||
| March 2011 survey/Budget 2011 | 99.7 | 98.8 | 98.1 | 97.4 | 96.5 | 96.2 | 97.4 |
| September 2011 survey/Update 2011 | 101.2 | 102.1 | 102.1 | 98.8 | 97.9 | 98.0 | 99.8 |
| March 2012 survey/Budget 2012 | 101.1 | 99.6 | 101.8 | 101.1 | 100.5 | 100.2 | 100.7 |
| Unemployment rate | |||||||
| March 2011 survey/Budget 2011 | 7.5 | 7.2 | 7.0 | 6.7 | 6.5 | 6.4 | 6.8 |
| September 2011 survey/Update 2011 | 7.5 | 7.2 | 7.0 | 6.8 | 6.6 | 6.4 | 6.8 |
| March 2012 survey/Budget 2012 | 7.4 | 7.5 | 7.2 | 6.9 | 6.7 | 6.6 | 7.0 |
| Consumer Price Index inflation | |||||||
| March 2011 survey/Budget 2011 | 2.4 | 2.1 | 2.0 | 2.0 | 2.0 | 2.0 | 2.0 |
| September 2011 survey/Update 2011 | 2.9 | 2.0 | 2.0 | 2.0 | 2.0 | 2.0 | 2.0 |
| March 2012 survey/Budget 2012 | 2.9 | 2.1 | 2.0 | 2.0 | 2.0 | 2.0 | 2.0 |
| U.S. real GDP growth | |||||||
| March 2011 survey/Budget 2011 | 3.1 | 3.1 | 3.2 | 3.3 | 3.2 | 2.7 | 3.1 |
| September 2011 survey/Update 2011 | 1.6 | 2.0 | 2.4 | 2.9 | 2.9 | 2.8 | 2.6 |
| March 2012 survey/Budget 2012 | 1.7 | 2.3 | 2.4 | 2.8 | 2.9 | 2.8 | 2.6 |
| 1 Values for 2011 for the March 2012 survey/Budget 2012 are actual. Sources: Department of Finance March 2011, September 2011 and March 2012 surveys of private sector economists. |
|||||||
Risk Assessment and Planning Assumptions
On March 5, 2012, the Minister of Finance met with private sector economists to discuss the economic outlook as well as the risks associated with the outlook. Following this meeting, the Department of Finance surveyed these private sector economists to obtain their most up-to-date economic projections, which include the results of the fourth-quarter National Accounts released on March 2, 2012. The economists have agreed that the average forecast from this survey—the March 2012 survey—is a reasonable basis for fiscal planning. The fiscal outlook is presented in Chapter 6.
The economists were of the view that, while there are still significant downside risks to the outlook, these risks had moderated slightly for the near term since the November 2011 Update.
The economists continued to identify the European sovereign debt and banking crisis as the main downside risk to the outlook, but felt that the risk of a severe negative economic outcome in Europe had moderated somewhat since November. The economists also saw the possibility that increases in crude oil prices due to political turmoil in the Middle East could further dampen global growth in the short run. Moreover, there remains significant uncertainty regarding the direction of U.S. fiscal policy, particularly for 2013 and beyond, as the U.S. government continues to struggle with the daunting challenge of implementing the sizable reduction in its budgetary deficit required to stabilize its debt.
The main domestic risk to the outlook identified by the economists continues to be the exposure of households to elevated levels of debt. A negative external shock to the economy, if it translated into higher unemployment rates, could trigger deleveraging on the part of those households holding elevated levels of debt.
The economists also saw the potential for stronger-than-expected growth in the U.S., particularly if recent positive momentum in labour markets becomes more entrenched.
World prices for the major commodities produced in Canada are key determinants of GDP inflation, and therefore nominal GDP. While there are both upside and downside risks to the commodity price outlook, particularly in the short term, the experience of the past decade suggests that continued strong demand from emerging economies is likely to put upward pressure on commodity prices over time. The private sector expectation for GDP inflation is consistent with largely flat commodity prices. This introduces an element of prudence into the economic-planning assumptions.
In light of ongoing downside risks surrounding the global economic outlook, the Government has judged it appropriate to adjust downward the private sector forecast for nominal GDP by $20 billion per year over the 2012–2016 period (Table 2.2). This adjustment for risk, representing a downward adjustment of $3 billion in fiscal revenues in each year of the forecast, reflects the remaining uncertainties surrounding the global economic outlook. Relative to the November Update, this adjustment is $10 billion lower for 2012, unchanged for 2013, and $10 billion higher per year in the following three years.
The Government will continue to evaluate economic developments and risks to determine whether or not it would be appropriate to maintain this downward adjustment for risk in the future.
| 2012 | 2013 | 2014 | 2015 | 2016 | |
|---|---|---|---|---|---|
| March 2012 survey of private sector economists | 1,798 | 1,877 | 1,963 | 2,050 | 2,136 |
| Budget 2012 fiscal-planning assumption | 1,778 | 1,857 | 1,943 | 2,030 | 2,116 |
| Adjustment for risk | -20 | -20 | -20 | -20 | -20 |
| Addendum | |||||
| Adjustment for risk in November 2011 Update | -30 | -20 | -10 | -10 | -10 |
[1] Conceptual differences boost the Canadian unemployment rate relative to the U.S. rate. In particular, Statistics Canada considers as unemployed those passively looking for work (e.g. reading want ads) as well as those who will begin work in the near future, while the U.S. Bureau of Labor Statistics does not include either group in its unemployment calculations. In addition, the Canadian methodology includes 15-year-olds (who have a higher-than-average unemployment rate), while the U.S. does not.