


Archived information
Archived information is provided for reference, research or recordkeeping purposes. It is not subject to the Government of Canada Web Standards and has not been altered or updated since it was archived. Please contact us to request a format other than those available.
Annex 2: The Stimulus Phase of Canada’s Economic Action Plan: A Final Report to Canadians
Highlights
- The stimulus phase of Canada’s Economic Action Plan steered the economy through the deepest global recession since the 1930s and has positioned Canada to succeed in a highly competitive global economy.
- Over 30,000 projects were completed under the stimulus phase of the Economic Action Plan. These projects have contributed to a strong labour market recovery, with over 610,000 net new jobs created since July 2009.
- This performance reflects the Government’s commitment to create jobs and opportunities for Canadians. Since January 2006, employment in Canada has increased by over 1.1 million, the strongest performance of any Group of Seven (G-7) country over this period.
- The Government was flexible in responding to the needs of Canadians during the economic recovery:
- The Government strengthened Employment Insurance (EI) benefits and froze EI premium rates in 2010. In 2011 and 2012, EI premium increases were limited to 5 cents per $100 of insurable earnings.
- The Government extended the deadline for infrastructure projects under four Economic Action Plan funds from March 31, 2011 to October 31, 2011.
- This additional flexibility gave the Government’s partners more time to complete infrastructure projects funded during the stimulus phase of the Economic Action Plan. It is estimated that almost $3.5 billion was spent in the 2011–12 fiscal year as a result of the Government’s prudent management.
- The stimulus phase of Canada’s Economic Action Plan was successful in securing the recovery by protecting jobs and families, while making important investments to contribute to Canada’s long-term economic prosperity.
- The next phase of Canada’s Economic Action Plan builds on the momentum created in the stimulus phase by continuing to focus on jobs and growth, while solidifying Canada’s long-term fiscal sustainability.
The Stimulus Phase of Canada’s Economic Action Plan
By providing over $63 billion in timely fiscal stimulus, Canada’s Economic Action Plan made important investments that will contribute to Canada’s long-term economic prosperity while supporting those most affected by the global recession. Taxes have been reduced for Canadian families and job-creating businesses; EI benefits were enhanced for the unemployed; thousands of infrastructure projects were completed across the country; significant support was provided for science and technology, industries and communities; and extraordinary actions were taken to improve access to financing.
The implementation of the stimulus phase of the Economic Action Plan was timely and completed as planned. The Government carefully designed and managed the stimulus to ensure the sound stewardship of taxpayer funds.
We found that the programs we examined were designed in a manner to allow for timely implementation while maintaining suitable controls.
— Fall 2010 Report of the Auditor General of Canada
to the House of Commons
The Government reported regularly to Canadians on the implementation of the stimulus phase of Canada’s Economic Action Plan. To date, the Government has released seven reports focusing on substantive milestones—dollars spent and outcomes achieved—and provided an additional update to Canadians as part of Budget 2011.
| Reports to Canadians | Date |
|---|---|
| Stimulus phase of Canada’s Economic Action Plan launch | January 2009 |
| First Report to Canadians | March 2009 |
| Second Report to Canadians | June 2009 |
| Third Report to Canadians | September 2009 |
| Fourth Report to Canadians | December 2009 |
| Fifth Report to Canadians (Budget 2010) | March 2010 |
| Sixth Report to Canadians | September 2010 |
| Seventh Report to Canadians | January 2011 |
| Final Report to Canadians (Budget 2012) | March 2012 |
Temporary stimulus has now been wound down, and the Government is reporting to Canadians for a final time. As the Government moves forward with the next phase of Canada’s Economic Action Plan, this annex provides details on overall results achieved since the launch of the stimulus phase in January 2009.
The stimulus phase of the Action Plan stimulated economic growth by:
- Reducing the Tax Burden for Canadians: Providing Canadians with significant, permanent personal income tax relief and encouraging businesses to make the type of productivity-enhancing investments that result in sustained economic growth.
- Helping the Unemployed: Providing more resources for EI benefits to support those who lost their jobs and supporting training and skills development programs to help Canadians get the additional skills they need for the jobs of tomorrow. This included offering additional benefits to long-tenured workers. It also included providing support to Canadian workers participating in work-sharing agreements.
- Building Infrastructure to Create Jobs: Investing in new infrastructure and stimulating housing construction to create jobs and help ensure that Canada emerged from the global economic downturn with a modern and greener infrastructure and more affordable and safe housing for lower-income Canadians. The stimulus phase of the Economic Action Plan also provided additional support to the housing sector through the Home Renovation Tax Credit.
- Advancing Canada’s Knowledge Economy and Creating Better Jobs: Improving infrastructure at colleges, universities, federal laboratories and research facilities; introducing additional support for graduate students and internships; commercializing new ideas; and strengthening research and technology leadership in Canada.
- Supporting Industries and Communities: Supporting local economies and protecting jobs in regions, communities and sectors that were most affected by the global economic downturn.
- Improving Access to Financing and Strengthening Canada’s Financial System: Ensuring the continued stability of the Canadian financial system and improving access to financing for Canadian households and businesses.
Overall, more than $60 billion in stimulus and tax reductions were delivered to the economy in 2009–10 and 2010–11, and it is estimated that almost $3.5 billion was delivered in 2011–12 (Table A2.2).
| 2009–10 | 2010–11 | 2011–12 | Total | |
|---|---|---|---|---|
| Reducing the Tax Burden for Canadians | 3,020 | 3,180 | 6,200 | |
| Helping the Unemployed | 3,348 | 5,005 | 8,353 | |
| Building Infrastructure to Create Jobs | 6,021 | 7,462 | 1,051 | 14,534 |
| Advancing Canada’s Knowledge Economy and Creating Better Jobs | 1,550 | 1,469 | 250 | 3,269 |
| Supporting Industries and Communities | 10,979 | 2,023 | 13,003 | |
| Total federal stimulus measures | 24,918 | 19,140 | 1,301 | 45,359 |
| Leveraged provincial and territorial actions | 8,553 | 7,679 | 2,164 | 18,395 |
| Total Economic Action Plan stimulus | 33,471 | 26,819 | 3,465 | 63,755 |
| Notes: Totals may not add due to rounding. Amounts for 2009–10 and 2010–11 are actual cash expenditures, while amounts for 2011–12 reflect estimated expenditures only for the four extended infrastructure programs. As a result of the extension of these programs, some funds originally planned for 2010–11 will be recorded in 2011–12. Final numbers will be released in the Public Accounts of Canada in Fall 2012. | ||||
At the federal level, it is estimated that over $45 billion was delivered through the stimulus phase of the Economic Action Plan, generating a significant boost to jobs and growth.
From the outset of the stimulus phase of the Economic Action Plan in early 2009, the Government worked closely with partners in provinces and territories to identify priority and shovel-ready infrastructure projects. For many stimulus programs, the Government required that federal contributions be matched by equal or greater contributions from provinces territories and municipalities, thereby ensuring maximum impact from the Economic Action Plan.
In many cases, provinces, territories and municipalities chose to contribute more than the amounts required under program contribution agreements, thereby allowing larger and more ambitious infrastructure projects to be funded through the Plan. Taking into account these additional contributions, it is estimated that over $63 billion in stimulus and tax reductions were delivered to the economy between 2009–10 and 2011–12.
Canada has emerged from the recession of 2008-2009 as a leader in the pack of industrialized nations. And while it is important not to rest on our laurels, Canadian economic and fiscal fundamentals are a rightful source of pride for our business and political leaders. (The Finance Minister) has guided the economy through the recession with a deft hand, and is now set to return his government to the important path of fiscal sustainability.
—Richard Gauthier, CEO, Canadian Automobile Dealers Association
March 9, 2011, Globe and Mail
Prudent and Flexible Management
In order for the stimulus to be effective, it had to deliver important economic and job-creating results when Canada needed it the most. The Government worked with provincial, territorial and municipal partners to ensure that stimulus funds were spent effectively and in a timely manner so that communities benefited from the economic recovery.
While the majority of infrastructure projects were completed by March 31, 2011, consultations with provinces, territories and municipalities in Fall 2010 revealed that a number of infrastructure projects were at risk of not being completed by the March 31st deadline. In response to these concerns, the Government extended the project completion deadline to October 31, 2011 under four cost-shared infrastructure programs, providing additional flexibility to its partners and extending stimulus benefits by an additional construction season. While this extension had some impact on the timing of expenditures between fiscal years 2010–11 and 2011–12, it did not impose any additional costs on the Government, as it entailed a change in the profile of budgeted funds and not new allocations of funding.
This additional flexibility gave the Government’s partners more time to complete infrastructure projects funded during the stimulus phase of the Economic Action Plan. It is estimated that 2,270 projects were completed as a result of the extension.
Over 30,000 Projects Have Been Completed
In total, based on the most recent reports received, 30,200 projects have been completed with support from Canada’s Economic Action Plan, since January 2009. These included:
- Roughly 7,500 provincial, territorial and municipal infrastructure projects, including almost 4,000 Infrastructure Stimulus Fund projects and over 1,900 Recreational Infrastructure Canada projects.
- Over 500 projects to improve infrastructure at colleges and universities across the country.
- 258 projects to improve small craft harbours.
- Over 1,850 projects to assist communities hardest hit by the recession through the Community Adjustment Fund.
- 147 cultural infrastructure projects.
- Over 200 projects to upgrade facilities at National Parks and National Historic Sites.
- 249 projects to modernize federal laboratories.
- Roughly 1,800 projects to renovate and repair federal buildings.
- Over 300 projects to enhance the accessibility of Crown-owned buildings for persons with disabilities.
- 97 First Nations infrastructure projects.
- An estimated 16,500 social housing and First Nations housing projects.
The Economic Action Plan was a partnership between governments to protect Canadians during a global crisis—and that partnership has delivered results. Municipalities are co-funding $10 billion worth of stimulus projects that will keep 100,000 Canadians on the job and supporting their families.
— Hans Cunningham, Past President of the Federation
of Canadian Municipalities, December 2010
The Stimulus Phase of Canada’s Economic Action Plan Protected Canadian Jobs
Economic developments since the introduction of the stimulus phase of Canada’s Economic Action Plan underscore its success in protecting Canadian jobs through strong support to the domestic economy. As a result, there are more than 610,000 Canadians working today than in July 2009, and Canada has posted the strongest growth in employment among G-7 countries (Chart A2.1).
Canada has experienced the strongest growth in employment among G-7 countries during the recovery
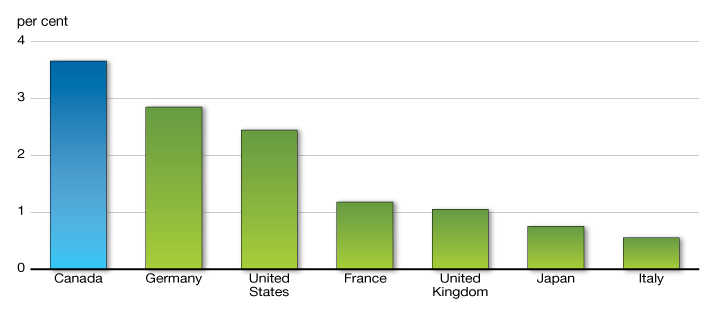
Sources: Haver Analytics; Department of Finance calculations.
This performance was remarkable given that the global recession posed a particularly significant challenge for the Canadian economy. We faced losses in the value of our exports not only from weaker demand from our trading partners, but also from sharply lower commodity prices. These factors, along with the negative impact of the global financial market crisis on Canadian credit and equity markets, resulted in sharp declines in consumer and business confidence during the early stages of the global recession.
With the implementation of the stimulus phase of the Economic Action Plan in early 2009, however, Canada’s economic situation stabilized, and output and jobs began to grow again. This resulted in a rebound in consumer and business confidence, despite ongoing external weakness in the global economy. Stronger confidence, in turn, was reflected in:
- A solid rebound in consumer spending growth, which averaged close to 3 per cent per quarter over the stimulus phase of the Economic Action Plan, reflecting in part the positive impacts of tax relief and stimulus spending, as well as support for the unemployed through enhanced EI benefits and training programs.
- Strong growth in residential investment, bolstered by temporary measures introduced to support the housing market. In particular, with support from the Home Renovation Tax Credit, which provided Canadian homeowners with approximately $2.3 billion in tax relief, home renovation spending growth averaged over 18 per cent per quarter from the second quarter of 2009 through the first quarter of 2010.
- A resurgence in private business investment growth, which returned to positive territory in early 2010 and averaged over 16 per cent per quarter over the remainder of the stimulus phase of the Economic Action Plan.
- Finally, government investments in infrastructure were key to the success of the Economic Action Plan, with average government investment growth of almost 15 per cent per quarter during the stimulus phase of the Economic Action Plan.
The Government’s Policies Are Supporting
a Strong Job Market
The Government’s sound policies and prudent management have contributed to significant job growth in Canada. Since January 2006, employment in Canada has increased by over 1.1 million, the strongest performance of any G-7 country over this period.
- Over 610,000 jobs have been created since July 2009, more than offsetting all of the jobs lost during the recession.
- About 90 per cent of the jobs created since July 2009 have been full-time jobs and over 75 per cent have been high-quality jobs in high-wage industries and in the private sector.
Canada’s labour market has performed better than its G-7 peers, with Canada posting the strongest employment growth among G-7 countries over the recovery (Chart A2.1).
In the last few years, Canada has got every major decision right. Look at the facts. Not a single Canadian bank fell or faltered during the global banking crisis. Canada got to grips with its deficit and was running surpluses and paying down debt before the recession, fixing the roof while the sun was shining. Your economic leadership has helped the Canadian economy to weather the global storms far better than many of your international competitors.
— David Cameron, Prime Minister, United Kingdom,
September 22, 2011
Results Achieved
The following section reports on key overall results achieved under the stimulus phase of Canada’s Economic Action Plan. Actions taken during the stimulus phase are divided into six themes:
- Reducing the Tax Burden for Canadians
- Helping the Unemployed
- Building Infrastructure to Create Jobs
- Advancing Canada’s Knowledge Economy and Creating Better Jobs
- Supporting Industries and Communities
- Improving Access to Financing and Strengthening Canada’s Financial System
Reducing the Tax Burden for Canadians
The tax reductions provided during the stimulus phase of Canada’s Economic Action Plan were an essential part of the Government’s effort to boost economic growth and establish a competitive business environment, which helps create more and better-paying jobs and increase living standards for Canadians. The tax reductions built on actions taken since 2006 and reinforced the Government’s ambitious agenda of creating a tax system that fuels investment and job creation in Canada.
Actions taken by the Government since 2006, including those in the stimulus phase of the Economic Action Plan, will reduce taxes on individuals, families and businesses by an estimated $220 billion over 2008–09 and the following five fiscal years. In total, the Government has introduced more than 140 tax relief measures since 2006.
Tax relief for Canadian families and individuals (not including housing-related tax relief) provided under the stimulus phase of the Economic Action Plan from 2008–09 to 2010–11 totalled $6.9 billion. These permanent measures provide tax relief on an ongoing basis.
| 2008–09 | 2009–10 | 2010–11 | Total | |
|---|---|---|---|---|
| Personal income tax relief for all taxpayers | 470 | 1,885 | 1,950 | 4,305 |
| Increases to the National Child Benefit supplement and the Canada Child Tax Benefit | 230 | 310 | 540 | |
| Enhancing the Working Income Tax Benefit | 145 | 580 | 580 | 1,305 |
| Targeted relief for seniors | 80 | 325 | 340 | 745 |
| Total–Reducing the Tax Burden for Canadians | 695 | 3,020 | 3,180 | 6,895 |
| Notes: Totals may not add due to rounding. The Canada Child Tax Benefit and the National Child Benefit supplement are considered expenditures for budgetary purposes and thus should not be included in calculations of total tax relief. | ||||
Tax Relief for Individuals and Families
The stimulus phase of the Economic Action Plan introduced significant new personal income tax reductions that have provided relief, particularly for low- and middle-income Canadians, as well as measures to help Canadians purchase or improve their homes. These tax reductions allow individuals and families to keep more of their hard-earned money and improve incentives to work, save and invest, while also contributing to the Government’s long-term economic agenda. For example, the Government:
- Increased the amount of income that Canadians can earn before paying federal income tax, and increased the top of the two lowest income tax brackets so that Canadians can earn more income before being subject to higher tax rates.
- Introduced the Working Income Tax Benefit in Budget 2007, and effectively doubled it in the stimulus phase of Canada’s Economic Action Plan. This enhancement lowered the “welfare wall,” further strengthening work incentives for low-income Canadians already in the workforce and encouraging other low-income Canadians to enter the workforce. Canadians have been able to receive enhanced benefits since filing their 2009 tax return.
- Raised the level at which the National Child Benefit supplement for low-income families is fully phased out and the level at which the Canada Child Tax Benefit begins to be phased out, which is providing a benefit of up to $443 per year (in the 2011–12 benefit year) for a family with two children. Additional monthly benefits under these programs began to be paid to families with children in July 2009.
- Increased the Age Credit amount by $1,000 in 2009 to provide tax relief to low- and middle-income seniors. With indexation, this means additional tax savings of up to $157 for low-income seniors in 2012.
- Introduced a new tax credit of up to $750 to assist first-time home buyers and provided them with additional access to their Registered Retirement Savings Plan savings to purchase or build a home.
Tax Relief for Families Since 2006: Example
Michael and Kate are a couple with two children. Michael earns $40,000 and Kate earns $60,000. As a result of actions taken by the Government since 2006, they are expected to pay $2,145 less in personal income tax and $960 less in GST, for a total of $3,105 in tax relief in 2012. Michael and Kate also receive an additional $81 in child benefits.
Supporting Families With Children
Since 2006, the Government has significantly increased support for families to better assist them with the costs of raising children:
- The Universal Child Care Benefit, available since July 2006, gives families with young children more choice in child care by providing $100 per month for each child under age 6.
- The Child Tax Credit, available since 2007, recognizes the expenses associated with raising children by providing personal income tax relief of up to $329 in 2012 for each child under age 18.
- The Children’s Fitness Tax Credit, available since 2007, promotes physical fitness among children through a 15-per-cent credit on up to $500 in eligible fees for the enrolment of a child under age 16 in an eligible program of physical activity.
- The Children’s Arts Tax Credit, available since 2011, promotes children’s participation in artistic, cultural, recreational or developmental activities through a 15-per-cent credit on up to $500 in eligible fees for the enrolment of a child under age 16 in an eligible program.
- The amount that families can earn before the National Child Benefit supplement is fully phased out—or before the base benefit under the Canada Child Tax Benefit begins to be phased out—was increased starting in July 2009. As a result, a low-income family with two children receives an additional benefit of up to $443 in the 2011–12 benefit year.
- The spousal and other related amounts were increased to equal the basic personal amount so that single-earner families, including single parents, receive the same tax treatment as two-earner families, effective 2007.
- To help families with children with disabilities, the Government introduced the Registered Disability Savings Plan (RDSP) starting in 2008, and increased the Child Disability Benefit component of the Canada Child Tax Benefit as of July 2006. Families with infirm children may also claim the new Family Caregiver Tax Credit, a 15-per-cent credit on an amount of $2,000 available starting in 2012. Budget 2012 introduces several measures to improve the RDSP. These measures will give RDSP beneficiaries and their families increased flexibility to establish, contribute to and access savings from their plans.
- To help families with education costs, the Government took several actions to strengthen Registered Education Savings Plans and expand and enhance the Canada Student Loans Program, and launched the new consolidated Canada Student Grants Program. The Government also exempted scholarship and bursary income from tax and introduced the Textbook Tax Credit.
- Families are major beneficiaries of the substantial tax relief the Government has provided to all Canadians, such as the 2-percentage-point reduction in the Goods and Services Tax, broad-based personal income tax reductions, and the introduction of the Tax-Free Savings Account, which helps Canadians meet lifetime savings needs.
- In addition, many families are benefiting from other more targeted tax measures introduced since 2006, such as the Working Income Tax Benefit, the Canada Employment Credit, the Public Transit Tax Credit and the First-Time Home Buyers’ Tax Credit.
- The average family of four is now saving more than $3,100 per year in taxes, and more than 1 million low-income Canadians have been removed from the tax rolls in 2012.
- Altogether, actions taken since 2006 will provide about $160 billion of tax relief for individuals and families over 2008–09 and the following five fiscal years.
Supporting Low-Income Working Canadians
Canada’s tax system ensures that people with lower incomes contribute a smaller proportion of their income in taxes. Indeed, more than 40 per cent of all taxpayers pay no net tax; that is, their tax liabilities are either nil or offset by income-tested benefits such as the Canada Child Tax Benefit and the GST Credit. In addition, low-income Canadians now pay significantly less tax and receive more benefits due to actions taken by the Government since 2006. In fact, in 2012, one third of the personal income tax relief provided by the Government will go to Canadians with incomes under $41,544, even though they pay about 13 per cent of taxes.
Since it was introduced in 2007, the Working Income Tax Benefit (WITB) has lowered the welfare wall, so that low-income individuals may keep more of their earnings. In 2012, if the WITB had not been introduced, a typical low-income single parent in Nova Scotia would have only kept about 28 cents of each additional dollar earned between $3,000 and $10,000, due to reduced benefits from federal and provincial income-tested programs and taxes. As a result of the enhanced WITB, the same family will keep about 53 cents of each additional dollar earned.
Other tax relief provided by the Government has also helped low-income working Canadians. For example, the amount that a single parent with one child can earn in 2012 before paying taxes has increased by $5,324 to $26,557 as a result of the introduction of the Canada Employment Credit, the Child Tax Credit and legislated increases to the basic personal amount, and the Eligible Dependant Credit.
Tax Relief for Job-Creating Businesses
A competitive business tax system is essential for creating an environment that encourages new investment, growth and job creation in Canada. In 2007, Parliament passed a bold tax reduction plan that lowered the federal general corporate income tax rate from 22.12 per cent in 2007 (including the corporate surtax that was eliminated in 2008) to 15 per cent in 2012. The stimulus phase of the Economic Action Plan built on these corporate income tax reductions to help position businesses to weather the effects of global economic challenges, invest in Canada, and spur innovation and growth—thereby creating more and better-paying jobs for Canadian workers. Stimulus measures included:
- Help for businesses to adopt newer technology at a faster pace: a temporary 100-per-cent capital cost allowance (CCA) rate was introduced for computers acquired after January 27, 2009 and before February 1, 2011.
- Help for businesses in manufacturing and processing industries to restructure and retool to position themselves for long-term success: the temporary 50-per-cent straight-line accelerated CCA rate for investments in manufacturing or processing machinery and equipment was extended to include investments undertaken in 2010 and 2011. This measure was first introduced in Budget 2007 and was extended, most recently in Budget 2011, to include investments undertaken before 2014.
- Support for small businesses: the amount of small business income eligible for the reduced federal income tax rate was further increased to $500,000 effective January 1, 2009, following a previous increase to $400,000 from $300,000 as of January 1, 2007.
- Support for mineral exploration activity across Canada: the temporary Mineral Exploration Tax Credit was extended.
These measures provided immediate economic stimulus, while also encouraging the type of productivity-enhancing investments that result in sustained growth.
Including measures in the stimulus phase of the Economic Action Plan, the Government has introduced business tax relief totalling roughly $60 billion over 2008–09 and the following five fiscal years.
Business tax cuts are benefiting Canadians in very important ways … If governments had not provided tax relief for Canadian businesses, the recession would have been deeper and unemployment would have certainly been higher … (now) we have a corporate sector that is better poised to take advantage of new market opportunities, which will, in turn, continue to generate job growth.
— Jayson Myers, President & CEO,
Canadian Manufacturers and Exporters
January 25, 2012 press release
Supporting Small Businesses
The tax system provides considerable support to small businesses through a lower corporate income tax rate, incentives for investors, enriched financial support for research and development (R&D) and simplified compliance.
Since 2006, the Government has introduced a large number of tax measures to support investment, innovation and growth by small businesses, including:
- To help small businesses retain more of their earnings for investment, expansion and job creation, the lower small business tax rate was reduced to 11 per cent from 12 per cent in 2008. The amount of income eligible for this lower rate was increased from $300,000 to $400,000 in 2007, and then to $500,000 in 2009.
- To spur investment in small businesses, Budget 2007 increased the Lifetime Capital Gains Exemption on qualified small business shares to $750,000 from $500,000, the first increase in the exemption since 1988.
- To enhance support for R&D through the Scientific Research and Experimental Development tax incentive program, Budget 2008 increased the amount of expenditures eligible for the higher, refundable tax credit to $3 million and extended eligibility to medium-sized companies by increasing the taxable capital and income limits.
- To help innovative companies attract venture capital, Budget 2010 narrowed the definition of taxable Canadian property, thereby eliminating the need for tax reporting under section 116 of the Income Tax Act for many investments. This improves the ability of Canadian businesses, including innovative high-growth companies that contribute to job creation and economic growth, to attract foreign venture capital.
- To encourage hiring in the small businesses sector, Budget 2011 announced a temporary Hiring Credit for Small Business of up to $1,000 against a small employer’s increase in its 2011 EI premiums over those paid in 2010. This temporary credit was available to approximately 525,000 employers whose total EI premiums were at or below $10,000 in 2010, reducing their 2011 payroll costs by about $165 million.
- To assist employers facing challenges, Budget 2011 also made available an extension of up to 16 weeks for active or recently terminated EI work-sharing agreements.
Budget 2012 further supports small businesses by announcing:
- An extension of the Hiring Credit for Small Business for one year, which will provide a credit of up to $1,000 against a small employer’s increase in its 2012 EI premiums over those paid in 2011.
- A new approach to setting EI premium rates that will ensure predictability and stability by limiting rate increases to 5 cents per year until the EI Operating Account is balanced, after which the Canada Employment Insurance Financing Board will be mandated to set a seven-year break-even rate to be recalculated every year.
- Actions to reduce the tax compliance burden for small businesses. This includes doubling the thresholds for eligibility to use the GST/HST streamlined accounting methods, simplifying administration for partnerships, and improving the rules for paying eligible dividends.
As a result of federal and provincial business tax changes, Canada has an overall tax rate on new business investment that is lower than that in any other G-7 country and below the average of the member countries of the Organisation for Economic Co-operation and Development (OECD) (Chart A2.2).
Canada leads the G-7 with the lowest overall tax rate on new business investment
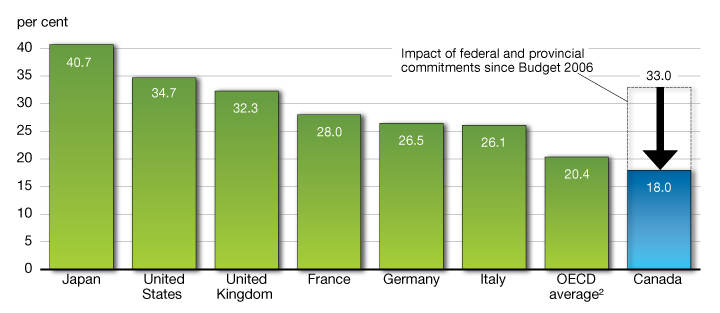
1 The marginal effective tax rate (METR) on new business investment takes into account federal, provincial and territorial statutory corporate income tax rates, deductions and credits available in the corporate tax system and other taxes paid by corporations, including provincial capital taxes and retail sales taxes on business inputs. The methodology for calculating METRs is described in the 2005 edition of Tax Expenditures and Evaluations (Department of Finance).The METR includes measures announced as of January 1, 2012.
It excludes resource and financial sectors and tax provisions related to research and development.
2 OECD average excludes Canada.
Source: Department of Finance.
The government's commitment to reducing the general corporate income tax rate to 15% by 2012 is important to our ongoing economic recovery and should be applauded.
— Gabe Hayos, Canadian Institute of Chartered Accountants
House of Commons Standing Committee on Finance
October 18, 2011
Improving the competitiveness of the Canadian tax system requires collaboration among all governments to help Canadian businesses compete globally. Provinces and territories have also taken action to enhance Canada’s business tax advantage (Chart A2.3.). These actions are helping Canada build a strong foundation for future economic growth, job creation and higher living standards for Canadians.
Combined, federal and provincial tax changes have improved Canada’s tax competitiveness
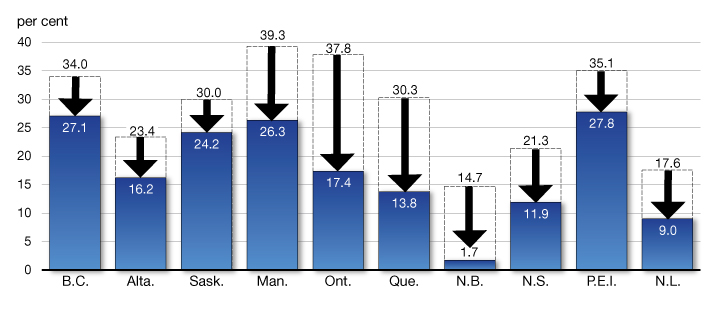
Source: Department of Finance.
| 2008–09 | 2009–10 | 2010–11 | Total | |
|---|---|---|---|---|
| Personal income tax relief for all taxpayers | 470 | 1,885 | 1,950 | 4,305 |
| Increases to the National Child Benefit supplement and the Canada Child Tax Benefit | 230 | 310 | 540 | |
| Enhancing the Working Income Tax Benefit | 145 | 580 | 580 | 1,305 |
| Targeted relief for seniors | 80 | 325 | 340 | 745 |
| Total–Reducing the Tax Burden for Canadians | 695 | 3,020 | 3,180 | 6,895 |
| Reference: | ||||
| Tax and Tariff Measures to Support Housing and Business | ||||
| Home Renovation Tax Credit | 2,265 | 2,265 | ||
| Increasing withdrawal limits under the Home Buyers’ Plan | 15 | 15 | 30 | |
| First Time Home Buyers’ Tax Credit | 130 | 115 | 245 | |
| Mineral Exploration Tax Credit for flow-through share investors | 70 | -15 | 55 | |
| Increasing the income limit for the small business tax rate | 45 | 80 | 125 | |
| Temporary 100-per-cent capital cost allowance rate for computers | 340 | 355 | 695 | |
| Tariff relief on machinery and equipment | 76 | 81 | 157 | |
| Temporary acceleration of the capital cost allowance rate for manufacturing or processing machinery and equipment | ||||
| Notes: Totals may not add due to rounding. The Canada Child Tax Benefit and the National Child Benefit supplement are considered expenditures for budgetary purposes and thus should not be included in calculations of total tax relief. | ||||
Helping the Unemployed
The stimulus phase of Canada’s Economic Action Plan included $8.4 billion over two years to support workers most affected by the global recession. Because of the quick and decisive measures taken by the Government, Canada’s economy has more than recovered all of the jobs lost during the downturn. As temporary stimulus measures began to wind down, the Government took additional steps to secure the recovery by limiting Employment Insurance (EI) premium rate increases to 5 cents per $100 of insurable earnings for 2011 and 2012 and 10 cents for subsequent years.
| 2009–10 | 2010–11 | Total | |
|---|---|---|---|
| Strengthening benefits for Canadian workers | 1,259 | 1,680 | 2,938 |
| Enhancing the availability of training | 896 | 948 | 1,844 |
| Keeping EI rates frozen for 2010 | 1,193 | 2,378 | 3,571 |
| Total–Helping the Unemployed | 3,348 | 5,005 | 8,353 |
| Note: Totals may not add due to rounding. | |||
Over the course of the downturn, the EI program provided Canadians with needed temporary support. In 2009–10, the Government spent approximately $5.3 billion more in EI benefits than during the previous year.
Supporting Workers
The Government of Canada provides significant support to Canadian workers, including programs and services for those looking to first enter the labour market, those looking to upgrade their skills and training, and those in need of support during periods of unemployment.
Since 2006, the Government has introduced important measures aimed at ensuring a more skilled and inclusive workforce. Investments have included:
- Putting in place the Targeted Initiative for Older Workers in 2006 to support a range of employment activities for unemployed older workers in vulnerable communities. Canada’s Economic Action Plan provided an additional $60 million over three years for the Targeted Initiative for Older Workers to help older workers remain active and productive participants in the labour market. Budget 2011 then provided $50 million over two years to extend the Initiative until 2013–14.
- Introducing a new labour market training architecture in Budget 2007, making available $3 billion over six years to provinces and territories for the design and delivery of labour market programs with a focus on assisting groups under-represented in the labour force, including persons with disabilities, Aboriginal peoples, recent immigrants and older workers.
- Providing $7 billion over two years, under the Economic Action Plan, for direct support to workers most affected by the recession. The Canada Skills and Transition Strategy included investments to: strengthen EI benefits, work-sharing and wage protection benefits; significantly expand the availability of training opportunities, including for older workers, youth and Aboriginal peoples; encourage completion of apprenticeships; facilitate the recognition of foreign credentials; and freeze EI premium rates for two years.
Budget 2010 announced additional, targeted actions to protect Canadian workers and their jobs from the effects of the global economic recession by:
- Temporarily extending the maximum length of work-sharing agreements to protect jobs, allowing more workers to keep their jobs while employers retained skilled employees with years of experience.
- Providing $108 million over three years to assist young people looking to gain skills and experience. This included a one-year $30-million increase in funding for the Career Focus component of the Youth Employment Strategy as well as $20 million in support of Pathways to Education Canada’s work to support disadvantaged youth.
- Budget 2011 provided additional support by extending for up to 16 weeks active or recently terminated work-sharing agreements, further protecting workers’ jobs.
The Government has also introduced a number of tax measures to support Canadian workers, including:
- The Canada Employment Credit, introduced in Budget 2006, provides tax recognition for work-related expenditures such as home computers, uniforms and supplies.
- The Tradesperson’s Tools Deduction, introduced in Budget 2006, allows tradespersons to deduct from their income part of the cost of tools they must acquire as a condition of employment.
- The Apprenticeship Job Creation Tax Credit, introduced in Budget 2006, encourages employers to hire new apprentices in eligible trades.
- The Working Income Tax Benefit, introduced in Budget 2007, strengthens work incentives for low-income Canadians already in the workforce and encourages low-income Canadians to enter the workforce. The Economic Action Plan effectively doubled the tax relief provided by the Working Income Tax Benefit for 2009 and future years.
- This tax relief builds on the support provided to apprentices through the Apprentice Incentive Grant provided in Budget 2006 and the Apprenticeship Completion Grant, which was introduced in Budget 2009.
In addition, Budget 2012 provides:
- $50 million over two years to enable the Youth Employment Strategy to help more young Canadians get the information and gain the skills, work experience and abilities they need to make a successful transition to the workplace.
- $21.3 million over two years to help unemployed Canadians get back to work more quickly by enhancing the content and timeliness of labour market information that is provided to them. The Government will also clarify what is expected of Canadians with respect to their job search activities while they are receiving regular EI benefits.
- $74.0 million over two years to introduce a new, national three-year EI pilot project that will allow claimants to earn more money while receiving EI benefits. This new pilot project will mean those working while on EI claim will see their benefits reduced by only 50 per cent of earnings. This change means that claimants will be able to earn more and have a higher total income while they are on claim.
- An improved way to calculate EI benefits that will reduce disincentives to taking all available work. Beginning April 2013, claimants will have their EI benefits calculated based on the highest weeks of earnings over the year preceding a claim. The number of weeks will vary from 14 to 22, depending on the unemployment rate in the claimant’s EI region.
- A commitment to protect long-term disability benefits of employees in the federally regulated private sector by requiring employers to insure, on a go-forward basis, any long-term disability plans they offer to their employees.
In addition to much-needed temporary assistance, the stimulus phase of the Economic Action Plan invested in training for Canadian workers so they can take advantage of new opportunities as the economy recovers. The Plan’s support for the unemployed included:
- An extra five weeks of EI benefits were provided to more than 1.2 million EI claimants.
- EI premium rates in 2010 were frozen at $1.73 per $100 of insurable earnings—their lowest level since 1982.
- Nearly 12,000 long-tenured unemployed workers have received additional assistance through the Career Transition Assistance program in order to participate in long-term training.
- To date, almost 225,000 long-tenured workers have received 5 to 20 weeks of additional EI benefits.
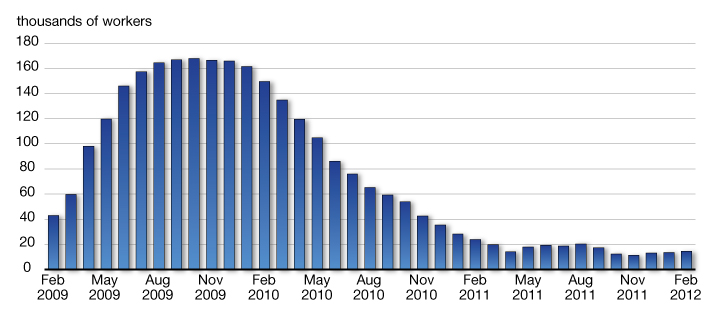
- In December 2011, over 13,000 Canadians were participating in more than 550 work-sharing agreements. At its peak in October 2009, over 165,000 Canadians were participating in work-sharing agreements. In order to support a continued recovery for Canadian businesses and workers, the Government announced, as part of the November 2011 Update of Economic and Fiscal Projections, an additional extension of up to 16 weeks for active, recently terminated or new work-sharing agreements. The extension will be phased out by October 2012.
- Since April 1, 2009, payments have been made to more than 40,600 claimants under the Wage Earner Protection Program.
- The Government provided $750 million per year to the provinces and territories in 2009–10 and 2010–11 in support of training and skills development programs, which has benefited more than 200,000 Canadians annually.
- Projects under the enhanced Targeted Initiative for Older Workers provided support to over 12,000 older workers. Due to the success of the initiative, Budget 2011 provided $50 million over two years to extend the program.
- Training and skills development was provided to close to 19,800 Aboriginal people through the Aboriginal Skills and Employment Partnership program and the Aboriginal Skills and Training Strategic Investment Fund.
- Support is being provided to implement the Pan-Canadian Framework for the Assessment and Recognition of Foreign Qualifications. To date, funding has supported 67 contribution agreements, including projects with seven provincial and territorial governments and 21 different professions, to assist with the implementation of the Framework.
- Funding has supported 1,008 youth internships in not-for-profit and community service organizations through the YMCA and YWCA, 91 per cent of which have an environmental focus.
The number of Canadian workers benefiting from work-sharing has fallen as the recovery takes hold
Work-Sharing Agreements
Canada’s Economic Action Plan:
Working for Canadians
Aboriginal Skills and Employment Partnership Program
Edmonton, Alta.—Sean Mangal got a solid foothold in the pipes trade through Trade Winds to Success, an 18-week pre-apprenticeship training program that ensures Aboriginal peoples are positioned to benefit from Alberta’s construction industry in occupations such as boilermakers, ironworkers, carpenters and pipe/steamfitters. Trade Winds to Success enabled Sean to obtain a job in his chosen field as a pipefitter with Arpi’s North Inc., working on projects such as the Edmonton International Airport expansion.
Enhanced Work Sharing
Mississauga, Ont.—Since being founded in 1936, the Mascot Truck Parts company has become one of the largest heavy-duty specialists in North America, applying its expertise to rebuilding all makes of transmissions, differentials and steering gears. The economic downturn hit the manufacturing and automotive industry hard and Mascot felt the impact. To avoid layoffs, the company signed a work-sharing agreement that allowed it to keep 107 employees and the business running.
Apprenticeship Grants
Vancouver, B.C.—Ross Redeker’s love for working with his hands has led him to become a successful and well-paid plumber. His previous job as a warehouse manager was not giving him the sort of job satisfaction he had been looking for, and he wanted to make a change. He left the warehouse job to become a plumber apprentice. Currently employed at Bridge Mechanical, the company that hired him four years ago, Ross is grateful to the Government of Canada for providing the apprenticeship grants. “I want to thank you for making these programs available. It has not only given me financial assistance to obtain a job that I enjoy, but it has given me a sense of pride. When people ask what I do for a living, I can say ‘I am a certified plumber.’”
| 2009–10 | 2010–11 | Total | |
|---|---|---|---|
| Strengthening Benefits | |||
| An extra 5 weeks of EI benefits | 796 | 796 | 1,592 |
| EI—long-tenured workers (Career Transition Assistance program) | 15 | 83 | 98 |
| EI—long tenured workers (extension of regular benefits) | 215 | 731 | 946 |
| EI—work sharing | 211 | 49 | 260 |
| Wage Earner Protection Program | 22 | 21 | 43 |
| Subtotal—Strengthening Benefits | 1,259 | 1,680 | 2,938 |
| Enhancing the Availability of Training | |||
| EI training programs | 500 | 500 | 1,000 |
| Strategic Training and Transition Fund | 250 | 250 | 500 |
| Canada Summer Jobs Program | 10 | 10 | 20 |
| Federal public service student employment program | 10 | 10 | 20 |
| YMCA/YWCA | 15 | 15 | |
| Targeted Initiative for Older Workers | 5 | 21 | 26 |
| Apprenticeship Completion Grant | 39 | 40 | 79 |
| Foreign Credential Recognition program | 12 | 22 | 35 |
| Aboriginal Skills and Employment Partnership program | 7 | 48 | 56 |
| Aboriginal Skills and Training Strategic Investment Fund | 24 | 46 | 70 |
| Aboriginal Human Resource Development Strategy | 23 | 23 | |
| Subtotal—Enhancing the Availability of Training | 896 | 948 | 1,844 |
| Keeping EI rates frozen for 2010 | 1,193 | 2,378 | 3,571 |
| Total—Helping the Unemployed | 3,348 | 5,005 | 8,353 |
| Notes: Totals may not add due to rounding. Spending figures exclude employee benefit plan and accommodation costs. | |||
Building Infrastructure to Create Jobs
State-of-the-art transportation infrastructure helps move people and goods to markets, and improves business competitiveness, allowing the economy to grow and prosper. Other types of public infrastructure, such as clean drinking water systems and cultural and recreational facilities, improve public health and enhance the quality of life for Canadian families.
| 2009–10 | 2010–11 | 2011–12 | Total | |
|---|---|---|---|---|
| Building Infrastructure | ||||
| Investments in provincial, territorial and municipal infrastructure | 852 | 3,469 | 1,051 | 5,373 |
| Investments in First Nations infrastructure | 229 | 280 | 510 | |
| Federal infrastructure | 943 | 713 | 1,657 | |
| Subtotal—Building Infrastructure | 2,025 | 4,463 | 1,051 | 7,540 |
| Stimulating Housing Construction | ||||
| Support for home ownership and the housing industry | 2,596 | 321 | 2,917 | |
| Investments in social housing for Canadians | 1,399 | 2,678 | 4,077 | |
| Subtotal—Stimulating Housing Construction | 3,995 | 2,999 | 6,994 | |
| Total—Building Infrastructure to Create Jobs | 6,021 | 7,462 | 1,051 | 14,534 |
| Total—With provincial contributions | 8,019 | 13,934 | 2,816 | 24,769 |
| Notes: Totals may not add due to rounding. Spending figures exclude employee benefit plan and accommodation costs. Amounts for 2009–10 and 2010–11 are actual cash expenditures, while amounts for 2011–12 reflect estimated expenditures for the four extended infrastructure programs. As a result of the extension of these programs, some funds originally planned for 2010–11 will be recorded in 2011–12. Final numbers will be released in the Public Accounts of Canada in Fall 2012. The budgetary impact may be somewhat smaller because some of these expenditures relate to construction and renovation costs of federal assets (for which only depreciation is recorded on a budgetary basis) and loans to third parties (where there is a budgetary impact only in the event that there is a risk of loss). | ||||
In the shorter term, infrastructure and housing investments are widely recognized as an effective means to boost economic activity and put people to work. That is why the Government delivered about $14.5 billion during the stimulus phase of Canada’s Economic Action Plan to modernize a broad range of infrastructure including our roads, bridges, public transit, parks and water treatment facilities, and to support home ownership, help stimulate the housing sector, and improve housing across Canada. These investments, including those in new infrastructure and the rehabilitation of existing assets, helped to create and maintain jobs across Canada during the economic downturn, and will continue to benefit all Canadians for many years.
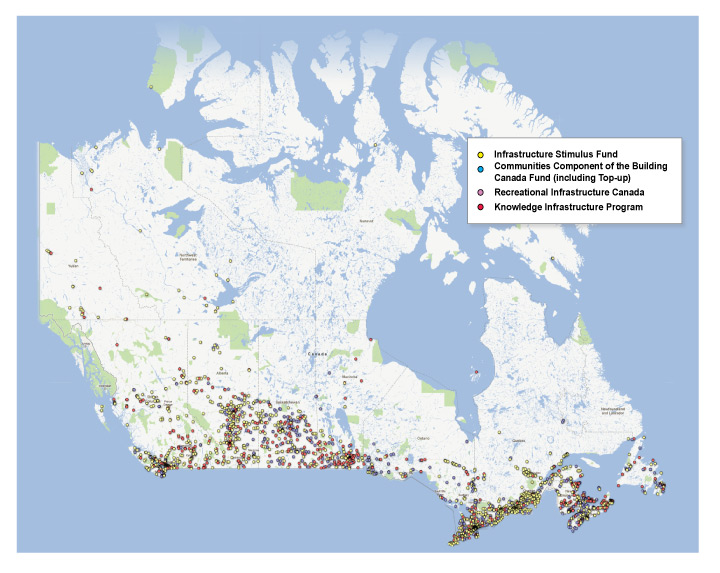
While the majority of projects announced as part of the stimulus phase of Canada’s Economic Action Plan were completed by March 31, 2011, a number of provincial/territorial, municipal and not-for-profit projects facing scheduling challenges benefited from a one-time seven-month extension to the deadline for completing infrastructure projects. This flexibility provided the Government’s partners with an additional construction season to complete projects under the following four programs: the Infrastructure Stimulus Fund, the Building Canada Fund Communities Component Top-Up, the Knowledge Infrastructure Program and the Recreational Infrastructure Canada program. As a result of the extension, almost $3.5 billion in stimulus was invested in the economy in 2011–12, and it is estimated that roughly 2,270 projects under the four extended programs were completed after March 31, 2011.
Investments in Provincial, Territorial and Municipal Infrastructure
As part of the stimulus phase of Canada’s Economic Action Plan, the Government launched a number of new initiatives to stimulate additional investment in provincial, territorial and municipal infrastructure. These new stimulus initiatives consisted of the Infrastructure Stimulus Fund, the Building Canada Fund Communities Component Top-Up, the Green Infrastructure Fund, the Recreational Infrastructure Canada program and funding for recreational trails.
By working closely with each province and territory to approve projects quickly, the Government allocated close to $5.4 billion in stimulus funding towards almost 7,000 projects across the country. Provinces, territories, municipalities and other partners also contributed to these projects, thereby generating a total investment in public infrastructure of about $14 billion at a critical time.
In addition to launching new stimulus initiatives, the Government took steps to accelerate funding under Building Canada initiatives that were announced in Budget 2007. These steps were designed to further increase investment when support for the economy was needed most.
Some of these projects, particularly larger-scale projects being funded under the Major Infrastructure Component of the Building Canada Fund, are ongoing and continue to support long-term economic growth.
In the last few years, federal investments have helped municipalities put police on the streets, repair social housing and rebuild the roads, bridges, water systems and public transit Canada needs to support families, businesses and long-term economic growth.
— Federation of Canadian Municipalities,
February 2012
Infrastructure Stimulus Fund: Through the Infrastructure Stimulus Fund, the Government made $4 billion in funding available for infrastructure projects that could get underway quickly and thus provide much-needed economic stimulus to the Canadian economy. Working with provinces, territories, municipalities and the private sector, more than 4,000 projects were completed under this program. In total, these projects represented an investment of about $10 billion in Canada’s public infrastructure.
Canada’s Economic Action Plan: Working for Canadians
Examples of Completed Infrastructure Stimulus Fund Projects
St. Lunaire-Griquet, N.L.—With the help of $1.25 million from the Infrastructure Stimulus Fund, Newfoundland and Labrador improved access to one of its prime tourist destinations, L’Anse aux Meadows. The Route 436 approach to this UNESCO World Heritage site, Canada’s earliest known Viking settlement, was resurfaced and widened. A culvert was also replaced. The benefits of this project include improved safety and traffic flow and lower maintenance costs, all of which contribute to the promotion of tourism and economic growth in the region.
Chatham, Ont.—The Chatham-Kent Women’s Centre provides shelter, counselling, education and housing support to victims of domestic abuse. To accommodate growing demand, the centre received $322,475 from the Infrastructure Stimulus Fund to expand the facility and make the building accessible to persons with disabilities. Now double its original size, the centre no longer has to rely on hotels or community partners to house their clients, freeing up the time and money to focus on programs to help women and children threatened by domestic abuse.
Spirit River, Alta.—Elevator and Cargill roads are important access routes that contribute to the Central Peace Region’s economic development. The roads support an average of 1,020 truckloads a year, translating into more than $120 million in annual regional revenues. Both roads were restored and repaved thanks to $336,761 from the Infrastructure Stimulus Fund. This project helped sustain jobs in the area, while also increasing road safety for truckers. It also improved access to the industrial and agricultural network to enhance the flow of goods crucial to the regional economy.
Carmacks, Y.T.—Running through the Town of Carmacks, Freegold Road is a primary supply route to and from many northern mining projects. A single-lane wooden bridge across the Nordenskiold River had been causing bottlenecks on this important local artery. With a $1-million contribution from the Infrastructure Stimulus Fund, a new steel bridge is now in place. It is large enough to handle two lanes of traffic as well as heavy vehicles and includes a sidewalk. The new bridge supports continued resource development in the region.
Bonus for Community Projects: The stimulus provided under Canada’s Economic Action Plan included $500 million to top up the more than $1 billion in initial funding that was made available under the Communities Component of the Building Canada Fund. More than 500 projects were completed as a result of this top-up, representing a total investment of approximately $1.5 billion in community infrastructure.
Green Infrastructure Fund: The Green Infrastructure Fund supports sustainable energy generation and transmission, modernized wastewater infrastructure and better management of solid waste. To date, the Government has committed $617 million towards 17 Green Infrastructure Fund projects. Provinces, territories, municipalities and the private sector are also contributing funding towards these projects, bringing the total investment to over $2 billion. Projects under the Green Infrastructure Fund are mainly long-term strategic initiatives that not only have been creating stimulus in the short term but will lead to a more sustainable economy in the coming years.
Canada’s Economic Action Plan: Working for Canadians
National Recreational Trails: The stimulus phase of the Economic Action Plan made $25 million in funding available in 2009–10 to the National Trails Coalition to help build and renew recreational trails for walking, running, cross-country skiing and biking, as well as snowmobile and all-terrain vehicle trails. The funding supported a total of 474 projects that were completed by March 31, 2010.
Recreational Infrastructure Canada: Hockey arenas, soccer fields, tennis courts and swimming pools provide Canadians and their families with the benefits of physical activity and community-based experience. The stimulus phase of Canada’s Economic Action Plan provided $500 million for the Recreational Infrastructure Canada program, supporting the construction of new facilities and upgrades to existing ones across the country. These funds were matched by contributions from other levels of government and recipients, thereby increasing the impact on local employment. In total, 1,919 projects were completed, creating significant new economic activity in all parts of Canada.
Canada’s Economic Action Plan: Working for Canadians
Examples of Community Projects
Arichat, N.S.—Thanks to $250,000 from the Building Canada Fund Communities Component Top-Up, the Village of Arichat replaced five aging and malfunctioning wastewater pumping stations that were installed in the 1970s and had become impossible to maintain. The work has made the community’s wastewater collection system more efficient and reliable. The work has also benefited the environment by preventing raw sewage from discharging into the Arichat harbour, as had occurred when the old sewage pumps malfunctioned.
Sayabec, Que.—For the Town of Sayabec’s residents, improving the community centre was a key goal. The centre is the hub of local activities and one of few in the region able to host events such as exhibitions, performances and conferences. With $593,630 from the Building Canada Fund Communities Component Top-Up, the centre renovated its storage and stage areas. The building’s roof and siding were also replaced, and more parking spaces were added to accommodate a growing clientele.
Langford, B.C.—The City of Langford was in need of a new arena for some time. With only two skating rinks to serve 66,000 residents, ice time was constantly booked. To solve this problem, the city received over $4.4 million from the Building Canada Fund Communities Component Top-Up to build a new recreational facility. The City Centre Park Sportsplex includes an ice rink and bowling alley. It also features a one-of-a-kind ”ice river” that connects the new 500-seat arena to an outdoor skating area that can be converted into a children’s splash park in Summer.
Lorette, Man.—Previously served by only three municipal wells and numerous private wells, Lorette residents had to put up with recurring boil-water orders. With the help of $600,000 from the Building Canada Fund Communities Component Top-Up, the town built a one-million-litre concrete reservoir and pumping station with filtration and disinfection capacity. The system also has sufficient capacity to accommodate future community growth. Thanks to the stimulus provided, everyone in the town is now linked to a modern potable water system that has improved drinking water quality and reliability.
First Nations Infrastructure
During the stimulus phase of Canada’s Economic Action Plan, the Government spent $510 million to support infrastructure projects in three priority areas: schools, water and wastewater projects, and health and police facilities in First Nations communities. In total, these funds supported 97 major projects, all of which were completed.
Investments, such as the following, spurred significant job creation and economic development in First Nations communities, many of which are rural:
- $173-million investment in 12 school projects.
- $188-million investment in 23 water and wastewater projects.
- $134-million investment in health service infrastructure, including 40 major projects and 135 minor projects.
- $15-million investment in 22 First Nations policing infrastructure projects.
Funding to Upgrade and Modernize Federal Infrastructure
Federal infrastructure stimulus projects under the Plan included investments in faster and more reliable passenger rail services, safer bridges and highways, refurbished harbours for small crafts and more efficient border crossings.
Reliable Passenger Rail Services: The stimulus phase of Canada’s Economic Action Plan provided funding for a wide range of projects designed to modernize rail passenger services through improvements to infrastructure, locomotives, passenger cars, stations and related facilities.
- VIA Rail was able to accelerate its capital projects as a result of investments made through the stimulus phase of Canada’s Economic Action Plan, including completing upgrades to rail car safety systems, tracks and stations.
- The stimulus phase of the Action Plan also supported two remote passenger rail services: Keewatin Railway, which operates between The Pas and Pukatawagan (northern Manitoba), and Tshiuetin Rail Transportation, which operates between Sept-Îles and Schefferville (northern Quebec) as well as in Labrador.
Federal Bridges: Through the stimulus phase of Canada’s Economic Action Plan, the Government invested more than $89 million over two years in the rehabilitation and repair of the following bridges:
- Blue Water Bridge in Sarnia.
- Peace Bridge in Fort Erie.
- Champlain Bridge in Montréal.
- Alexandra Bridge and the Chaudière Crossing in the National Capital Region.
- The LaSalle Causeway in Kingston and the Burlington Lift Bridge in Burlington.
The funding ensures that bridges and other transportation infrastructure continue to be safe and serve the needs of commuters.
Federal Buildings: The stimulus phase of the Plan delivered significant funds to repair and renovate the federal government’s building portfolio. About 2,000 repair and renovation projects were completed. In addition, funding was provided to over 300 projects to enhance the accessibility of Crown-owned buildings for persons with disabilities. During project selection, priority was given to facilities where services were provided directly to Canadians.
Canada’s Economic Action Plan: Working for Canadians
Examples of Federal Bridges
National Capital Region—The work done on the Alexandra Bridge in the National Capital Region exemplifies the positive outcomes of green-based approaches to asset rehabilitation. This rehabilitation project involved strengthening the steel structure and increasing its seismic capacity as well as replacing the deck, guardrail and wooden boardwalk. The work done on the century-old bridge was closely managed to maximize the recycling of all salvageable materials and, as a result, achieved over 88 per cent diversion from landfill. The pressure-treated wood previously used in the bridge’s boardwalk was replaced with planks made from non-treated durable wood species. Screw fasteners now hold the planks in place instead of traditional nails. The screws ensure fewer planks will need to be replaced each year.
Burlington, Ont.—The original, lead-based paint on the Burlington Lift Bridge, dating back to 1962, had begun to flake and peel off the bridge, producing an increased risk of contamination to the surrounding environment. There was also a need to paint the lift span in order to mitigate the structural deterioration resulting from its exposure to road salt, which had accelerated the rate of peeling and corrosion. In addition, structural deficiencies due to corrosion were repaired. All the repair work was completed within 20 months and the bridge was shut down only twice throughout the duration of the work.
Alaska Highway: On sections of the Alaska Highway from Summit Lake, British Columbia, to the Yukon border, deck repairs to eight bridges were completed, 28 kilometres of asphalt road surface were repaved, and an intersection was rebuilt to make it safer. These investments totalled $13 million and were all completed on budget during the short northern Summer construction period.
Twinning of the Trans-Canada Highway in Banff National Park: The project involved two separate design/build tenders, one for the Icefields Interchange and a second for the twinning of six kilometres of the Trans-Canada Highway between the Interchange and the Alberta-British Columbia border. Funding was provided over three years and construction is expected to be completed in Fall 2012.
Small Craft Harbours: The stimulus phase of Canada’s Economic Action Plan provided $200 million to Fisheries and Oceans Canada to undertake repairs of small craft harbours through 272 projects. To date, repair, maintenance and dredging has been completed for 258 projects. Projects that remain underway will be completed in the future with existing departmental funding.
Fisheries and Oceans Canada was also provided with $17 million to accelerate the construction of the Pangnirtung harbour in Nunavut. Stimulus funding spent totalled $11.2 million. The remaining $5.8 million was approved for spending in 2011–12.
Canada’s Economic Action Plan: Working for Canadians
Small Craft Harbours
Port Saunders, N.L.—A wharf reconstruction project at the commercial fishing harbour of Port Saunders has restored the capacity of the harbour to support the economic sustainability of this community. The harbour, which is used by 140 commercial fishing vessels, is important to the economic viability of the seafood industry in the Gulf of St. Lawrence. The Economic Action Plan’s $2.5-million project protected over 500 full-time seasonal jobs in the harvesting and processing sectors.
Berens River, Man.—Berens River is a remote Aboriginal community located 280 kilometres northeast of Winnipeg, Manitoba. It is an active fishing community with over 65 commercial fishers; fishing is the primary economic endeavour. Thanks to Canada’s Economic Action Plan, a contract for $185,000 was awarded to Lindell and Dymterko Ltd. for a new timber crib wharf. The community now has access to an improved vessel berthing for the commercial fishers and increased landing capacity.
Federal Contaminated Sites: Through the stimulus phase of Canada’s Economic Action Plan, the Government accelerated work to assess and remediate federal contaminated sites. Departments completed over 210 accelerated remediation projects and over 2,400 site assessments in 2009–10 and 2010–11.
Supporting Home Ownership and Jobs in Housing Construction
The housing industry is an important source of economic activity and job creation in Canada, as it promotes demand for building materials and other goods and services. For many Canadians, their homes are their most important investment. To protect and create jobs, the Government provided significant support for home ownership and renovations.
Canadians who undertook eligible renovations to their homes after January 27, 2009 and before February 1, 2010 were entitled to receive up to $1,350 in tax relief from the temporary Home Renovation Tax Credit (HRTC) introduced in the stimulus phase of Canada’s Economic Action Plan. The HRTC expired as planned on January 31, 2010.
The HRTC helped more than 3 million Canadians—about one out of every three owner-occupied households—improve their homes while boosting Canada’s economic growth.
The stimulus phase of Canada’s Economic Action Plan also provided additional tax support to first-time home buyers, who continue to benefit from greater access to their Registered Retirement Savings Plan savings to purchase or build a home, as well as up to $750 in tax relief from the First-Time Home Buyers’ Tax Credit.
Further, thanks to Canada’s Economic Action Plan, homeowners benefited from the enhanced ecoENERGY Retrofit – Homes program to make energy efficiency improvements to their homes. The program experienced strong demand during the stimulus phase of the Economic Action Plan and was renewed until March 31, 2012.
Investments in Social Housing
The stimulus phase of Canada’s Economic Action Plan included historic investments in social housing that contributed to supporting Canada’s housing construction and renovation industries. Federal support of roughly $2 billion helped Canadian families access suitable and affordable housing, while putting Canadians back to work.
In addition, provincial and territorial governments, which were responsible for program design and delivery, contributed over $1.5 billion toward this two-year investment. This joint investment in social housing allows for the construction and renovation of 16,500 housing units for low income families across the country. This includes 430 construction projects for low-income seniors and persons with disabilities, and over 11,350 existing social housing renovation projects administered by provinces and territories nationwide.
The Government of Canada also invested $150 million to renovate and retrofit federally administered social housing. In total, almost 1,310 projects were completed. These projects support some of the most vulnerable in our communities: single-parent families, recent immigrants, and Aboriginal peoples living off reserve.
Through the stimulus phase of the Economic Action Plan, the Government invested $400 million over two years to build and renovate housing in First Nations communities. Close to 500 communities benefited from more than 3,200 projects. A further $200 million was also invested in the North to address the territories’ housing needs, which supported 210 projects.
In addition to direct funding for social housing, municipalities undertook housing-related infrastructure projects supported by 272 low-cost loans totalling $2 billion.
Funds from the Affordable Housing Initiative were used by the Quebec government to fund subsidized housing through the provincial program AccèsLogis. These funds, coupled with money for housing provided through Canada’s Economic Action Plan, totalled $85.6 million last year, enough to build 1,223 social-housing units. These new homes were a lifeline for the increasing number of people who are forced to resort to food banks and who find themselves evicted from their apartments for being unable to pay their rent.
—Cathy Inouye, Project Genesis; Paula Kline,
Montreal City Mission; John Eric Feliciano,
Face à Face Listening and Intervention Centre.
June 2011
Canada’s Economic Action Plan:
Working for Canadians
Investments in Housing for Low-Income Seniors and Persons with Disabilities
Prince Albert, Sask.—The Prince Albert Community Housing Society (PACH) completed a project in Prince Albert that provides 18 much-needed affordable housing units for seniors, allowing them to stay in their community close to family and friends. PACH received $2.3 million in combined federal and provincial funding under Canada’s Economic Action Plan. This investment has helped provide residents with quality, affordable housing that meets their needs while contributing to the economic and social well-being of the entire community.
Prince Albert Community Housing was delighted when the proposal for these units was approved with $2.3 million in funding provided by the federal and provincial governments. It is now a beautiful home for seniors with extremely happy residents who have a place they can call home.
— Linda Boyer, Manager, Prince Albert Housing Society Inc.
Investments in First Nations and Northern Housing
Fort Smith, N.W.T.—A small community located along the banks of the Slave River in the Northwest Territories has benefited from new housing as a result of $600,000 in federal assistance through Canada’s Economic Action Plan. The Town of Fort Smith added four new affordable housing units for low-income families to the community’s housing stock thanks to the funding, which also contributed to the sustainability of the community.
The investments being made are an important part of our efforts to ensure the sustainability of our communities through the provision of affordable housing.
— Robert C. McLeod, Minister Responsible for
the Northwest Territories Housing Corporation
Renovation and Retrofit of Existing Social Housing (Federal)
Charlottetown, P.E.I.—Gateway Co-op, Charlottetown’s largest co-op, received new windows thanks to a federal investment through Canada’s Economic Action Plan. It received over $169,000 in federal funding to replace windows in the 28-unit building, improving its energy efficiency and creating local jobs.
Without this initiative, co-ops would not be as able to make many of the repairs they need. Government funding initiatives for affordable housing have helped to consolidate co-ops’ success in delivering affordable, mixed-income housing programs at a reasonable cost.
— Nicholas Gazzard, Executive Director,
Co-operative Housing Federation of Canada
| 2009–10 | 2010–11 | 2011–12 | Total | |
|---|---|---|---|---|
| Investments in Provincial, Territorial and Municipal Infrastructure | ||||
| Accelerating payments: Provincial/Territorial Base Funding Initiative | 179 | 158 | 337 | |
| Infrastructure Stimulus Fund | 525 | 2,635 | 807 | 3,967 |
| Bonus for Community Projects | 30 | 303 | 163 | 497 |
| Green Infrastructure Fund | 5 | 42 | 47 | |
| National recreation trails | 25 | 25 | ||
| Recreational Infrastructure Canada | 87 | 331 | 82 | 501 |
| Investments in First Nations Infrastructure | ||||
| School construction | 82 | 91 | 173 | |
| Water and wastewater projects | 69 | 119 | 188 | |
| Critical community services (health facilities) | 67 | 67 | 134 | |
| Critical community services (police facilities) | 12 | 3 | 15 | |
| Federal infrastructure | ||||
| An improved rail system | 138 | 213 | 352 | |
| Trans-Canada Highway | 16 | 29 | 45 | |
| Federal bridges | 39 | 50 | 89 | |
| Alaska Highway | 13 | 13 | ||
| Small craft harbours | 117 | 93 | 210 | |
| Repair and restoration of federal buildings | 171 | 151 | 322 | |
| Enhancing accessibility of federal buildings | 16 | 22 | 38 | |
| Manège Militaire in the City of Québec | 1 | 1 | 2 | |
| Accelerating action on federal contaminated sites | 88 | 127 | 216 | |
| Border facilities | 2 | 20 | 22 | |
| Aviation security | 343 | 7 | 350 | |
| Subtotal—Building Infrastructure | 2,025 | 4,463 | 1,051 | 7,540 |
| Support for Home Ownership and the Housing Industry | ||||
| Home Renovation Tax Credit | 2,265 | 2,265 | ||
| Home Buyers’ Plan withdrawal limit | 15 | 15 | 30 | |
| First-Time Home Buyers’ Tax Credit | 130 | 115 | 245 | |
| ecoENERGY Retrofit – Homes program | 186 | 191 | 377 | |
| Investments in Social Housing for Canadians | ||||
| Renovation and retrofit of social housing (provincial/territorial) | 433 | 417 | 850 | |
| Renovation and retrofit of social housing (federal)1 | 67 | 82 | 149 | |
| First Nations housing—Canada Mortgage and Housing Corporation1 | 123 | 126 | 249 | |
| First Nations housing—Aboriginal Affairs and Northern Development Canada | 75 | 79 | 154 | |
| Northern housing | 100 | 100 | 200 | |
| Housing for low-income seniors | 200 | 200 | 400 | |
| Housing for persons with disabilities | 25 | 50 | 75 | |
| Loans to municipalities: housing-related infrastructure | 376 | 1,624 | 2,000 | |
| Subtotal—Stimulating Housing Construction | 3,995 | 2,999 | 6,994 | |
| Total—Building Infrastructure to Create Jobs | 6,021 | 7,462 | 1,051 | 14,534 |
| Notes: Totals may not add due to rounding. Spending figures exclude employee benefit plan and accommodation costs. Amounts for 2009–10 and 2010–11 are actual cash expenditures, while amounts for 2011–12 reflect estimated expenditures for the four extended infrastructure programs. As a result of the extension of these programs, some funds originally planned for 2010–11 will be recorded in 2011–12. Final numbers will be released in the Public Accounts of Canada in Fall 2012. The budgetary impact may be somewhat smaller because some of these expenditures relate to construction and renovation costs of federal assets (for which only depreciation is recorded on a budgetary basis) and loans to third parties (where there is a budgetary impact only in the event that there is a risk of loss). 1 Approximately $1 million in spending was reprofiled to 2011–12. |
||||
Advancing Canada’s Knowledge Economy and Creating Better Jobs
While providing stimulus across the country, Canada’s Economic Action Plan also contributed to long-term growth and prosperity by helping to build Canada’s capacity for innovation.
The stimulus phase of Canada’s Economic Action Plan included more than $3 billion over two years for post-secondary education and research, technology and innovation, and environmental science. These measures were consistent with the Government’s long-term plan to strengthen Canada’s capacity for excellence in research by creating world-leading facilities for research and advanced training and better preparing young Canadians for the jobs of tomorrow. The stimulus phase of the Plan also included measures to create jobs, promote business opportunities and provide support for small and medium-sized companies. Other investments improved Canadians’ access to broadband Internet, modernized federal laboratories, and strengthened Canada’s position as a global leader in clean energy.
... the Knowledge Infrastructure Program (KIP) was a tremendous success, but Canadians got so much more from this investment of their tax dollars. The KIP program strengthened Canada's research, innovation and education capacity in ways that will benefit Canadians for generations to come.
— Paul Davidson, President,
Association of Universities and Colleges of Canada, October 2011
| 2009–10 | 2010–11 | 2011–12 | Total | |
|---|---|---|---|---|
| Action to Invest in Post-Secondary Education and Research | ||||
| Improving infrastructure at universities and colleges | 991 | 746 | 250 | 1,987 |
| Other | 86 | 154 | 240 | |
| Subtotal—Action to Invest in Post-Secondary Education and Research | 1,077 | 900 | 250 | 2,227 |
| Investing in Science and Technology | ||||
| Renewing federal laboratories | 85 | 149 | 234 | |
| Clean energy and the environment | 358 | 274 | 632 | |
| Other | 30 | 146 | 176 | |
| Subtotal—Investing in Science and Technology | 473 | 569 | 1,042 | |
| Total—Advancing Canada’s Knowledge Economy and Creating Better Jobs | 1,550 | 1,469 | 250 | 3,269 |
| Total—With provincial contributions | 3,128 | 2,677 | 649 | 6,454 |
| Notes: Totals may not add due to rounding. Spending figures exclude employee benefit plan and accommodation costs. Amounts for 2009–10 and 2010–11 are actual cash expenditures, while amounts for 2011–12 reflect estimated expenditures for the four extended infrastructure programs. As a result of the extension of these programs, some funds originally planned for 2010–11 will be recorded in 2011–12. Final numbers will be released in the Public Accounts of Canada in Fall 2012. The budgetary impact may be somewhat smaller because some of these expenditures relate to construction and renovation costs of federal assets (for which only depreciation is recorded on a budgetary basis) and loans to third parties (where there is a budgetary impact only in the event that there is a risk of loss). | ||||
The Government is helping to build a strong, innovative economy through science, technology and research excellence, while training new generations of highly skilled individuals for better jobs. This support underlines the Government’s commitment to making innovation a long-term strategic priority. Canada needs this new wave of highly qualified workers to prosper in a global economy that depends more and more on knowledge and innovation as a key driver of long-term competitiveness, growth and employment.
Post-Secondary Education and Research
Through the Knowledge Infrastructure Program, close to $2 billion was spent on the repair, maintenance and construction of university and college facilities. By leveraging $3.2 billion from project partners, the program has led to a $5.2-billion investment in infrastructure at post-secondary institutions.
A total of 515 projects were completed under the Knowledge Infrastructure Program. The program deadline was extended to October 31, 2011, and all but five of the projects that were funded through the program have reached completion. The remaining five projects are being completed without additional federal funding.
Arctic Research Infrastructure: The stimulus phase of Canada’s Economic Action Plan provided $84 million to improve existing research facilities that support Arctic science and technology and to begin work in support of a new, world-class Canadian High Arctic Research Station. All 21 projects were completed over the two years of the Action Plan.
Canada’s Economic Action Plan:
Working for Canadians
Infrastructure Investments at Universities and Colleges Completed Projects
Halifax, N.S.—Renovations at the Nova Scotia College of Art & Design University improved research and technology development facilities for film and media arts. Funding of just under $2 million from the Government of Canada enables the university to train an additional 110 students per year in a premier facility for the testing and creation of new ideas and technologies in cinema. The renovations preserved the architectural integrity of a 133-year-old building, while bringing it up to current health and safety standards, developing its data infrastructure and connections to high-speed research networks, and incorporating more energy-efficient systems that reduce greenhouse gas emissions and reduce operating costs.
Edmonton, Alta.—Thanks to Canada’s Economic Action Plan, $10 million was provided to the University of Alberta to renovate three floors of the 40-year-old Chemical and Materials Engineering Building. Upgrades to 54 research and teaching labs were made, asbestos was removed, safety and building code deficiencies were corrected and more energy-efficient mechanical and electrical systems were installed. By addressing these critical health and safety deficiencies, previously unusable space now accommodates an additional 20 professors, 100 graduate students, 50 research administrative staff and 150 undergraduate students.
Fredericton, N.B.—The newly constructed Richard J. Currie Center at the University of New Brunswick, which the Government of Canada supported with an $8-million investment, enables an interdisciplinary team of researchers to come together to form a critical mass of expertise in human performance, biomechanics, health promotion and chronic disease management. Combined with the Institute of Biomedical Engineering, the facility creates a centre of excellence on human performance, biomechanics, chronic disease management and health promotion, allowing Canada to compete with the best in the world. As a result of the project, the institution anticipates that it has increased its training capacity by more than 400 students annually.
Investing in Science and Technology
As part of its effort to ensure Canada’s long-term economic prosperity and sustainability, the stimulus phase of Canada’s Economic Action Plan provided support for science and technology through investments to modernize federal laboratories, spur research in clean energy and space technology, and improve broadband access.
Renewing Federal Laboratories: The Government delivered over $234 million to upgrade and modernize federal laboratories doing research in a wide array of fields, including health, safety, security, transportation, environmental protection and heritage. These projects provided near-term stimulus in regions across Canada, and helped federal departments to better deliver their core regulatory responsibilities, improve science and technology capacity, and enhance the health and safety of Canadians.
Clean Energy and the Environment: The stimulus phase of Canada’s Economic Action Plan established the $1-billion, five-year, Clean Energy Fund, including up to $150 million for clean energy research and development and $850 million for clean energy demonstration projects. The projects being supported by the fund assist in increasing the deployment of renewable and clean technologies. To date, federal funding totalling over $610 million has been announced for projects under the fund. In addition, in response to unprecedented demand under the ecoENERGY Retrofit – Homes program, $205 million under the fund was allocated to finance up to 120,000 additional retrofits for Canadian homeowners.
Broadband: As part of the stimulus phase of Canada’s Economic Action Plan, $225 million was provided to Industry Canada over three years to develop and implement a strategy to extend broadband coverage to as many underserved households as possible. The biggest component of this strategy is the Broadband Canada: Connecting Rural Canadians program. This program has helped provide broadband access to over 210,000 additional households.
| 2009–10 | 2010–11 | 2011–12 | Total | |
|---|---|---|---|---|
| Action to Invest in Post-Secondary Education and Research | ||||
| Improving infrastructure at universities and colleges | 991 | 746 | 250 | 1,987 |
| Canada Foundation for Innovation | 50 | 50 | ||
| Institute for Quantum Computing | 17 | 17 | 34 | |
| Arctic research Infrastructure | 32 | 51 | 84 | |
| Canadian Graduate Scholarships program | 35 | 35 | 70 | |
| Industrial Research and Development Internship program | 3 | 1 | 4 | |
| Subtotal—Action to Invest in Post-Secondary Education and Research | 1,077 | 900 | 250 | 2,227 |
| Investing in Science and Technology | 0 | |||
| Modernizing federal laboratories | 85 | 149 | 234 | |
| Clean Energy Fund | 65 | 274 | 339 | |
| Canadian Environmental Sustainability Indicators | 8 | 8 | ||
| Strengthening Canada’s nuclear advantage | 285 | 285 | ||
| Canada’s space industry | 10 | 45 | 55 | |
| Canada Health Infoway | 58 | 58 | ||
| Extending access to broadband in rural communities | 20 | 43 | 63 | |
| Subtotal—Investing in Science and Technology | 473 | 569 | 1,042 | |
| Total—Advancing Canada’s Knowledge Economy and Creating Better Jobs | 1,550 | 1,469 | 250 | 3,269 |
| Notes: Totals may not add due to rounding. Spending figures exclude employee benefit plan and accommodation costs. Amounts for 2009–10 and 2010–11 are actual cash expenditures, while amounts for 2011–12 reflect estimated expenditures for the four extended infrastructure programs. As a result of the extension of these programs, some funds originally planned for 2010–11 will be recorded in 2011–12. Final numbers will be released in the Public Accounts of Canada in Fall 2012. The budgetary impact may be somewhat smaller because some of these expenditures relate to construction and renovation costs of federal assets (for which only depreciation is recorded on a budgetary basis) and loans to third parties (where there is a budgetary impact only in the event that there is a risk of loss). | ||||
Supporting Industries and Communities
The stimulus phase of Canada’s Economic Action Plan provided over $13 billion to create and protect jobs in the regions, communities and industries of the Canadian economy that were the most affected by the global recession. This support addressed the economic challenges faced by traditional industries such as forestry, agriculture and manufacturing, which continue to play important roles in the economies of many communities across the country. In addition to providing targeted support, the stimulus helped industries bolster their competitiveness and position themselves for long-term success, both within Canada and in the global economy.
| 2009–10 | 2010–11 | Total | |
|---|---|---|---|
| Support for Industries | |||
| Forestry | 59 | 102 | 162 |
| Agriculture | 14 | 74 | 88 |
| Mineral exploration | 70 | -15 | 55 |
| Small businesses | 166 | 193 | 360 |
| Tourism | 136 | 149 | 285 |
| Shipbuilding | 82 | 93 | 175 |
| Culture | 150 | 157 | 306 |
| Tax and tariff relief | |||
| Temporary 100-per-cent capital cost allowance rate for computers | 340 | 355 | 695 |
| Tariff relief on machinery and equipment | 76 | 81 | 157 |
| Subtotal—Support for Industries | 1,093 | 1,190 | 2,283 |
| Support for Communities | |||
| Helping all regions prosper | 596 | 655 | 1,251 |
| Strengthening partnerships with Aboriginal peoples | 135 | 179 | 314 |
| Subtotal—Support for Communities | 731 | 834 | 1,565 |
| Total—Supporting Industries and Communities | 1,824 | 2,023 | 3,848 |
| Federal support to auto sector1 | 9,155 | – | 9,155 |
| Total—Supporting Industries and Communities | 10,979 | 2,023 | 13,003 |
| Total—With provincial contributions | 15,955 | 2,513 | 18,468 |
| Notes: Totals may not add due to rounding. Spending figures exclude employee benefit plan and accommodation costs. The budgetary impact may be somewhat smaller because some of these expenditures relate to construction and renovation costs of federal assets (for which only depreciation is recorded on a budgetary basis) and loans to third parties (where there is a budgetary impact only in the event that there is a risk of loss). 1 Includes $250 million, which was disbursed to Chrysler on March 30, 2009. |
|||
Support for Communities: The Government took significant actions to enable the development of strong Canadian communities in a time of crisis. The stimulus phase of Canada’s Economic Action Plan included:
- An investment of over $930 million over two years through the Community Adjustment Fund to support economic diversification in communities affected by challenges facing local industries.
- Establishing the Federal Economic Development Agency for Southern Ontario with over $1 billion provided over five years to support economic development in Southern Ontario communities.
- Providing $50 million over five years to establish the Canadian Northern Economic Development Agency and a further $90 million over five years to renew the Strategic Investments in Northern Economic Development program to strengthen economic activity in Northern communities.
Canada’s Economic Action Plan: Working for Canadians
Support for Communities
The Government has taken significant actions to enable the development of strong Canadian communities. These include:
- Establishing the $1-billion Community Development Trust in January 2008 to support provincial and territorial initiatives aimed at assisting vulnerable communities.
- Providing $1 billion over two years for the Community Adjustment Fund, as part of the Economic Action Plan, to support economic diversification in communities affected by challenges facing local industries.
- Providing $500 million over two years through the Economic Action Plan for the Recreational Infrastructure Canada program to support the construction of new recreational facilities and upgrades to existing ones in communities across Canada.
- Establishing the Federal Economic Development Agency for Southern Ontario with over $1 billion over five years, as part of the Economic Action Plan, to support economic development in Southern Ontario communities.
- Providing $50 million over five years through the Economic Action Plan to establish the Canadian Northern Economic Development Agency and a further $90 million over five years to renew the Strategic Investments in Northern Economic Development program to strengthen economic activity in Northern communities.
- Providing close to $50 million per year in permanent resources through Budget 2010 to strengthen the activities of the regional economic development agencies in promoting growth in communities across Canada. Budget 2010 also provided $11 million per year, on an ongoing basis, for the Community Futures Program to help create new economic opportunities and promote innovation in rural communities.
- Providing $1.9 billion over five years starting in September 2008, for the Affordable Housing Initiative ($125 million per year), the Residential Rehabilitation Assistance Program ($128 million per year) and the Homelessness Partnering Strategy ($135 million per year). In addition, the Economic Action Plan provided $2.1 billion towards the construction and renovation of affordable housing units, and $2 billion in low-cost loans were made available to municipalities.
- Encouraging individuals to make a sustained commitment to public transit use through the introduction of the Public Transit Tax Credit.
Budget 2012 continues to support communities by providing $150 million over two years for repairs or improvements to community facilities in all regions of Canada.
Budget 2012 also provides up to $99.2 million over three years for permanent flood mitigation measures undertaken by communities affected by major flooding in 2011.
Canada’s Economic Action Plan: Working for Canadians
Examples of Community Adjustment Fund Projects
Victoria, P.E.I.—Thousands of visitors flock to the seaside village of Victoria, Prince Edward Island every year to enjoy the tourist attractions the island community has to offer. Thanks to an investment of $220,000 from the Government of Canada through the Community Adjustment Fund, Victoria’s popularity as a summertime destination has been enhanced even further. The stimulus funding supported a number of capital improvements to Victoria’s seaside tourism landscape, including general landscaping, curbing and lighting. The project has allowed the community to provide more amenities to existing clientele and attract a further influx of tourists and businesses along Victoria’s waterfronts.
Grand Falls-Windsor, N.L.—The Town of Grand Falls-Windsor received $3 million to assist the Central Newfoundland Region to create new opportunities in the cranberry industry. The project involved the development of up to 120 additional acres of production with 10 private sector operators. It also included site selection analysis for the Exploits Region, and the development of a comprehensive report outlining opportunities for future commercial development. Thanks to the stimulus phase of Canada’s Economic Action Plan, total acreage in the province is expected to reach 500 acres by 2015 with up to 20 growers in the industry.
Winnipeg, Man.—The Bruce D. Campbell Farm & Food Discovery Centre is Canada’s first hands-on educational centre to explore the importance of nutrition and food production. This newly constructed 8,280-square-foot building includes interactive exhibits that will lead visitors on a journey from the farmer’s wheat field to the kitchen table. The centre expects to receive 30,000 visitors a year, many of them middle-year students and teachers. Tailored to the school curriculum, the indoor and outdoor exhibits will highlight the increasing importance of science and technology in agricultural practices and Canada’s world leadership in food safety and production. The centre, located at the University of Manitoba’s Glenlea Research Station south of Winnipeg, received more than $2.3 million in funding from the Community Adjustment Fund.
Northwest Territories—Through the Community Adjustment Fund, the Tulita Dene Band Council received $488,000 in federal funding. Working in cooperation with the Norman Wells Land Corporation, the Band Council oversaw the gathering and removal of communications wire on the Canol Heritage Trail. The wire was left behind after the original construction of the Canol Heritage Trail in the 1940s and was considered a hazard to wildlife and people that use the trail. The funding enhanced community recreational use, and supported the further development of eco-tourism activities in the area.
Automotive Sector: The automotive sector has faced significant challenges as a result of the global economic recession. In 2009, the governments of Canada and Ontario provided $13.7 billion of financial support for the restructuring of General Motors and Chrysler, with the federal share of this support being two thirds. The governments of Canada and Ontario received ownership stakes in the restructured firms. It is estimated that approximately 52,000 Canadian jobs were protected by government action to support the automotive industry.
Canada exited from its investment in Chrysler in July 2011. The Government of Canada continues to manage its remaining stake in General Motors to maximize the return for taxpayers, while reducing its ownership as quickly as is appropriate.
The Government of Canada has begun to reduce its ownership in General Motors. In connection with the initial public offering by General Motors in November 2010, Canada sold over 35 million shares. This sale reduced Canada’s ownership stake in General Motors to 9.34 per cent. On January 14, 2011, General Motors announced it would inject US$2 billion worth of stock into its company pension plan, resulting in Canada’s ownership stake in General Motors being reduced to 8.98 per cent.
Canada’s Economic Action Plan: Working for Canadians
Support for the Aerospace Sector
The aerospace sector is a leading employer in the high technology sector. Since 2006, the Government has taken significant actions, including through the Economic Action Plan, to promote the competitiveness of the aerospace sector. These include:
- Establishing in 2007 the Strategic Aerospace and Defence Initiative to support advanced research and development projects by the aerospace and defence industries, with about $900 million available over five years. In 2009, an additional $200 million over four years was provided to the program.
- Providing the Canadian Space Agency with $110 million over three years, as part of the Economic Action Plan, to support the development of advanced robotics and other space technologies.
- Launching the Review of Aerospace and Space Programs and Policies. Headed by the Honourable David Emerson and assisted by a three-member advisory council, the review will explore how government, industry and other key stakeholders can address the key issues facing the aerospace and space sectors, such as innovation, market access and development, skills development, procurement and supplier development.
- Committing in Budget 2012 to the continuation of Canada’s participation in the International Space Station mission to 2020 alongside the United States, the European Union, Russia and Japan. Using advanced technology, Canadian astronauts will continue to help conduct world-class research on the station in fields such as human spaceflight, physiology, physical science and technology development. The aerospace sector will benefit from Canada’s technology contribution to the mission.
These initiatives help to create or maintain highly skilled Canadian jobs, encourage public and private partnerships, and keep Canada at the forefront of the international aerospace industry.
Forestry: In recent years, the forestry sector faced a number of important challenges, including the collapse of the U.S. housing market and declines in newsprint demand. Under the stimulus phase of the Economic Action Plan, over $160 million was spent by Natural Resources Canada to support market diversification and innovation activities in the forestry sector. These investments have created real value for the forestry sector, with novel products that secure Canada’s position as a technological leader. In addition, the funding has enabled Canadian producers to increase exports to key markets such as China and maintain their positions in established markets such as Japan and Europe.
Canada’s Economic Action Plan: Working for Canadians
Support for Forestry
The forestry sector is an important contributor to the Canadian economy, forming the economic base in many regions. Canada’s forest product companies have encountered intense competitive pressures, including greater competition from low-cost producers, higher input and energy costs, a variable Canadian dollar and low productivity.
Since 2006, the Government has put in place significant support, including through the Economic Action Plan, to help the forestry sector address these challenges and become more competitive. This includes:
- Negotiating the Canada-United States Softwood Lumber Agreement in 2006, restoring access to the United States market and resulting in the return of over $5 billion in duty deposits to Canadian producers.
- Providing $200 million through Budget 2006 to combat the pine beetle infestation.
- Providing $170 million over two years through Budget 2009 and an additional $60 million through Budget 2011, to support market diversification and innovation initiatives in the forestry sector. These activities built on the $127.5-million Forest Industry Long-Term Competitiveness Initiative announced in Budget 2006 to help the forestry sector shift toward higher-value products and tap into new markets.
- Establishing the $1-billion Pulp and Paper Green Transformation Program in June 2009 to support capital projects in the forestry sector that offer demonstrable environmental benefits.
- Providing $100 million over four years through Budget 2010 for the Investments in Forest Industry Transformation Program to support the development, commercialization and implementation of advanced clean energy technologies in the forestry sector.
Budget 2012 builds on these sustained efforts by providing $105 million over two years to promote innovation and market development and to support continued transformation in the forestry sector.
Forestry: Support for Innovation and Market Diversification Across Canada
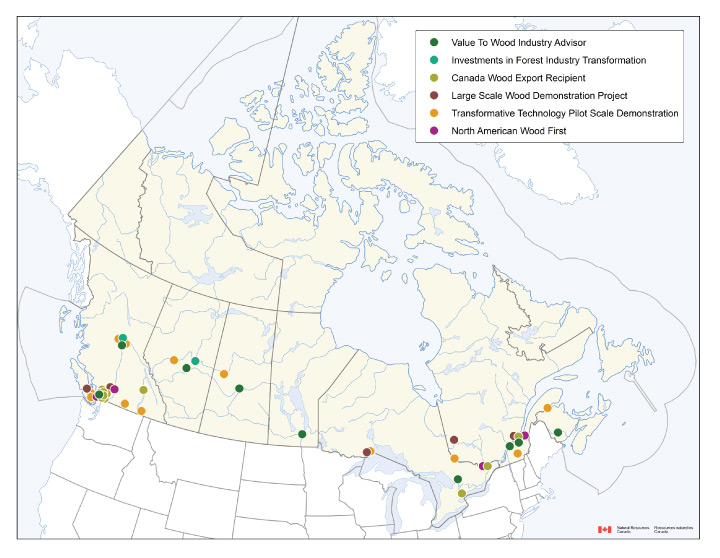
Agriculture: The Government worked closely with farmers, the agri-food industry and the provinces and territories to deliver on the agricultural measures included in the stimulus phase of the Economic Action Plan.
- Through to the end of 2011–12, $226 million of the Agricultural Flexibility Fund will have been spent on initiatives that help the agricultural sector adapt to pressures, improve environmental sustainability, support innovative processes and products, and address market challenges. Initiatives under the Agricultural Flexibility Fund will continue to support the sector over the remaining two years of the program.
- The stimulus phase of the Economic Action Plan included investments to improve the operations of livestock and processing plants. A total of $48 million will have been spent on 18 projects by the end of 2011–12, the last year of the program.
- Since the new Canadian Agricultural Loans Act took effect in Summer 2009, 6,141 loans, totalling more than $338 million, have been granted. Of these loans, 464 were registered to beginning farmers for a total of $40 million and 120 loans were issued for amounts greater than $250,000.
Small Business: Canada’s small and medium-sized companies are an important engine of our economy, driving innovation, productivity, job creation and economic growth. In addition to other target supports for small and medium-sized enterprises, the stimulus phase of Canada’s Economic Action Plan allocated $200 million over two years to the Industrial Research Assistance Program to enable it to temporarily expand its initiatives for small and medium-sized enterprises. The National Research Council moved quickly to spend the $200 million allocated in 2009–10 and 2010–11 to help firms innovate and to hire new post-secondary graduates.
Tourism: In 2009–10 and 2010–11, the Marquee Tourism Events Program provided support to events across Canada, such as the Charlottetown Festival, Carnaval de Québec, Niagara Wine Festival, Red River Exhibition and Pacific National Exhibition, in order to stimulate the economy and help promote Canada as a global destination of choice. Through this program, 79 organizations responsible for 107 events received funding over two years. The program helped draw tourists to host cities and regions and increase tourism-related spending in Canadian restaurants, hotels, retailers and transportation companies.
The Government of Canada also provided nearly $50 million through the Canadian Tourism Commission for additional promotional activities domestically and in priority international markets for the Canadian tourism industry.
Our vast National Parks and numerous National Historic Sites help attract a large number of visitors from abroad each year, generating significant economic activity and bringing our natural heritage closer to Canadians. Under the stimulus phase of Canada’s Economic Action Plan, Parks Canada spent $147 million over two years to build and upgrade facilities, including visitor centres and campgrounds, as well as roads at National Parks and National Historic Sites throughout the country.
Shipbuilding: The stimulus phase of Canada’s Economic Action Plan provided $175 million to the Canadian Coast Guard to purchase 98 new boats and to repair and refit 40 existing large vessels. To date, the procurement and repair of all boats and vessels has been completed with the exception of three new inshore fisheries science vessels, which are currently under construction and are expected to be delivered in the Spring 2012.
Budget 2012 is investing $5.2 billion over the next 11 years on a cash basis to replace and refit the Canadian Coast Guard’s vessel and helicopter fleet. This will contribute to job creation and ensure the Canadian Coast Guard can continue to carry out its mandated activities.
Culture: The Government has delivered unprecedented levels of investment in Canada’s cultural industries, creating jobs and supporting the creative economy. Through the stimulus phase of Canada’s Economic Action Plan, the Government charted a course that allowed our creative industries to navigate the changing technological and economic landscapes, with over $300 million in support for culture and the arts.
- The Canada Cultural Spaces Fund spent almost $60 million over
2009–10 and 2010–11 to support 147 cultural infrastructure projects across Canada. - In 2009–10 the Canada Arts Training Fund provided $6 million to 27 organizations, and in 2010–11 the Fund invested $13 million to help 34 of the highest calibre institutions in Canada train the most talented emerging artists for professional careers.
- In 2009–10, $14 million was transferred to Canada Post, which helped more than 1,000 magazines and community newspaper companies mail 169 million copies of their publications to Canadian readers in all regions of the country. In 2010–11, the redesigned program, the Canada Periodical Fund, disbursed $15 million to 928 Canadian magazine and community newspaper titles to help them to create and distribute a diverse range of publications to Canadians.
- In 2009–10, a $100-million investment in the Canadian Television Fund supported projects, in partnership with the broadcasting industry, to produce high quality, distinctively Canadian television programs. The revamped program, renamed the Canada Media Fund, combined the former Canadian Television Fund and the Canada New Media Fund, and expanded on this work through a $100-million investment in 2010–11 by supporting content creation for Canadian television, as well as for software applications for current and emerging digital platforms.
Canada’s Economic Action Plan: Working for Canadians
Support for Rural Canadians
Since 2006, the Government has taken action to support the rural economy and made investments that improve the quality of life of rural Canadians.
The Government has provided support to important sectors of the rural economy:
- Supporting the Competitiveness and Long-Term Profitability of the Agricultural Sector—Since 2006, the Government has provided targeted assistance to support the competitiveness of the sector and enhance market access through initiatives such as the Slaughter Improvement Program, the Hog Industry Loan Loss Reserve Program, the Hog Farm Transition Program and the Market Access Secretariat.
- Under the federal/provincial/territorial Growing Forward policy framework, the Government has provided $6.2 billion over the past four years to assist with business risk management challenges facing farm businesses. This included support in 2010 and in 2011 for grain and livestock farmers following floods in Western Canada and Quebec.
- Building a Competitive Fisheries Sector—The federal government has invested significant resources to promote the economic well-being of the commercial fishing industry and small coastal communities, including through:
- $39 million to advance fisheries science and research.
- $22 million to improve regulatory science in support of the aquaculture sector.
- $225 million to repair core small craft harbours across Canada and to accelerate the construction of the Pangnirtung Harbour in Nunavut.
- $72 million to repair storm-damaged harbours to ensure they remain in a safe and functional state.
- $230 million to integrate Aboriginal fishers into Atlantic and Pacific commercial fisheries.
- Supporting the Transformation of the Forestry Sector—The Economic Action Plan provided $170 million over two years through Budget 2009 and an additional $60 million through Budget 2011 for forest innovation and market development. In addition, the Government introduced the $1-billion Pulp and Paper Green Transformation Program to support innovation and environmentally friendly investments in Canadian mills.
- Promoting Competitiveness and Environmental Responsibility in Energy and Mining Operations—The Major Projects Management Office was created to streamline and accelerate the federal regulatory review process for new projects in energy and mining, creating investment and new jobs in rural communities. Going forward, more than $500 billion is forecast to be invested in major natural resource projects across Canada over the next 10 years. Budget 2012 also supports mineral exploration by junior mining companies by extending the temporary 15-per-cent Mineral Exploration Tax Credit for investors in flow-through shares for an additional year, to March 31, 2013.
In addition, the Government has taken action to improve the quality of life of Canadians in rural areas.
- Physical remoteness means greater costs for transportation and infrastructure for rural communities. Under the Economic Action Plan, $15.7 billion was spent to modernize a broad range of infrastructure including roads, bridges, public transit, parks, water treatment facilities and harbours. The $500-million Communities Component Top-Up of the Building Canada Fund targets infrastructure stimulus for communities with populations of less than 100,000.
- As part of Canada’s Economic Action Plan, $225 million was provided to Industry Canada over three years to develop and implement a strategy to extend broadband coverage to as many unserved and underserved households as possible. The biggest component of this strategy is the Broadband Canada: Connecting Rural Canadians program. By March 31, 2012, over 210,000 additional households in rural and remote regions will have broadband access.
- Through the Knowledge Infrastructure Program, the Government has provided close to $2 billion over two years for university and college infrastructure, including repair, maintenance and construction projects at rural colleges such as the Northern Lights College in Dawson Creek (British Columbia), Portage College in Lac La Biche (Alberta), the Strait Area Campus at the Nova Scotia Community College in Port Hawkesbury, and Aurora College in Tsiigehtchic (Northwest Territories). These projects strengthened the ability of colleges in rural areas to deliver advanced knowledge and skills training. The projects also supported numerous jobs during the construction period.
- In Budget 2010, the Government provided $11 million per year, on an ongoing basis, for the Community Futures Program. This funding will help create new economic opportunities and promote innovation in rural communities across Canada.
Budget 2012 provides renewed funding for the Major Projects Management Office Initiative, to continue to streamline and accelerate the federal regulatory review process for new projects in energy and mining, creating investment and new jobs in rural communities.
- Budget 2012 also provides $105 million over two years to promote innovation and market development and to support continued transformation in the forestry sector.
Tax and Tariff Relief: In addition to supporting key industries, the stimulus phase of the Economic Action Plan included permanent and temporary measures that built on broad-based tax reductions passed by Parliament in 2007 that lowered the federal general corporate income tax rate to 15 per cent in 2012.
The stimulus provided under the Economic Action Plan also helped Canadian firms create jobs, modernize their operations and better compete globally through the temporary accelerated capital cost allowance rates for computers and for manufacturing or processing machinery and equipment, and the elimination of all remaining tariffs on imported machinery and equipment and industrial manufacturing inputs. A first phase of tariff relief, focusing on machinery and equipment, was implemented in Budget 2009, providing $157 million over two years in duty savings. Budget 2010 implemented a second phase of tariff relief, eliminating all remaining tariffs on industrial inputs, which provides $300 million in additional annual savings to Canadian businesses.
With these measures, the Government has made Canada a tariff-free zone for industrial manufacturers, a first in the G-20. Since the measures were implemented, Canadian businesses have benefited from tariff relief on over $50 billion of imports. These initiatives increase investment, foster innovation and productivity, and increase overall prosperity.
By continuing to pursue an ambitious trade strategy, the federal government is helping to position Canada for increased success in the global economy. Your plan to make Canada a tariff-free zone for industrial manufacturers is enhancing the ability of Canadian-based firms to compete in domestic and foreign markets
— John Manley, Canadian Council of Chief Executives
March 2012
| 2009–10 | 2010–11 | Total | |||
|---|---|---|---|---|---|
| Support for the automotive sector1 | 9,155 | 9,155 | |||
| Support for Industries | |||||
| Forestry | |||||
| Forestry (marketing and innovation) | 59 | 102 | 162 | ||
| Agriculture | |||||
| Agriculture flexibility program | 6 | 58 | 64 | ||
| Investment in cattle processing plants | 8 | 16 | 24 | ||
| Mineral Exploration | |||||
| Extending the Mineral Exploration Tax Credit | 70 | -15 | 55 | ||
| Small Businesses | |||||
| Reducing taxes for small businesses | 45 | 80 | 125 | ||
| Industrial Research Assistance Program | 98 | 100 | 198 | ||
| Canada Youth Business Foundation | 10 | 10 | |||
| Canadian Business Networks | 14 | 13 | 27 | ||
| Tourism | |||||
| Canadian Tourism Commission2 | 20 | 20 | 40 | ||
| Marquee Tourism Events Program | 48 | 49 | 97 | ||
| Parks Canada | 67 | 80 | 147 | ||
| Shipbuilding | |||||
| Shipbuilding | 82 | 93 | 175 | ||
| Culture | |||||
| Cultural infrastructure | 30 | 29 | 59 | ||
| Canada Prizes for the Arts and Creativity | |||||
| Canada Arts Training Program | 6 | 13 | 19 | ||
| Community newspapers and magazines | 14 | 15 | 29 | ||
| Canada Media Fund | 100 | 100 | 200 | ||
| Tax and Tariff Relief | |||||
| Temporary 100-per-cent capital cost allowance rate for computers | 340 | 355 | 695 | ||
| Tariff relief on machinery and equipment | 76 | 81 | 157 | ||
| Subtotal—Support for Industries | 1,093 | 1,190 | 2,208 | ||
| Support for Communities | |||||
| Helping All Regions Prosper | |||||
| Community Adjustment Fund | 417 | 513 | 931 | ||
| Federal Economic Development Agency for Southern Ontario | 128 | 108 | 236 | ||
| Eastern Ontario Development Program | 10 | 10 | 19 | ||
| Strengthening economic development in the North | 3 | 8 | 12 | ||
| Strategic Investments in Northern Economic Development | 10 | 16 | 26 | ||
| Promoting energy development in Canada’s North | 28 | 0 | 28 | ||
| Strengthening Partnerships With Aboriginal peoples | |||||
| First Nations and Inuit health programs | 131 | 165 | 296 | ||
| First Nations child and family services | 4 | 14 | 18 | ||
| Subtotal—Support for Communities | 731 | 834 | 1,565 | ||
| Total—Supporting Industries and Communities | 10,979 | 2,023 | 13,003 | ||
| Notes: Totals may not add due to rounding. Spending figures exclude employee benefit plan and accommodation costs. The budgetary impact may be somewhat smaller because some of these expenditures relate to construction and renovation costs of federal assets (for which only depreciation is recorded on a budgetary basis) and loans to third parties (where there is a budgetary impact only in the event that there is a risk of loss). 1 Includes $250 million which was disbursed to Chrysler on March 30, 2009. 2 The 2010–11 figure does not include an $8-million transfer from the Marquee Tourism Events Program to the Canadian Tourism Commission. |
|||||
Improving Access to Financing and Strengthening Canada’s Financial System
Canada’s financial system showed exceptional stability throughout the global financial crisis, with its banking system being recognized as the soundest in the world. However, Canada was not immune to the global crisis, and the Government took timely and effective measures to provide extraordinary liquidity to the financial system and mitigate the impact of the global credit crunch on the Canadian economy. While the Canadian financial system withstood the global financial crisis better than most, the crisis made it difficult for Canadian banks and other lenders to obtain funds from international markets at reasonable costs. To soften the impact of the crisis, the stimulus phase of Canada’s Economic Action Plan included measures to provide up to $200 billion to support lending to Canadian households and businesses through the Extraordinary Financing Framework (EFF).
The EFF measures included: the Insured Mortgage Purchase Program (IMPP); a new 10-year maturity in the ongoing Canada Mortgage Bond program; the Canadian Secured Credit Facility; support for the Bank of Canada’s emergency liquidity measures; increased flexibilities and capacities for financial Crown corporations, including the introduction of the Business Credit Availability Program; and assurance facilities for banks and life insurance companies. All of this support was offered on a commercial basis to protect taxpayers.
The Government’s actions under the EFF contributed significantly to improved credit conditions following its implementation. For example, during 2010, aided by the Canadian Secured Credit Facility, $12.5 billion of securities backed by vehicle and equipment loans and leases, floorplan financing and credit card receivables was issued, the most since 2006. This market remained strong in 2011, with $10.9 billion of securities issued during the year.
Credit growth in Canada remains stronger
than in the U.S.
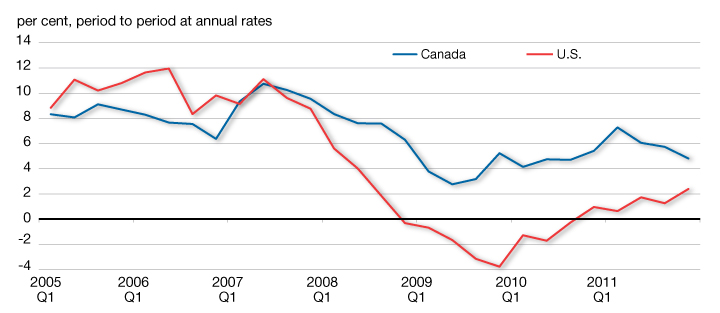
Our financial system, the strongest in the world, supports national growth at a time when banking problems in many developed countries have become an impediment to the revitalization of economic activity.
— Warren Jestin, Senior Vice-President
& Chief Economist, Scotiabank,
December 2011
In addition, through the IMPP, the Government purchased $69 billion in insured residential mortgage pools from Canadian financial institutions to help them to continue lending to Canadian consumers and businesses. The program operated at no financial cost or additional risk to taxpayers since the mortgages were already contingent liabilities of the Government of Canada. In fact, to date, the IMPP has generated more than $1.2 billion in net revenues. By the time the program ends in 2014–2015, it will have generated an estimated $2.5 billion in net revenues that will benefit Canada’s budgetary balance. Overall, the IMPP, together with the other measures included in the EFF, allowed Canadian households and businesses continued access to financing at a reasonable cost during the global credit crisis.
Job Impact of the Stimulus Phase of the Economic Action Plan
The objective of the stimulus phase of Canada’s Economic Action Plan was to protect jobs and safeguard individual Canadians in the face of the worst global financial and economic crisis since the 1930s. This section provides a final assessment of the economic impact of the stimulus phase of the Economic Action Plan.
Measuring the Job Impact of the Stimulus Phase of the Economic Action Plan
To estimate the total number of jobs maintained or created by the stimulus phase of the Economic Action Plan, all stimulus actions—infrastructure stimulus, tax reductions, Employment Insurance (EI) measures and other actions—need to be taken into account. Job impacts cannot be observed directly for all elements of the Action Plan (i.e. tax reductions and EI measures) since they are not related to specific projects or activities but rather support income and overall economic activity.
For elements of the stimulus phase of the Economic Action Plan that are project-based, project managers can normally estimate the number of jobs related to each project. However, project-level data cannot readily be aggregated to determine an overall job impact because:
- Where data is available, it is often not presented in a consistent manner—for example, on a full-time-equivalent basis.
- Even if complete project-level data were available on a consistent basis, the data would only account for the direct impact in the construction industry. Indirect jobs created or maintained in industries providing inputs to the construction industry and induced jobs created or maintained in all industries by the additional economic activity in the construction industry would not be accounted for.
As a result, the job impacts of the stimulus phase of the Economic Action Plan are estimated using the Department of Finance’s Canadian Economic and Fiscal Model (CEFM), which provides “multipliers” for different categories of expenditure and tax measures that account for first-round, indirect and induced impacts on the economy. Further details on the underlying assumptions and methodology of this model-based approach can be found in the Seventh Report to Canadians (January 2011).
This approach is in line with that taken by international organizations and other governments, including the United States.[1] It was also reviewed and validated by well-respected economic experts from the private sector and academia:
- Peter Dungan, Director, and Steve Murphy, Research Associate, Policy and Economic Analysis Program, Rotman School of Management, University of Toronto.
- Glen Hodgson, Senior Vice-President and Chief Economist, and Pedro Antunes, Director of the National and Provincial Forecast, Conference Board of Canada.
- Stéfane Marion, Chief Economist and Strategist, National Bank Financial Group.
The assumptions underlying these estimates are prudent. The multipliers used in assessing the economic impact of the stimulus phase of the Economic Action Plan are similar to or lower than those used by the U.S. Council of Economic Advisers in assessing the impact of the American Recovery and Reinvestment Act and those found in models of leading Canadian private sector forecasters.[2] In addition, recent economic research suggests that fiscal multipliers are larger than those used in this analysis when the policy interest rate has reached its effective lower bound, as was the case in Canada from April 2009 to May 2010.[3]
The Job Impact of the Stimulus Phase of the Economic Action Plan
To assess the impact of the stimulus phase of the Economic Action Plan on jobs maintained or created, the economic activity multipliers in the CEFM are combined with information on the amount of stimulus flowing in the economy. Estimates take into account provincial and territorial leverage reported by partners. In some cases, reported leverage exceeds levels required by program parameters at the outset of the stimulus phase of the Economic Action Plan. These provincial and territorial contributions are shown in Table A2.2 of this annex.
Table A2.13 shows the resulting estimated stimulus flowing in the economy as of March 2011, to each area of the stimulus phase of the Economic Action Plan. The analysis that follows reviews the economic and job impacts of the stimulus phase of the Economic Action Plan through March 2011, the last month in which the majority of the stimulus measures in the Plan were in effect.
| Dollars Flowing as of March 2011 | |
|---|---|
| Reducing the Tax Burden for Canadians | 6,288 |
| Helping the Unemployed | 8,477 |
| Building Infrastructure to Create Jobs1 | 21,794 |
| Advancing Canada’s Knowledge Economy and Creating Better Jobs1 | 5,463 |
| Supporting Industries and Communities1 | 18,730 |
| Total | 60,752 |
| Note: Totals may not add due to rounding 1 Includes provincial and territorial leverage. |
|
It is estimated that close to $15 billion was devoted to reducing the tax burden and helping the unemployed. Over $21 billion was invested in new public and housing infrastructure. More than $5 billion was invested in knowledge infrastructure and science and technology to help create better jobs. Finally, over $18 billion was disbursed to support industries and communities.
Combining the amounts flowing for each of the measures in the Economic Action Plan with the appropriate activity multipliers for production and employment discussed earlier provides an estimate of the Action Plan’s economic impact.
The implementation of the stimulus phase of the Economic Action Plan has had a substantial beneficial impact on output and employment (Table A2.14). On average, the funds disbursed are estimated to have boosted Canada’s real gross domestic product (GDP) growth by 1.2 percentage points per quarter between the second quarter of 2009 and the first quarter of 2011.
Improved economic growth translates into a higher level of employment. Indeed, the stimulus phase of the Economic Action Plan reduced the size of the contraction in employment in the second quarter of 2009, prevented another contraction in the third quarter of 2009, and contributed to the increase in employment from the last quarter of 2009 through the first quarter of 2011. The Department of Finance estimates that the stimulus phase of the Economic Action Plan had created or maintained almost 250,000 jobs as of March 2011, and that the job impact remained close to this level through the remainder of 2011.
| 2009 Q2 |
2009 Q3 |
2009 Q4 |
2010 Q1 |
2010 Q2 |
2010 Q3 |
2010 Q4 |
2011 Q1 |
March 2011 |
|
|---|---|---|---|---|---|---|---|---|---|
| Real GDP Growth | |||||||||
| Actual | -3.7 | 1.7 | 5.0 | 5.6 | 2.3 | 2.5 | 3.1 | 3.7 | – |
| Without Economic Action Plan (EAP) measures | -5.1 | 0.1 | 3.1 | 3.6 | 2.1 | 1.4 | 2.3 | 2.9 | – |
| Impact of the EAP (percentage points) | 1.4 | 1.6 | 1.9 | 2.0 | 0.2 | 1.1 | 0.8 | 0.8 | – |
| Employment Growth | |||||||||
| Actual | -1.8 | 0.0 | 1.8 | 1.3 | 3.1 | 1.3 | 1.0 | 2.2 | – |
| Without EAP measures | -2.3 | -0.6 | 0.9 | 0.4 | 2.5 | 0.7 | 0.4 | 1.6 | – |
| Impact of the EAP (percentage points) | 0.6 | 0.6 | 0.9 | 0.9 | 0.6 | 0.6 | 0.6 | 0.6 | – |
| Employment level (thousands) | 27 | 53 | 92 | 130 | 156 | 185 | 213 | 239 | 248 |
Table A2.15 breaks down the jobs estimated to have been created or maintained according to the five elements of the stimulus phase of the Economic Action Plan.
| March 2011 | |
|---|---|
| Reducing the Tax Burden for Canadians | 24,000 |
| Helping the Unemployed | 33,000 |
| Building Infrastructure to Create Jobs | 96,000 |
| Advancing Canada’s Knowledge Economy and Creating Better Jobs | 28,000 |
| Supporting Industries and Communities | 68,000 |
| Total | 248,000 |
| Note: Totals may not add due to rounding. | |
JSectoral Impact of the Stimulus Phase of the Economic Action Plan on Jobs
The manufacturing and construction sectors were particularly hard hit by the economic slowdown. The stimulus phase of the Economic Action Plan responded with several measures to support these sectors directly, particularly through infrastructure investment and funding to support housing as well as industries and communities.
Employment in construction increased strongly following the implementation of the stimulus phase of the Action Plan, recovering all of the jobs lost during the recession, contrasting sharply with the recessions of the 1980s and 1990s when employment in this industry continued to decline in the early stages of recovery. Employment in manufacturing stabilized with weak U.S. demand and the appreciation of the Canadian dollar limiting employment growth in the manufacturing sector. Employment in the service sector increased significantly and is now well above pre-recession levels.
Table A2.16 provides a sectoral breakdown of the jobs estimated to have been created or maintained by the stimulus phase of the Economic Action Plan.[4]
| March 2011 | |
|---|---|
| Primary and utilities | 5,000 |
| Construction | 60,000 |
| Manufacturing | 39,000 |
| Services | 143,000 |
| Total | 248,000 |
| Note: Totals may not add due to rounding. | |
Conclusion
The performance of the Canadian economy through the global financial crisis shows that the stimulus phase of Canada’s Economic Action Plan worked—it played a key role in supporting the domestic economy through a period of significant global weakness. The stimulus phase of the Economic Action Plan provided a vital boost to confidence and significant support to those industries most affected by the recession, thereby creating or preserving jobs that would otherwise have been lost.
[1] See, for example, Congressional Budget Office, Estimated Impact of the American Recovery and Reinvestment Act on Employment and Economic Output from October 2011 Through December 2011 (February 2012).
[2] Executive Office of the President, Council of Economic Advisers. Christina Romer and Jared Bernstein. “The Job Impact of the American Recovery and Reinvestment Plan” (January 2009) and Government of Canada, Budget 2009, Annex 1.
[3] Lawrence Christiano, Martin Eichenbaum and Sergio Rebelo. “When is the Government Spending Multiplier Large?” National Bureau of Economic Research Working Paper No. 15394 (2009).
[4] The results are based on estimates from the CEFM and simulations from an input-output model of the Canadian economy.