Archived information
Archived information is provided for reference, research or recordkeeping purposes. It is not subject to the Government of Canada Web Standards and has not been altered or updated since it was archived. Please contact us to request a format other than those available.
Annex 1 - Maintaining Fiscal Balance in the Federation
Highlights
- There is no fiscal imbalance in Canada.
- All governments have the capacity to balance their budgets.
- Since 2006, the Government has pursued a low-tax plan that has significantly reduced the tax burden on Canadians through broad-based tax cuts and targeted relief for individuals, families and businesses.
- At the same time, the Government has placed major transfers to the provinces and territories on a sustainable, predictable growth track.
- The four major transfers to provinces and territories will amount to almost $68 billion in 2015–16, an increase of more than $3 billion over 2014–15 and an increase of almost 63 per cent since 2005–06.
- The federal government has worked to eliminate its deficit while continuing to increase support to provinces, territories and individuals.
- Over the next five years, the federal government will make projected total additional investments of $27 billion in the Canada Health Transfer, $6 billion in the Canada Social Transfer, $10 billion in Equalization and $1 billion in Territorial Formula Financing.
- The federal government continues to make significant investments in areas that will benefit provincial and territorial economies, including unprecedented support for infrastructure.
- All levels of government are responsible for responding to their own fiscal pressures and ensuring spending does not exceed revenues.
Maintaining Fiscal Balance in the Federation
There is no fiscal imbalance between the federal government and the provinces. A fiscal imbalance could be created when federal transfers to provinces and territories are significantly cut and the federal tax burden is increased at the same time. The federal government has adopted the exact opposite approach. Since 2006, the Government has pursued a low-tax plan to support job creation and economic growth. As part of this plan, the Government has increased major transfers to provinces and territories, reduced taxes on individuals, families and businesses, and balanced the budget. Budgetary pressures faced by provinces and territories are due to their own spending plans.
Federal, provincial and territorial governments in Canada each have access to all of the tools necessary to deliver the public services under their respective areas of responsibility and manage their public finances responsibly. Each level of government is accountable to their residents for taxing and spending decisions.
All levels of government must be responsible stewards of taxpayer dollars and control public spending to achieve balanced budgets. Provincial and territorial governments have access to virtually all of the same sources of revenue as the federal government. In addition, provincial and territorial governments have other significant revenue streams such as royalties from natural resources and profits from lotteries and gaming that, with limited exceptions, do not generally benefit the federal government (see below).
| Federal | Provincial | |
|---|---|---|
| Common revenue sources | ||
| Personal income taxes | Yes | Yes |
| Corporate income taxes | Yes | Yes |
| Sales taxes | Yes | Yes |
| Payroll taxes | Yes | Yes |
| Unique provincial revenue sources | ||
| Resource royalties within provincial jurisdiction | Yes | |
| Gaming, liquor profits | Yes | |
| Property taxes | Yes | |
| Unique federal revenue sources | ||
| Custom import duties | Yes | |
| Witholding taxes on non-residents | Yes |
In 2012, according to the Organisation for Economic Co-operation and Development (OECD), nearly 50 per cent of all tax revenues in Canada were collected by provincial, territorial and local governments—a share that is higher than in other federations (Chart A1.1).
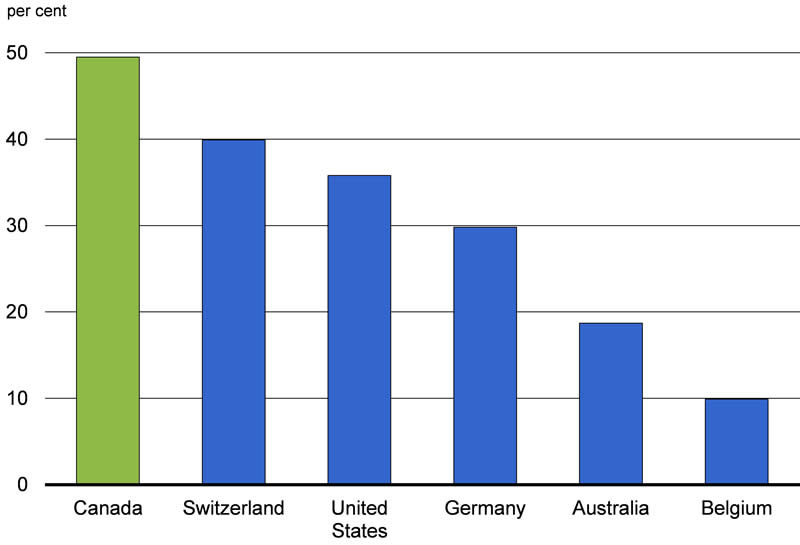
Source: OECD, Revenue Statistics 2014.
The Government Has Cut Taxes Significantly
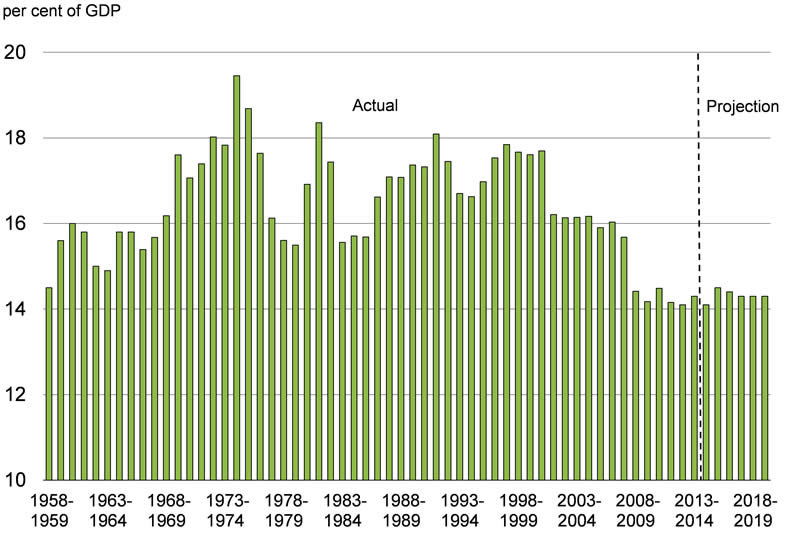
Lower taxes drive economic growth. That is why the Government of Canada has consistently cut taxes since 2006. Federal revenues as a proportion of gross domestic product (GDP) have declined substantially since 2006–07 and are at their lowest level in over 50 years (Chart A1.2). This is due primarily to broad-based federal tax cuts and targeted relief for individuals, families and businesses, which is also good for the economy. A lower tax burden at the federal level gives the provinces and territories more flexibility to address their own economic challenges.
The broad-based federal tax cuts and targeted relief for individuals, families and businesses introduced since 2006 include:
- Reducing the Goods and Services Tax rate to 5 per cent from 7 per cent.
- Increasing the amount of income that all Canadians can earn without paying federal income tax.
- Reducing the lowest personal income tax rate to 15 per cent from 16 per cent.
- Increasing the upper limit of the two lowest personal income tax brackets so that individuals can earn more income before being subject to higher federal tax rates.
- Reducing the federal general corporate income tax rate to 15 per cent from 22.12 per cent.
- Reducing the small business corporate income tax rate to 11 per cent and increasing the amount of annual income eligible for this lower rate to $500,000. Economic Action Plan 2015 proposes to further reduce the small business tax rate by 2 percentage points.
At the same time, the Government of Canada has maintained vital public services and continued to invest in infrastructure across Canada. In order to see growth in jobs and the economy, all levels of government must ensure their fiscal houses are in order. Running deficits will only increase the debt burden on taxpayers. Higher debt will result in higher debt servicing costs, putting vital services at risk. Furthermore, ongoing deficits prevent governments from taking steps to make their economic environments competitive. That is why the federal government has consistently acted to responsibly reduce spending without compromising services to Canadians.
The Government Has Increased Financial Support to the Provinces and Territories
The Government of Canada has taken responsible steps to achieve a balanced budget without reducing transfers to individuals or provinces and territories. All levels of government are responsible for responding to their own fiscal pressures. In order to return to balanced budgets, governments must take steps to ensure spending does not exceed revenues.
Upon taking office in 2006, the Government committed to respond to concerns about the fiscal imbalance and to work to ensure that fiscal arrangements provide all governments with access to the resources they need to meet their responsibilities.
Subsequently, the Government invested more than $39 billion over seven years for shared priorities and placed all major fiscal transfers on a long-term, principle-based growth track. Investments to support provinces and territories include:
- Enriching the Equalization program and introducing new Equalization and Territorial Formula Financing formulas based on the recommendations of an expert panel.
- Enriching the Canada Social Transfer and moving to an equal per capita cash allocation for both the Canada Social Transfer and the Canada Health Transfer.
- Ensuring that transfers grow in a sustainable and predictable manner.
In addition to the growth in major transfers, the Government has made significant investments in areas that will benefit provincial and territorial economies, including actions taken in Economic Action Plan 2013 to provide over $53 billion for infrastructure over the next decade to support investments in areas such as roads, bridges, public transit, drinking water and community infrastructure. Furthermore, in Economic Action Plan 2015, the Government is proposing to provide an additional $750 million over two years, starting in 2017–18, and $1 billion per year ongoing thereafter, for a new and innovative Public Transit Fund to promote public transit infrastructure investment in a manner that is affordable for taxpayers and efficient for commuters.
Major Transfers Are at an All-Time High and Will Continue to Grow
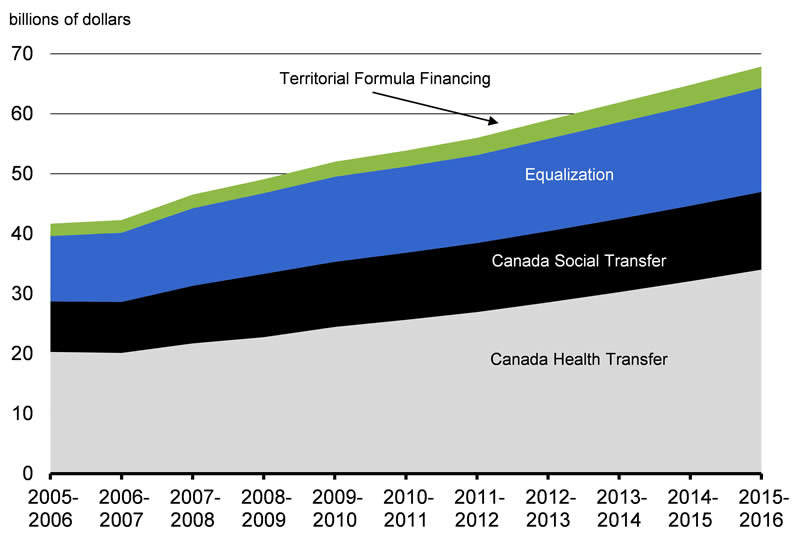
Today, transfers to the provinces and territories are at an all-time high and will continue to grow moving forward. In 2015–16, the four major transfers to provinces and territories will amount to almost $68 billion1, an increase of more than $3 billion over 2014–15 and an increase of almost 63 per cent since 2005–06 (Chart A1.3). Over this period, the Equalization program has grown by 59 per cent, the Territorial Formula Financing program by 73 per cent, the Canada Health Transfer by 68 per cent and the Canada Social Transfer by 54 per cent.
Ensuring a strong, publicly funded health care system remains a top priority for the Government. This is why the Canada Health Transfer will continue to grow to record levels over the coming years. Specifically, it will grow at an annual rate of 6 per cent for two more years and, beginning in 2017–18, it will grow in line with nominal GDP, with a guaranteed minimum funding growth rate of 3 per cent per year. This growth path demonstrates the Government’s commitment to a publicly funded, universally accessible health care system that respects the principles of the Canada Health Act and recognizes that health care is an area of provincial jurisdiction. On this path, the Canada Health Transfer is projected to grow from $34 billion in 2015–16 to $40.9 billion by 2019–20. This funding will provide certainty and stability to the provinces and territories as they take action to put their respective health care systems on sustainable spending paths. The Canada Health Transfer will be reviewed in 2024.
The Canada Social Transfer provides financial support to provinces and territories for post-secondary education, social assistance and social services, as well as programs for children. The Canada Social Transfer will continue to grow at its current rate of 3 per cent per year in 2015–16 and beyond. It will also be reviewed in 2024.
Programs to reduce fiscal disparities among provinces and territories are important components of Canada’s system of fiscal federalism. This is why the Government continues to provide significant and growing support through both the Equalization and Territorial Formula Financing programs. Going forward, Equalization will continue to grow in line with nominal GDP, and Territorial Formula Financing will continue to grow based on its current formula.
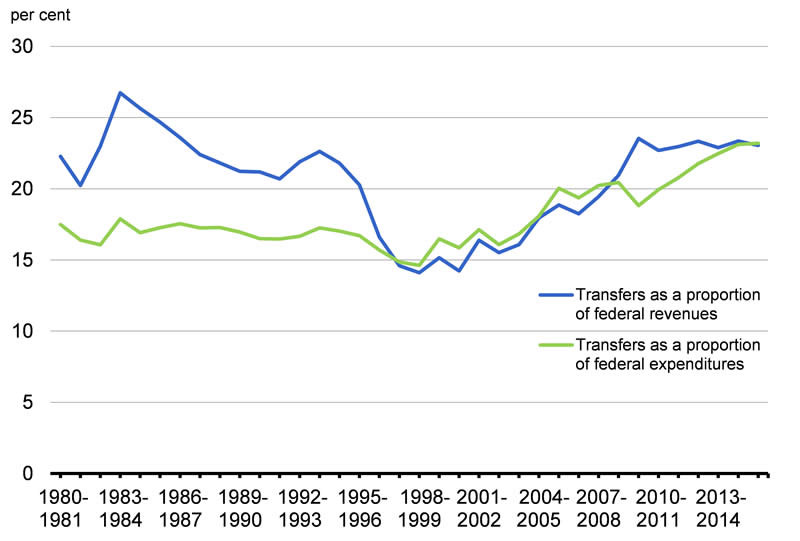
Federal revenues as a percentage of GDP are at the lowest level in over 50 years and federal support for provinces and territories has increased significantly since 2005–06. In fact, major transfers as a proportion of provincial and territorial revenues are now at the highest level in over 20 years. Furthermore, major transfers as a proportion of federal revenues are at the highest level in almost 30 years and as a percentage of federal expenditures are at the highest level in over 35 years (Chart A1.4).
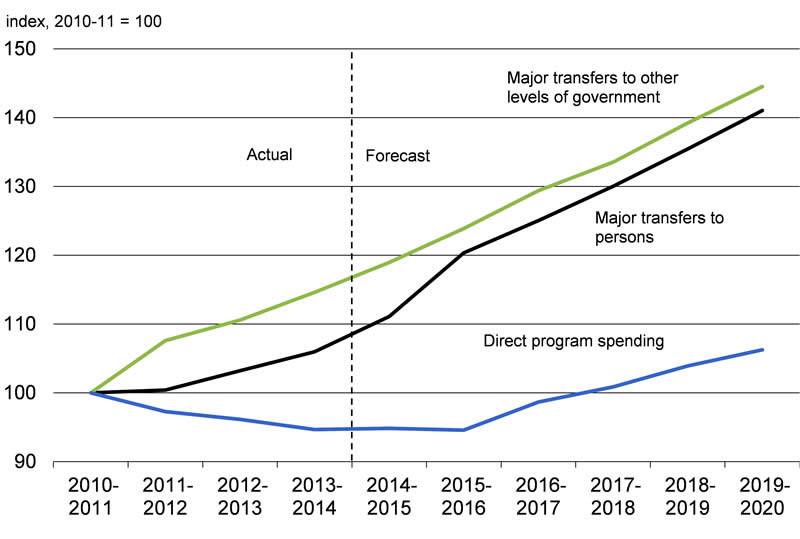
The Government’s actions have provided provinces and territories with a strong base of federal support. Even during the global recession and throughout the subsequent recovery, the Government has not reduced transfers to provinces and territories. Instead, it has worked to eliminate its deficit through reductions in direct program spending without compromising the delivery of priority services to Canadians (Chart A1.5). As a result, direct program spending has declined for four consecutive years, a trend that has not been achieved in decades. The Government has also cut taxes and freed up tax room, supporting economic growth in all provinces and territories.
Provinces and territories must make responsible decisions to achieve balanced budgets and reduce the debt burden on taxpayers, just as the federal government has done. It is their responsibility to implement prudent spending plans rather than demand the federal government fix their budgetary problems. Eliminating deficits will increase economic competitiveness and ensure government funds flow to vital services, not to service the debt. The Government is encouraged that provinces in deficit situations have stated that they are committed to returning to balanced budgets.
1 This amount only includes payments for Equalization, Territorial Formula Financing, the Canada Health Transfer and the Canada Social Transfer. It does not match the total for major transfers to other levels of government shown in Table 5.2.6, which also includes amounts for the Youth Allowances Recovery, recoveries of Alternative Payments for Standing Programs, statutory subsidies and payments under the 2005 Offshore Accords.