Archived information
Archived information is provided for reference, research or recordkeeping purposes. It is not subject to the Government of Canada Web Standards and has not been altered or updated since it was archived. Please contact us to request a format other than those available.
Annex 2 - International Debt Comparisons
Highlights
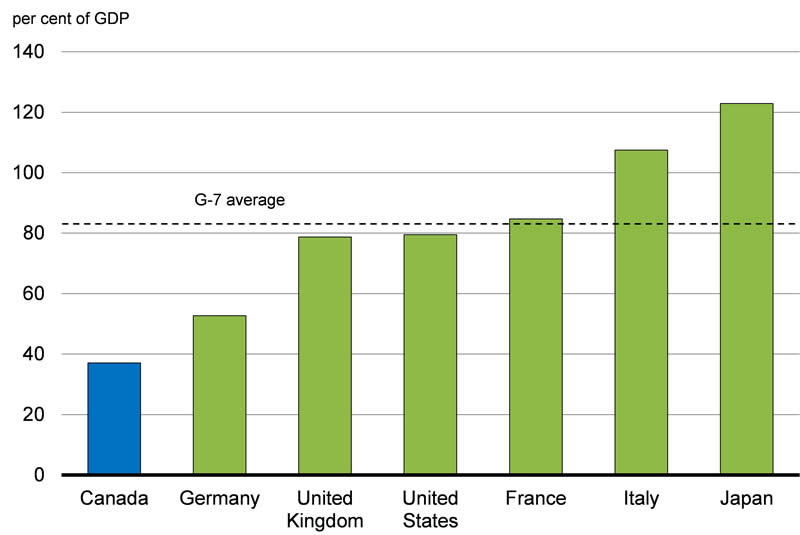
- According to official statistics published by the International Monetary Fund (IMF) and the Organisation for Economic Co-operation and Development (OECD), Canada’s total government net debt is the lowest in the Group of Seven (G-7) and less than half the average of G-7 countries.
- Official statistics published by the IMF and the OECD, however, overstate Canadian government debt levels relative to those of most other countries—including most G-7 countries.
- The relative overstatement of Canadian government debt levels is largely the result of the slow adoption by many countries of international accounting standards, which call for the recognition of unfunded public sector employee pension plan liabilities.
- Including the limited data estimates available for unfunded pension liabilities in debt statistics shows that Canada’s net debt-to-GDP (gross domestic product) ratio would be by far the lowest in the G-7, with the U.S. and Germany being the next closest with debt at nearly double that of Canada’s.
- It is important that international investors and credit rating agencies recognize that Canadian government public sector pension plans are well funded, and that, as a result, Canadian government debt statistics appear inappropriately high relative to those of many other countries.
- This is true of the federal government and many of Canada’s provinces.
According to official statistics published by the IMF and the OECD, Canada’s total government net debt (defined as the total liabilities less the financial assets of the federal, provincial/territorial and local governments, as well as the Canada Pension Plan and the Québec Pension Plan) is the lowest in the G-7 and less than half the average of G-7 countries (Chart A2.1).
Official statistics published by the IMF and the OECD, however, overstate Canadian government debt levels relative to those of most other countries—including most G-7 countries.
Many Countries Have Been Slow to Adopt International Accounting Standards
The relative overstatement of Canadian government debt levels is largely the result of the slow adoption by many countries of international accounting standards, which call for the recognition of unfunded public sector employee pension plan liabilities in gross and net debt statistics.1
Canada has always been a world leader in this regard: Statistics Canada first began including unfunded public sector employee pension liabilities in Canada’s debt statistics in the Canadian System of National Accounts in 2002. As of 2015, Canada remains one of only six advanced economies (the others being Australia, Iceland, New Zealand, Sweden and the United States) that recognizes these obligations when measuring government liabilities.2
Many countries, including some G-7 countries, do not regularly estimate the size of their unfunded pension liabilities. Most recent estimates for Germany, France and the United Kingdom indicate unfunded public sector employee pension liabilities in the range of 30 to 60 per cent of GDP for Germany, as high as 90 per cent of GDP for France and 58 per cent of GDP for the U.K.3 Estimates of unfunded public sector employee pension liabilities are not available for Italy and Japan. Canada’s unfunded public sector pension liabilities are low by international standards, at 13 per cent of GDP in 2013 (Table A2.1). This is largely because Canadian governments have taken an additional step beyond simply recognizing unfunded liabilities—by moving to fund them. Indeed Canada’s overall obligation is funded by pension plan assets amounting to 45 per cent of GDP in 2013. It is important to note that these pension plan assets are for public sector employees and are distinct from those held in the Canada Pension Plan and the Québec Pension Plan.
| Unfunded Liability | Recognized | Pension Assets | |
|---|---|---|---|
| Canada | 13.3 | 13.3 | 45.1 |
| United States | 17.9 | 17.9 | 35.3 |
| Germany | 31 to 58 | No | 0.3 |
| France | 48 to 91 | No | 0.6 |
| United Kingdom | 58.0 | No | 13.7 |
Currently, the IMF and the OECD remove the unfunded public sector pension plan liabilities from debt estimates of countries that recognize such liabilities, in an attempt to render these debt statistics more comparable to those of other countries that do not recognize them. This adjustment lowered Canada’s gross and net debt estimates by 13.3 per cent of GDP in 2013. This adjustment, however, does not go nearly far enough towards putting Canada on a comparable basis, as it only recognizes a portion of the impact of Canada’s public sector pension plans on its debt statistics.
Impact of Funding Public Sector Employee Pension Plans on Government Debt Statistics
As described above, in addition to recognizing its pension liabilities, Canada (at both the federal and provincial level) has taken significant steps to fund them. As Canadian governments invest pension plan contributions in financial assets (as opposed to using the contributions to pay down market debt), Canada’s market debt rises each year relative to that of countries that do not recognize or fund their public sector pension liabilities (instead choosing to use pension contributions to reduce their market debt). Indeed, with the exception of the U.S., G-7 economies have accumulated only limited pension plan assets (Table A2.2). As a result, Canada’s gross debt is significantly overstated relative to countries with large unfunded liabilities—even after the unfunded portions have been removed. Further, since Canada’s public sector pension fund assets are not included in the financial assets of the government sector in the Canadian System of National Accounts (they are instead contained in a subsector of the corporate sector known as the trusteed pension plan sector), Canada’s net debt is also overstated relative to the vast majority of other countries.
| Assets | |
|---|---|
| Canada | 45.1 |
| United States | 35.3 |
| Germany | 0.3 |
| France | 0.6 |
| United Kingdom | 13.7 |
| Japan | 9.8 |
Improving the Comparability of International Debt Statistics
The most direct method to resolve this issue would be for all countries to recognize their public sector employee pension plan obligations in their debt statistics. This would put all countries on an equivalent basis, whether or not they choose to fund their obligations; that is, countries that use pension contributions to reduce market debt would see their overall debt increase as the actual obligations associated with those contributions are recognized in their debt data.
Revisions to the UN System of National Accounts (known as SNA08)—the most recent international statistical reporting standard—have helped to improve the coverage of public sector pension obligations with a new “supplementary table on pensions.” Countries abiding by SNA08 reporting standards, such as Canada, will provide additional detail on workplace pension schemes, including public sector employee pension and general social security pension schemes.4 When this data is available, the comparability of international debt statistics should improve considerably. However, it still may take several years for all countries to adhere to these reporting standards (European Union members, for example, are not required to publish this supplementary table before 2017).
In early 2014, the OECD surveyed the national statistics agencies and central banks of all OECD member countries to ascertain the extent of each member country’s unfunded, partially funded and funded pension liabilities and assets, and whether the associated assets were held within the government sector. However, few countries provided additional information about unfunded public sector pension liabilities in their responses.
Using the limited data estimates available for unfunded pension liabilities in G-7 economies suggests that net debt ratios would increase by roughly 75 to 80 per cent for France, Germany and the U.K. if this data were included in their debt statistics. At 50 per cent of GDP, Canada’s net debt-to-GDP ratio would be by far the lowest in the G-7, with the U.S. and Germany being the next closest with debt at nearly double that of Canada’s (Chart A2.2). However, estimates of the unfunded liabilities of Japan and Italy are not available, meaning that an estimate of the true G-7 average (i.e. including liabilities for pension obligations) cannot be calculated.
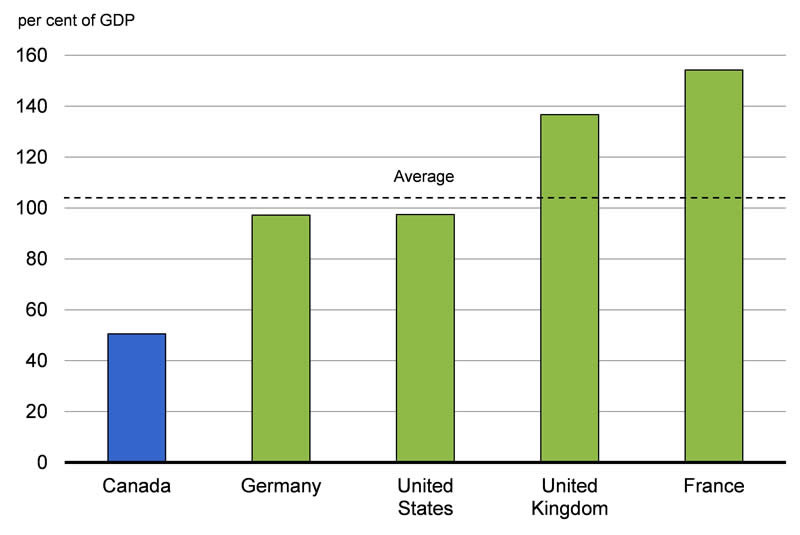
1 Modified net debt-to-GDP ratios shown here are calculated using net debt-to-GDP ratios for 2013 from the IMF and data for unfunded public sector pension plan liabilities from various years, as noted in Table A2.1.
Sources: IMF, World Economic Outlook database, April 2015; OECD and national sources; Department of Finance calculations.
Until reliable data for public sector pension obligations are readily available for all countries, an alternative option for improving the international comparability of Canada’s debt statistics would be to remove the entire pension obligation from debt statistics—both the unfunded and funded portions.
This would essentially be equivalent to recognizing financial assets owned by public sector pension plans as government financial assets, rather than corporate sector assets, when calculating debt statistics. Adjusting G-7 net debt-to-GDP ratios for these assets for international comparison would put Canada in a net asset position (Chart A2.3). The U.S. and the U.K. would also see significant reductions in their more-comparable net debt-to-GDP ratios.
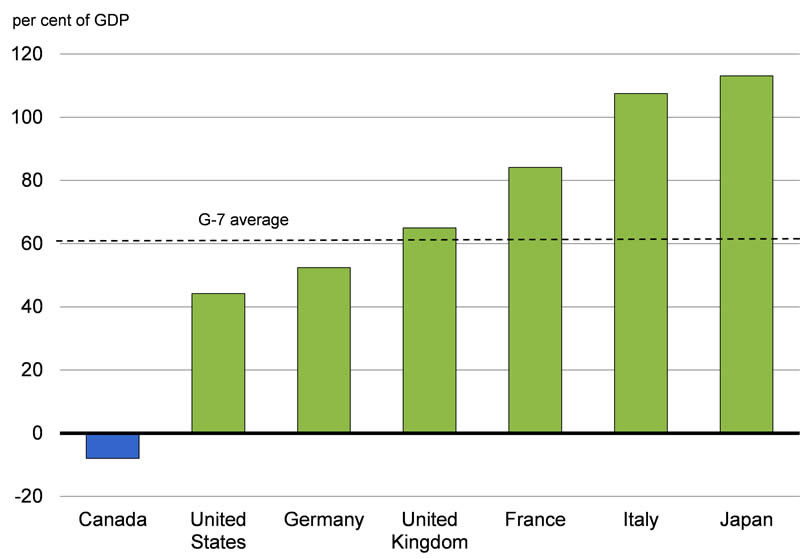
Sources: IMF, World Economic Outlook database, April 2015; OECD and national sources; Department of Finance calculations.
Canadian Government Public Sector Pension Plans Are Well Funded
Given the above, it may not be until 2017 before truly comparable international debt statistics become available. In the interim, however, it is important that international investors and credit rating agencies recognize that Canadian government public sector pension plans are well funded, and that, as a result, Canadian government debt statistics appear inappropriately high relative to those of many other countries. This is true of the federal government and many of Canada’s provinces, including Ontario, Prince Edward Island, New Brunswick and British Columbia, all of which have employee pension obligations that are over 90 per cent funded (Table A2.3).
The Government of Canada began funding the pension plans it sponsors in April 2000.5 Since that time, contributions by plan members and the federal government to public service pension plans, for service after March 2000, are tracked by pension fund accounts but are invested and managed by the independently run Public Sector Pension Investment Board. Prior to April 2000, federal pension plans were unfunded. Therefore, the federal government carries obligations for this earned service but no corresponding asset.
| Pension Benefit Obligations | Pension Plan Assets | Unfunded Pension Liability1 | Funding Ratio (Assets/Obligations) | |
|---|---|---|---|---|
| (per cent of GDP)2 | (per cent) | |||
| Federal government | 13.1 | 4.5 | 8.6 | 34.3 |
| Newfoundland and Labrador | 39.8 | 26.0 | 13.8 | 65.3 |
| Prince Edward Island | 44.4 | 43.6 | 0.8 | 98.2 |
| Nova Scotia | 9.3 | 6.8 | 2.6 | 72.6 |
| New Brunswick | 38.7 | 36.1 | 2.6 | 93.4 |
| Quebec | 25.3 | 13.8 | 11.5 | 54.6 |
| Ontario | 15.6 | 17.0 | -1.4 | 108.7 |
| Manitoba | 13.1 | 8.8 | 4.2 | 67.5 |
| Saskatchewan | 9.8 | 0.8 | 9.1 | 7.7 |
| Alberta | 20.6 | 15.4 | 3.7 | 74.9 |
| British Columbia | 24.9 | 23.8 | 1.1 | 95.6 |
| Yukon | 7.6 | 6.5 | 1.2 | 84.9 |
| Northwest Territories | 2.0 | 1.3 | 0.7 | 66.4 |
| Nunavut | 0.6 | 0.3 | 0.4 | 41.8 |
| Total | 33.0 | 20.7 | 12.2 | 62.9 |
1 Government debt estimates used for international comparisons are reported on a National Accounts basis, as opposed to a Public Accounts basis, on which the audited financial statements and budget documents published by the federal and most provincial governments are reported.
2 See OECD Economic Outlook No. 95, May 2014, Box 4.7, pp. 236-237.
3 Estimates for the U.K. include public sector pension reforms undertaken as of 2010.
4 European Union member countries adhere to the European System of Accounts 2010 reporting standards, which are broadly consistent with the SNA08 definitions, accounting rules and classifications.
5 The federal government currently sponsors defined benefit pension plans for all of its employees, including members of the public service, certain public service corporations and territorial governments, the Canadian Forces (including the Reserve Force) and the Royal Canadian Mounted Police. It also has obligations for other plans, including for Members of Parliament and federally appointed judges, as well as for its Retirement Compensation Arrangements.