
Common menu bar links

Archived - Budget 2011
Chapter 2: Economic Developments and Prospects (June 6, 2011)
Table of Contents - Previous - Next
- This chapter incorporates economic indicators released since Budget 2011 and provides a separate assessment of recent economic developments.
- The Minister of Finance met with leading private sector economists on May 31 to discuss recent economic developments and their implication for the outlook. While economists now expect economic activity in the second quarter to be weaker than expected at the time of Budget 2011, this is offset by the better-than-expected start to 2011, particularly for nominal gross domestic product.
- As a result, the economists continue to see the average private sector forecast from Budget 2011 as a reasonable basis for fiscal planning.
Highlights
- The global economy is recovering from the deepest and most synchronized recession since the 1930s.
- The Canadian recovery is underway, reflecting the extraordinary measures in Canada’s Economic Action Plan and Canada’s solid economic fundamentals.
- Canada has posted the strongest employment growth among Group of Seven (G-7) countries since mid-2009, recouping more than all the jobs lost during the recession.
- The Department of Finance conducted a survey of private sector economists in early March 2011. On March 11, economists met with the Minister of Finance to discuss the economic forecast from the survey as well as the risks associated with that forecast.
- At the time of Budget 2011, private sector economists expected real gross domestic product (GDP) growth of 2.9 per cent in 2011, up from 2.5 per cent in the October 2010 Update of Economic and Fiscal Projections.
- Economists expected the level of nominal GDP—the broadest single measure of the tax base—to be over $20 billion higher, on average, over the forecast period than at the time of the October Update.
- Private sector economists were of the view that risks to the economic outlook were broadly balanced.
- Economists saw the prospects for stronger global growth, particularly in the U.S., and the net benefits of higher commodity prices for the Canadian economy as key factors that could lead to an improvement in the outlook, particularly for nominal GDP.
- However, economists considered sovereign debt issues in Europe and the potential for higher and volatile oil prices—and their implications for global growth and inflation—as key downside risks to the outlook. Moreover, the catastrophic earthquake and tsunami that struck Japan on March 11 were thought then to possibly weigh on the global recovery.
- On May 31, economists met with the Minister of Finance to discuss economic developments since the March survey as well as current risks to the outlook.
- The economists continue to see the average forecast from the March 2011 survey as a reasonable basis for fiscal planning.
- While economists continue to see the risks to the Canadian outlook as balanced, the focus has shifted somewhat since Budget 2011 toward sovereign debt concerns in Europe, and away from oil price volatility and the effects of the Japanese earthquake and tsunami. Economists also expressed concern that the growth dynamics in the U.S. could be less strong than previously anticipated, reflecting weaker-than-expected growth in the first quarter of 2011 and ongoing uncertainty over the fiscal situation in that country.
- The Government has adjusted downward the private sector forecast for nominal GDP for budget planning purposes by $10 billion in each year of the forecast. This adjustment for risk reflects the remaining uncertainties surrounding the global economic outlook.
This chapter incorporates data available up to and including June 3, 2011, unless otherwise indicated. All rates are reported at annual rates unless otherwise noted.
Introduction
The global economy is recovering from the deepest and most synchronized recession since the 1930s. Global financial market conditions have improved markedly and commodity prices have rebounded. Reflecting these developments, together with the impact of Canada’s Economic Action Plan and significant monetary policy stimulus, the economic recovery in Canada is underway. Canada has posted the strongest employment growth among G-7 countries since June 2009, recouping more than all the jobs lost during the recession. Both output and private domestic demand are now above pre‑recession levels in Canada—one of only two countries, along with Germany, among the G-7 to have achieved this.
While the near-term global economic outlook has improved since the October 2010 Update of Economic and Fiscal Projections, private sector economists continue to expect moderate growth in Canada going forward.
This chapter reviews the major global and Canadian economic developments since the October 2010 Update, describes the private sector economic forecast that forms the basis for the fiscal projections, and discusses the risks and uncertainties surrounding this economic forecast.
Global Economic Developments and Outlook
Following stronger-than-expected growth in late 2009 and early 2010, the pace of the global recovery has eased somewhat in recent quarters, and is expected to remain moderate going forward. Most advanced economies are posting moderate growth, and many emerging and developing economies are experiencing strong growth.
The recovery in advanced economies is expected to remain moderate, reflecting the gradual withdrawal of fiscal stimulus in most of these countries and the end of the inventory rebuilding cycle. In this context, a sustained global recovery will require increased support from the private sector. While private domestic demand has returned to its pre-recession level in Canada, it has been slow to pick up elsewhere (Chart 2.1).
Although recent developments in some advanced countries, particularly the U.S., were encouraging as of March, persistently low consumer confidence, continued weakness in household and financial sector balance sheets and high unemployment are expected to weigh on private domestic demand growth in many advanced economies going forward. Moreover, the catastrophic earthquake that struck Japan on March 11 is expected to have a significant but temporary impact on the Japanese economy. The situation in Japan and its economic implications remain uncertain.
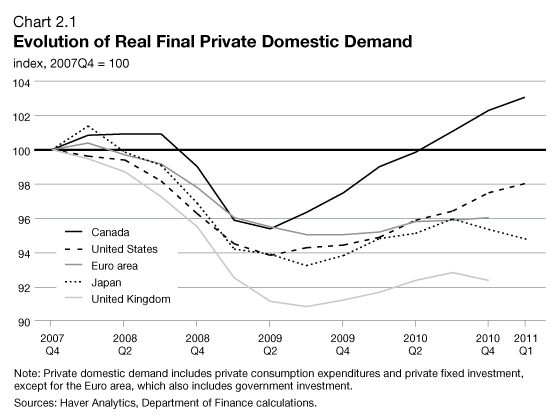
This chart from Budget 2011 has been updated to include historical revisions and 2011Q1 results.
Growth in emerging economies is expected to remain strong, supported by robust domestic demand, the recovery of global trade and resurgent capital flows. However, inflationary pressures are building in some emerging economies, in part reflecting rising food and energy prices.
Overall, the International Monetary Fund (IMF) expects the global economy to grow 4.4 per cent in 2011 and 4.5 per cent in 2012, down from 5.0 per cent in 2010, led by emerging economies including China (Chart 2.2). In advanced economies the ongoing recovery is forecast to be more moderate with expected growth of 2.4 per cent in 2011 and 2.6 per cent in 2012, down from 3.0 per cent in 2010.
The recovery in advanced economies is moderate compared to previous recoveries, when firms ramped up production to make up output lost during the recession. This is because some of the output lost during the global financial crisis, relative to its pre-recession trend, is not expected to be recouped over the medium term, as the level of activity prior to the crisis is now seen as having been unsustainably high.
In the U.S., the recession ended in June 2009 but the recovery since then has been weak by historical standards.[1] Significant policy stimulus and the end of the inventory liquidation cycle were the initial drivers of the recovery, but their impact faded over the course of 2010. Nonetheless, U.S. economic activity showed signs of pickup in the final quarter of 2010, driven by a jump in consumer spending, to a pace of 3.1 per cent. Growth continued in the first quarter of 2011, albeit at a more moderate pace of 1.8 per cent. This result is discussed in more detail in the section “Economic Developments Since Budget 2011” later in this chapter.
is expected to continue
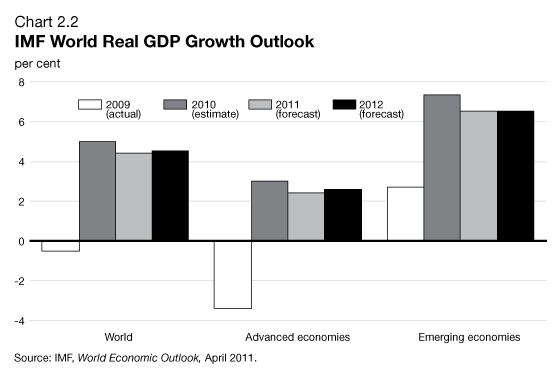
This chart from Budget 2011 has been revised based on the IMF April 2011 World Economic Outlook. It was originally based on the IMF January 2011 World Economic Outlook Update.
Despite the recent pickup in the pace of consumer spending, the moderate economic recovery has so far restrained the rate of job creation. While U.S. firms resumed hiring in March 2010, with close to 1.8 million jobs created since then, total payroll employment remains almost 7 million (or 5.0 per cent) below its pre-recession peak. Furthermore, the unemployment rate remains elevated at 9.1 per cent, 4.7 percentage points higher than its previous trough.
Looking ahead, increased business investment as well as an expected turnaround in residential construction should support stronger private domestic demand growth in 2011, although a sustained pickup in household spending could be limited by continued weakness in employment and the ongoing need to adjust household balance sheets weakened by significant declines in housing values. According to the March 2011 survey of private sector economists, U.S. real GDP growth is expected to be 3.1 per cent in 2011, up from 2.4 per cent in the September 2010 survey (Chart 2.3).
gradually improving since last September
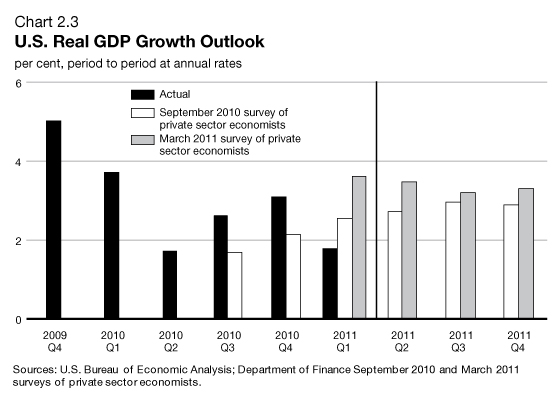
This chart from Budget 2011 has been updated to include actual real GDP growth for 2011Q1 and revisions to 2010Q4.
Canada’s Recent Economic Performance
Canada weathered the global recession better than most other industrialized countries and the recovery is underway. Economic activity has more than fully returned to pre-recession levels, leading to a rebound in jobs.
About 540,000 more Canadians are working today than in July 2009—more than offsetting the jobs lost in Canada during the global economic downturn. Canada’s labour market recovery has been strong and widespread. On a net basis, subtracting job losses from employment gains, almost 90 per cent of the jobs created since July 2009 have been in relatively high-wage industries, with close to 85 per cent being full-time jobs (Chart 2.4). Furthermore, virtually all provinces have recorded employment gains over the recovery.
in high-wage, full-time employment
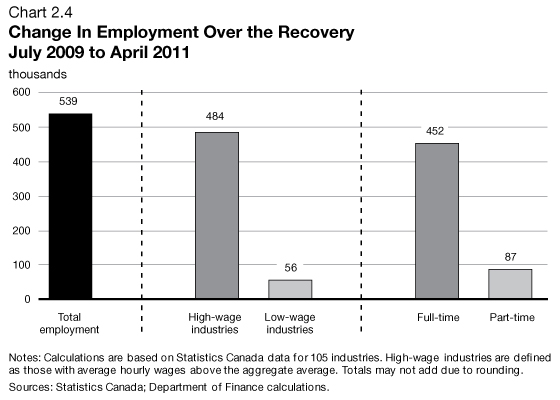
This chart from Budget 2011 has been updated to include results for March and April 2011.
The labour market recovery in Canada contrasts sharply with labour market developments in the U.S., where only one in five of the 8.8 million jobs lost have been regained (Chart 2.5).
As a result of strong job creation, the unemployment rate in Canada fell from a peak of 8.7 per cent in August 2009 to 7.6 per cent in April 2011. The Canadian unemployment rate is 1.5 percentage points below that of the United States. The U.S. unemployment rate has exceeded that of Canada since October 2008, a phenomenon not seen in nearly three decades. Furthermore, if measured on the same basis the unemployment rate gap between the two countries increases to 2.5 percentage points.[2]
all of the jobs lost during the recession
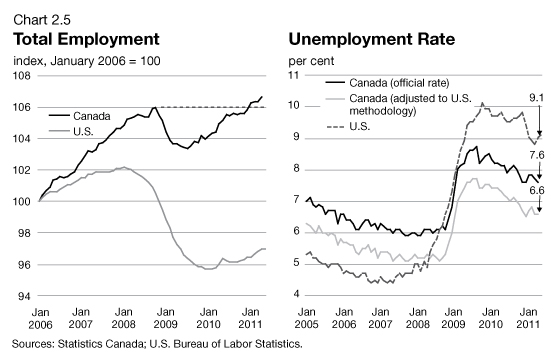
This chart from Budget 2011 has been updated to include results for March and April 2011 for Canada and March through May 2011 for the United States.
The labour market recovery has been underpinned by a return to economic growth. Since the third quarter of 2009, the Canadian economy has expanded for seven consecutive quarters (Chart 2.6).
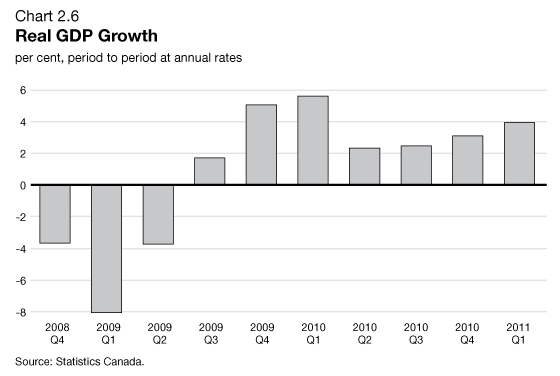
This chart from Budget 2011 has been updated to include historical revisions and 2011Q1 results.
Throughout the recovery, growth has been fuelled by a strong rebound in consumer and business expenditures, reflecting in part the positive impact of Canada’s Economic Action Plan on consumer and business confidence and the effects of low interest rates. Growth in real consumer spending on goods and services has averaged about 3 per cent per quarter since the recovery began. Business investment has been even stronger, growing on average by more than 16 per cent per quarter in 2010 and the first quarter of 2011. This strong investment performance bodes well for future improvements in Canada’s productivity.
The strength of the domestic economy, however, has been dampened by weak demand for Canadian exports, which has left the level of real exports significantly below its pre-recession level. This reflects relatively slow growth in Canada’s trading partners combined with a strong Canadian dollar.
The economic impact of the weak export recovery has been compounded by the large share of exports in Canada’s economy. However, real exports rebounded strongly late in 2010 and early in 2011, in line with strengthening global demand.
Real housing investment declined modestly in mid-2010, following very strong growth at the end of 2009 and in early 2010 that was boosted by a number of transitory factors. Nevertheless, households have taken advantage of record low interest rates to increase their borrowing, much of which has financed home purchases. However, because homes have maintained their value in Canada much better than in the U.S., household leverage (as measured by debt relative to assets) in Canada remains much lower than in the United States.
In order to promote the long-term stability of Canada’s housing market, the Government announced on January 17, 2011, changes to the rules for government-backed insured mortgages, building on previous measures implemented in October 2008 and April 2010 to protect and strengthen the Canadian housing market. These included a reduction in the maximum amortization period from 35 years to 30 years for new government-backed insured mortgages, a reduction in the maximum amount Canadians can borrow in refinancing their mortgages from 90 per cent to 85 per cent of the value of their home and the withdrawal of government-backed insurance on home equity lines of credit. The adjustments to the mortgage insurance guarantee framework came into force on March 18, 2011, while the withdrawal of government insurance backing on lines of credit secured by homes came into force on April 18, 2011. These measures will significantly reduce the total interest payments Canadian families make on their mortgages, promote saving through home ownership and limit the repackaging of consumer debt into mortgages guaranteed by taxpayers.
Canada’s Policy Framework
and Economic Performance
In 2006, the Government launched a comprehensive economic plan designed to build a stronger economy by fostering Canada’s key advantages. The Government followed through by implementing broad-based tax reductions, paying down debt, and investing in knowledge and infrastructure.
These actions helped to lay the foundation for sustainable, long-term economic growth, and to place Canada in a stronger position than most other countries to face the global crisis by giving the Government the flexibility needed to respond quickly and effectively to support the economy and protect Canadian jobs.
This has been reflected in a strong economic performance over the last five years, with Canada posting the strongest employment and income growth in the G-7 (Chart 2.7). This has been particularly evident over the recovery, with Canada posting the strongest employment growth among G-7 countries since June 2009.
than in any other G-7 country since 2006
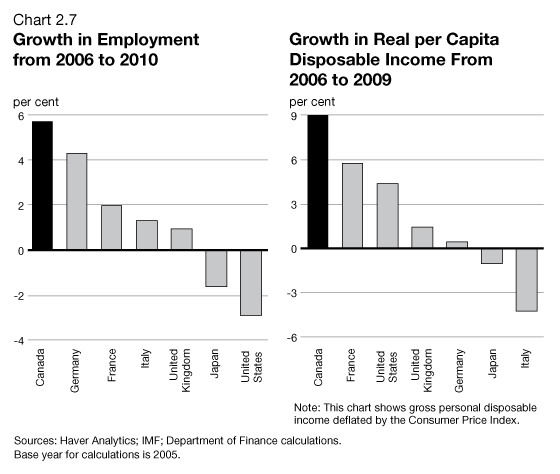
These charts from Budget 2011 have been updated to include historical revisions. Employment results for 2010Q4 for France have also been added to the left chart.
Financial Market Developments
Global private sector financial conditions have improved markedly since the financial crisis. Strains in wholesale banking markets have largely dissipated and corporate borrowing costs have declined significantly. This improvement was a key driver of global economic activity in 2010.
While improved private sector financial conditions reflect the impact of policy measures worldwide, financial markets have become increasingly concerned since early 2010 about the sustainability of public finances in a number of countries. The situation is especially acute in smaller European countries with relatively weak fiscal positions. As a result, borrowing costs for these economies have risen sharply, putting additional pressure on their fiscal situations (Chart 2.8). Important steps have been taken in a number of European countries to restore fiscal sustainability over the medium term, including Greece and Ireland, which have accepted financial assistance from the European Union and the IMF, and Portugal, which recently agreed to accept assistance. However, considerable uncertainty remains, underscoring the necessity to improve fiscal conditions in many countries.
for some European economies
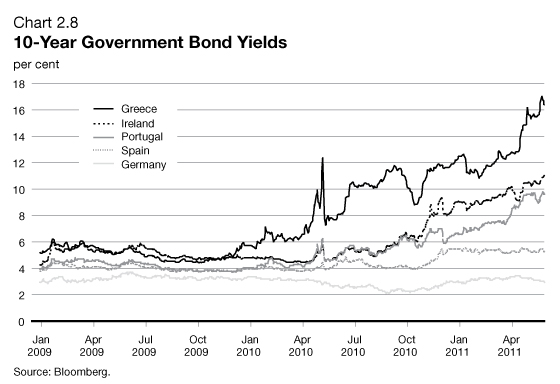
This chart from Budget 2011 has been updated to include data from March 18 to May 27, 2011.
In Canada, the financial crisis had considerably less impact than in other countries. Borrowing costs remained relatively low and credit continued to grow at a solid pace during the crisis, reflecting, in part, Canada’s financial institutions being better capitalized and less leveraged than their international counterparts going into the global recession. Canadian financial institutions continue to be regarded as the healthiest in the world. Indeed, the World Economic Forum has ranked Canada’s banking system as the soundest in the world for three consecutive years.
At the same time, strong growth in world prices of most commodities produced in Canada since mid-2010 together with Canada’s sound fundamentals have boosted the attractiveness of Canadian financial assets among international investors, keeping bond rates low and supporting the Canadian dollar.
Commodity Prices
World prices for the major commodities produced in Canada have risen strongly over the past year, while exhibiting considerable volatility over the period (Chart 2.9). Through the first nine months of 2010, commodity prices were little changed, on balance, as heightened investor risk aversion over the impact of European sovereign debt concerns on global growth and financial market performance drove down prices for crude oil, base metals and forestry products, while safe-haven concerns boosted gold prices to record levels.
have risen strongly over the past year
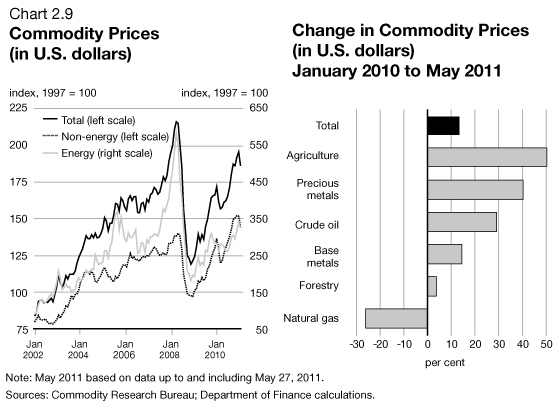
This chart from Budget 2011 has been updated to include data from March 14 to May 27, 2011.
More recently, most commodity prices have increased significantly. In particular, strong emerging market demand and recent events in oil‑producing regions have boosted crude oil prices, although they have retreated somewhat in the past several weeks. Furthermore, agricultural prices have surged in the face of rising demand and weather‑driven supply constraints. The notable exception has been natural gas prices, which have remained very weak—particularly relative to crude oil prices—reflecting announcements of much greater-than-expected recoverable reserves in the United States. Average futures contracts over the first two weeks of March suggest that financial markets expect West Texas Intermediate (WTI) crude oil prices to average US$101.90 per barrel in 2011 and Henry Hub benchmark natural gas prices to average US$4.15 per MMBtu.
Economic Developments Since Budget 2011
Labour market developments have remained positive in Canada, with employment in April 2011 more than 110,000 above its pre‑recession peak. Real GDP growth increased to 3.9 per cent in the first quarter of 2011, somewhat above expectations in Budget 2011, led by strong growth in investment and exports. Similarly, nominal GDP rose 8.7 per cent, higher than the 8.0 per cent expected in Budget 2011. However, recent indicators suggest that growth will weaken in the second quarter, in part reflecting the supply disruptions in the auto sector due to the recent earthquake and tsunami in Japan.
On the global front, the economic recovery continues at a moderate pace, broadly as expected, but at varying speeds across regions. Growth in the Euro area exceeded expectations in the first quarter of 2011, but markets remain concerned about fiscal sustainability in the peripheral European countries. In Japan, while the impact of the expected slowdown in economic activity due to the catastrophic earthquake and tsunami that struck on March 11 has been larger than anticipated, the impact is expected to be temporary, with reconstruction efforts boosting Japan’s economy in the second half of the year.
Although real GDP growth in the U.S. in the first quarter of 2011 was somewhat lower than expected in Budget 2011, the slowdown in part reflected transitory factors such as severe winter weather and a sharp rise in gasoline prices. As such, U.S. growth is expected to pick up modestly in the second quarter and to strengthen further in the second half of 2011. This suggests that U.S. real GDP growth for 2011 as a whole is likely to be weaker than previously expected.
The U.S. labour market has shown recent signs of improvement, with payroll employment increasing by an average of 179,000 per month since February. However, considerable slack remains in the U.S. labour market: employment is still about 7 million (or 5 per cent) below pre-recession levels, while the unemployment rate sits at 9.1 per cent, more than double its previous trough.
In emerging economies, while growth is expected to remain strong, inflationary pressures continue to build in some countries, particularly in Asia, as global supply shocks since the middle of last year have driven up the price of food and other commodities.
In financial markets, considerable uncertainty remains over the sustainability of sovereign debt levels in some European economies. Since Budget 2011, Portugal has joined Greece and Ireland in agreeing to accept assistance from the European Union and the IMF. Despite this, sovereign bond rates have continued to rise for these countries since March.
In the U.S., Standard & Poor’s recently revised the forecast for its U.S. sovereign debt rating to “negative” from “stable” (implying that the agency is more likely to lower its rating for the U.S. in coming years), citing rising budget deficits and debt. In addition, Standard & Poor’s also reduced Japan’s sovereign debt outlook to negative from stable in late April, mainly reflecting a deterioration in Japan’s fiscal projections following the earthquake.
Commodity markets have continued to be characterized by a high degree of volatility since Budget 2011. In particular, crude oil prices crested at a recent peak near US$114 in late April, reflecting ongoing uncertainty in oil-producing regions, before dropping to the US$100 range more recently due to increased investor uncertainty over the global outlook. As a result, crude oil prices have returned to levels close to those seen at the time of Budget 2011. Average futures contracts over the two weeks ending May 27 suggest WTI crude oil prices will average US$99.50 per barrel in 2011, little changed from average futures prices at the time of Budget 2011.
Canadian Economic Outlook—Private Sector Forecasts
The Department of Finance regularly surveys private sector economists on their views on the outlook for the Canadian economy. The economic forecast presented in this section is based on a survey conducted in early March, and includes the views of 15 private sector economists.
The average of private sector economic forecasts has been used as the basis for fiscal planning since Budget 1994. This practice introduces an element of independence into the fiscal forecast, and has been supported by international organizations such as the IMF.
The March 2011 survey of private sector economists included Bank of America Merrill Lynch, BMO Capital Markets, Caisse de dépôt et placement du Québec, CIBC World Markets, the Conference Board of Canada, Desjardins, Deutsche Bank of Canada, IHS Global Insight, Laurentian Bank Securities, National Bank Financial Group, Royal Bank of Canada, Scotiabank, TD Bank Financial Group, UBS Securities Canada, and the University of Toronto (Policy and Economic Analysis Program).
At the time of Budget 2011, real GDP growth was expected to be somewhat higher in 2011 than at the time of the October 2010 Update of Economic and Fiscal Projections. Economists expected real growth to remain solid in the first quarter of 2011, at 3.5 per cent. Real GDP growth in the first quarter was somewhat above this forecast, at 3.9 per cent. However, private sector economists continue to expect more moderate growth in Canada going forward. Economists also expect higher GDP inflation this year than expected in the October Update, reflecting the recent increases in commodity prices. Overall, they expect the level of nominal GDP to be over $20 billion higher, on average, over the forecast horizon than was expected in the Update (Table 2.1).
Economists have also revised down their outlook for the unemployment rate by 0.2 percentage points in both 2011 and 2012. Economists’ views for interest rates in the March survey are by and large unchanged from the Update.
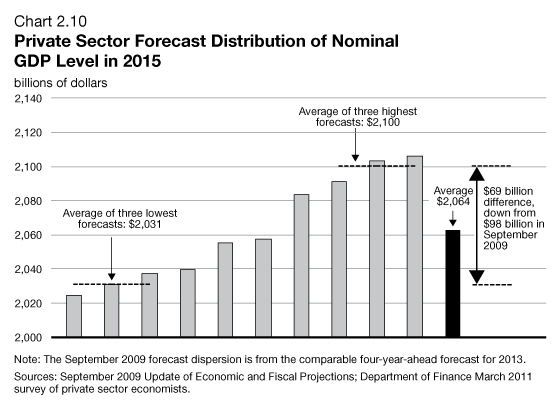
The uncertainty with respect to the medium-term outlook, as measured by the difference between the average of the three highest and three lowest forecasts for the four-year-ahead level of nominal GDP from the March survey, remained somewhat above historical standards, but had diminished significantly since the September 2009 Update, published at the onset of the recovery (Chart 2.10).
narrowed markedly since the onset of the recovery
| 20101 | 2011 | 2012 | 2013 | 2014 | 2015 | 2011–2015 | |
|---|---|---|---|---|---|---|---|
| (per cent, unless otherwise indicated) | |||||||
| Real GDP growth | |||||||
| December 2009 survey/Budget 2010 | 2.6 | 3.2 | 3.0 | 2.8 | 2.6 | 2.5 | 2.8 |
| September 2010 survey/Update 2010 | 3.0 | 2.5 | 2.8 | 2.9 | 2.6 | 2.5 | 2.7 |
| March 2011 survey/Budget 2011 | 3.2 | 2.9 | 2.8 | 2.7 | 2.5 | 2.5 | 2.7 |
| GDP inflation | |||||||
| December 2009 survey/Budget 2010 | 2.2 | 2.1 | 2.2 | 2.1 | 2.0 | 2.0 | 2.1 |
| September 2010 survey/Update 2010 | 2.8 | 2.0 | 2.3 | 2.0 | 2.0 | 1.9 | 2.0 |
| March 2011 survey/Budget 2011 | 2.9 | 2.8 | 2.1 | 2.1 | 2.0 | 2.0 | 2.2 |
| Nominal GDP growth | |||||||
| December 2009 survey/Budget 2010 | 4.9 | 5.4 | 5.3 | 4.9 | 4.7 | 4.6 | 5.0 |
| September 2010 survey/Update 2010 | 5.9 | 4.6 | 5.2 | 5.0 | 4.6 | 4.4 | 4.7 |
| March 2011 survey/Budget 2011 | 6.3 | 5.8 | 5.0 | 4.9 | 4.5 | 4.5 | 4.9 |
| Nominal GDP level (billions of dollars)2 | |||||||
| December 2009 survey/Budget 2010 | 1,605 | 1,692 | 1,781 | 1,869 | 1,957 | 2,047 | – |
| September 2010 survey | 1,620 | 1,694 | 1,782 | 1,870 | 1,956 | 2,042 | – |
| March 2011 survey | 1,625 | 1,719 | 1,804 | 1,893 | 1,979 | 2,068 | – |
| Difference (March – September) | 5 | 25 | 23 | 23 | 23 | 26 | 24 |
| 3-month treasury bill rate | |||||||
| December 2009 survey/Budget 2010 | 0.7 | 2.4 | 3.8 | 4.3 | 4.4 | 4.5 | 3.9 |
| September 2010 survey/Update 2010 | 0.6 | 1.6 | 2.7 | 3.5 | 4.0 | 4.0 | 3.2 |
| March 2011 survey/Budget 2011 | 0.6 | 1.3 | 2.5 | 3.4 | 3.9 | 4.1 | 3.1 |
| 10-year government bond rate | |||||||
| December 2009 survey/Budget 2010 | 3.7 | 4.3 | 4.9 | 5.2 | 5.3 | 5.3 | 5.0 |
| September 2010 survey/Update 2010 | 3.2 | 3.3 | 4.0 | 4.6 | 4.8 | 4.9 | 4.3 |
| March 2011 survey/Budget 2011 | 3.2 | 3.5 | 4.0 | 4.6 | 4.8 | 5.0 | 4.4 |
| Exchange rate (US cents/C$) | |||||||
| December 2009 survey/Budget 2010 | 95.5 | 98.3 | 97.7 | 99.3 | 98.5 | 97.2 | 98.2 |
| September 2010 survey/Update 2010 | 95.8 | 96.7 | 98.2 | 98.0 | 97.5 | 97.0 | 97.5 |
| March 2011 survey/Budget 2011 | 97.1 | 99.7 | 98.8 | 98.1 | 97.4 | 96.5 | 98.1 |
| Unemployment rate | |||||||
| December 2009 survey/Budget 2010 | 8.5 | 7.9 | 7.4 | 6.9 | 6.6 | 6.4 | 7.0 |
| September 2010 survey/Update 2010 | 8.0 | 7.7 | 7.4 | 7.0 | 6.8 | 6.6 | 7.1 |
| March 2011 survey/Budget 2011 | 8.0 | 7.5 | 7.2 | 7.0 | 6.7 | 6.5 | 7.0 |
| Consumer Price Index inflation | |||||||
| December 2009 survey/Budget 2010 | 1.7 | 2.2 | 2.1 | 2.1 | 2.1 | 2.1 | 2.1 |
| September 2010 survey/Update 2010 | 1.7 | 2.2 | 2.1 | 2.1 | 2.0 | 2.0 | 2.1 |
| March 2011 survey/Budget 2011 | 1.8 | 2.4 | 2.1 | 2.0 | 2.0 | 2.0 | 2.1 |
| U.S. real GDP growth | |||||||
| December 2009 survey/Budget 2010 | 2.7 | 3.0 | 3.4 | 3.1 | 2.9 | 2.7 | 3.0 |
| September 2010 survey/Update 2010 | 2.7 | 2.4 | 3.0 | 3.1 | 3.0 | 2.7 | 2.8 |
| March 2011 survey/Budget 2011 | 2.9 | 3.1 | 3.1 | 3.2 | 3.3 | 3.2 | 3.2 |
|
1 Values for 2010 in the March 2011 survey /Budget 2011 are actual. These figures from Budget 2011 have been revised to incorporate historical revisions from Statistics Canada released with the first-quarter Canadian Economic Accounts, and historical revisions from the U.S. Bureau of Economic Analysis. 2 The levels of nominal GDP in this table differ from those presented in Budget 2011, as they incorporate historical revisions from Statistics Canada released with the first-quarter Canadian Economic Accounts. Sources: Department of Finance December 2009, September 2010 and March 2011 surveys of private sector economists. | |||||||
The average private sector forecast for nominal GDP underlying the Government’s fiscal outlook is prudent. This is because it assumes a permanent loss in real output due to the recession and relatively low commodity prices.
Economists expect the level of real GDP to be approximately $100 billion lower than they anticipated in October 2007, prior to the global recession. This implies that the weak and negative economic growth experienced in 2008 and 2009 in Canada is not expected to be offset by stronger growth over the medium term, as is sometimes the case following a recession.
Further, the March 2011 private sector forecast for GDP inflation is consistent with commodity prices that are broadly in line with current levels and forecasts suggested by futures prices. If commodity prices evolve as expected by futures markets, or stay near current levels, GDP inflation—and hence nominal GDP—would be largely as anticipated in the March survey. However, with futures prices for 2011 and 2012 modestly higher than those consistent with the March 2011 survey, nominal GDP could be somewhat higher than expected over the near term.
The Government’s fiscal projection is therefore based on a prudent projection for nominal GDP—the broadest single measure of the tax base.
| 2009 | 2010 | 2011 | 2012 | 2013 | 2014 | 2015 | |
|---|---|---|---|---|---|---|---|
| (billions of chained 2002 dollars) | |||||||
| March 2011 private sector survey | 1,284 | 1,325 | 1,363 | 1,402 | 1,440 | 1,476 | 1,513 |
| October 2007 private sector survey1 | 1,383 | 1,423 | 1,463 | 1,502 | 1,540 | 1,579 | 1,619 |
| Difference | -99 | -98 | -99 | -100 | -100 | -103 | -106 |
| Note: The levels of real GDP in this table differ from those presented in Budget 2011, as they incorporate historical revisions from Statistics Canada released with the first-quarter Canadian Economic Accounts. 1 The October 2007 private sector survey covered the 2007–2013 period. Growth in 2014 and 2015 was assumed to be at the 2013 rate. | |||||||
| Current Price1 | 2011 | 2012 | 2013 | 2014 | 2015 | |
|---|---|---|---|---|---|---|
| Prices consistent with the March 2011 survey | ||||||
| Commodity price index (1997 = 100) | 186 | 184 | 185 | 189 | 188 | 188 |
| Crude oil (WTI, US$/barrel) | 99.1 | 94.3 | 94.9 | 98.6 | 97.9 | 97.6 |
| Natural gas (Henry Hub, US$/MMBtu) | 4.2 | 4.2 | 4.2 | 4.4 | 4.4 | 4.4 |
| Recent futures prices1 | ||||||
| Crude oil (WTI, US$/barrel) | 99.5 | 100.7 | 99.1 | 97.9 | 97.4 | |
| Natural gas (Henry Hub, US$/MMBtu) | 4.4 | 4.9 | 5.3 | 5.6 | 6.0 | |
| 1 These figures from Budget 2011 have been revised to incorporate average data for May 16 to May 27, 2011. The table presented in Budget 2011 showed average data for February 28 to March 11, 2011. | ||||||
Risk Assessment
On March 11, 2011, the Minister of Finance met with private sector economists to discuss the economic forecast from the March 2011 survey as well as the risks associated with those projections. At that time, private sector economists agreed that the average forecast from the March 2011 survey was a reasonable basis for fiscal planning. The fiscal outlook is presented in Chapter 5.
The economists were of the view that risks to the economic outlook were broadly balanced, with both upside and downside risks to the outlook primarily originating outside Canada’s borders. On the upside, they highlighted the prospects of stronger global growth, particularly in the United States. They also mentioned the net benefits to the Canadian economy, particularly for nominal GDP, that would arise from higher-than-assumed commodity prices.
However, the private sector economists also expressed concern about downside risks to the economic outlook. In particular, they highlighted sovereign debt issues in Europe as well as higher and volatile oil prices—and their implications for global growth and inflation—as key risks to the outlook. Moreover, the catastrophic earthquake and tsunami that struck Japan on March 11 were thought then to possibly weigh on the global recovery.
Economists also identified the rise in Canadian household debt relative to income, encouraged by the historical low levels of interest rates, as an additional source of risk to the Canadian outlook, as high debt levels have made the household sector more vulnerable to higher interest rates or economic downturns.
Update to the Economic Outlook
and Risk Assessment
On May 31, the Minister of Finance met again with private sector economists to discuss economic developments since Budget 2011 and the implications for the outlook, as well as the current risks to the outlook.
At that time, private sector economists indicated that while prospects for Canada in the second quarter of 2011 had deteriorated since Budget 2011, this is offset by stronger-than-expected growth in the first quarter, particularly for nominal GDP. As a result, the economists agreed that the average forecast from the March survey remained a reasonable basis for fiscal planning.
Economists continue to see the risks to the Canadian outlook as balanced. However, the focus has shifted somewhat since Budget 2011 toward sovereign debt concerns in Europe, and away from oil price volatility and economic uncertainty associated with the Japanese earthquake and tsunami. Economists also expressed concern that the growth dynamics in the U.S. could be less strong than previously anticipated, reflecting weaker-than-expected growth in the first quarter of 2011 and ongoing uncertainty over the fiscal situation in that country.
Planning Assumptions
The Government has adjusted downward the private sector forecast for nominal GDP for budget planning purposes by $10 billion in each year of the forecast (Table 2.3). This adjustment for risk, representing a downward adjustment of $1.5 billion in fiscal revenues in each year of the forecast, reflects the remaining uncertainties surrounding the global economic outlook.
The Government will continue to evaluate economic developments and risks to determine whether or not it would be appropriate to maintain this downward adjustment for risk in the future.
| 2011 | 2012 | 2013 | 2014 | 2015 | |
|---|---|---|---|---|---|
| (billions of dollars) | |||||
| March 2011 private sector survey | 1,719 | 1,804 | 1,893 | 1,979 | 2,068 |
| Budget 2011 fiscal planning assumption | 1,709 | 1,794 | 1,883 | 1,969 | 2,058 |
| Adjustment for risk | -10 | -10 | -10 | -10 | -10 |
| Addendum Adjustment for risk in October 2010 Update |
-10 | -10 | -7.5 | -5 | -5 |
| This table from Budget 2011 has been updated to reflect historical revisions from Statistics Canada released with the first-quarter Canadian Economic Accounts, which resulted in an upward level adjustment of $3.1 billion for 2010 to nominal GDP relative to estimates available at the time of Budget 2011. Of note, this revision to the historical level of nominal GDP has no material implications for the fiscal forecast, as it does not affect the growth rate of government revenue going forward. | |||||
1 End of recession as determined by the National Bureau of Economic Research.
2 Conceptual differences boost the Canadian unemployment rate relative to the U.S. rate. In particular, Statistics Canada considers as unemployed those passively looking for work (e.g. reading want ads) as well as those who will begin work in the near future, while the U.S. Bureau of Labor Statistics does not include either group in its unemployment calculations. In addition, the Canadian methodology includes 15-year-olds (who have a higher-than-average unemployment rate), while the U.S. does not.