
Archived - Chapter 2
Supporting Canadians through the Pandemic
2.1 A Plan for the Coming Months
Since this crisis began, the government has invested $407 billion – nearly 19 per cent of Canada’s GDP – to support our public health care systems, provide direct income benefits to Canadians, and bridge businesses through the crisis and deep into 2021, creating certainty for people and businesses when it’s needed most.
The government is delivering scalable and targeted support to keep Canadians healthy, safe and solvent. To date, the government has committed:
- Over $270 billion in direct support to Canadians and businesses;
- Up to $85 billion in tax and customs duty payment deferrals to meet liquidity needs of businesses and households; and
- Over $52 billion in support for coordinated federal, provincial and territorial action to strengthen critical health care systems, purchase personal protective equipment and supplies, and support critical medical research and vaccine developments;
- The federal government has provided more than 8 out of every ten dollars invested by governments in Canada to fight COVID-19 and support Canadians.
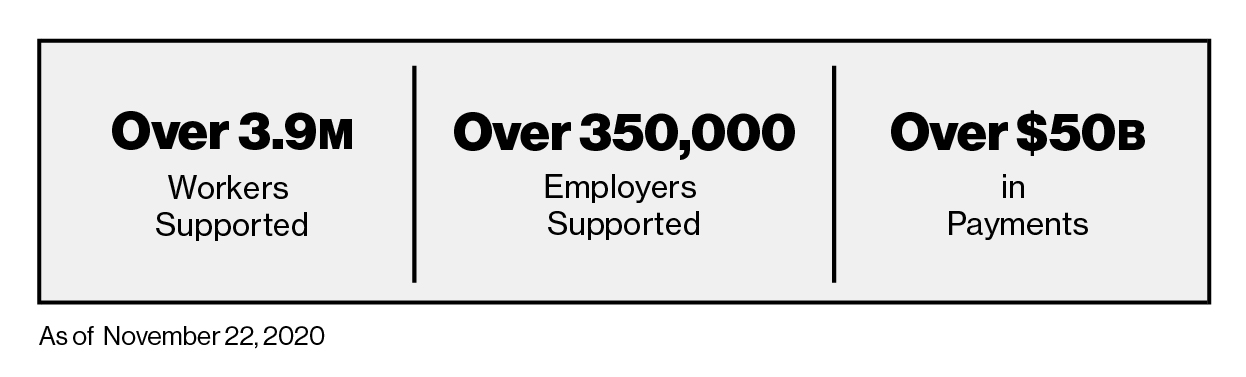
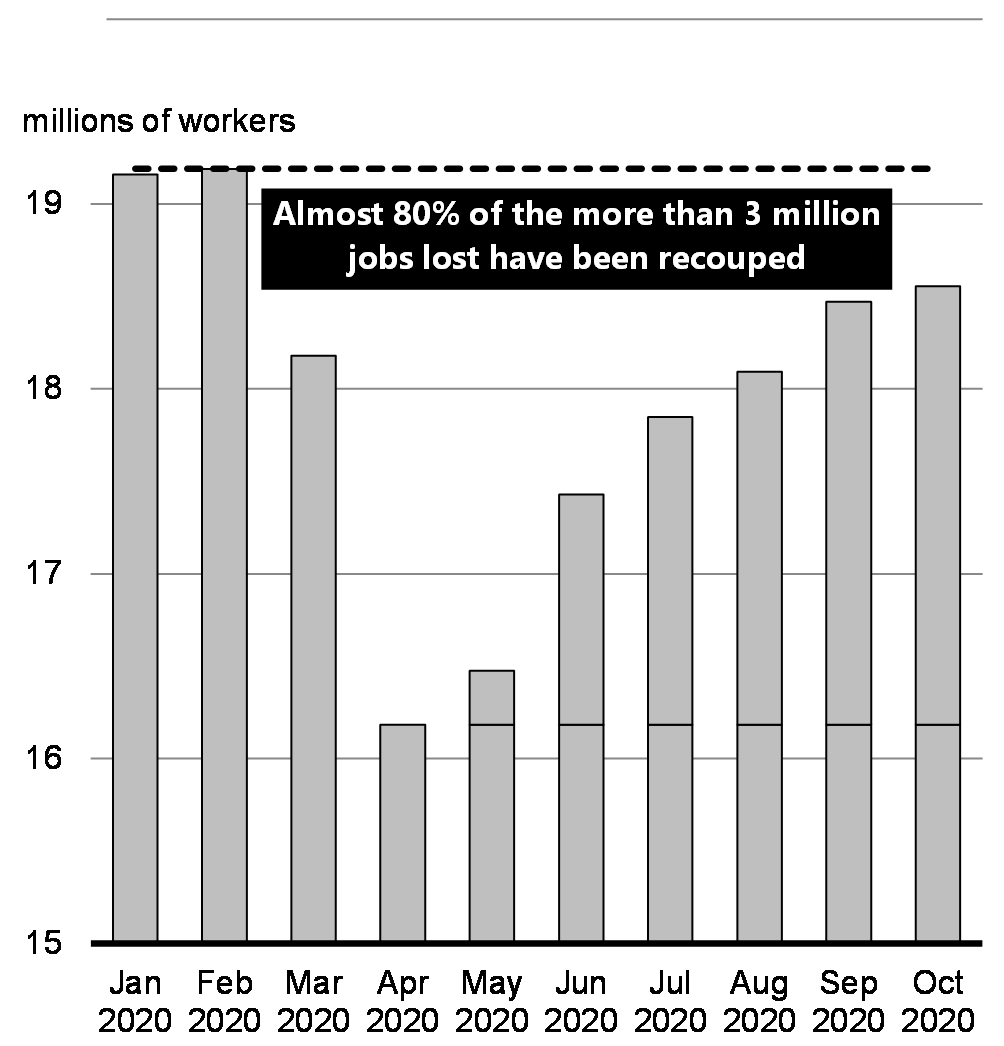
Programs like the Canada Emergency Wage Subsidy have helped protect over 3.9 million jobs, while the Canada Emergency Business Account has helped over 790,000 small businesses and not-for-profits keep their doors open. As of October, almost 80 per cent of the more than 3 million jobs lost at the outset of the pandemic have been recouped.
The extraordinary measures taken by the Government of Canada have stabilized the economy, helped Canadians and Canadian businesses stay strong through this crisis and prevented economic scarring. The government’s plan will continue to do this through the second wave.
Across Canada, COVID-19 cases continue to rise. As the crisis has evolved, so too have the government’s support measures. Canadians and Canadian businesses can rest assured that for as long as the pandemic lasts, the federal government will provide the support they need. These federal support measures will allow communities to make the difficult decisions to protect peoples’ health, without being forced to bear the full economic costs of shutdowns.
The government is also committed to helping more women get back into the workforce and ensuring that Canada’s plan continues to respond to the impacts of COVID-19 on diverse groups of Canadians.
The federal government knows that the best economic policy is a strong public health policy.
2.1.1 The Canada Emergency Wage Subsidy
The Government of Canada is committed to doing whatever it takes to protect Canadians’ jobs. The Canada Emergency Wage Subsidy has been central to the government’s response, helping protect over 3.9 million jobs. The wage subsidy supports workers to stay connected to their jobs and helps businesses remain open or re-open, which will help employees, employers and the whole country recover from this crisis faster.
Canada Emergency Wage Subsidy Take-up
The government has extended the Canada Emergency Wage Subsidy until June 2021, as committed to in the Speech from the Throne. As Canadians and Canadian businesses face the resurgence of the virus, this extension will give workers and employers certainty and stability over the coming months.
In October, the government announced enhancements to the program, such as allowing the subsidy rates to remain at their current level so that the maximum subsidy rate of 65 per cent of eligible wages would remain until December 19, 2020. In addition, the wage subsidy is now more flexible and responsive, allowing employers to access the maximum subsidy rate based on a single month’s revenue decline instead of having to demonstrate three months’ decline, giving employers support that better reflects their current or evolving needs.
Recognizing that we will face a difficult winter with the second wave, and that public health restrictions pose ongoing challenges to employers, the government wants to make sure businesses and workers have the support they need in the coming months.
- Given the ferocity of the second wave and its expected economic impact, the government is proposing to increase the maximum subsidy rate to 75 per cent for the period beginning December 20, 2020 and to extend this rate until March 13, 2021, to provide greater certainty to employers.
The government will continue to monitor health and economic conditions to determine details for subsequent periods.
Thea and Hugo run a commercial laundry service. Their client hotels and inns were shut down temporarily in the spring, but Thea and Hugo managed to keep other clients.
Now facing a resurgence of the virus in their community, revenues in November are down 70 per cent from their levels last year and they anticipate revenues in December and January will be down by the same amount. Because of this, they are considering reducing staff. They are working to maintain 10 full-time employees, each being paid $600 per week for a total weekly payroll of $6,000.
As a result of recent enhancements to the Canada Emergency Wage Subsidy in October, Thea and Hugo’s business will qualify for the maximum subsidy rate of 65 per cent until December 19, 2020. This will provide them a total wage subsidy of $15,600 for October 25 to November 21, and again for November 22 to December 19, helping keep all their employees.
As a result of the increased maximum subsidy rate announced today, as their business continues to struggle over the coming months, it will qualify for the subsidy rate of 75 per cent in the following period, resulting in a total wage subsidy of $18,000 for the next period, an increase of $2,400.
2.1.2 Enhancements to Employment Insurance
While many Canadians have returned to work since the spring, the uneven and evolving public health environment means that many continue to face challenges in finding and keeping work. To ensure Canadians have the support they need, the government announced temporary changes for one year that have made the Employment Insurance (EI) program more simple, flexible and generous. This will not only provide people with the income support to afford the basics, it will also get people ready to re-enter the labour market by giving them access to EI-funded training and employment support.
- Canadians with 120 hours of insurable work or more can now qualify for regular and special benefits, wherever they live in Canada.
- Canadians receiving EI are now eligible for a benefit rate of at least $500 per week, or $300 per week for extended parental benefits.
- Canadians claiming EI benefits for a job loss are now eligible for at least 26 weeks of benefits.
- For self-employed fish harvesters who rely on EI in the off-season, EI fishing benefits are calculated using either their earnings for the current claim or their earnings from their fishing claim for the same season from either of the previous two years, whichever is highest.
- The usual one-week waiting period and the requirement to provide a medical certificate are waived for EI sickness benefit claimants.
Gender Results Framework
Gender Equality and Diversity in Canada
-

Economic Participation and Prosperity
Compared to fathers, mothers are more likely to work part-time or fewer hours, which may affect their ability to qualify for Employment Insurance (EI). In 2019, a mother with a youngest child aged 0-5 years had a labour force participation rate of 75 per cent, compared to 95 per cent for fathers with a child in the same group. Even when mothers did work, they were 17 per cent less likely to work full-time, and when they did work full-time, they worked, on average, 4 hours less per week. A more flexible EI system is designed to address the extraordinary impacts of the pandemic on workforce participation.
EI benefits will now be available to more vulnerable Canadians, including many women who would not have had enough insurable hours of work to qualify in the past, supporting an additional 400,000 people through the program.
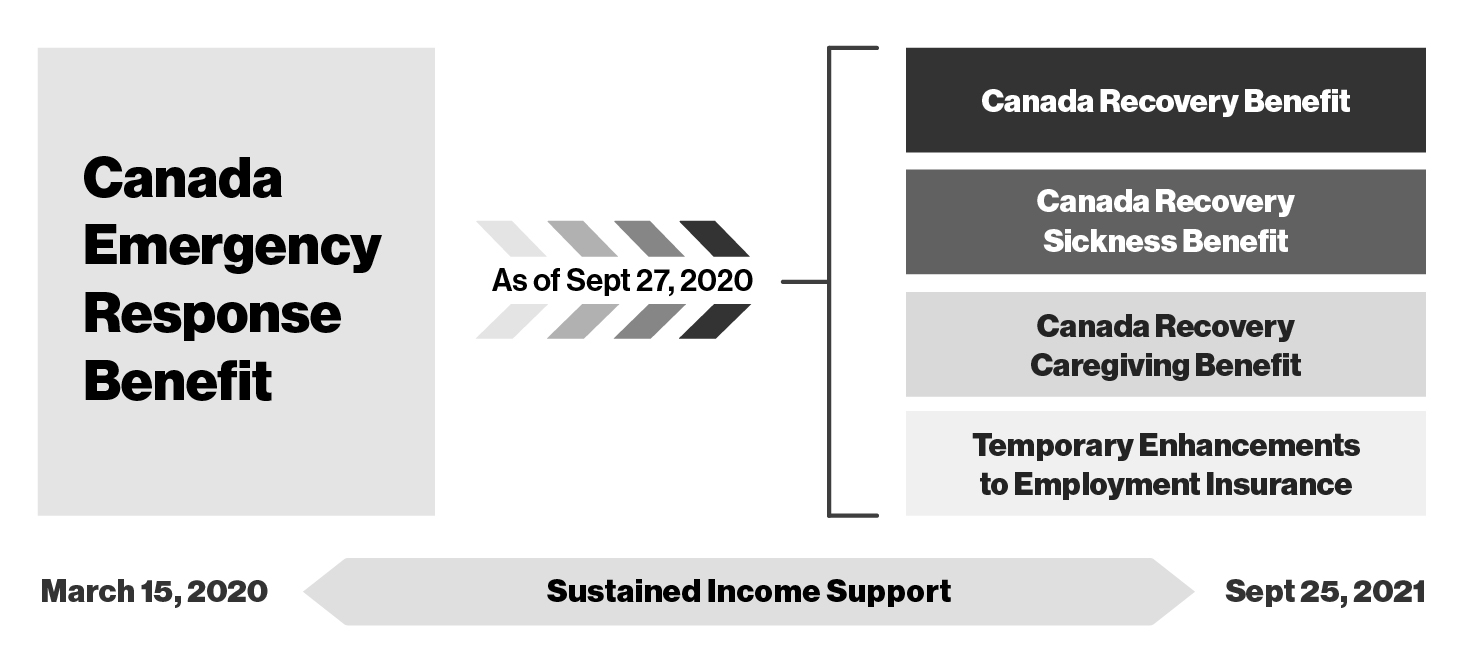
2.1.3 Canada Recovery Benefits
The Canada Emergency Response Benefit provided emergency income support to millions of Canadians. Since the end of the program, 2 million claimants have applied to the simplified Employment Insurance system but many Canadians were still not eligible for EI. The government launched three new income support benefits for these workers—those who continued to be unable to work for reasons related to COVID-19, such as providing care to a relative. The Canada Recovery Benefits are available to self-employed Canadians and gig workers, as well as workers who have not lost their job but have seen significant income loss due to COVID-19. To date, 1.5 million Canadians have applied to receive one of these benefits. The benefits are available until September 25, 2021.
Gender Results Framework
Gender Equality and Diversity in Canada
- Economic Participation and Prosperity
COVID-19 has put a spotlight on the value of unpaid care work for society and the economy – the majority of which is done by women. In particular, in 2015, women aged 25-54 years spent 90 minutes more per day on unpaid domestic and care work than men. Additionally, Oxfam reports that according to a national poll conducted by Leger of 1,523 Canadians between June 5 and June 7, 2020, 71 per cent of women surveyed reported feeling more anxious, depressed, isolated, overworked, or ill because of shouldering even more unpaid care work as a result of the COVID-19 crisis. Indigenous and Black Canadians reported greater difficulties due to increased unpaid care work caused by COVID-19 than their white peers, and Indigenous respondents were three times as likely as white respondents to say that increased unpaid care responsibilities had affected their economic opportunities and that they have had to give up looking for paid work.
- A Canada Recovery Benefit of $500 per week for up to 26 weeks is supporting Canadians who have not returned to work due to COVID-19 or whose income has dropped by at least 50 per cent. These workers must be available and looking for work, and must accept work where it is reasonable to do so. In addition to providing income support to help cover basic expenses, it will also help people stay connected to the job market by allowing them to earn some level of income while receiving the benefit.
- A Canada Recovery Sickness Benefit of $500 per week for up to two weeks is available for workers who are unable to work for at least 50 per cent of the week because they are sick or must self-isolate for reasons related to COVID-19—including those with underlying conditions, who are undergoing treatments or who have contracted other sicknesses that make them more susceptible to COVID-19.
- A Canada Recovery Caregiving Benefit of $500 per week for up to 26 weeks per household is available for workers unable to work for at least 50 per cent of the week because they must care for a child under the age of 12 or a family member who requires supervised care because schools, child care centres or care facilities are closed due to COVID-19, or because the child or family member is sick and/or required to quarantine or is at high risk of serious health implications because of COVID-19. This will particularly benefit women who tend to shoulder the majority of caregiving responsibilities in Canada.
Transitioning Income Support from the CERB to Recovery Benefits and Enhanced Employment Insurance
Amirah lives outside of Montréal and worked part time as a tour guide from June to September after the initial lockdown. Amirah had been able to accumulate only 400 hours of insurable employment when restriction measures were imposed again. Under normal EI rules this would not have qualified her for EI regular benefits. However, thanks to the temporary changes to EI, she has more than the minimum 120 hours of work required and can qualify for at least 26 weeks of EI regular benefits at a minimum amount of $500 per week. This will give her the time and flexibility to find a new job.
Her husband, Ben, is a self-employed graphic designer. He earned $34,000 in 2019, but his business has slowed due to COVID-19 and he claimed the CERB over the spring and summer. Although he has started working again this fall, his weekly income is still more than 50 per cent below what he would have normally earned before the pandemic. With the new Canada Recovery Benefit, Ben is eligible for $500 per week in income support for up to 26 weeks.
2.1.4 The Canada Emergency Rent Subsidy
Business owners have worked hard to adapt to the pandemic—finding ways to offer services online, providing delivery options, reducing store hours, updating factories to make them safer for workers, or investing in PPE. Even so, for many, revenues are still down, while costs like rent and mortgages stay the same. The recently launched Canada Emergency Rent Subsidy provides direct and easy-to-access rent and mortgage support from September 27, 2020 until June 2021 for qualifying organizations affected by COVID-19.
This program lets business owners apply directly, without going through landlords. The rent subsidy is provided to eligible tenants and property owners, supporting businesses, charities, and non-profits that have suffered a revenue drop, by subsidizing eligible expenses. The current rate provides a subsidy, on a sliding scale, up to a maximum of 65 per cent until December 19, 2020.
- To provide greater certainty to businesses and other organizations, the government is proposing to extend the current subsidy rates of the Canada Emergency Rent Subsidy for an additional three periods. This means a base subsidy rate of up to 65 per cent will be available on eligible expenses until March 13, 2021. This would ensure that businesses and other organizations continue to have the support they need through the second wave of the pandemic and the winter.
Since launching on November 23, applicants have been able to use the rent subsidy towards rent payable. The government will soon introduce legislation to formalize this as an eligible expense.
Graham operates a local chain of three gyms on rented property. Revenues were down 70 per cent in October. His total rent for all three locations was $30,000 from September 27 to October 24. This means that he would be eligible for the maximum rent subsidy of 65 per cent. Graham would receive $19,500 to help cover rent.
2.1.5 Lockdown Support
Under the new Lockdown Support program, organizations that are subject to a lockdown and must shut their doors or significantly restrict their activities under a public health order are eligible for an additional 25 per cent top-up, in addition to the Canada Emergency Rent Subsidy base subsidy of up to 65 per cent, until December 19, 2020.
This means hard-hit businesses can receive up to 90 per cent support for rent.
- The government is proposing to extend the rate of 25 per cent for the Lockdown Support for an additional three periods, until March 13, 2021.
Pascale owns a restaurant. Her restaurant was forced to close the dining room on October 1st due to public health restrictions. Pascale is working on developing a take-out service but her revenues are down 80 per cent. Pascale continues to incur mortgage interest, property tax, and property insurance on her property. Between September 27 and October 24, those costs amounted to $20,000. Pascale would be eligible for a 65 per cent rent subsidy, plus Lockdown Support of 25 per cent for the 24 days the restaurant was closed under public health restrictions. Pascale would receive $17,286 to cover her mortgage interest, property tax, and property insurance.
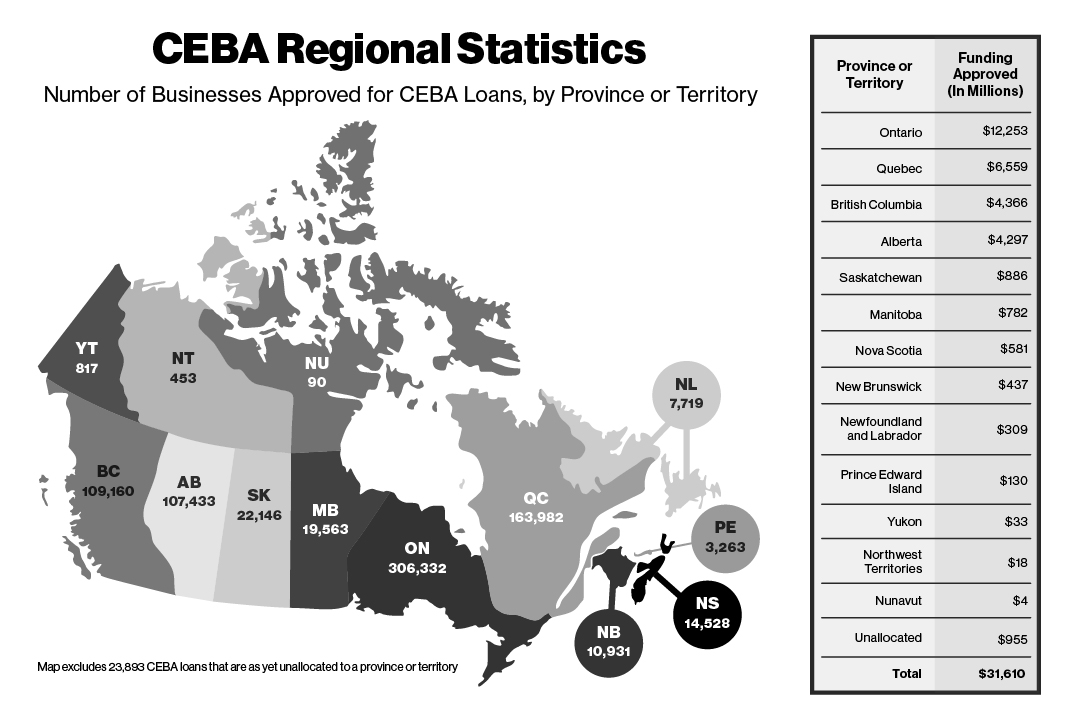
2.1.6 The Canada Emergency Business Account
To date, the Canada Emergency Business Account (CEBA) has provided over 790,000 small businesses and non-profits with interest-free loans, partially forgivable if paid back by December 31, 2022.
Gender Results Framework
Gender Equality and Diversity in Canada
-

Leadership and Democratic Participation
As of September/October 2020, half (54 per cent) of businesses in Canada had applied for and received the CEBA. Businesses that were majority-owned by Indigenous persons (56 per cent), immigrants (61 per cent), members of LGBTQ2 communities (57 per cent) and visible minorities (61 per cent) were more likely to report applying for and receiving the CEBA than those that were majority-owned by women (50 per cent) and persons with a disability (49 per cent).
Initially providing loans of up to $40,000, with up to $10,000 forgivable, the CEBA program will soon be expanded, allowing qualifying businesses to access an additional interest-free $20,000 loan, in situations where there is need. Half of this additional amount, up to $10,000, would be forgivable if the loan is repaid by December 31, 2022.
The government recently extended the availability of the CEBA program to small businesses that have not been operating from a commercial banking account. These small businesses are now able to apply for the CEBA, provided that they have successfully opened a new commercial account and fully meet the eligibility requirements of the program.
Loans are provided through financial institutions, such as banks and credit unions, in cooperation with Export Development Canada. The deadline to apply for a CEBA loan has been extended to March 31, 2021.
These enhancements demonstrate the government’s commitment to stand by small businesses to ensure they can continue to support families and communities across the country.
Suzie runs a coffee shop. She has two full-time and two part-time employees. Under COVID-19 restrictions, she has had to scale down indoor dining services and shift to take-out options only. Due to the drop in customers and sales, Suzie has lost about half of her revenue.
This summer, with the large decline in revenue but ongoing costs for wages, rent and other expenses, Suzie was worried about the future of her business and whether to lay off her staff. She contacted her bank for options and was able to access an interest-free, partially forgivable loan of $40,000 under the Canada Emergency Business Account (CEBA). In combination with other financial supports, this helped to cover a portion of employee salaries, allowing Suzie to keep her employees and even bring back the part-time staff. She was also able to use the loan towards insurance, utilities, and other bills. If she pays back the loan before December 31, 2022, $10,000 will be forgiven.
With the ongoing pandemic and the potential for further restrictions, Suzie may continue to face slow business and serious cash flow issues. This hardship would qualify her to access a further $20,000 in CEBA loans, $10,000 of which would be forgivable if also paid back by December 31, 2022, helping to keep her shop open.
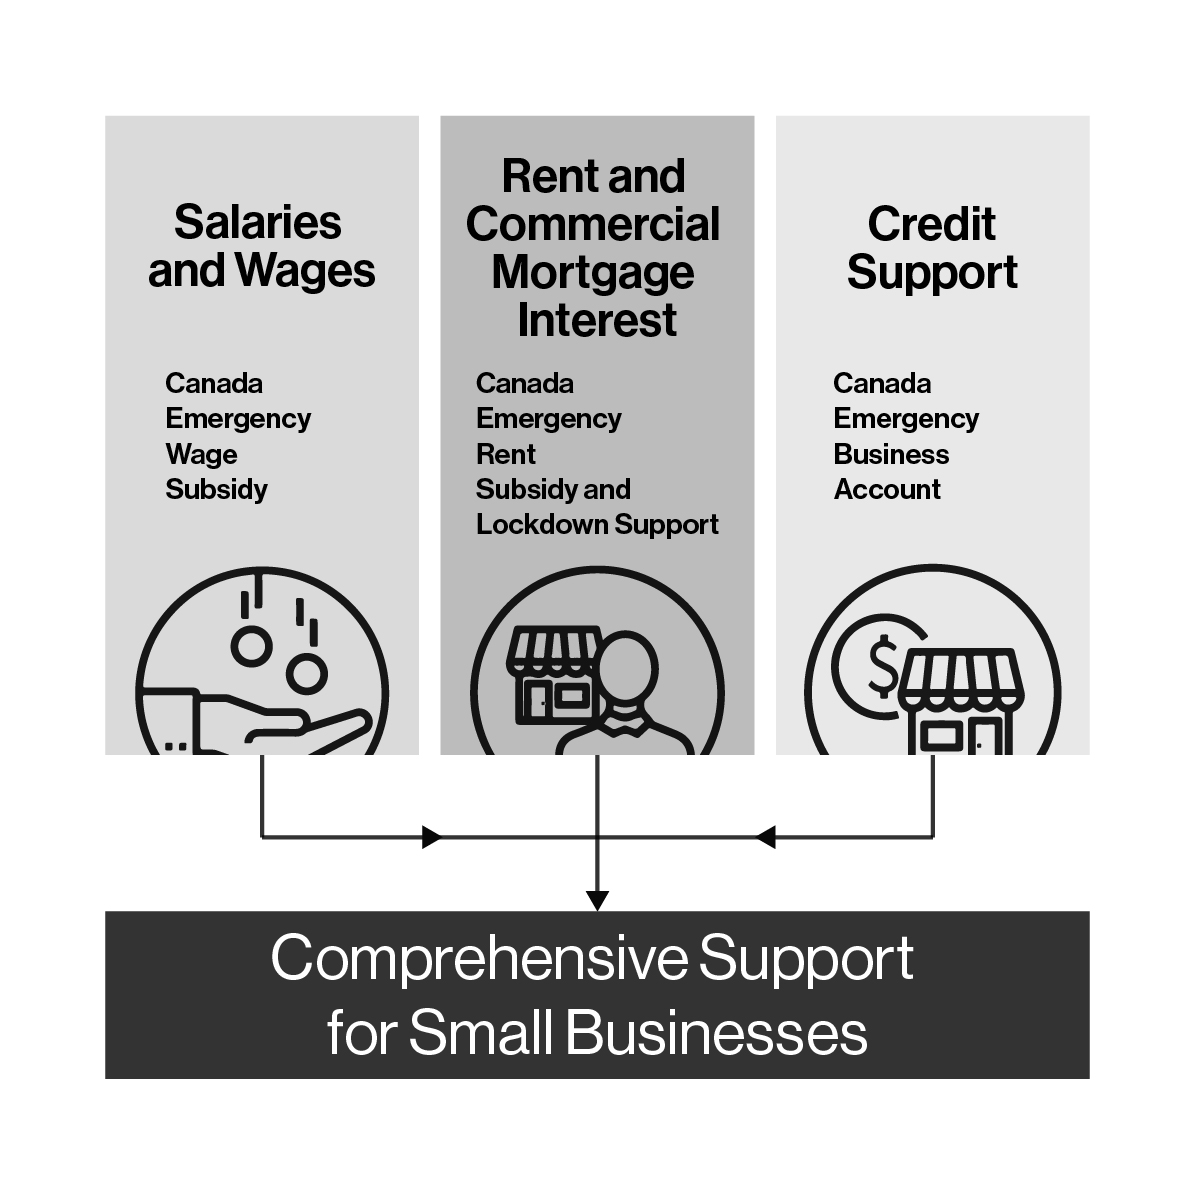
Key Business Supports Available to Small Businesses
2.1.7 Support for Highly Affected Sectors
As outlined in the Speech from the Throne, some businesses, particularly those in highly-affected sectors like tourism and hospitality, have struggled to access sufficient financing. To help address this challenge and bridge these businesses through the crisis, the government proposes to work with financial institutions in the near term to offer loans on more generous terms to the hardest hit businesses, to help ensure they remain viable and in place to drive future economic growth:
- The government will work with financial institutions in the near term to create the Highly Affected Sectors Credit Availability Program (HASCAP) – a new program for the hardest hit businesses, including those in sectors, like tourism and hospitality, hotels, arts and entertainment. This stream will offer 100 percent government-guaranteed financing for heavily impacted businesses, and provide low-interest loans of up to $1 million over extended terms, up to ten years. Rates will be lower than those offered in BCAP and beneath typical market rates for hard hit sectors.
The government will provide details on the Highly Affected Sectors Credit Availability Program soon.
2.1.8 Regional Relief and Recovery Fund
Businesses, workers and communities in every corner of Canada have been impacted by COVID-19. To help support those businesses unable to access other federal pandemic support programs, the government announced the $962-million Regional Relief and Recovery Fund on April 17, providing significant funding through Canada’s Regional Development Agencies. The government increased funding on October 2, bringing total support to more than $1.5 billion.
- $568 million for Western Economic Development
- $34 million for the Canadian Northern Economic Development Agency
- $72 million for the Federal Economic Development Initiative for Northern Ontario
- $436 million for the Federal Economic Development Agency for Southern Ontario
- $281 million for Canada Economic Development for Quebec Regions
- $170 million for the Atlantic Canada Opportunities Agency
To date, this program has protected over 102,000 jobs and supported over 14,700 businesses, including over 8,500 clients in rural areas and 5,100 women-owned businesses.
- To better ensure the Regional Relief and Recovery Fund can continue to support small businesses unable to access other federal pandemic support programs, including replicating newly announced Canada Emergency Business Account loan limit increases, the government is proposing a top-up of up to $500 million, on a cash basis, to Regional Development Agencies and the Community Futures Network of Canada, bringing total funding to over $2.0 billion in this fund.
- The government is also proposing to provide up to $3 million to the Canadian Northern Economic Development Agency for foundational economic development projects that will support small businesses in Canada’s Territories.
- To better tailor support to businesses in Western Canada, in recognition of its diverse regional economies, the government proposes to introduce a new approach to regional development in the West by creating separate regional development agencies for British Columbia and the Prairies, adding a new, seventh Regional Development Agency in British Columbia. Additional details and investments will follow.
2.1.9 Support for Tourism and Hospitality
Communities across Canada have been hit hard by the decline in tourism. Approximately 750,000 workers and 2 per cent of Canada’s GDP are attributed to tourism. Small and medium sized firms dominate the tourism sector and it employs a higher proportion of youth, women and Indigenous people compared to their share of the workforce. Domestic and international tourism is also a key economic generator and an important source of jobs in many rural and northern regions of the country.
Pandemic restrictions have taken a toll on Canada’s tourism industry—on jobs, businesses and communities—and it is expected that the uncertainty will persist into 2021. The recently launched Canada Emergency Rent Subsidy and Lockdown Support, enhanced Canada Emergency Business Account, and Canada Emergency Wage Subsidy at the proposed new maximum subsidy rate of 75 per cent, along with the new Highly Affected Sectors Credit Availability Program, will continue to provide a robust backstop for the sector in the months ahead. These programs have been designed with diverse, hard hit sectors like tourism and hospitality in mind. To date, approximately $9.7 billion is estimated to have flowed to businesses in these sectors through the Canada Emergency Wage Subsidy, Canada Emergency Business Account and the Canada Emergency Commercial Rent Assistance.
The Regional Relief and Recovery Fund has provided $202 million in support to 2,830 tourism-related businesses.
- Recognizing the importance of the Regional Relief and Recovery Fund in supporting local tourism businesses, the government will earmark a minimum of 25 per cent of all the Fund’s resources to support local tourism businesses, providing more than $500 million in program support through June 2021.
The government will continue to work with partners and stakeholders to identify the best ways to support the longer term rebound and recovery of this important sector.
2.1.10 Support for Workers in the Live Events and Arts Sectors
Cultural and recreation industries, which employ hundreds of thousands of Canadians, have been particularly hard hit by the pandemic, being among the first to shut down and likely among the last to return to regular activities. The COVID-19 pandemic has resulted in the near complete suspension of live events and arts presentations, affecting thousands of self-employed and freelance artists and event workers across the country. The pandemic has also has resulted in the drastic reduction of advertising revenues for Canadian broadcasting companies, including local television and radio stations on whom many Canadians rely for their news and entertainment.
- To support the planning and presentation of COVID-19-safe events and the arts — including both live and digital — and to provide work opportunities in these sectors, the government will provide $181.5 million in 2021-22 to the Department of Canadian Heritage and the Canada Council for the Arts to expand their funding programs. This includes a one-year renewal of funding provided in Budget 2019 for the Building Communities through Arts and Heritage program, the Canada Arts Presentation Fund and the Canada Music Fund.
- The government will also provide additional COVID-19 relief to local television and radio stations by supporting the waiving of broadcasting Part II licence fees in 2020-21, which are collected annually by the Canadian Radio-television and Telecommunications Commission. Waiving these fees will provide up to $50 million in relief to these companies, helping them to stay afloat and maintain their broadcasting offerings to Canadians.
The government understands that certain major live events and festivals will require unique support. The government will work with industry to prevent the closure of unique and irreplaceable flagship events and festivals across Canada, and to ensure the survival of key, globally-recognized assets in this sector.
To address the impact of COVID-19 on film and television productions across the country, the government announced a $50 million Short-Term Compensation Fund in September 2020. This initiative is compensating for the lack of insurance coverage for COVID-19–related filming interruptions and production shutdowns, allowing the industry to continue with its operations.
2.1.11 Support for the Air Sector
Canada is a vast country, and we rely more on air travel than others. Carriers have cut routes during the pandemic, leaving Canadians in certain communities with limited mobility and limited access to essential goods and services. Since the beginning of the pandemic, the government has announced $192 million to support essential air services to remote and northern communities. The funding is helping to ensure these communities have continued access to food, medical supplies, and other essential goods and services.
Canada’s air travel system directly employs over 100,000 Canadians. However, COVID-19 and related health restrictions have caused Canada’s air sector to suffer a near collapse in passenger travel. This is threatening the viability of our airlines and airports, and most importantly, the people who work there and the communities that rely on them. Since the beginning of the pandemic, air sector workers have received over $1.4 billion in support through the Canada Emergency Wage Subsidy.
The government is committed to ensuring that Canada’s air sector continues to connect Canadians and Canadian marketplaces, as part of a dynamic aerospace industry. However, since the beginning of the pandemic, we have heard from many Canadians who had booked travel and ended up stuck with vouchers for trips they could not take instead of getting refunds. The government is establishing a process with major airlines regarding financial assistance. As part of this process, the government will ensure Canadians are refunded for cancelled flights.
- To support regional air transportation, including regional air carriers, the government proposes to provide up to $206 million over two years, starting in 2020-21, to the Regional Development Agencies for a new Regional Air Transportation Initiative.
- To support small and regional airports in making critical investments in health and safety infrastructure, the government proposes to provide additional funding of $186 million over two years, starting in 2021-22, for the Airports Capital Assistance Program (ACAP). Small federally-owned airports, which are not currently eligible for ACAP, would also be eligible to access the program for 2021-22 and 2022-23.
- To support large airports in making critical investments in safety, security and transit infrastructure, the government proposes to provide $500 million over six years, starting in 2020-21, to establish a new transfer payment program. Transit projects at large airports, such as the new Réseau express métropolitain station at the Montreal Airport, will be eligible for funding. The government will consider supporting further airport investments to help address the health, safety and economic impacts of COVID-19.
- To continue supporting the operations of Canada's major airports, the government proposes to extend $229 million in additional rent relief to the 21 airport authorities that pay rent to the federal government, with comparable treatment for Ports Toronto, which operates Billy Bishop Toronto City Airport. This support to airports would be made up of repayable and non-repayable rent relief, with non-repayable support costing $29 million over 4 years, starting 2020-21. Rent relief would be provided as follows:
- Waiving rent payments for small airports (i.e., those with passenger volumes of less than one million passengers in 2019) for 2021, 2022 and 2023;
- Waiving rent payments for medium airports (i.e., those with passenger volumes between one million and ten million in 2019) for 2021; and,
- Deferring rent payments for the largest airports for 2021, with repayment to occur over ten years, starting in 2024.
- To further assist airports to manage the financial implications of reduced air travel, the government proposes to provide $65 million in additional financial support to airport authorities in 2021-22.
2.1.12 Support for Innovative Businesses
- To ensure that innovative, intellectual property-rich firms have the support they need to face the challenges presented by COVID-19, it is proposed that $250 million over 5 years, beginning in 2021-22, be provided to the Strategic Innovation Fund. Through its continued support of large-scale transformative projects, the Strategic Innovation Fund will help Canada’s most innovative firms and industries weather the pandemic and grow into world leaders that will help drive growth and create jobs in the Canadian economy.
2.1.13 Large Employer Emergency Financing Facility
In May 2020, the government launched the Large Employer Emergency Financing Facility (LEEFF) to make bridge credit financing available to large Canadian businesses whose needs during the pandemic are not being met through conventional financing. The objective of this support is to help protect Canadian jobs, help Canadian businesses weather the current economic challenges, and avoid bankruptcies of otherwise viable firms where possible.
The government is exploring options to enhance the LEEFF program, to respond to the specific liquidity needs of a greater number of large Canadian businesses.
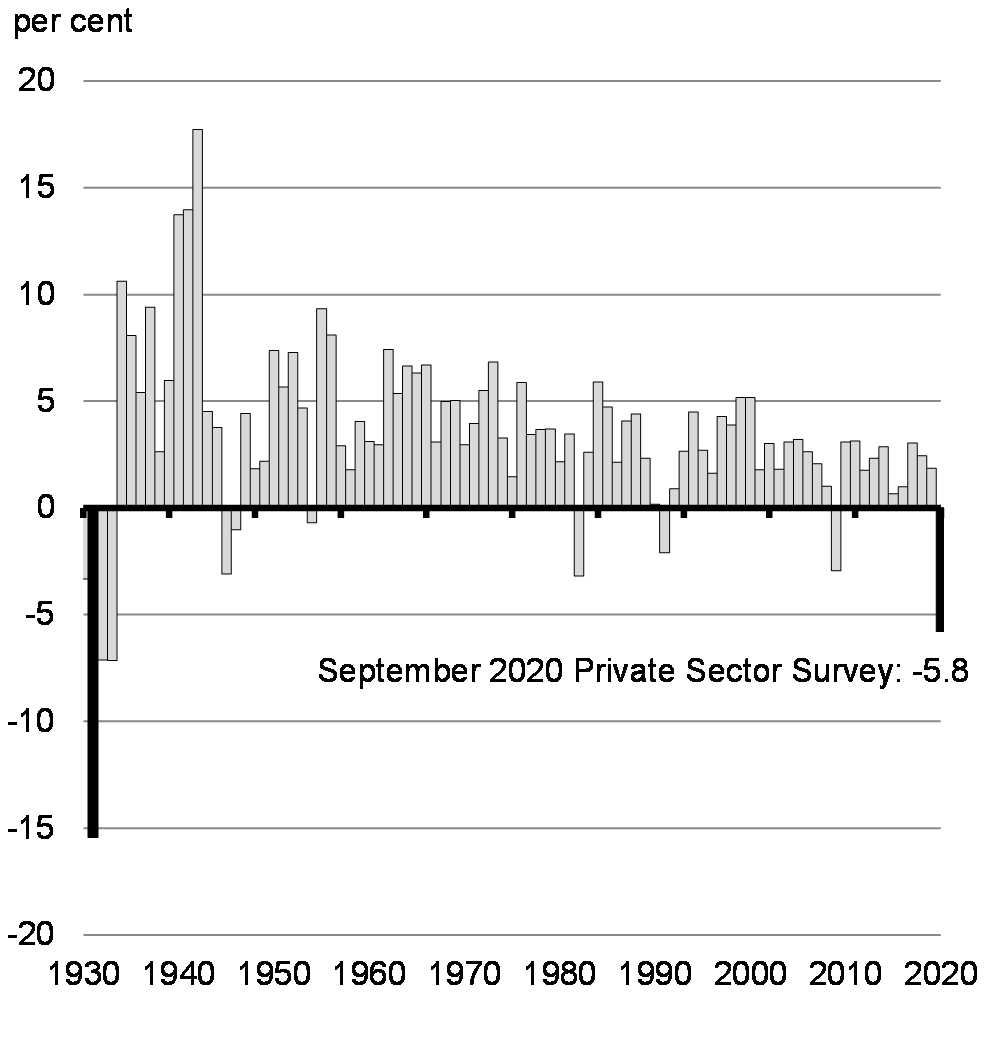
2.2 An Unprecedented Economic Shock
The COVID-19 pandemic has brought about the deepest and fastest recession, worldwide, since the Great Depression (Chart 2.1). The public health measures necessary to contain rapidly rising case numbers and save lives caused a sudden and unprecedented impact on the global economy over the first half of 2020. The collapse in economic activity was most severe in advanced countries, with G7 economies contracting by between 8.7 per cent in Japan and 21.8 per cent in the United Kingdom. The drop in Canada’s real GDP was the fourth largest in the G7 at 13.4 per cent over the first half of 2020. Even after accounting for the expected rebound in activity in the third quarter of the year, the International Monetary Fund (IMF) projects global growth to contract 4.4 per cent in 2020.
Here at home, the shock to the Canadian economy caused by the spread of COVID-19 was historically sudden and deep. The decline in real GDP in the second quarter was, by far, the largest on record, with much of the damage occurring over a very short time from mid-March to the end of April. Over this period, more than 3 million Canadians lost their jobs and the employment rate for Canadians aged 15 to 64 fell from record highs to record lows (Chart 2.2).
Annual Real GDP Growth, Canada
Share of Canadians Age 15-64 Employed

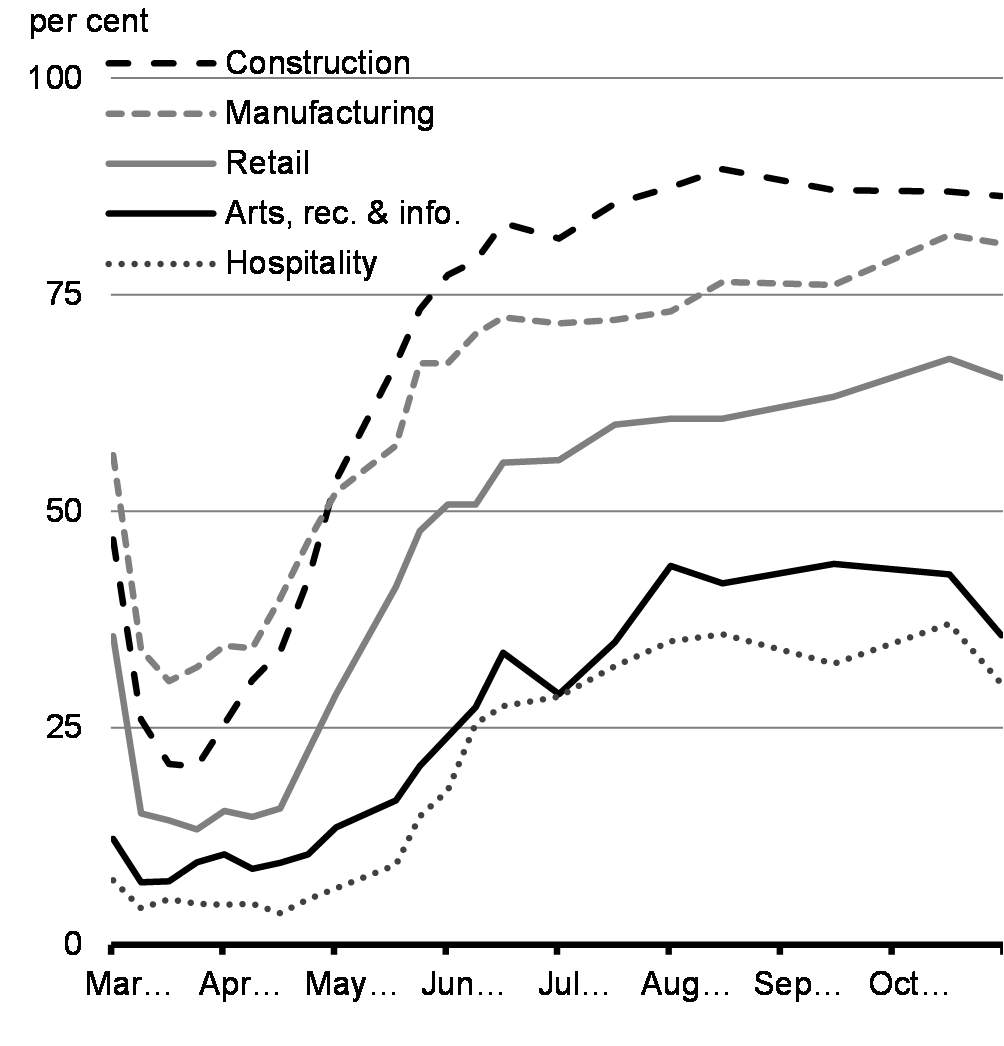
This historic collapse in economic activity was felt across the economy. Activity in the housing market paused in the spring. Lockdowns and supply chain challenges forced many retailers, manufacturers and service providers to close their doors. Consumers drastically cut back their spending as they followed public health advice and stayed home. Public health measures and lower demand combined to substantially reduce revenues for many businesses. Essential workers continued to perform their jobs, which Canadians depend on, facing the dangers of the pandemic every day. Close-contact businesses in the hospitality, retail, entertainment and recreation industries, such asrestaurants, hotels, gyms, performance halls and sporting events, were hit especially hard, as were the many women, young people, racialized Canadians, and low-income workers who rely on these businesses for their livelihoods. The many small businesses in these sectors continue to face acute challenges (Charts 2.3 and 2.4).
Share of Small Businesses Fully Open, Selected Sectors
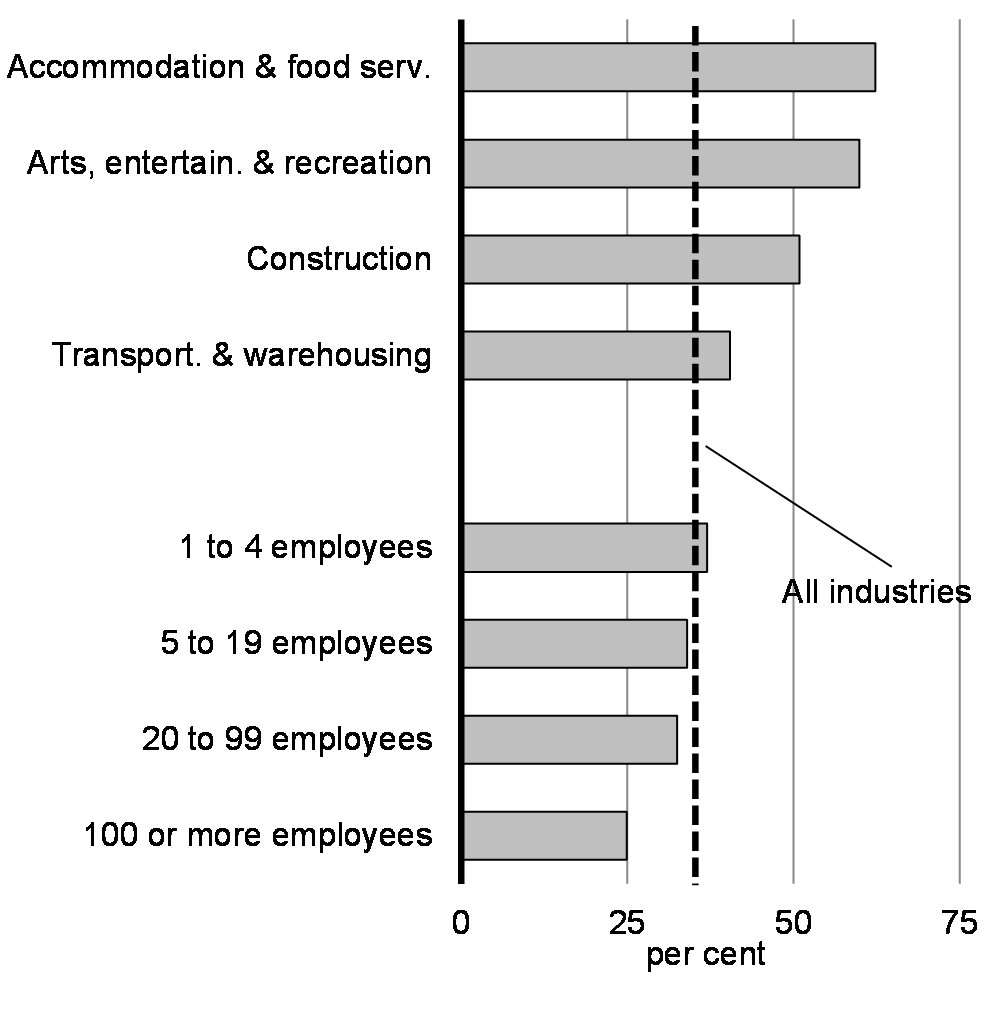
Share of Businesses Reporting A Decline in Revenues of More than 50%, From April 2019 to April 2020
2.2.1 Millions of Jobs Were Lost
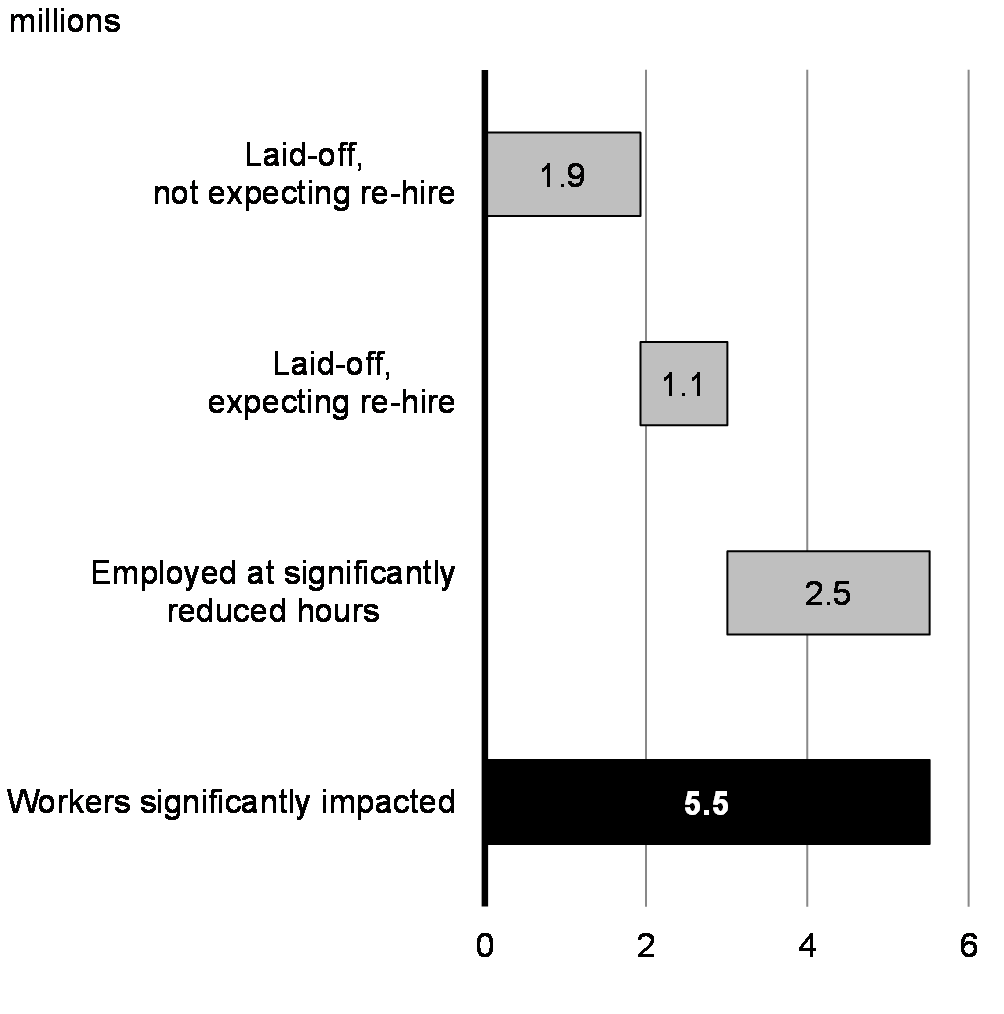
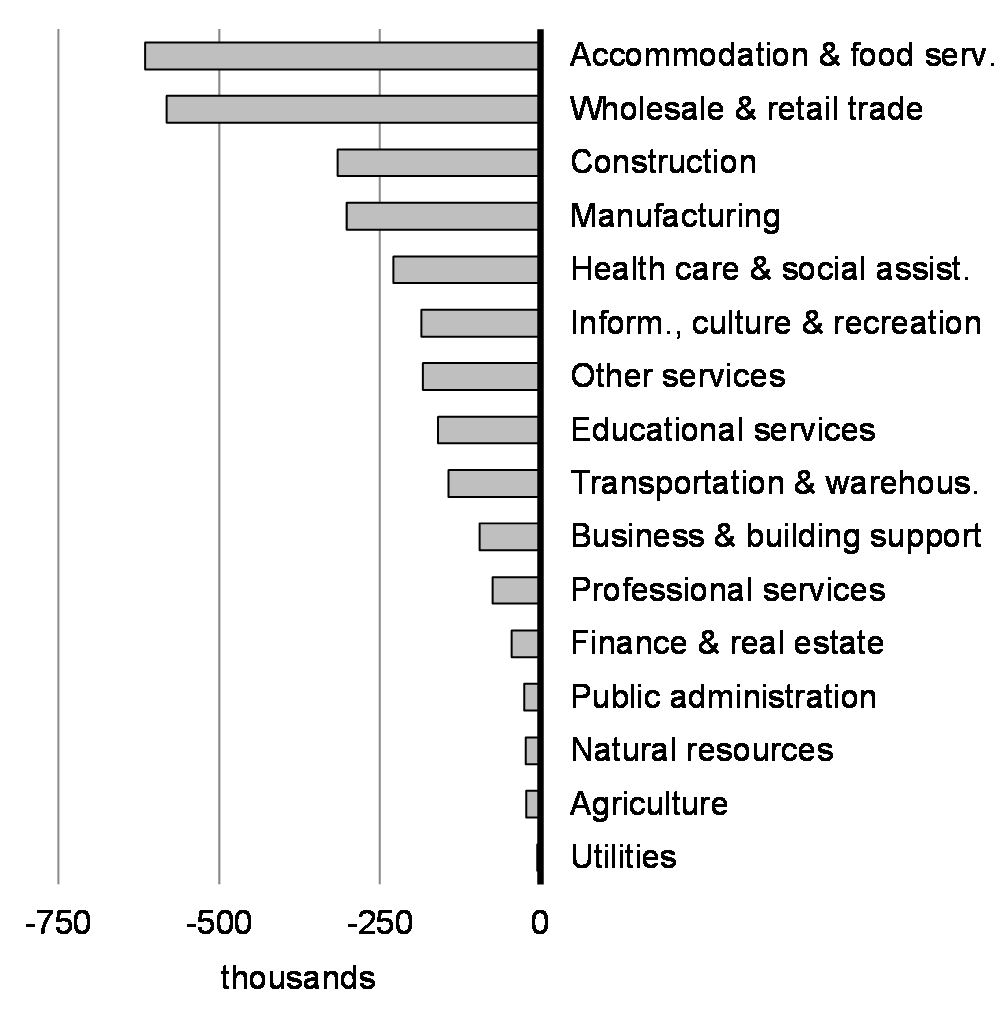
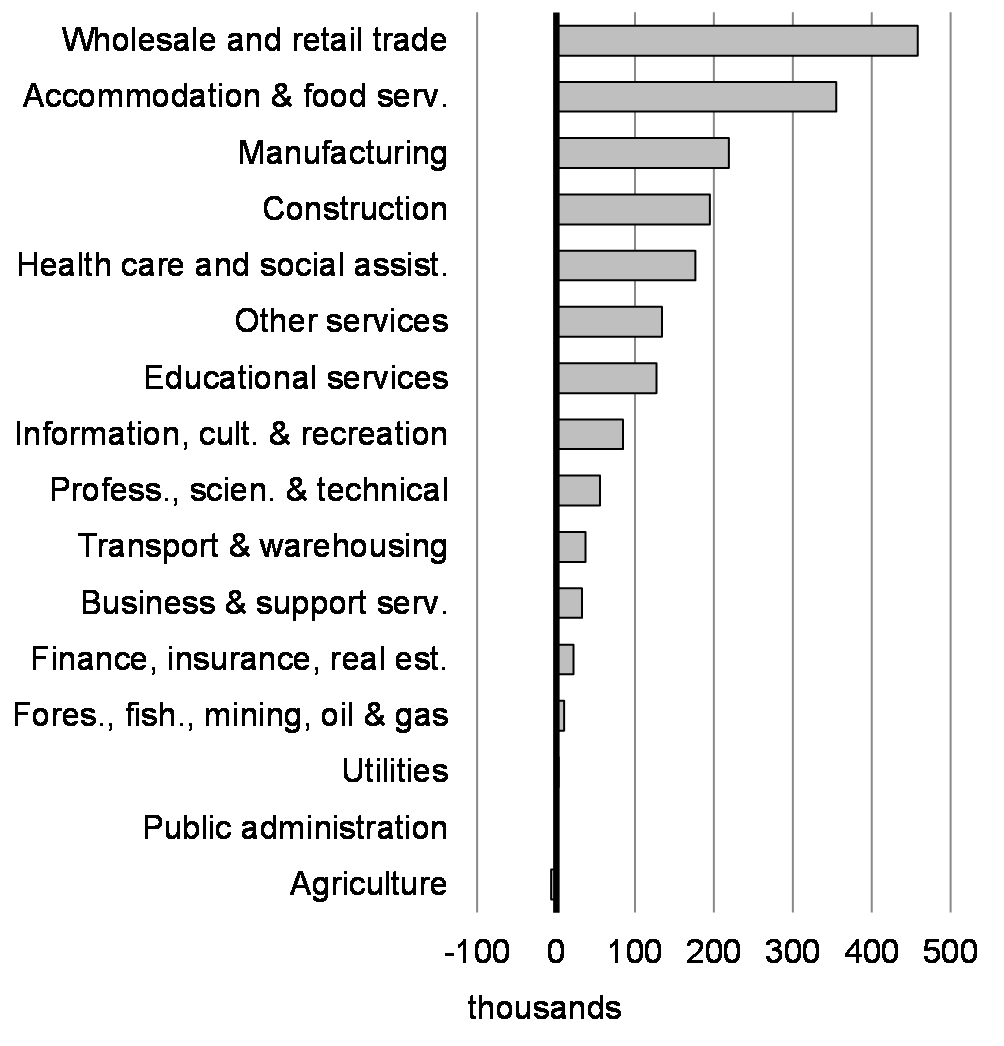
At the height of the spring lockdown, over 5.5 million Canadians were either laid off or working significantly reduced hours (Chart 2.5). The surge in the number of workers still employed but not working any hours was an atypical feature of this crisis, creating a need for new measures to help businesses retain their employees. Employment losses were highest in accommodation and food services (Chart 2.6), industries which disproportionately employ women, young people and new Canadians.
Gender Results Framework
Gender Equality and Diversity in Canada
-
Economic Participation and Prosperity
Early labour market impacts from COVID-19 were more strongly felt among low-wage workers, with a 38 per cent decline in employment between February and April, compared to 13 per cent for all other employees. Women low-wage workers (41 per cent) fared worse than men low-wage workers (34 per cent). Very recent immigrants (five years or less) were also strongly affected, with employment declining 23 per cent from February to April, compared to 14 per cent for those born in Canada.
Workers Substantially Affected by COVID-19, April 2020
Change in Employment by Industry, February 2020 to April 2020
2.2.2 Exposing Inequalities
This pandemic has laid bare – and in many cases deepened – the inequalities in Canadian society. The virus has disproportionately spread in low-income and racialized communities. Job and wage losses have been higher among young people, low-income workers, people living with disabilities, and women. Mothers with small children, racialized and newcomer women and the women who often take on the additional burden of unpaid care work, also have reduced access to community services and supports. Lower-wage workers, who were already vulnerable to income shocks given lower savings and reduced access to credit, also lost jobs in disproportionate numbers (Charts 2.7 and 2.8).
Declines in Employment by Select Groups, February 2020 to April 2020

Share of Workers Laid-Off or with Substantially Reduced Hours in April 2020 by Weekly Earning Brackets
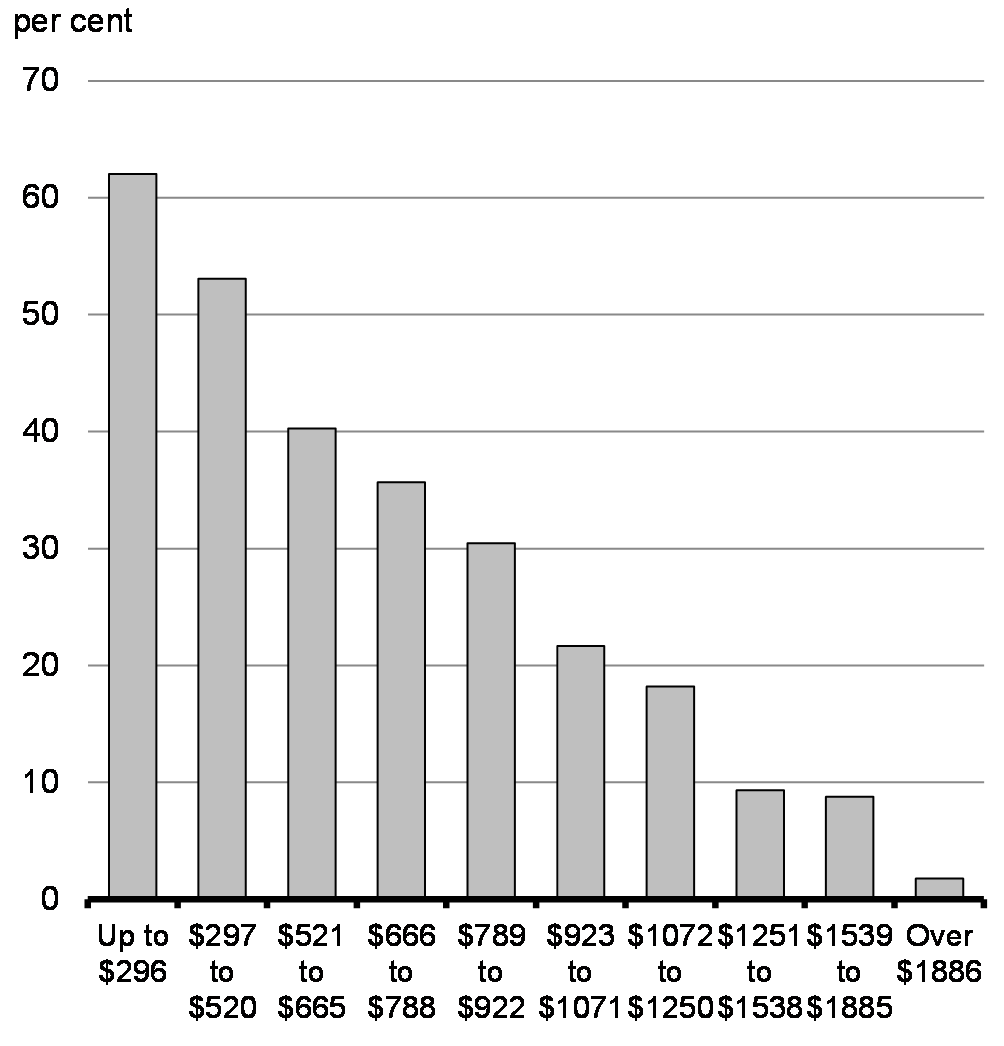
At the trough of the recession in April, youth employment declined by more than a third relative to February.
About 1.5 million fewer women were employed in April than in February. Employment among recent immigrants fell more sharply than it did for those born in Canada. Racialized Canadians also reported stronger labour market impacts. In a crowdsourcing survey conducted by Statistics Canada in late-May and early-June, 47 per cent of persons identifying as West Asian, 42 per cent of persons identifying as Filipino, 40 per cent of persons identifying as Korean and 40 per cent of persons identifying as Southeast Asian reported experiencing a job loss or reduced work hours, compared to 34 per cent of persons identifying as White.
Many Canadian families found themselves with limited options for child care. As a result, parents had to either juggle full time work while staying at home or opt to drop out of the labour force to look after their children. This represents yet another gap in our social safety net; prior to the pandemic access to affordable child care was a challenge and in the pandemic it became nearly unattainable. There were clear impacts on the employment of women who are mothers as well as on the primarily female and racialized Canadians who work in child care. Women’s labour force participation rate has been reduced to its lowest level in three decades.
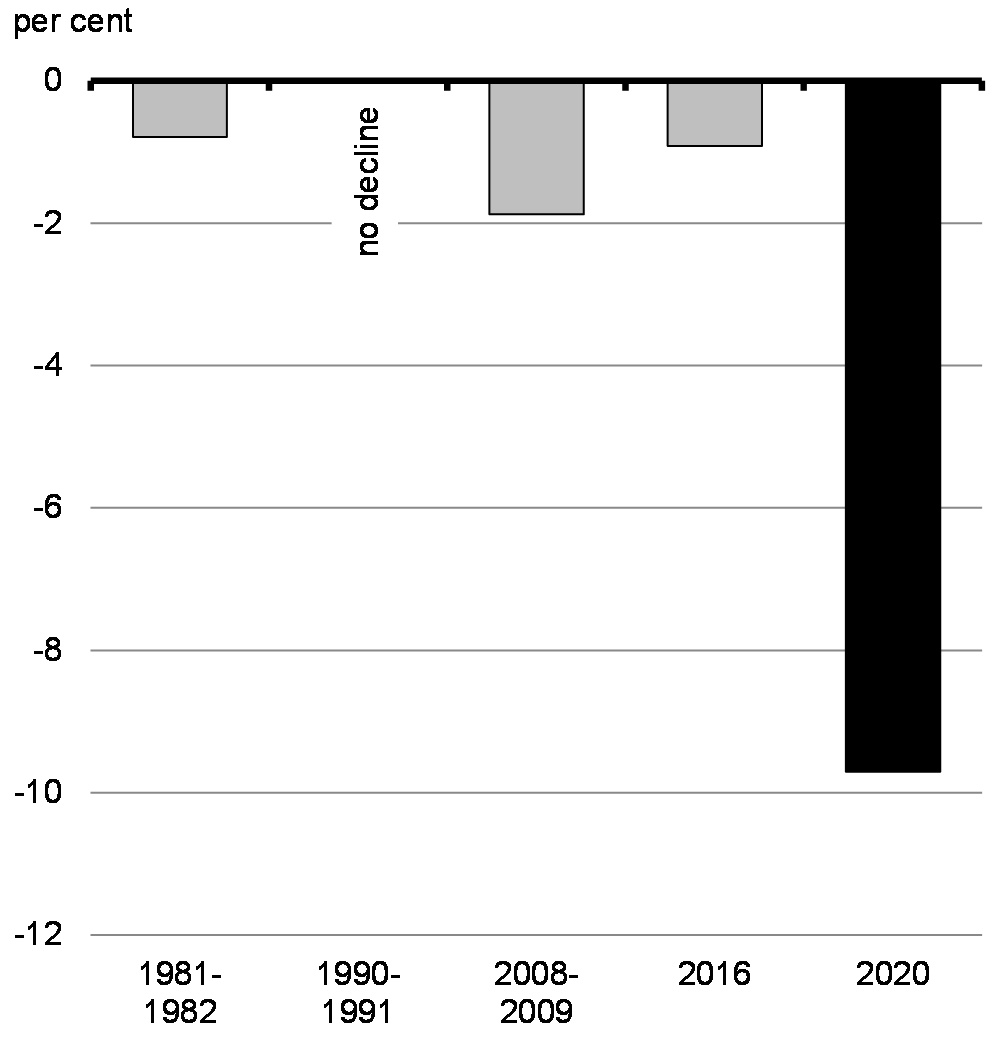
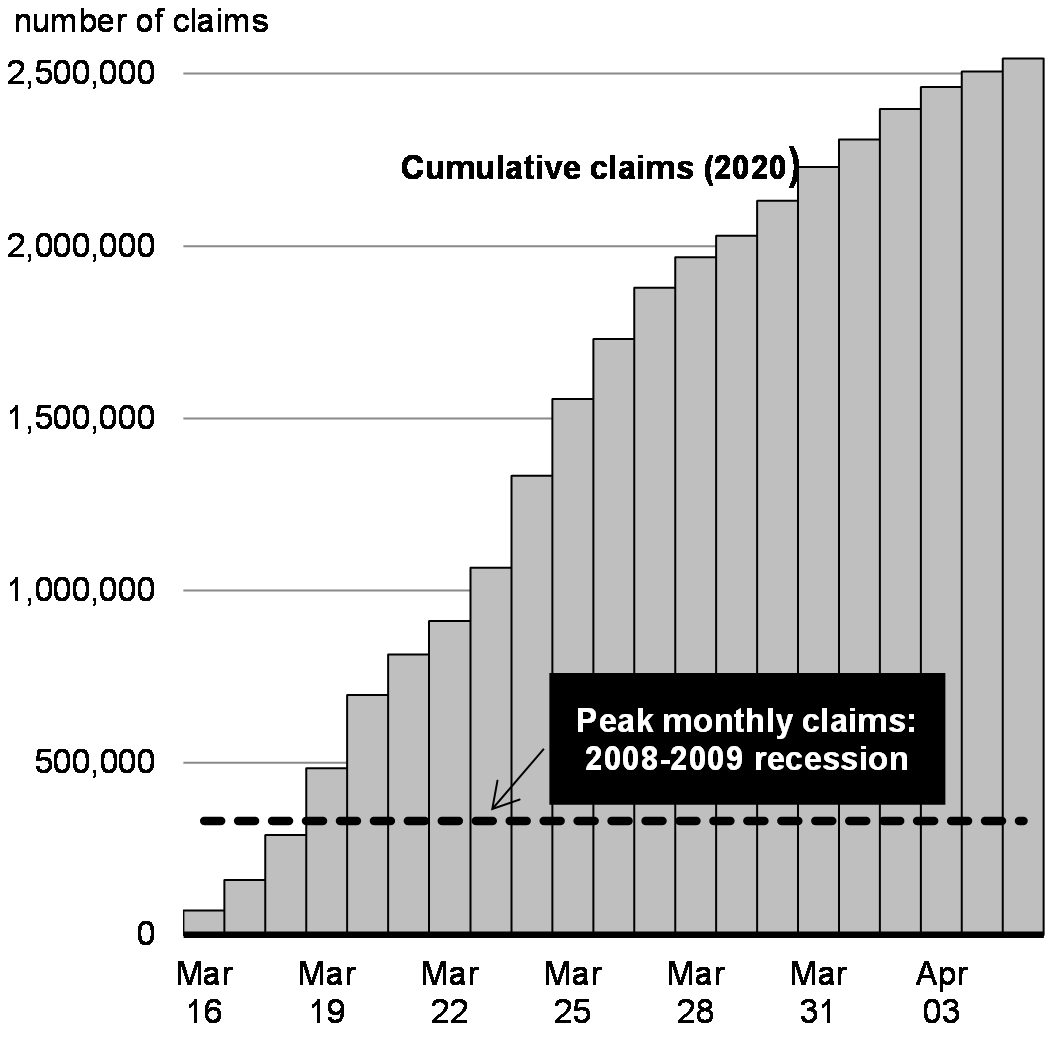
This year, millions of Canadians suddenly faced a loss of employment income. Over the first half of 2020, employment income fell by an unprecedented $32 billion, or a 10 per cent decline (Chart 2.9). The Employment Insurance system was flooded with millions of applications from Canadian workers, many of whom did not qualify for Employment Insurance. (Chart 2.10). This exposed the size of the gaps in Canada’s social safety net. Federal government supports, such as the CERB as well as the GST Credit and CCB top ups, have helped address income gaps.
Employment Income Declines During Previous Downturns
Volumes of Claims for Employment Insurance Benefits Between March 16 and April 5, 2020
2.3 A Partial and Uneven Rebound
2.3.1 Government Support Has Stabilized the Economy
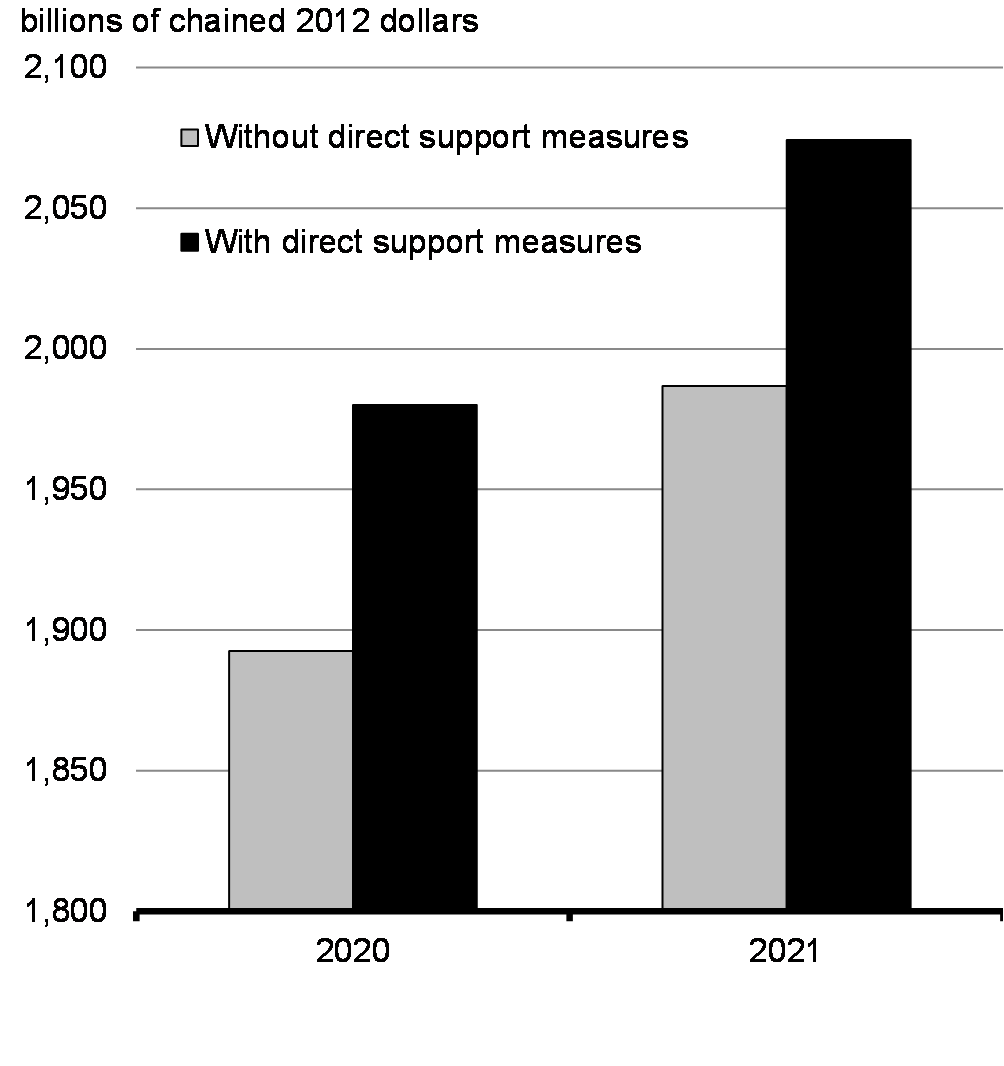
The government’s fiscal support measures have provided, and will continue to provide, substantial support to the Canadian economy. Overall, Department of Finance analysis indicates that direct support measures are expected to result in economic activity being 4.6 per cent higher in 2020 and 4.4 per cent higher in 2021 compared to a scenario without support measures.Footnote 1 This translates into about 1.2 million full-time equivalent jobs protected in 2020. Without the direct support, the unemployment rate would have risen by an additional 6 percentage points in 2020, and remained above 12 per cent by the end of 2021 (Charts 2.11 and 2.12).Footnote 2 Overall, we estimate that these measures offset about half of the negative economic effects of the pandemic on the unemployment rate by the second quarter and about a quarter of the negative effects on real GDP. The swift, decisive and substantial support provided by the federal government has worked to protect Canadians’ health, Canadians’ jobs and Canadians’ businesses, positioning Canada’s economy for a robust and lasting recovery once the virus is conquered. Government support will help lay the foundation for the economic recovery.
Real GDP
Unemployment Rate

2.3.2 Canada’s Third Quarter Rebound Outperformed Expectations
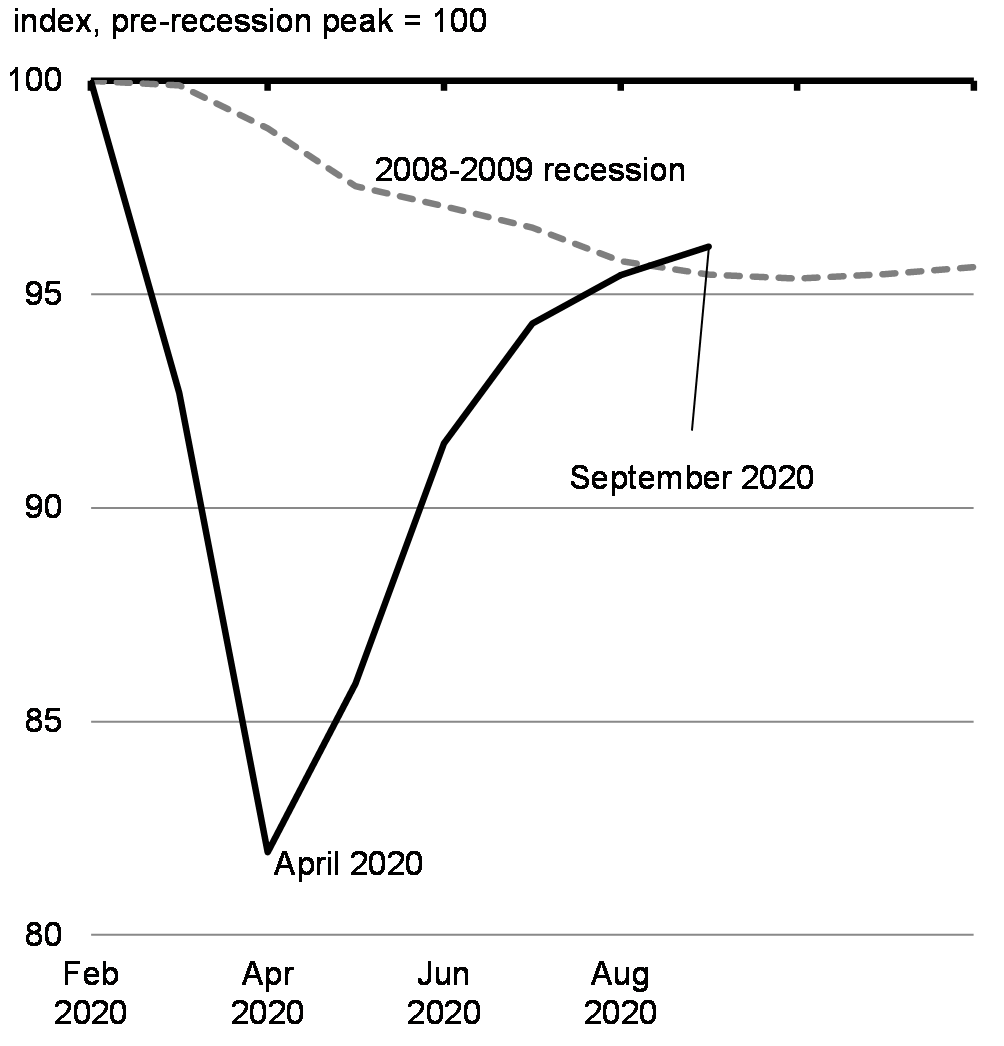
The federal government’s rapid and substantial support resulted in Canada experiencing a shallower contraction in the overall economy than would otherwise have been the case. After seeing its deepest decline on record this past spring, Canada’s economy strongly rebounded in the third quarter with an annualized increase in real GDP likely over 45 per cent, while almost 80 per cent of the more than 3 million jobs lost at the outset of the pandemic have been recouped (Charts 2.13 and 2.14). This rebound was even stronger than predicted in the July Economic and Fiscal Snapshot (EFS 2020). At the same time, the rebound has been uneven and partial. Higher-wage workers in sectors such as tech and professional services to finance and public service, and who tend to be able to work from home have experienced less job loss or have even seen employment rebound to levels higher than before the pandemic. Meanwhile, lower-wage workers in industries still affected by public health restrictions and weaker demand due to COVID-19 – including hotels, travel, entertainment and restaurants – are facing shortened hours or unemployment.
Evolution of Monthly Real GDP during the COVID-19 Crisis compared to during the Global Financial Crisis
Monthly Employment, 2020 to Date
Thanks to this support, the Canadian economy has shown considerable resilience, with a sharp rebound in economic activity and jobs through the summer and the early fall. Although the second wave of infections will temper growth in the short-term, and likely extend the period of time for recovery, the Canadian economy is poised to be back on a more sustainable growth track next year buttressed by strong fundamentals.
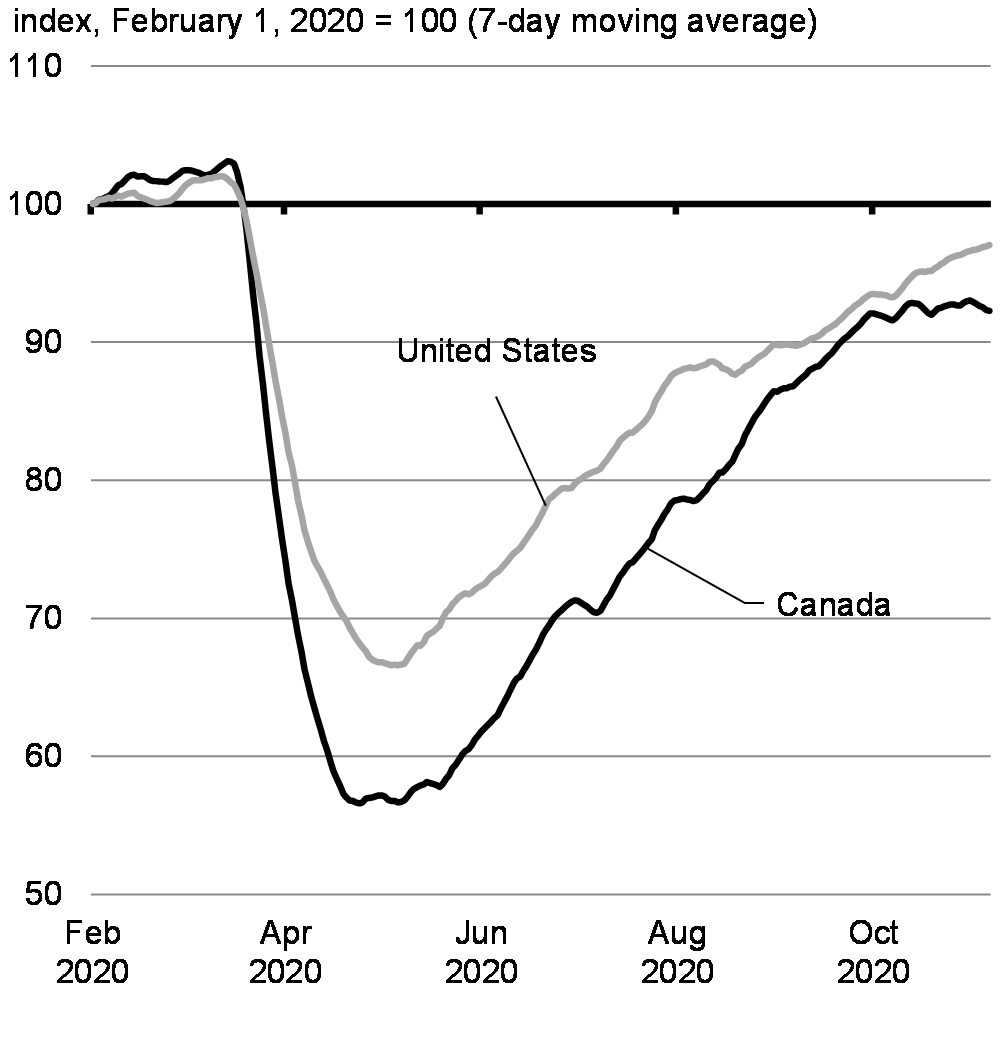
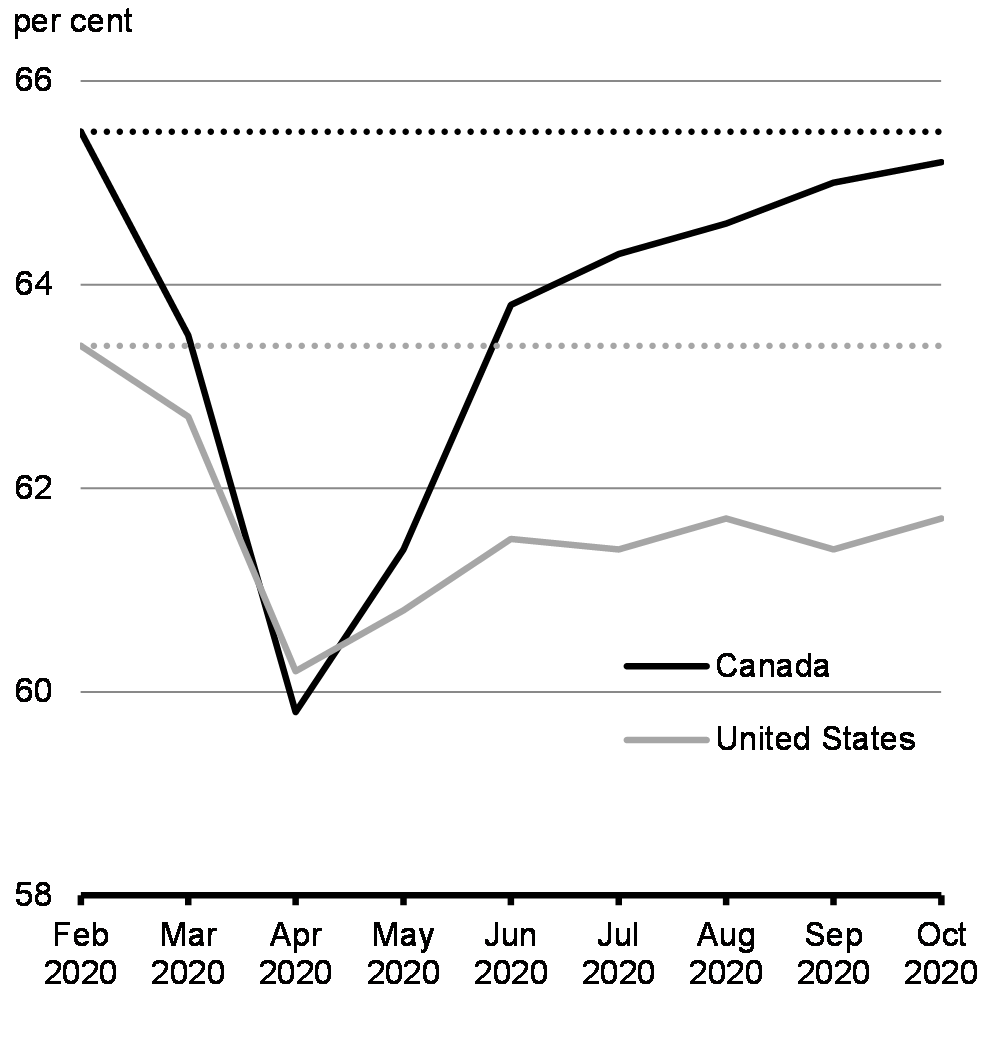
Programs such as the Canada Emergency Wage Subsidy gave employers financial support so they could keep or re-hire their workers. Job postings data shows that labour demand has steadily increased since April (Chart 2.15). In September, the Safe Restart Agreement and the Safe Return to Class programs helped schools and child care centres to reopen, allowing many parents to return to work. This support, along with a lower infection rate so far, has meant that the rebound in Canadian employment has exceeded that in the United States. Canada has recovered almost eight in ten of the lost jobs compared to just over half in the United States, with sectors such as education, real estate, professional services, finance, and insurance more than recouping their losses. Importantly, federal support for Canada’s labour market has helped Canadians get back to work more quickly and be more confident in their future employments than their counterparts in the United States (Chart 2.16). Jobs have still not returned to pre-pandemic levels though, and the virulent second wave and public health measures put in place to fight it will inevitably have an impact on growth and jobs.
Online Job Postings, Canada and United States
Evolution of Labour Force Participation Rate, Canada and United States
2.3.3 Government Support has Helped Increase Household Disposable Income and Savings
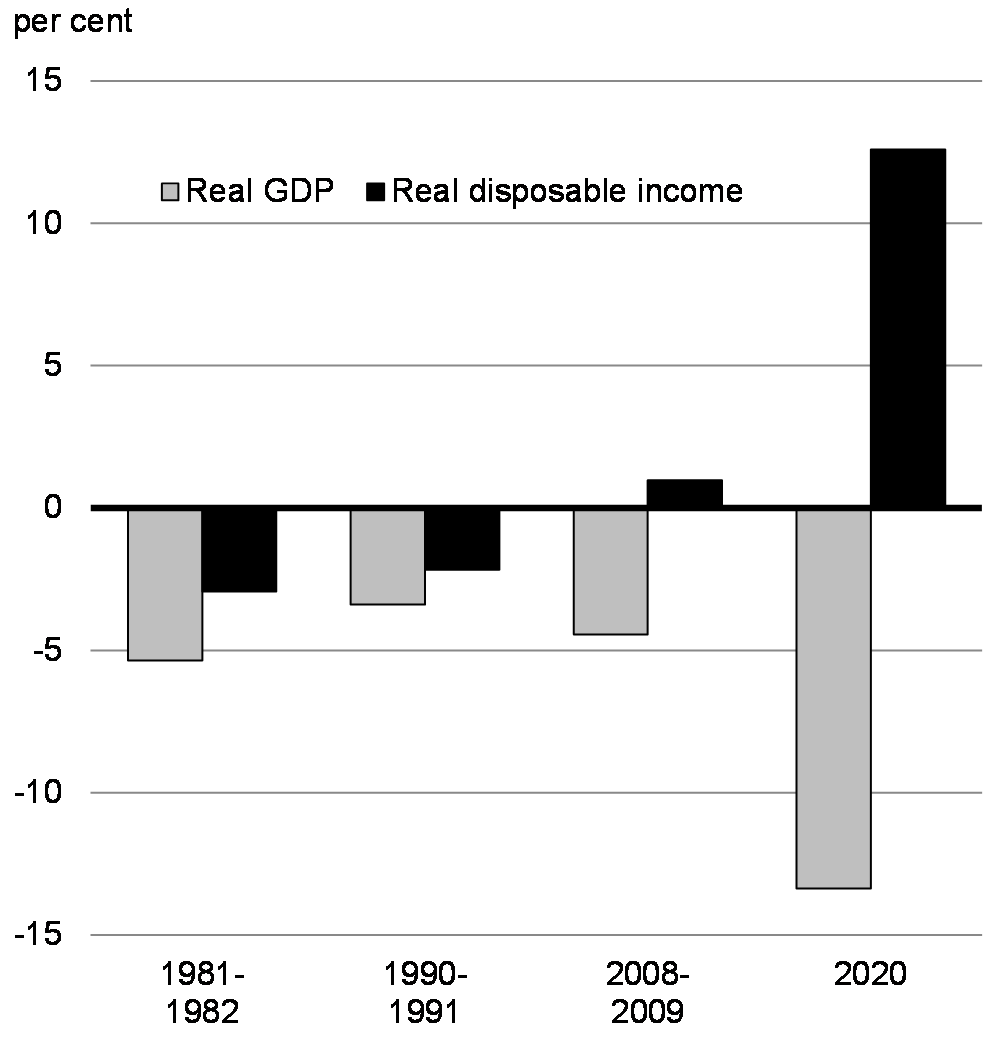
While many Canadians continue to face challenges as a result of unemployment or reduced income, there are signs that, overall, government transfers have meant that many Canadian households were able to avoid taking on debt during in the first half of 2020. This factor, combined with reduced spending opportunities, actually led many people to substantially increase their savings, a feature of this recession that is unlike others (Chart 2.17). These savings helped fuel a quick rebound in retail and consumer spending over the summer and fall. Given this level of support, household balance sheets are now in a better place than would normally be the case. More important than just sustaining the rebound in consumer spending for the economy, this positions households to be a central force within our economic recovery. These savings are a preloaded stimulus Canadians will be able to deploy once the virus is vanquished and the economy fully reopens. And, as a result of meaningful government support, vulnerable Canadian workers—a group typically with limited savings—who experienced pandemic-related unemployment, did not, in aggregate, take on additional debt just to pay for essentials.
Overall, reflecting significant and targeted direct income support, Canada’s household savings rose most among major advanced economies over the first half of 2020 (chart 2.18). Unleashing these savings will be a key element of the government’s recovery plan.
Change in Real GDP and Real Disposable Income during Recessions
Change in Household Gross Saving Rate by Country Since 2019Q4

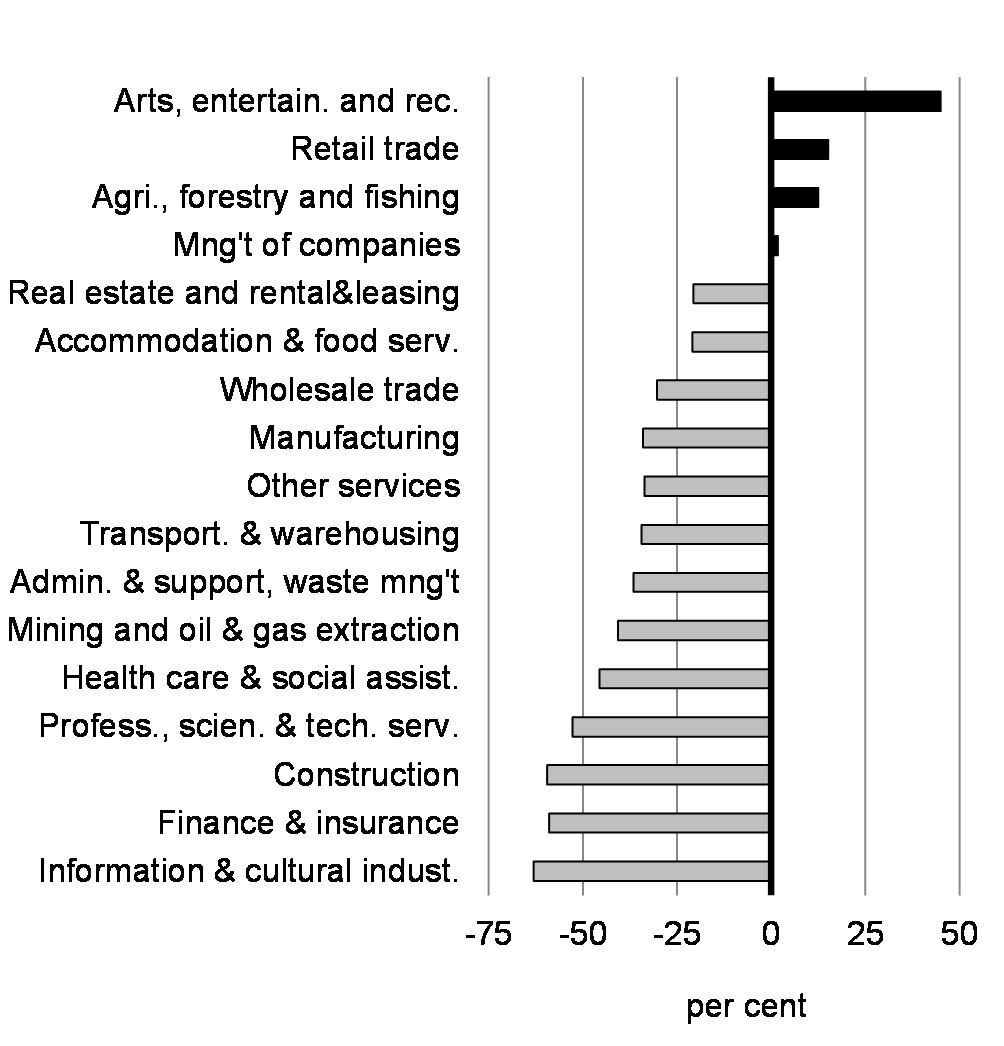
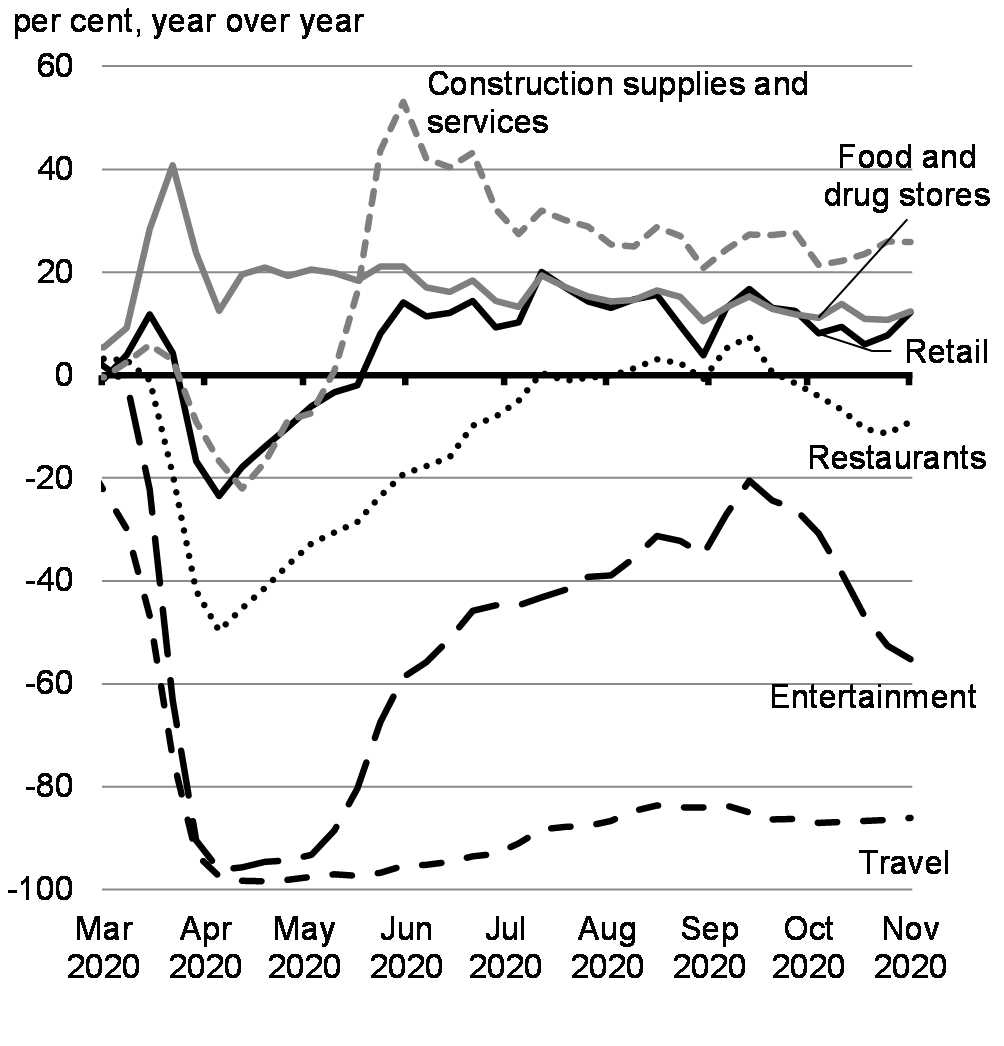
2.3.4 Different Sectors Have Felt Different Impacts
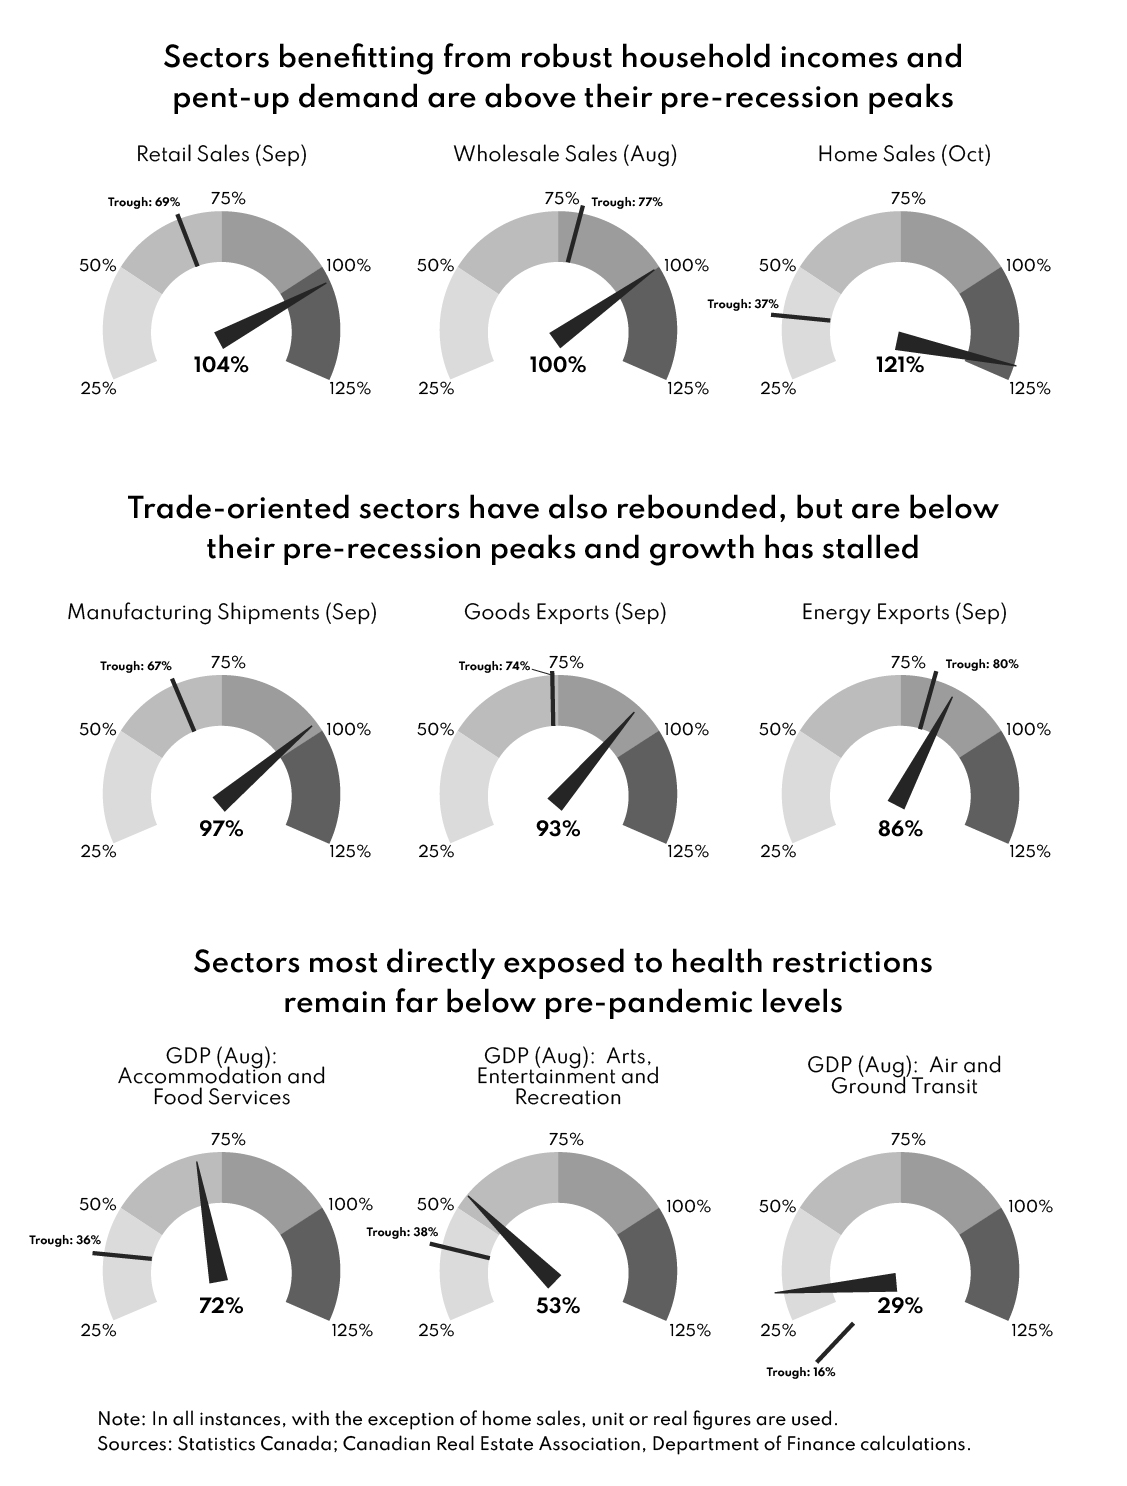
Economic activity has been uneven. Certain sectors and industries— such as retail and wholesale trade and housing-related sectors— are near or out-performing pre-pandemic levels (Figure 2.4), benefitting from pent-up demand among households with well-supported incomes. Other areas of the economy, such as manufacturing and exports have recouped most losses, but they have plateaued somewhat below pre-pandemic levels, in part reflecting weak global demand. The industries that continue to lag are those still highly affected by public health restrictions and weaker demand due to COVID-19-related concerns and behaviour changes. Food services and accommodation, arts and entertainment, tourism and transit all remain highly depressed compared to pre-pandemic activity. Measures put in place by the government are helping to avoid scarring in these sectors.
Gender Results Framework
Gender Equality and Diversity in Canada
-
Economic Participation and Prosperity
COVID-19 and related public health restrictions have resulted in significant job losses in industries that represent core sectors for youth, visible minorities and immigrants. In particular, in 2019, youth represented 41 per cent of employment in accommodation and food services, but only 13 per cent of overall employment. In 2016, visible minorities accounted for 30 per cent of those earning wages in accommodation and food services, but only 21 per cent of wage earners in all industries. Immigrants, especially very recent immigrants, were also overrepresented in this industry.
Macroeconomic Indicators Dashboard for Canada
2.4 Decisive and Dynamic Support for Canadians
Canadians and Canadian businesses have access to a broad suite of economic measures to support them as we follow the advice of public health officials.
The extraordinary measures taken by the Government of Canada have supported wages, protected jobs, and kept businesses operating. The road to recovery remains long and uneven. Workers in certain sectors, especially sectors that employ mostly women, young people, new Canadians, racialized Canadians and low-income workers, have been hit hardest.
2.4.1 Protecting Jobs
2.4.1.1 The Canada Emergency Wage Subsidy
The Canada Emergency Wage Subsidy has been critical for some of the hardest hit sectors, helping to speed up the labour market recovery and prevent economic scarring. In August, about a quarter of private sector workers were covered by the program. Over 70 per cent of the approved applications to the wage subsidy program were made by employers with 25 employees or less. In accommodation and food service – the sector which experienced the sharpest decline in employment earlier this year – over half of workers were covered by the Canada Emergency Wage Subsidy in August (Chart 2.19), with the sector making greater use of the program as the economy reopened. By August, jobs recovered in many sectors that were hard hit in the first wave (Chart 2.20).
Share of Private Sector Workers Covered by the Canada Emergency Wage Subsidy, by Industry, August 2020
Change in Employment, April to August 2020
Additional Key Results Achieved To Date
-
Wage Top-up for Essential Workers - $2.5 billion transferred to provinces and territories to support wage increases for low-income essential workers
2.4.2 Immediate Income Support
2.4.2.1 The Canada Emergency Response Benefit
The Canada Emergency Response Benefit made sure workers laid off due to COVID-19, including many without access to EI, did not have to choose between doing the right thing to stop the spread of the virus and making ends meet. This significant support was instrumental in helping Canada flatten the curve as Canadians could afford to stay home in the initial wave of the pandemic.
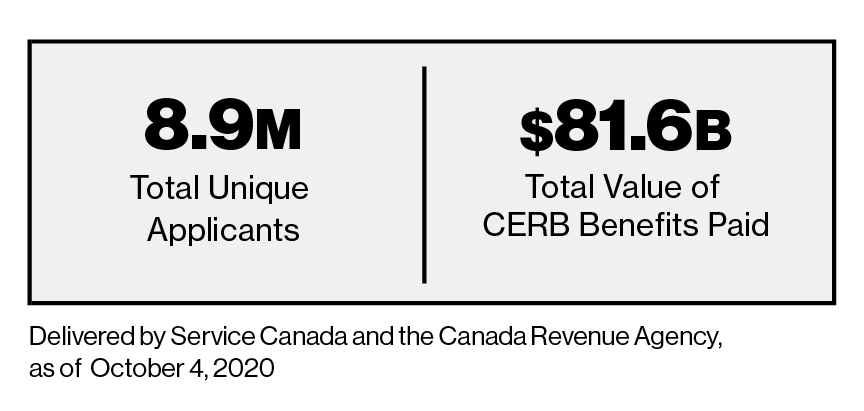
Between April and September, the CERB was a critical lifeline for 8.9 million Canadians. It provided $500 a week to eligible Canadians, for up to 28 weeks, so they could pay for groceries, rent and other expenses
CERB Take-up
Gender Results Framework
Gender Equality and Diversity in Canada
-

Poverty Reduction, Health and Well-being
CERB was required by certain groups of Canadians more than others. According to self-reported data in the Labour Force Survey, in September 2020, women accounted for 54 per cent of CERB beneficiaries while men accounted for 46 per cent. New Canadians and racialized Canadians were also overrepresented among CERB recipients.
2.4.2.2 Canada Emergency Student Benefit
To help post-secondary students from across Canada weather the economic impact of the global pandemic, the Canada Emergency Student Benefit provided more than 708,000 students who were unable to find a job this summer with $2.94 billion in income support. This support allowed students who were unable to access the CERB to have the money they needed to pay for rent, food and essentials, during a summer when seasonal jobs were in short supply. Importantly, it also made sure that they were well positioned to afford tuition and to return to school in the fall.
This support was announced as part of a suite of programs to support students, including $228 million which helped 2,889 students and postdoctoral fellows by extending their research scholarships or fellowships and provided income support to an additional 15,901 student researchers and research support staff.
2.4.3 Support for Canada’s Businesses
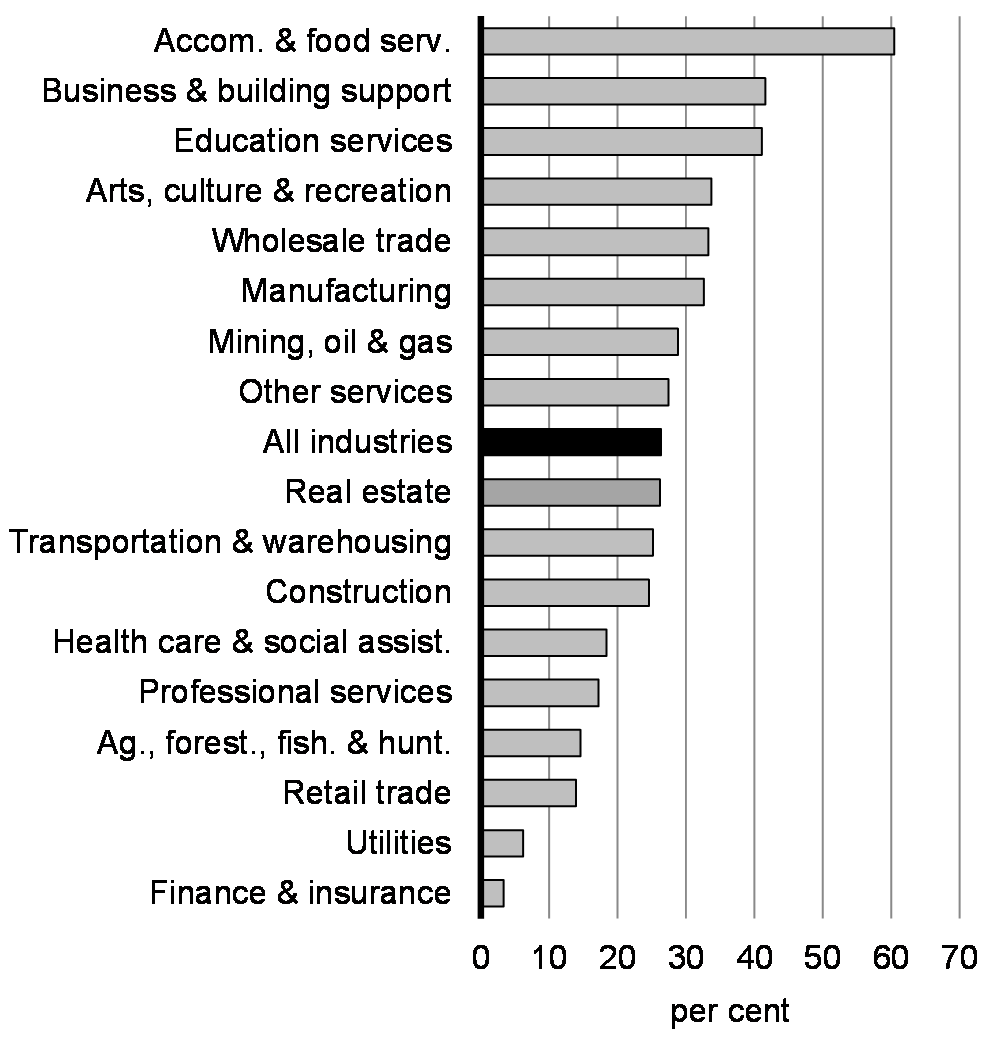
Government of Canada measures have helped businesses afford fixed costs and adapt to the conditions of the pandemic. The overall number of firms forced into bankruptcy remains well-below levels seen prior to the pandemic, limiting business closings and showing that bold fiscal action is working to prevent long-term damage and economic scarring (Charts 2.21 and 2.22).
Gender Results Framework
Gender Equality and Diversity in Canada
-
Leadership and Democratic Participation
In August 2020, 29 per cent of businesses reported insufficient demand for their goods and services as an obstacle over the last three months. Businesses majority-owned by Indigenous peoples (44 per cent), immigrants to Canada (35 per cent), persons with a disability (32 per cent), and visible minorities (39 per cent) were significantly more likely to report this obstacle. Slightly fewer businesses majority-owned by women (26 per cent) and members of LGBTQ2 communities (25 per cent) made this claim.
The government knows that our eventual recovery will be faster and more complete, in direct proportion to how much we limit the economic scarring caused by the COVID-19 recession. In order for the small family restaurant or mid-sized manufacturer to come back stronger, it must first survive the pandemic. Its owners have to make rent. And they have to keep their experienced and knowledgeable staff on the payroll.
For our economy to come roaring back after we defeat the virus, we must be sure our businesses do not permanently close their doors.
Business Insolvencies

Change in Business Insolvencies by Sector
Small businesses have been hit hard and have worked hard to stay afloat— through the first wave and now second wave. They have access to broad programs like the Canada Emergency Wage Subsidy but have also benefitted from targeted programs like the Canada Emergency Business Account and the Canada Emergency Commercial Rent Assistance, which provided more than $2.0 billion to 140,000 small businesses and supported 1.2 million workers.
“Small and large businesses create jobs, drive our economy, and make our communities stronger. Our government will continue to do whatever it takes to support them.”
Canada Emergency Business Account
2.4.3.1 Indigenous Community Business Fund
Like so many businesses in Canada, those owned and operated by First Nation, Inuit and Métis peoples have seen their revenues impacted by COVID-19. However, some of their businesses do not qualify for existing COVID-19 relief programs. That’s why the Government of Canada launched the Indigenous Community Business Fund to provide $117 million in non-repayable financial contributions to help support operating costs for First Nation, Inuit and Métis community- or collectively-owned businesses and microbusinesses whose revenues have been affected by the COVID-19 pandemic. A further $16 million was provided to support Indigenous tourism businesses through the COVID-19 Indigenous Tourism Stimulus Development Fund.
In April, the government announced $306.8 million to help small and medium-sized Indigenous businesses, and to support Aboriginal Financial Institutions that offer financing to these businesses. This provides funding for short-term, interest-free loans and non-repayable contributions through Aboriginal Financial Institutions, which offer financing and business support services to First Nations, Inuit, and Métis businesses. Financial support for Indigenous businesses is provided through Aboriginal Financial Institutions, and administered by the National Aboriginal Capital Corporations Association and the Métis capital corporations in partnership with Indigenous Services Canada.
Combined, these programs have provided support to thousands of Indigenous businesses.
2.4.3.2 Support for Main Street Businesses
In response to the challenges caused by the pandemic, the Royal Bank of Canada, in partnership with chambers of commerce and private sector partners, launched the Canada United Small Business Relief Fund. Canada United provides grants of up to $5,000 to purchase personal protective equipment, renovate physical space and develop e-commerce capabilities — helping small businesses stay open while keeping Canadians safe.
In October, the government announced $12 million for the Canada United Small Business Relief Fund. This contribution is part of up to $46.5 million proposed to support main street businesses through shop local initiatives across the country. The remaining funding is proposed to support provincial and territorial chambers of commerce to collaborate with key stakeholders in their communities to develop or enhance awareness building campaigns that promote main street businesses in their communities.
2.4.4 Helping Vulnerable Canadians
The government acted quickly to provide special one-time payments through existing programs.
- Over 15 million low- and modest-income Canadians received a top-up payment under the GST Credit, giving, on average, single adults almost $400 in additional benefits and couples almost $600.
- Families who were eligible for the Canada Child Benefit benefitted from a top-up of $300 per child.
- Seniors received a special Old Age Security top-up of $300 and, for those eligible, a Guaranteed Income Supplement top-up of $200 helping them cover the extra costs of staying home and staying safe.
- Canadians living with disabilities who hold a valid certificate for the Disability Tax Credit or are a beneficiary of the Canada Pension Plan Disability, the Quebec Pension Plan Disability, or one of the disability supports provided by Veterans Affairs Canada, are also receiving additional support worth up to $600.
- The government is also proposing to provide an additional $600,000 to top up the Veterans Emergency Fund to provide financial support for veterans whose well-being is at risk due to an urgent and unexpected situation
Gender Results Framework
Gender Equality and Diversity in Canada
-
Poverty Reduction, Health and Well-Being
In 2016, about 1 in 4 Canadians (26 per cent) could have been financially vulnerable to an economic lockdown, meaning that without government transfers or borrowing, they would not have had enough liquid assets and other private sources of income to keep them out of low income during a two-month work stoppage. In the absence of government transfers, single mothers, recent immigrants, individuals living in families headed by an urban or off-reserve Indigenous person and individuals living in families where the main income earner has little education were highly vulnerable financially during temporary work interruptions.
2.4.5 Supporting Community Service Organizations
In a time where donations are going down, the need for support from charities and non-profits has gone up. That’s why the government has made significant investments in shelters, food banks, and community organizations, to ensure that Canadians get the support they need.
This includes:
- $20 million for organizations providing support to veterans and that are facing significant financial hardship as a result of the COVID-19 pandemic.
- $214 million distributed as of October 5, to support vulnerable Canadians through charities and non-profit organizations across Canada that deliver essential services.
- $200 million in total support for nearly 3,000 food banks and local food and service organizations to address emergency hunger relief across Canada.
- $100 million for women’s shelters, sexual assault centres and organizations that provide support and services to those experiencing gender-based violence, including specific supports for Indigenous people experiencing gender-based violence and living off-reserve.
See the summary table for Chapter 2 for a comprehensive list of all new measures introduced under the government’s economic response plan since the Economic and Fiscal Snapshot (July 2020).
Gender Results Framework
Gender Equality and Diversity in Canada
-
Poverty Reduction, Health and Well-Being
In early May, almost 1 in 7 Canadians (15 per cent) reported that they lived in a household where there was food insecurity in the past 30 days. Households with children were more likely to be food insecure (19 per cent) than households without children (12 per cent). Prior to the pandemic, lone-parent households, especially lone-parent households headed by women, were particularly at risk of food insecurity. For example, in 2017-18, 9 per cent of all households suffered from food insecurity, while 25 per cent of woman-headed lone parent households faced moderate to severe food insecurity.
Gender Results Framework
Gender Equality and Diversity in Canada
-

Gender-Based Violence and Access to Justice
Early in the pandemic, federal consultations between the Department for Women and Gender Equality and frontline organizations, provinces and territories and Members of Parliament found a 20 to 30 per cent increase in rates of gender-based violence and domestic violence in some regions of the country. Shelters are crucial to keeping survivors of abuse safe. However, even before the pandemic, many shelters were at capacity and forced to turn people away.
2.5 Ongoing Economic Disruptions
Amidst the resurgence of the virus, economic momentum has slowed considerably. With renewed restrictions around the country, consumer views on future economic conditions remain subdued relative to pre-crisis levels (Charts 2.23 and 2.24).
Bloomberg-Nanos Expectations Index and Retail Sales

Monthly Real GDP Growth

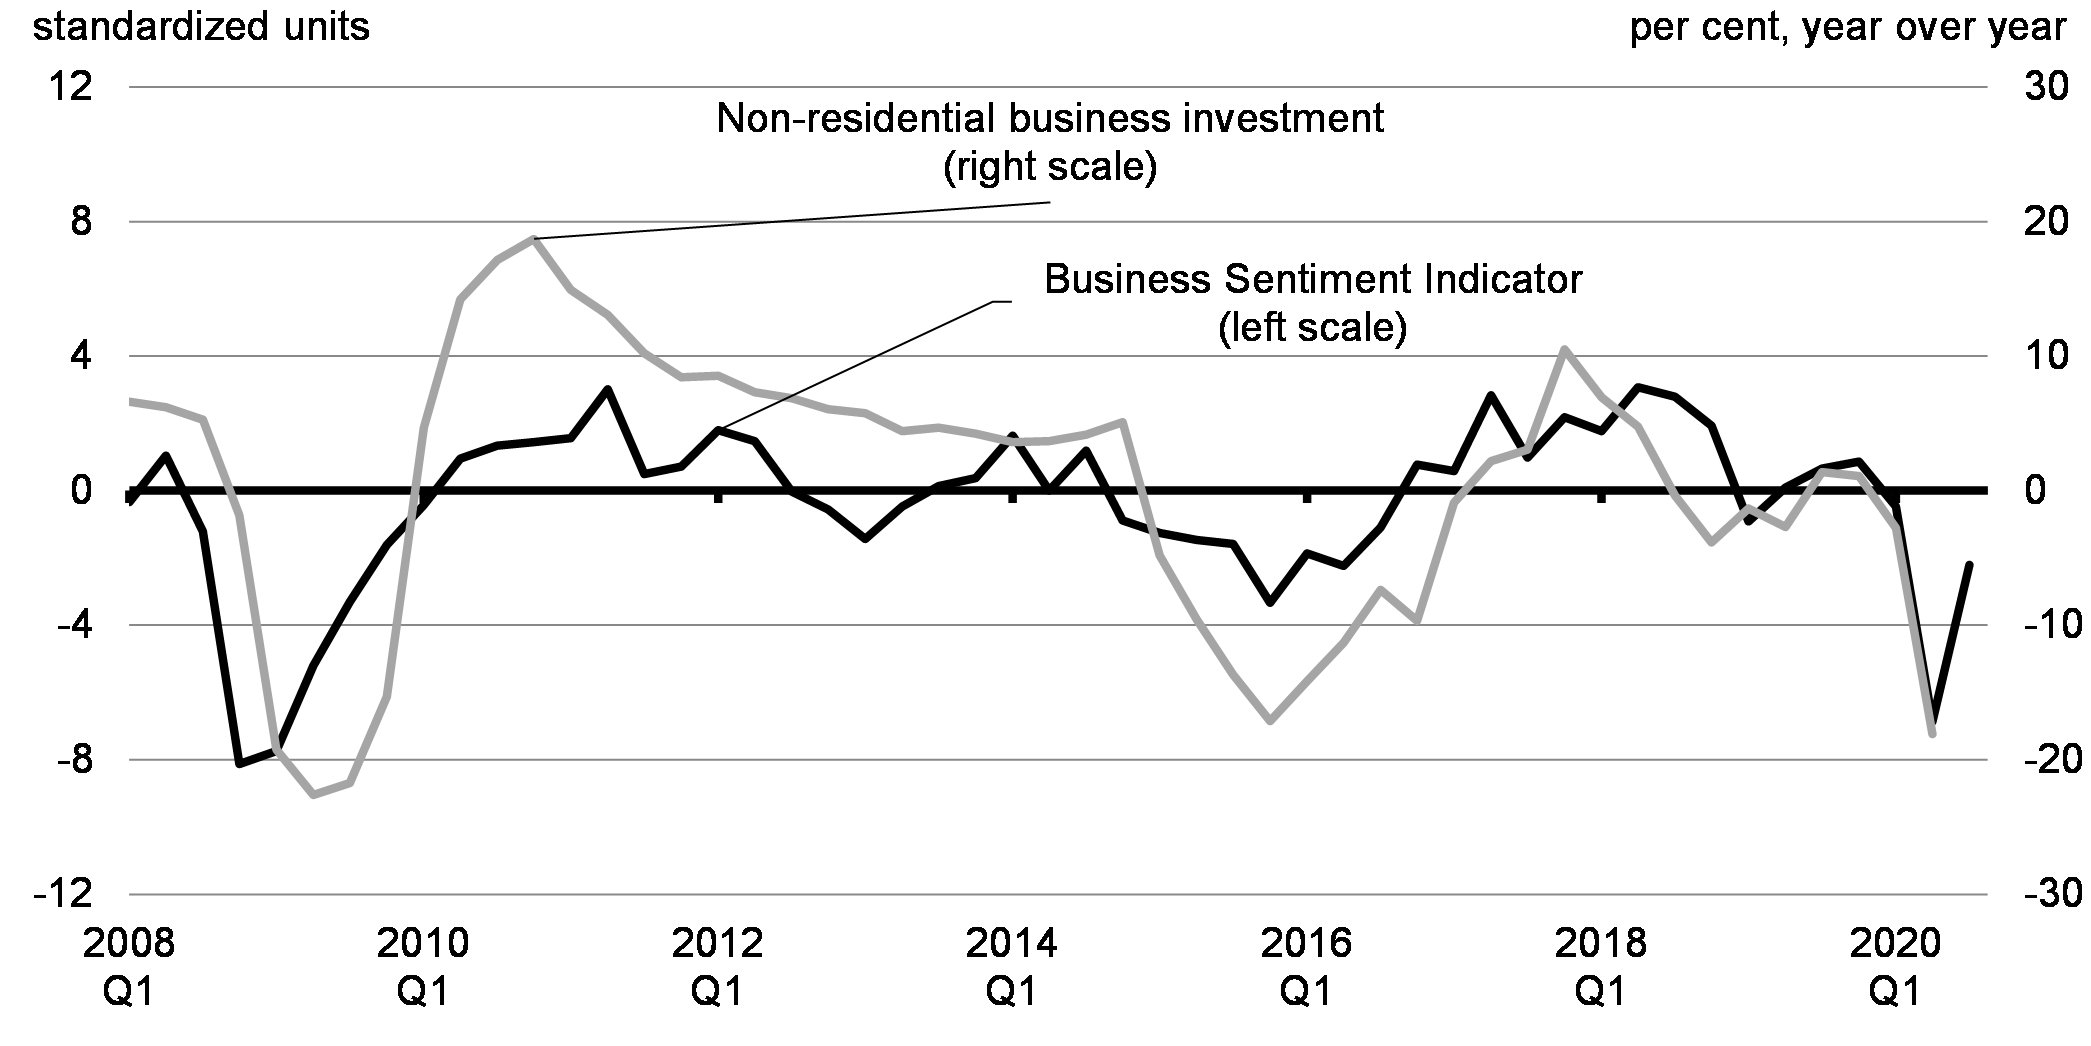
Beyond Canada, a sharp resurgence in COVID-19 cases is also occurring in several major international economies, particularly many European countries where there are now varying degrees of lockdown restrictions. Cases are also surging across the U.S. The uncertainty over the severity and duration of these resurgences, and their economic effects is weighing on business sentiment, placing downward pressure on business investment (Chart 2.25).
Bank of Canada’s Business Outlook Survey Indicator and the Year-over-Year Change in Non-Residential Business Investment
2.5.1 Changing Consumer Behaviour is Moving Businesses Online
The pandemic has resulted in substantial shifts in what Canadians are buying as a result of closures and reduced capacity in some sectors, as well as a general increase in physical distancing by Canadians. This is evident in debit-card payments data, which shows that Canadians continue to spend less on goods and services where physical distancing is difficult, such as live entertainment and travel, while they are spending more on other retail goods, such as groceries and furniture (Chart 2.26). Work-related spending has also fallen, including spending on transport and fuel, as more people work from home.
Canadians are increasingly shopping online, with e-commerce sales more than doubling at the peak of the pandemic last spring (Chart 2.27). Some of this increase in e-commerce is likely to be maintained once the crisis passes, as Canadians are now in the habit of shopping online and businesses have invested in their online capabilities.
Gender Results Framework
Gender Equality and Diversity in Canada
-
Leadership and Democratic Participation
According to the Canadian Survey on Business Conditions, businesses that were majority-owned by women (14 per cent), Indigenous peoples (14 per cent), immigrants (17 per cent), and visible minorities (15 per cent) were more likely to report that they will very likely permanently adopt increased online sales capacity once the pandemic is over than the aggregate (12 per cent), while businesses that were majority-owned by persons with a disability (7 per cent) or members of LGBTQ2 communities (10 per cent) were less likely to report a high likelihood of permanent adoption.
Interac Payments Data
Retail E-Commerce Sales

2.5.2 Workers Are Feeling Uneven Impacts
While Canada’s labour force participation rate has shown a strong rebound, gains in employment remain uneven, with sectors like accommodation, food services, transportation and retail facing second wave impacts and remaining below pre-pandemic levels, and women, racialized Canadians, low-income workers and young people still facing disproportionate impacts.
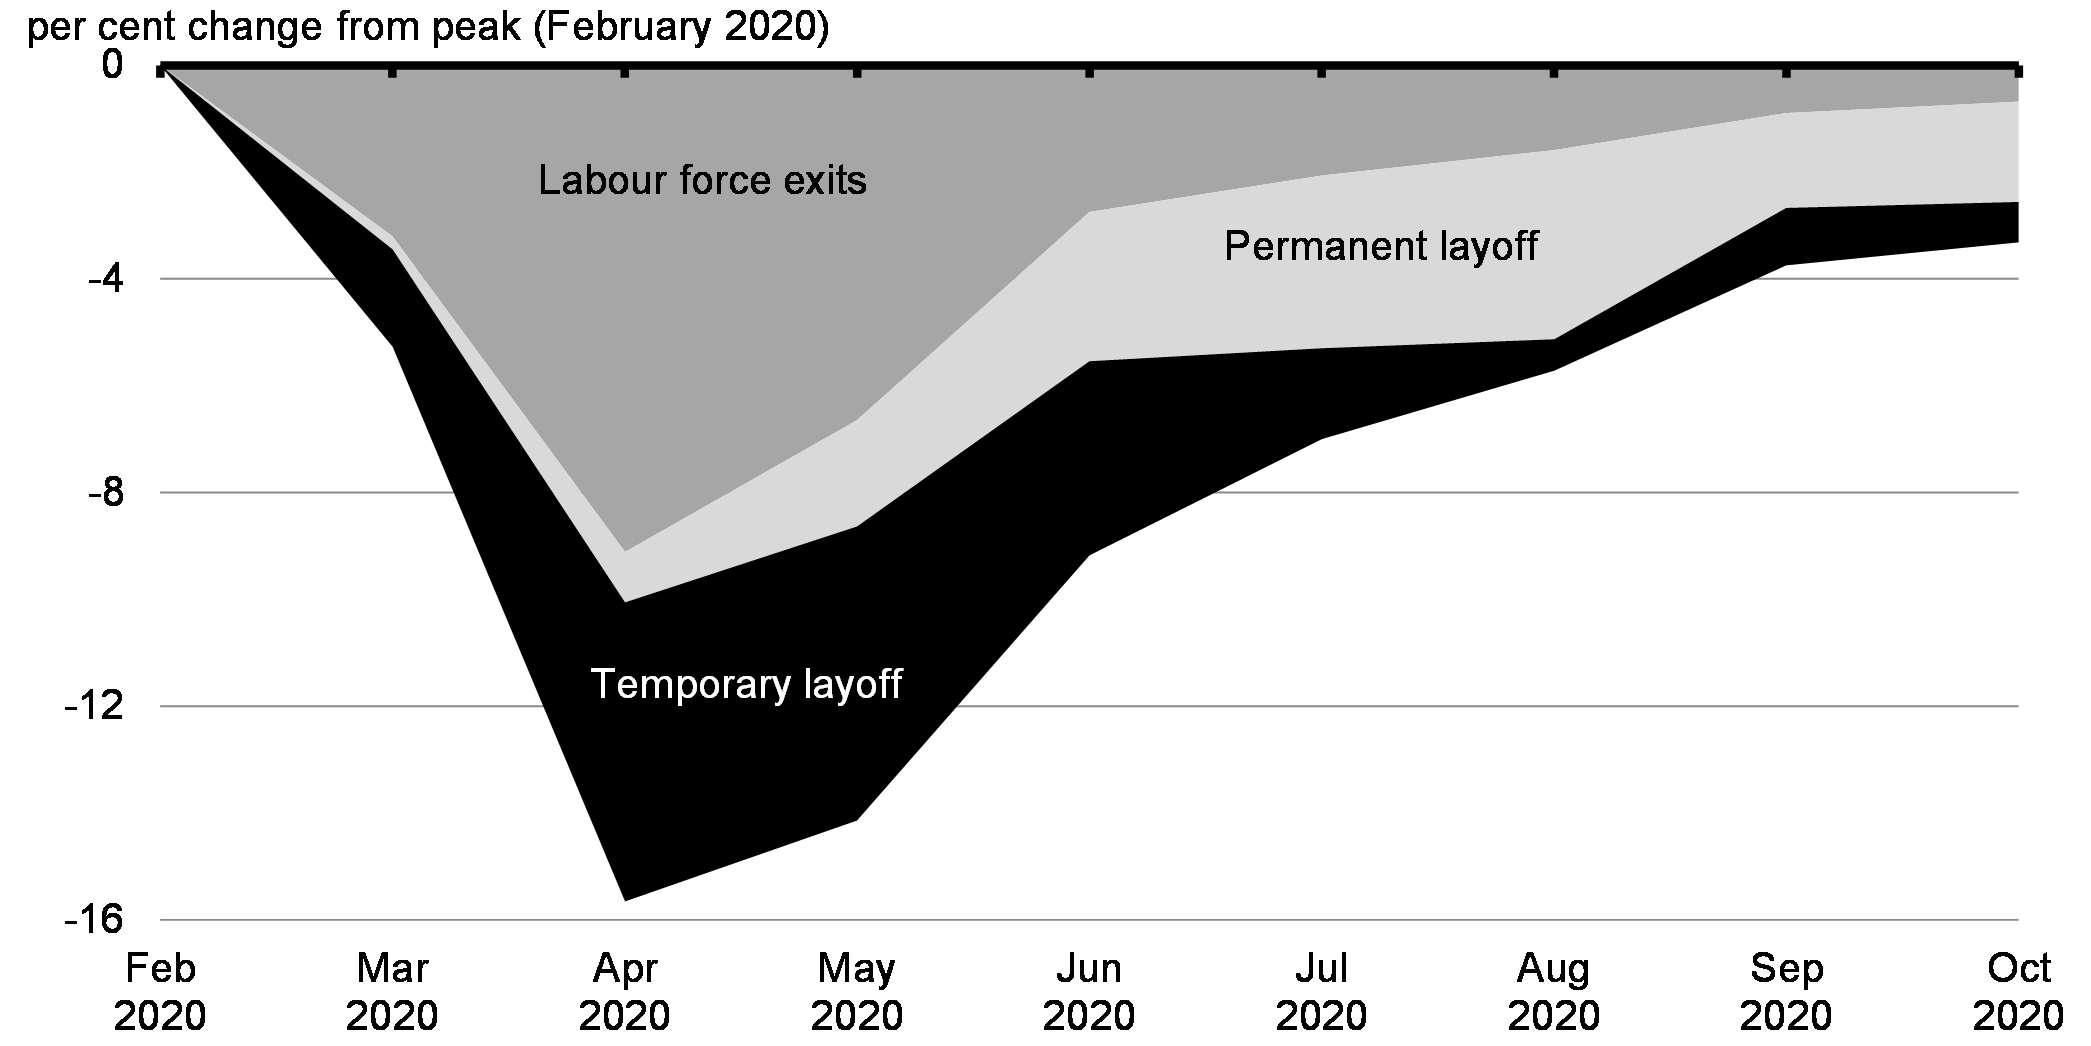
The pace of gains has slowed. The monthly pace of GDP growth slowed in September and the number of Canadians who have permanently lost their jobs has been rising (Chart 2.28). Canada’s level of economic activity and employment remain well below pre-pandemic levels. In particular, the share of employed Canadians remains about 2 and a half percentage points lower than in February. As of October, 636,000 net job losses remain. Moreover, roughly 433,000 additional Canadians worked less than half their regular hours in October relative to February, 90 per cent of whom worked zero hours during the survey reference week, despite being technically employed. Employment among lower-income individuals has fallen more severely compared to middle- to higher-income individuals.
Employment Losses Since February
2.5.3 Unemployment Demographics Have Diverged from Previous Recessions
Compared to previous recessions Canada is seeing more women, younger Canadians and recent immigrants who are unemployed. This is in part due to the fact that the most affected sectors are more likely to employ Canadians from these groups. The longer these sectors face a COVID-19-related downturn, the lower these workers’ labour force attachment is, making it more difficult to find new jobs.
Change in the Labour Force Participation Rate, February to October 2020

Unemployment Rate by Visible Minority Group, October 2020

Women in particular were hit harder and recovered later. Some women, including low-income women, racialized women, and Indigenous women, felt these effects even more.
In March, women’s employment was down by 7 per cent, while men’s was down by 4 per cent. In April, as the pandemic worsened, employment losses magnified to 17 per cent for women and 15 per cent for men. With the reopening in spring, both men and women made employment gains, but men returned closer to pre-pandemic levels, with losses of 8 per cent, compared to women’s 11 per cent. It was only in September that the gap closed significantly, with employment losses sitting about 4 per cent relative to pre-pandemic levels for both men and women. Greater impacts on women also extend to earning losses and number of hours worked.
Young people have experienced some of the greatest job losses and reductions in working hours, which can have a long-term impact on earning potential. At the trough of the recession in April, youth employment declined by more than a third relative to February, while an additional one in four young people lost all or the majority of their usual hours worked. Additionally, the unemployment rate for visible minority youth aged 15-24 years (26 per cent in October 2020) remains higher than that for their counterparts (15 per cent).
Although labour market impacts among Indigenous peoples and non-Indigenous Canadians were similar early in the pandemic, recovery has been slower among Indigenous peoples, with employment in October still down by more than 4 percent relative to February level, compared to just 1.5 percent for non-Indigenous Canadians.
Women who earn low-wages faced larger employment losses between February and April than men who earn low-wages (41 per cent versus 34 per cent). For young women, employment in October was down 11 per cent relative to February 2020 levels, compared to 9 per cent for young men, 4 per cent for all women and 3 per cent for all men.
Gender Results Framework
Gender Equality and Diversity in Canada
-
Economic Participation and Prosperity
Although there are many factors that have resulted in a greater labour market impact from COVID-19 on women, the closure of child care centres and schools at the start of the pandemic represented a significant barrier for women’s economic participation, as it greatly increased the amount of unpaid work in the home, disproportionately carried out by women. This likely affected employed women’s job performance for those teleworking, as well as unemployed women’s ability to return to work or find work. The slower recovery of mothers’ hours worked provides some evidence of the impact of the closure of child care centres. For example, in October, hours worked for fathers with children aged under 6 years had nearly returned to pre-COVID levels, while mothers with children of the same age group were still 6 percentage points below.
Change in Hours Worked for Mothers and Fathers with Youngest Child Aged 0-5 Years, February 2020 to October 2020

“As we face this crisis, as we get ready to rebuild, we will continue to be there for you.”
| Net Fiscal Impact (Accrual) | |||||||||
|---|---|---|---|---|---|---|---|---|---|
| COVID-19 Economic Response Plan – Direct Support Measures | Impact Value1 | 2019– 2020 | 2020– 2021 | 2021– 2022 | 2022– 2023 | 2023– 2024 | 2024– 2025 | 2025– 2026 | Included in or Announced: |
| 2.1.1 Canada Emergency Wage Subsidy | 83,540 | - | 83,540 | 16,185 | - | - | - | - | |
| Canada Emergency Wage Subsidy – March 15 to December 19 Estimate | |||||||||
| Estimated cost in 2020 Snapshot | 82,300 | - | 82,300 | - | - | - | - | - | Policy Action Included in the July 2020 Snapshot |
| Revised October Estimate | 68,750 | - | 68,750 | - | - | - | - | - | Policy Action Announced since the July 2020 Snapshot |
| Difference | -13,550 | - | -13,550 | - | - | - | - | - | Policy Action Announced since the July 2020 Snapshot |
| Canada Emergency Wage Subsidy Extension | 14,790 | - | 14,790 | - | - | - | - | - | New in this Fall Economic Statement |
| Provisional Estimate for Canada Emergency Wage Subsidy and Canada Emergency Rent Subsidy for April to June 2021 | 16,225 | - | - | 16,225 | - | - | - | - | New in this Fall Economic Statement |
| 2.1.2 Enhancements to Employment Insurance | 9,506 | - | 3,129 | 6,376 | 709 | -1 | -1 | -1 | |
| Temporary Changes to EI to Improve Access | 9,501 | - | 3,124 | 6,377 | 710 | - | - | - | Policy Action Announced since the July 2020 Snapshot |
| Amount included in 2020 Snapshot | 5 | - | 5 | -1 | -1 | -1 | -1 | -1 | Policy Action Included in the July 2020 Snapshot |
| 2.1.3 Canada Recovery Benefits | 23,007 | - | 12,672 | 10,335 | - | - | - | - | |
| Canada Recovery Benefit | 9,725 | - | 6,295 | 3,430 | - | - | - | - | Policy Action Announced since the July 2020 Snapshot |
| Canada Recovery Sickness Benefit | 4,960 | - | 2,580 | 2,380 | - | - | - | - | Policy Action Announced since the July 2020 Snapshot |
| Less: Amount Provided for Sick Leave through the Safe Restart Agreement | -1,100 | - | -1,100 | - | - | - | - | - | Policy Action Announced since the July 2020 Snapshot |
| Canada Recovery Caregiving Benefit | 9,422 | - | 4,897 | 4,525 | - | - | - | - | Policy Action Announced since the July 2020 Snapshot |
| 2.1.4 & 2.1.5 Canada Emergency Rent Subsidy and Lockdown Support | 4,360 | - | 4,360 | - | - | - | - | - | |
| Canada Emergency Rent Subsidy | 2,180 | - | 2,180 | - | - | - | - | - | Policy Action Announced since the July 2020 Snapshot |
| Canada Emergency Rent Subsidy and Lockdown Support Extension | 2,180 | - | 2,180 | - | - | - | - | - | New in this Fall Economic Statement |
| 2.1.6 Canada Emergency Business Account | 13,750 | - | 14,558 | - | - | - | - | - | |
| Canada Emergency Business Account - Incentive (2020 Snapshot) | |||||||||
| Estimated cost in 2020 Snapshot | 13,750 | - | 13,455 | - | - | - | - | - | Policy Action Included in the July 2020 Snapshot |
| Re-estimated cost in this Statement | 7,279 | - | 7,279 | - | - | - | - | - | Policy Action Announced since the July 2020 Snapshot |
| Difference | -6,471 | - | -6,176 | - | - | - | - | - | Policy Action Announced since the July 2020 Snapshot |
| Additional Investments Since the 2020 Snapshot | 7,279 | - | 7,279 | - | - | - | - | - | Policy Action Announced since the July 2020 Snapshot |
| 2.1.8 Regional Relief and Recovery Fund | 2,065 | 0 | 1,374 | 88 | 0 | 0 | 0 | 0 | |
| Investments in 2020 Snapshot | 962 | 0 | 747 | - | - | - | - | - | Policy Action Included in the July 2020 Snapshot |
| Additional Investments Since the 2020 Snapshot | 600 | - | 459 | - | - | - | - | - | Policy Action Announced since the July 2020 Snapshot |
| Additional Investments in this Statement | 500 | - | 165 | 88 | - | - | - | - | New in this Fall Economic Statement |
| Support for Economic Development in the North | 3 | - | 3 | - | - | - | - | - | New in this Fall Economic Statement |
| 2.1.10 Support for Workers in the Live Events and Arts Sectors | 322 | 0 | 140 | 186 | 4 | 0 | 0 | 0 | |
| Support for Workers in the Live Events and Arts Sectors | 182 | - | 182 | - | - | - | - | New in this Fall Economic Statement | |
| Supporting Canada’s Broadcasting System | |||||||||
| Investments in 2020 Snapshot | 30 | - | 30 | - | - | - | - | - | Policy Action Included in the July 2020 Snapshot |
| Additional Investments Since 2020 Snapshot | 5 | - | 5 | - | - | - | - | - | Policy Action Announced since the July 2020 Snapshot |
| Investments in this Statement | 50 | 50 | - | - | - | - | - | New in this Fall Economic Statement | |
| Support for the National Film Board | 5 | - | 5 | - | - | - | - | - | Policy Action Announced since the July 2020 Snapshot |
| Support for the Audiovisual Industry | 50 | - | 50 | - | - | - | - | - | Policy Action Announced since the July 2020 Snapshot |
| 2.1.11 Air Sector | 1,028 | - | 388 | 540 | 227 | 96 | 64 | 1 | |
| Regional Air Transportation Initiative | 206 | 50 | 156 | - | - | - | - | New in this Fall Economic Statement | |
| Airports Capital Assistance Program | 93 | - | - | 93 | 93 | - | - | - | New in this Fall Economic Statement |
| Support for Critical Infrastructure at Large Airports | 205 | - | 0 | 205 | 133 | 95 | 64 | 1 | New in this Fall Economic Statement |
| Airport Rent Relief | 227 | - | 7 | 21 | 1 | 1 | - | - | New in this Fall Economic Statement |
| Support for Airport Authorities | 65 | - | - | 65 | - | - | - | - | New in this Fall Economic Statement |
| Support for the Air Transportation Sector (2020 Snapshot) | 331 | - | 331 | - | - | - | - | - | Policy Action Included in the July 2020 Snapshot |
| 2.1.12 Support for Innovative Businesses | 535 | -3 | 413 | 97 | 97 | 10 | 10 | 10 | |
| Strategic Innovation Fund | 110 | - | - | 97 | 97 | 10 | 10 | 10 | New in this Fall Economic Statement |
| Targeted Extension of the Innovation Assistance Program | 155 | - | 155 | - | - | - | - | - | Policy Action Announced since the July 2020 Snapshot |
| Support for Early Stage Companies (2020 Snapshot) | 250 | - | 250 | - | - | - | - | - | Policy Action Included in the July 2020 Snapshot |
| Support for Young Entrepreneurs (2020 Snapshot) | 20 | -3 | 8 | - | - | - | - | - | Policy Action Included in the July 2020 Snapshot |
| 2.4.1 Protecting Jobs | 5,505 | - | 5,505 | - | - | - | - | - | |
| 10% Temporary Wage Subsidy | |||||||||
| Estimated cost in 2020 Snapshot | 2,080 | - | 2,080 | - | - | - | - | - | Policy Action Included in the July 2020 Snapshot |
| Re-estimated cost in this Statement | 2,505 | - | 2,505 | - | - | - | - | - | Policy Action Announced since the July 2020 Snapshot |
| Difference | 425 | - | 425 | - | - | - | - | - | Policy Action Announced since the July 2020 Snapshot |
| Wage Top-up for Essential Workers | |||||||||
| Estimated cost in 2020 Snapshot | 3.000 | - | 3,000 | - | - | - | - | - | Policy Action Included in the July 2020 Snapshot |
| 2.4.2.1 Canada Emergency Response Benefit | 83,033 | 6,505 | 76,528 | - | - | - | - | - | |
| Estimated cost in 2020 Snapshot | 80,000 | 7,375 | 72,625 | - | - | - | - | - | Policy Action Included in the July 2020 Snapshot |
| Re-estimated cost in this Statement | 74,560 | 6,505 | 68,055 | - | - | - | - | - | Policy Action Announced since the July 2020 Snapshot |
| Difference | -5,440 | -870 | -4,570 | - | - | - | - | - | Policy Action Announced since the July 2020 Snapshot |
| Additional funding since 2020 Snapshot | 8,000 | - | 8,000 | - | - | - | - | - | Policy Action Announced since the July 2020 Snapshot |
| Administration costs | 473 | - | 473 | - | - | - | - | - | Policy Action Announced since the July 2020 Snapshot |
| 2.4.2.1 Canada Emergency Student Benefit | 3,010 | - | 3,010 | - | - | - | - | - | |
| Estimated cost in 2020 Snapshot | 5,250 | - | 5,250 | - | - | - | - | - | Policy Action Included in the July 2020 Snapshot |
| Re-estimated cost in this Statement | 3,010 | - | 3,010 | - | - | - | - | - | Policy Action Announced since the July 2020 Snapshot |
| Difference | -2,240 | - | -2,240 | - | - | - | - | - | Policy Action Announced since the July 2020 Snapshot |
| Administration Costs (included in original estimate) | 40 | - | 20 | 20 | 7 | 5 | 4 | - | Policy Action Included in the July 2020 Snapshot |
| 2.4.3 Support for Canada’s Businesses | 7,271 | - | 6,212 | 600 | 279 | 109 | 91 | 53 | |
| Canada Emergency Commercial Rent Assistance (CECRA) for Small Business | 1,654 | - | 1,654 | - | - | - | - | - | Policy Action Announced since the July 2020 Snapshot |
| Estimated cost in 2020 Snapshot | 2,974 | - | 2,974 | - | - | - | - | - | Policy Action Included in the July 2020 Snapshot |
| Less: Estimated Provincial Contribution in 2020 Snapshot | -569 | - | -569 | - | - | - | - | - | Policy Action Included in the July 2020 Snapshot |
| Re-estimated cost in this Statement | 2,161 | - | 2,161 | - | - | - | - | - | Policy Action Announced since the July 2020 Snapshot |
| Less: Re-estimated estimate of Provincial Contribution in this Statement | -507 | - | -507 | - | - | - | - | - | Policy Action Announced since the July 2020 Snapshot |
| Difference | -751 | - | -751 | - | - | - | - | - | Policy Action Announced since the July 2020 Snapshot |
| Support for Local Indigenous Businesses and Economies (2020 Snapshot) | 133 | - | 133 | - | - | - | - | - | Policy Action Included in the July 2020 Snapshot |
| Financial Relief for First Nations through the First Nations Finance Authority (2020 Snapshot) | 17 | - | 17 | - | - | - | - | - | Policy Action Included in the July 2020 Snapshot |
| Support for Indigenous Businesses and Aboriginal Financial Institutions (2020 Snapshot) | 307 | - | 217 | - | - | - | - | - | Policy Action Included in the July 2020 Snapshot |
| Support for Main Street Businesses | 47 | - | 46 | 1 | - | - | - | - | Policy Action Announced since the July 2020 Snapshot |
| Other Support for Businesses in the 2020 Snapshot | |||||||||
| Women Entrepreneurship Strategy – Ecosystem Top-up | 16 | - | 16 | - | - | - | - | - | Policy Action Included in the July 2020 Snapshot |
| Granville Island Emergency Relief Fund | 17 | - | 17 | - | - | - | - | - | Policy Action Included in the July 2020 Snapshot |
| Advertising Campaign: Government of Canada's COVID-19 Economic Response Plan | 10 | - | 10 | - | - | - | - | - | Policy Action Included in the July 2020 Snapshot |
| COVID-19 Communications and Marketing | 50 | - | 50 | - | - | - | - | - | Policy Action Included in the July 2020 Snapshot |
| Wage Support for Staff of the Non-Public Funds, Canadian Forces | 6 | - | 6 | - | - | - | - | - | Policy Action Included in the July 2020 Snapshot |
| Support for Food Inspection Services | 20 | - | 20 | - | - | - | - | - | Policy Action Included in the July 2020 Snapshot |
| Support for Cultural, Heritage and Sport Organizations | 500 | - | 500 | - | - | - | - | - | Policy Action Included in the July 2020 Snapshot |
| Support for Canada’s National Museums | 26 | - | 26 | - | - | - | - | - | Policy Action Included in the July 2020 Snapshot |
| Support for Canada’s National Arts Centre | 18 | - | 18 | - | - | - | - | - | Policy Action Included in the July 2020 Snapshot |
| Cleaning up Former Oil and Gas Wells | 1,720 | - | 1,520 | - | - | - | - | - | Policy Action Included in the July 2020 Snapshot |
| Emissions Reduction Fund for the Oil and Gas Sector | 750 | - | 182 | 182 | - | - | - | - | Policy Action Included in the July 2020 Snapshot |
| Supporting Canada’s Farmers, Food Businesses, and Food Supply | 453 | - | 253 | - | - | - | - | - | Policy Action Included in the July 2020 Snapshot |
| Support for Fish and Seafood Processors | 63 | - | 63 | - | - | - | - | - | Policy Action Included in the July 2020 Snapshot |
| Support for Canada’s Fish Harvesters | 469 | - | 469 | - | - | - | - | - | Policy Action Included in the July 2020 Snapshot |
| Support for Canada’s Academic Research Community | 450 | - | 450 | - | - | - | - | - | Policy Action Included in the July 2020 Snapshot |
| Support for the Federal Bridge Corporation Limited | 3 | - | 3 | 0- | - | - | - | - | Policy Action Included in the July 2020 Snapshot |
| Other Support for Businesses Since the 2020 Snapshot | |||||||||
| Support for Workers in the Newfoundland and Labrador Offshore Energy Sector | 320 | - | 320 | - | - | - | - | - | Policy Action Announced since the July 2020 Snapshot |
| Ensuring Access to Canada Revenue Agency Call Centres | 99 | - | 99 | - | - | - | - | - | Policy Action Announced since the July 2020 Snapshot |
| Canada Revenue Agency Funding for COVID-19 Economic Measures | 124 | - | 124 | 417 | 279 | 109 | 91 | 53 | Policy Action Announced since the July 2020 Snapshot |
| 2.4.4 Helping Vulnerable Canadians | 15,665 | 108 | 14,894 | 631 | -30 | -30 | -30 | -30 | |
| Enhanced GST Credit (2020 Snapshot) | 5,515 | - | 5,515 | - | - | - | - | - | Policy Action Included in the July 2020 Snapshot |
| Enhanced Canada Child Benefit (2020 Snapshot) | 1,997 | - | 1,997 | - | - | - | - | - | Policy Action Included in the July 2020 Snapshot |
| One-Time Payment for seniors eligible for Old Age Security (OAS) and the Guaranteed Income Supplement (GIS) | |||||||||
| Estimated cost in 2020 Snapshot | 2,509 | - | 2,509 | - | - | - | - | - | Policy Action Included in the July 2020 Snapshot |
| Re-estimated cost in this Statement | 2,456 | - | 2,456 | - | - | - | - | - | Policy Action Announced since the July 2020 Snapshot |
| Difference | -54 | - | -54 | - | - | - | - | - | Policy Action Announced since the July 2020 Snapshot |
| Support for Persons with Disabilities | |||||||||
| Estimated cost in 2020 Snapshot | 573 | - | 572 | - | - | - | - | - | Policy Action Included in the July 2020 Snapshot |
| Additional funding since 2020 Snapshot | 303 | - | 291 | 11 | - | - | - | - | Policy Action Announced since the July 2020 Snapshot |
| Veterans Emergency Fund | 0.6 | - | 0.6 | - | - | - | - | - | New in this Fall Economic Statement |
| Other Measures in the 2020 Snapshot to Support Vulnerable Canadians: | |||||||||
| Support for the Homeless (through Reaching Home) | 158 | - | 158 | - | - | - | - | - | Policy Action Included in the July 2020 Snapshot |
| Expanding Existing Federal Employment, Skills Development, Student and Youth Programming | 1,008 | -17 | 1,024 | 6 | - | - | - | - | Policy Action Included in the July 2020 Snapshot |
| Canada Student Loan Moratorium | 190 | - | 190 | - | - | - | - | - | Policy Action Included in the July 2020 Snapshot |
| Enhancing Student Financial Assistance for Fall 2020 | 1,930 | - | 1,287 | 644 | - | - | - | - | Policy Action Included in the July 2020 Snapshot |
| Canada Student Service Grant (to be replaced with future programming) | 900 | - | 900 | - | - | - | - | - | Policy Action Included in the July 2020 Snapshot |
| Support for the On-Reserve Income Assistance Program | 270 | - | 270 | - | - | - | - | - | Policy Action Included in the July 2020 Snapshot |
| Support for Children and Youth | 8 | - | 8 | - | - | - | - | - | Policy Action Included in the July 2020 Snapshot |
| New Horizons for Seniors Program Expansion | 20 | - | 20 | - | - | - | - | - | Policy Action Included in the July 2020 Snapshot |
| Lower Registered Retirement Income Fund (RRIF) Minimum Withdrawal Amount | 495 | 125 | 365 | -30 | -30 | -30 | -30 | -30 | Policy Action Included in the July 2020 Snapshot |
| 2.4.5 Supporting Community Service Organizations | 699 | 1 | 650 | 25 | 19 | 24 | 18 | 0 | |
| Support for Veterans’ Organizations | 20 | - | 20 | - | - | - | - | - | Policy Action Announced since the July 2020 Snapshot |
| Emergency Community Support Fund (2020 Snapshot) | 350 | - | 350 | - | - | - | - | - | Policy Action Included in the July 2020 Snapshot |
| Support for Food Banks and Local Food Organizations ($25M of existing funding in 2019-20) (2020 Snapshot) | 100 | - | 75 | - | - | - | - | - | Policy Action Included in the July 2020 Snapshot |
| Support for Food Banks and Local Food Organizations | 100 | - | 100 | - | - | - | - | - | Policy Action Announced since the July 2020 Snapshot |
| Addressing Gender-Based Violence during COVID-19 | 50 | - | 50 | - | - | - | - | - | Policy Action Announced since the July 2020 Snapshot |
| Support for Women’s Shelters and Sexual Assault Centres, including in Indigenous Communities (2020 Snapshot) | 50 | - | 50 | - | - | - | - | - | Policy Action Included in the July 2020 Snapshot |
| Protecting and Supporting Indigenous Women and Girls Fleeing Violence (2020 Snapshot)2 | 29 | 1 | 5 | 25 | 19 | 24 | 18 | - | Policy Action Included in the July 2020 Snapshot |
| Other Direct Support Measures | 3,363 | - | 2,930 | 424 | 121 | 87 | 57 | 16 | |
| Supporting Provincial and Territorial Job Training Efforts as Part of COVID-19 Economic Recovery (Chapter 3) | 1,500 | - | 1,500 | - | - | - | - | - | Policy Action Announced since the July 2020 Snapshot |
| Labour Market Impact Assessment Refund (2020 Snapshot) | 4 | - | 4 | - | - | - | - | - | Policy Action Included in the July 2020 Snapshot |
| Rapid Housing Initiative (see Chapter 3) | 1,016 | 758 | 258 | - | - | - | - | Policy Action Announced since the July 2020 Snapshot | |
| Support for Safe Operation in the Forest Sector (Chapter 3) | 31 | - | 31 | - | - | - | - | - | Policy Action Announced since the July 2020 Snapshot |
| Support for Black Entrepreneurs and Business Owners (Chapter 3) | 40 | - | 10 | 30 | 34 | 19 | 0 | 34 | Policy Action Announced since the July 2020 Snapshot |
| Supporting Public Health Measures in Correctional Institutions | 172 | - | 148 | 15 | - | - | - | - | New in this Fall Economic Statement |
| Funding to address immediate Correctional Service of Canada operational pressures resulting from the COVID-19 pandemic. | |||||||||
| Parks Canada Revenue Replacement and Rent Relief (2020 Snapshot) | 74 | - | 74 | - | - | - | - | - | Policy Action Included in the July 2020 Snapshot |
| Parks Canada Revenue Replacement | 54 | - | 54 | - | - | - | - | - | New in this Fall Economic Statement |
| Funding to replace Parks Canada Agency revenue that is expected to be lost due to decreased visitation of the national parks, national marine conservation areas and national historic sites as a result of COVID-19 restrictions. | |||||||||
| Support for the National Capital Commission | 5 | - | 5 | - | - | New in this Fall Economic Statement | |||
| Funding for the National Capital Commission to offset reduced revenue caused by extending rent relief to local businesses due to COVID-19 pandemic restrictions. | |||||||||
| Public Services and Procurement Canada Program Integrity | 25 | - | 25 | - | - | - | - | - | New in this Fall Economic Statement |
| Funding for Public Services and Procurement Canada to continue service delivery to federal departments and agencies despite reduced revenue due to COVID-19, and to support employee safety during the pandemic. | |||||||||
| Supporting the Ongoing Delivery of Key Benefits | 31 | - | 26 | 4 | - | - | - | - | New in this Fall Economic Statement |
| Funding for Employment and Social Development Canada to support frontline service delivery, including through the safe reopening of in-person Service Canada Centres. Funding will support delivery of Old Age Security, Canada Pension Plan and Employment Insurance, including Work-Sharing Benefits. | |||||||||
| Improving Our Ability to Reach All Canadians | 32 | - | 16 | 16 | 16 | 16 | 16 | 16 | New in this Fall Economic Statement |
| Funding to Employment and Social Development Canada (ESDC) to help address workload pressures caused by COVID-19 and provide sustainable funding for 1-800 O-Canada and Canada.ca, and help to reduce barriers in accessing government services and benefits in northern and remote communities. | |||||||||
| Maintaining the Federal Government’s Legal Services Capacity | 46 | - | 46 | - | - | - | - | - | New in this Fall Economic Statement |
| Funding to Justice Canada to offset a revenue shortfall as a result of a lack of legal service fees charged to other government departments, due to reduced court operations in 2020-21. | |||||||||
| Supporting Court Operations and Access to Justice | 48 | - | 46 | 1 | 1 | 1 | - | - | New in this Fall Economic Statement |
| Funding provided to support federal court operations to enhance their technological capacity and adapt to physical distancing requirements. Funding will also increase the federal government's legal aid support for provinces and territories. | |||||||||
| Support Canada Emergency Response Benefit Payment Integrity | 98 | - | - | 98 | 70 | 51 | 41 | - | Policy Action Announced since the July 2020 Snapshot |
| Funding provided to Employment and Social Development Canada and the Canada Revenue Agency to increase the capacity to detect, investigate and address cases of fraud or misrepresentation related to the Canada Emergency Response Benefit. | |||||||||
| Funding for VIA Rail Canada Inc. | 188 | - | 188 | - | - | - | - | - | New in this Fall Economic Statement |
| Funding for VIA Rail Canada Inc. to cover operating shortfalls in 2020-21 resulting from the COVID-19 pandemic. | |||||||||
| Total – | |||||||||
| Policy Actions in the 2020 Economic and Fiscal Snapshot | 211,431 | 7,481 | 201,671 | 826 | -11 | -7 | -13 | -31 | Policy Action Included in the July 2020 Snapshot |
| Impact of re-estimated costs | -28,081 | -870 | -26,916 | - | - | - | - | - | Policy Action Announced since the July 2020 Snapshot |
| Policy Actions since the 2020 Economic and Fiscal Snapshot | 54,905 | - | 37,751 | 17,429 | 1,023 | 128 | 91 | 53 | Policy Action Announced since the July 2020 Snapshot |
| Less: Amounts Provisioned in the 2020 Snapshot for Anticipated Decisions | -3,994 | - | -3,432 | -562 | -301 | -53 | -56 | -52 | Policy Action Announced since the July 2020 Snapshot |
| New Investments in Chapter 2 – Supporting Canadians Through the Pandemic | 35,536 | - | 17,799 | 17,267 | 411 | 174 | 132 | 27 | New in this Fall Economic Statement |
| Total – COVID-19 Economic Response Plan – Direct Support Measures | 269,797 | 6,611 | 226,873 | 34,960 | 1,121 | 242 | 154 | -2 | |
| COVID-19 Economic Response Plan – Tax and Liquidity Support | Impact Value1 |
Net Fiscal Impact (Accrual) | |||||||
|---|---|---|---|---|---|---|---|---|---|
| 2019– 2020 |
2020– 2021 |
2021– 2022 |
2022– 2023 |
2023– 2024 |
2024– 2025 |
2025– 2026 |
Included in or Announced: | ||
| Tax and Customs Duty Payment Liquidity Support | 85,050 | 56 | 2,938 | 15 | -3 | -2 | - | - | |
| Income Tax, Sales Tax, and Customs Duty Payment Deferrals | 85,000 | - | 2,958 | - | - | - | - | - | Policy Action Announced since the July 2020 Snapshot |
| Personal Income Tax Deferral | 25,000 | Policy Action Announced since the July 2020 Snapshot | |||||||
| Business Income Tax Deferral | 30,000 | Policy Action Announced since the July 2020 Snapshot | |||||||
| Sales Tax Remittance and Customs Duty Payments Deferral | 30,000 | Policy Action Announced since the July 2020 Snapshot | |||||||
| Supporting Jobs and Safe Operations of Junior Mining Companies | 50 | 56 | -20 | 15 | -3 | -2 | - | - | Policy Action Announced since the July 2020 Snapshot |
| Business Credit Availability Program and Other Credit Liquidity Support | 83,400 | - | 6,355 | 4,689 | 1,951 | 555 | -273 | 191 | |
| Business Credit Availability Program | |||||||||
| Canada Emergency Business Account (CEBA) (not including 25% incentive) | |||||||||
| Estimated cost in 2020 Snapshot | 41,250 | - | - | - | - | - | - | - | Policy Action Included in the July 2020 Snapshot |
| Re-estimated cost in this Statement | 27,893 | - | - | - | - | - | - | - | Policy Action Announced since the July 2020 Snapshot |
| Difference | -13,357 | - | - | - | - | - | - | - | Policy Action Announced since the July 2020 Snapshot |
| Additional Investments Since the 2020 Snapshot | 10,307 | - | - | - | - | - | - | - | Policy Action Announced since the July 2020 Snapshot |
| Small- and Medium-sized Enterprise Loan Guarantee Program | 40,000 | - | - | - | - | - | - | - | Policy Action Announced since the July 2020 Snapshot |
| Mid-Market Guarantee and Financing Program | TBD3 | - | - | - | - | - | - | - | Policy Action Announced since the July 2020 Snapshot |
| Highly Affected Sectors Credit Availability Program | TBD3 | Policy Action Announced since the July 2020 Snapshot | |||||||
| Large Employer Emergency Financing Facility | TBD3 | - | - | - | - | - | - | - | Policy Action Announced since the July 2020 Snapshot |
| Support for the Agriculture and Agri-Food Sector (2020 Snapshot) | 5,200 | - | - | - | - | - | - | - | Policy Action Included in the July 2020 Snapshot |
| Total- | |||||||||
| Tax, Customs Duty Payment and Fee Deferrals | 85,050 | 56 | 2,938 | 15 | -3 | -2 | 0 | 0 | Policy Action Announced since the July 2020 Snapshot |
| BCAP and Other Credit and Liquidity Support | 83,400 | 0 | 6,355 | 4,689 | 1,951 | 555 | -273 | 191 | Policy Action Announced since the July 2020 Snapshot |
| Total - COVID-19 Economic Response Plan - Tax and Liquidity Support | 168,400 | 56 | 9,273 | 4,704 | 1,948 | 553 | -273 | 191 | |
| Other Liquidity Support and Capital Relief | |||||||||
| Credit and Liquidity Support through the Bank of Canada, CMHC and Commercial Lenders4 | 300,000 | - | - | - | - | - | - | - | Policy Action Announced since the July 2020 Snapshot |
| Capital Relief (OSFI Domestic Stability Buffer) | 300,000 | - | - | - | - | - | - | - | Policy Action Announced since the July 2020 Snapshot |
|
Note: Numbers may not add due to rounding. 1 The impact value reflects projected cash expenditures and liquidity support primarily in 2020-21 (some measures also include projected expenditures in 2019-20, and 2021-22). The fiscal (budgetary) impact on an accrual basis is lower, owing to cash-accrual accounting differences, the fact that some of these measures relate to loans, for which only provisions for potential losses would impact the balance, and tax deferrals, for which only foregone interest and penalties would affect the balance. 2 Funding profile has since been revised to $2M in 2020-21, $27M in 2021-22, $19M in 2022-23, $24M in 2023-24, $18M in 2024-25 and $11M in 2025-26. 3 Based on the amount of approved loans. 4 Figures represent lower bound estimates based upon announced credit and liquidity support to date. The accrual impact of these activities undertaken by the Bank of Canada and the Canada Mortgage and Housing Corporation to provide credit and liquidity support are reflected in the government's revenues from enterprise Crown corporations. |
|||||||||
| COVID-19 Economic Response Plan – Total | Impact Value1 |
Net Fiscal Impact (Accrual) | |||||||
|---|---|---|---|---|---|---|---|---|---|
| 2019– 2020 |
2020– 2021 |
2021– 2022 |
2022– 2023 |
2023– 2024 |
2024– 2025 |
2025– 2026 |
Included in or Announced: | ||
| Total – | |||||||||
| Policy Actions in the 2020 Economic and Fiscal Snapshot | 403,334 | 8,063 | 227,882 | 5,371 | 1,538 | 565 | -335 | 17 | Policy Action Included in the July 2020 Snapshot |
| Impact of re-estimated costs | -41,201 | -870 | -27,017 | 42 | -14 | -182 | -58 | 39 | Policy Action Announced since the July 2020 Snapshot |
| Policy Actions since the 2020 Economic and Fiscal Snapshot | 79,196 | 56 | 56,663 | 23,901 | 1,353 | 355 | 216 | 165 | Policy Action Announced since the July 2020 Snapshot |
| Less: Amounts Provisioned in the 2020 Snapshot for Anticipated Decisions | -3,994 | - | -4,785 | -562 | -301 | -53 | -56 | -52 | Policy Action Announced since the July 2020 Snapshot |
| New Investments in the 2020 Fall Economic Statement | 53,380 | - | 22,514 | 21,804 | 1,176 | 506 | 295 | 187 | New in this Fall Economic Statement |
| Total – COVID-19 Economic Response Plan | 490,716 | 7,249 | 275,227 | 50,566 | 3,751 | 1,189 | 62 | 356 | |
Report a problem on this page
- Date modified: