
Archived - Chapter 3
Building Back Better: A Plan to Conquer the COVID-19 Recession
3.1 The Threat of COVID-19 to Canada’s Long-term Economic Potential
Large economic shocks, like the COVID-19 pandemic, not only disrupt current incomes and economic activity, but they risk also having long-lasting effects on future economic prospects and Canadians’ well-being.
3.1.1 Impacts on Labour Markets
COVID-19 could pose long-lasting damage to Canadians’ job prospects. Workers who have been unemployed for some time may find it even more difficult to get a new job and stop actively searching for work (Chart 3.2). The hardest-hit sectors include hospitality and recreation, which employ many young people, new Canadians and lower-wage workers. COVID-19 and ongoing uncertainty around availability of child care could also increase the pressure on working mothers to stay home, partly offsetting decades of economic gains.
Gender Results Framework
Gender Equality and Diversity in Canada
-

Economic Participation and Prosperity
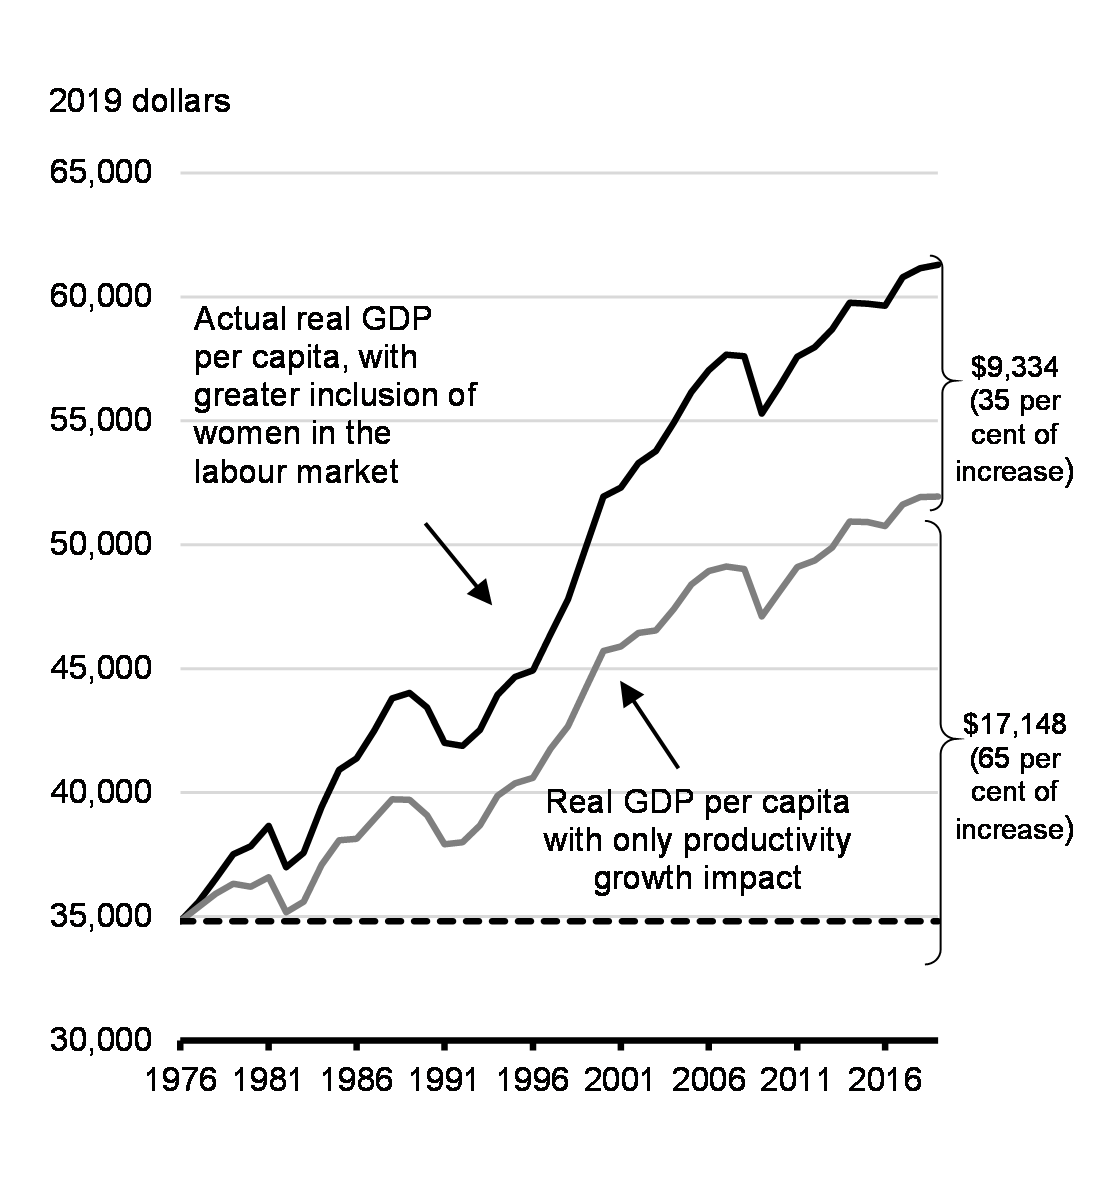
The rise in women’s labour force participation over the last 40 years or so has accounted for about a third of the rise in Canada’s real per capita gross domestic product (GDP), translating into over $9,000 per person.
The Impact of Women's Participation in the Workforce on Real GDP per Capita, 1976 to 2019
For racialized Canadians, higher unemployment, coupled with higher infection rates, will have long-term impacts on their ability to recover and re-enter the labour market.
To build back stronger, and set our course as a country for the years ahead, we need all Canadians to be able to contribute to their full potential in order to grow the economy.
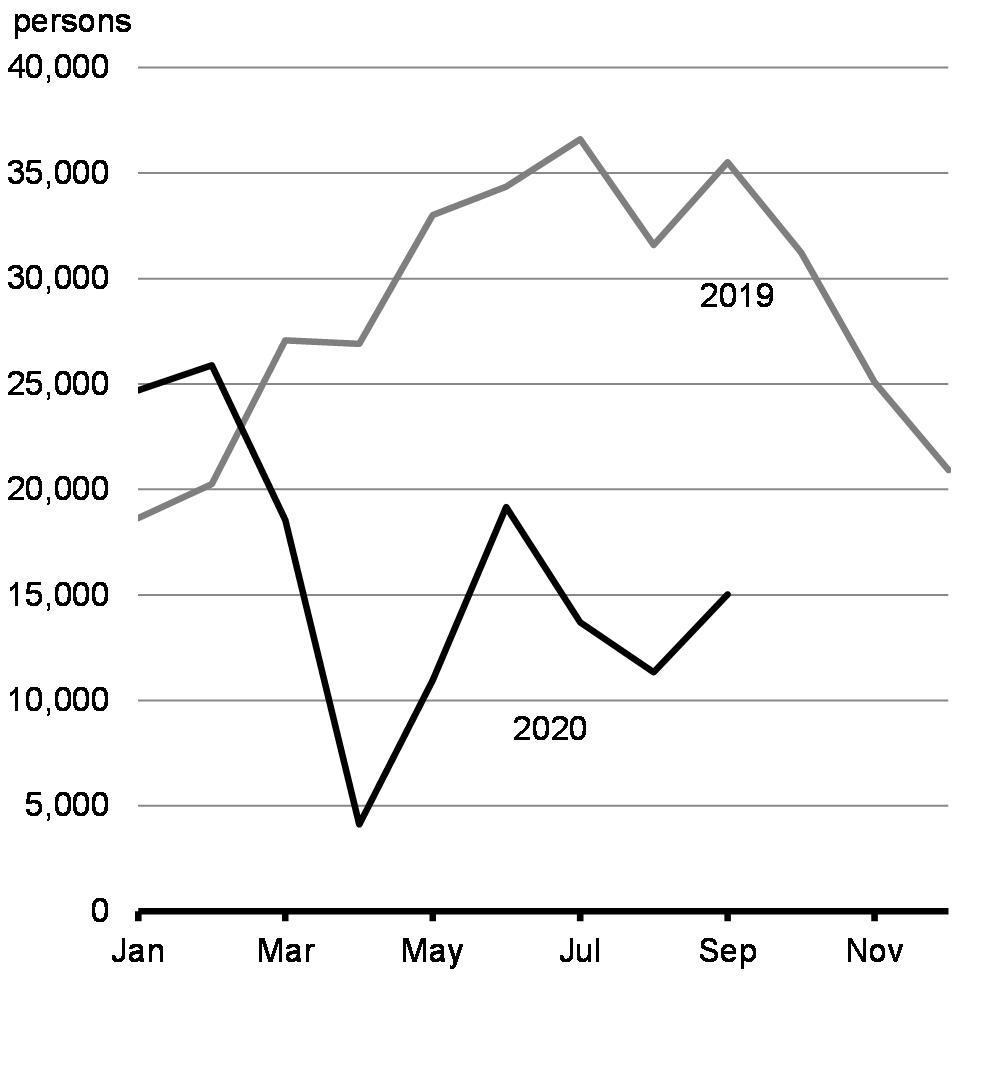
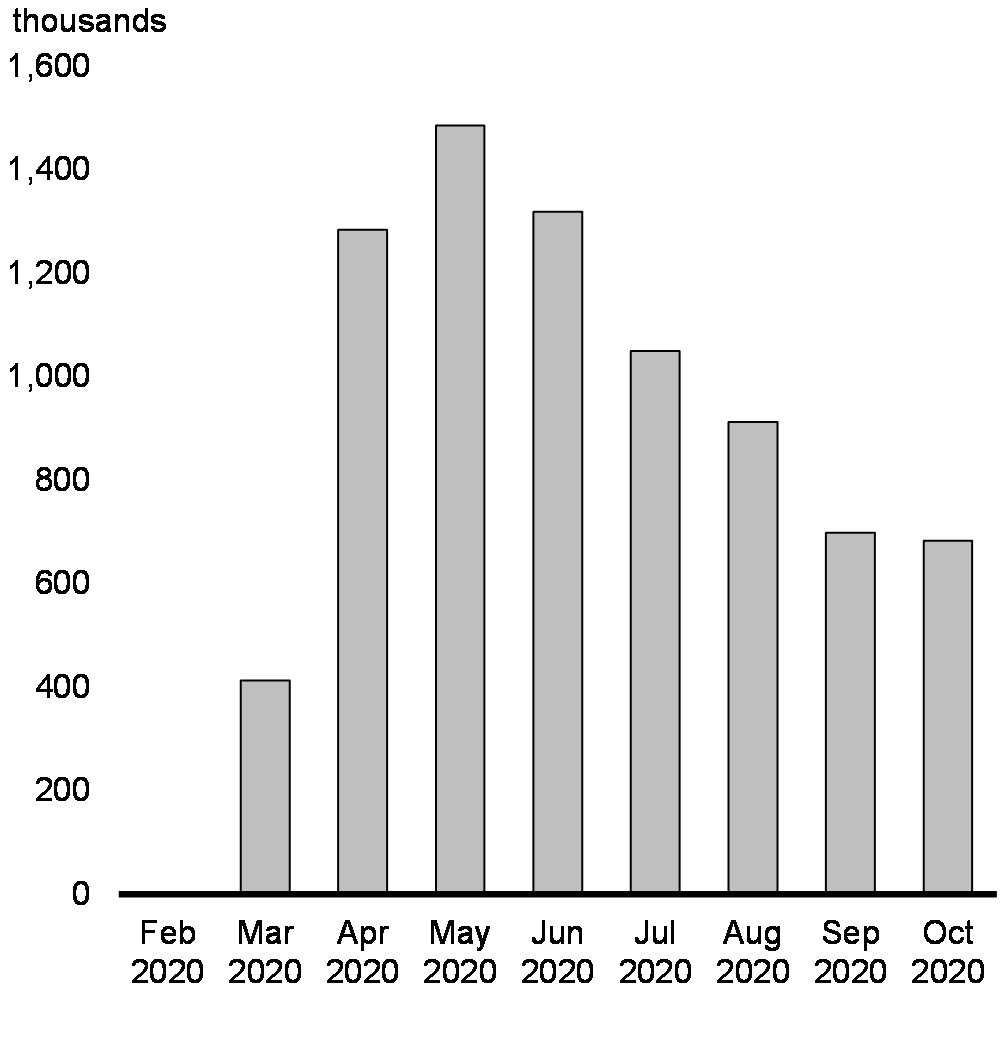
Further, Canada’s immigration intake, the most important source of Canada’s population and labour force growth, has been severely disrupted by travel restrictions and application delays due to COVID-19. In 2019, Canada admitted 341,175 permanent residents. In the first nine months of 2020, only 143,470 permanent residents arrived in Canada (Chart 3.3). New temporary immigration permits (e.g. working and student permits) granted up to August plummeted by 35 per cent compared with the same period in 2019. Lower immigration alone could potentially reduce Canada’s population growth to around 1 per cent this year, compared to growth of 1.4 per cent in both 2018 and 2019, reducing labour supply and economic growth.
Unemployment Rate
Canada Permanent Admissions
3.1.2 Impacts on Business Investment
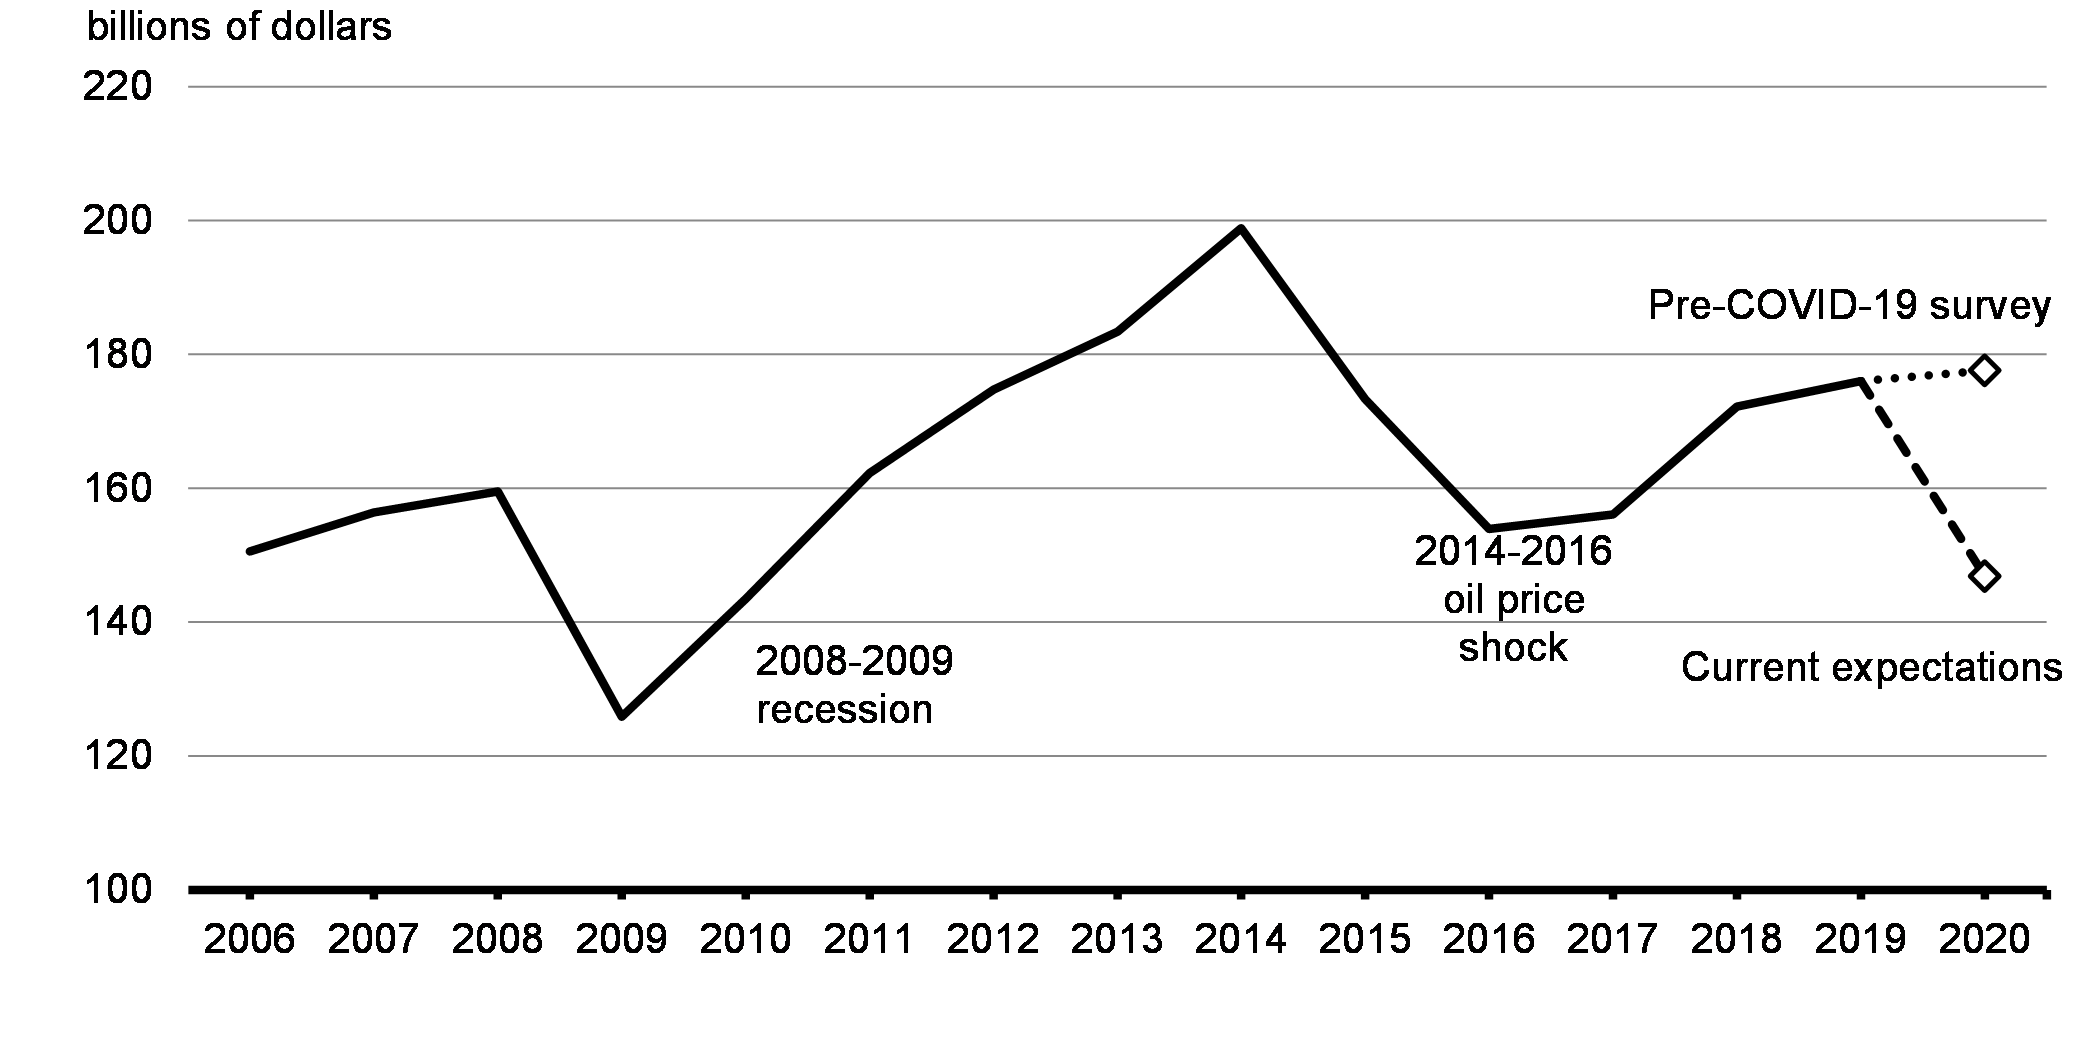
With persistent restrictions on activity and reduced demand for goods and services, some businesses are left with more capacity than needed. This is particularly the case in some parts of the economy where physical distancing is difficult and where a full reopening is unlikely until a vaccine is widely available (e.g. accommodation and food, and arts, entertainment and recreation industries). Greater uncertainty about short- to medium-term economic prospects as infection rates rise is also compounding the negative impact of reduced demand, inducing some businesses to delay or cancel planned investments. Businesses’ investment intentions have also declined significantly (Chart 3.4). A sustained period of lower business investment would weigh on Canada’s longer-term growth prospects.
Capital Investment Intentions of Canadian Companies
3.1.3 Uneven Impacts on Productivity
Lower business investment and a less intensive use of some capital assets resulting from capacity constraints may also slow technological progress and have negative implications for productivity growth. In some cases, changes to business processes have been necessary to mitigate the new threat of COVID-19. For example, many consumer-facing businesses have invested in creating safe and healthy environments for workers and customers by installing plastic screens and increasing the regularity of cleaning to reduce the risk of viral transmission. Some of these innovations reflect a new cost of doing business, reducing productivity in the near-term. Furthermore, if workers remain unemployed or underemployed for a protracted period, it could erode their job-specific knowledge and skills. This could further undermine Canada’s productivity growth, a key element supporting Canada’s future standard of living in our aging society. As we move into the recovery there may also be a different type of demand in certain sectors compared to prior to the pandemic. All economies will have to deal with these transitionary effects, while minimizing the challenges and costs for businesses and workers to adapt.
3.1.4 The Pandemic is Shifting the Global Energy Mix
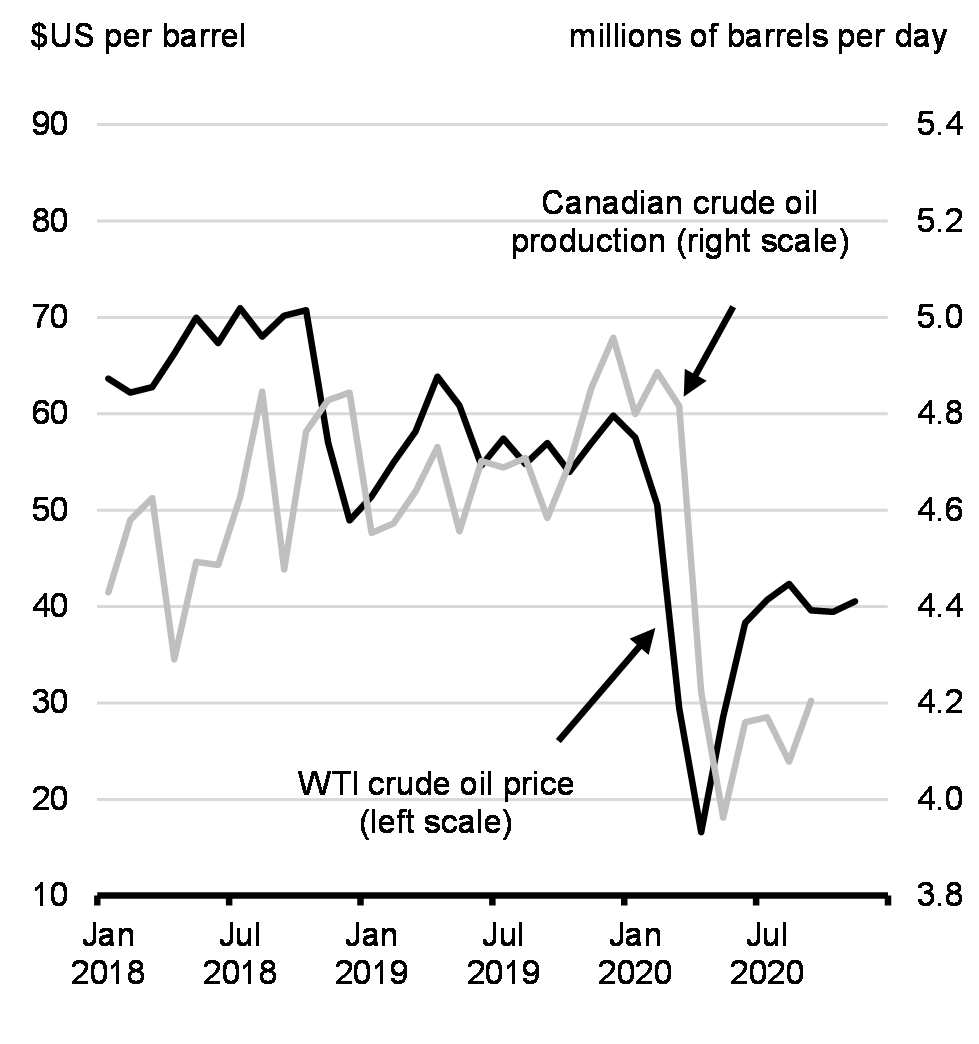
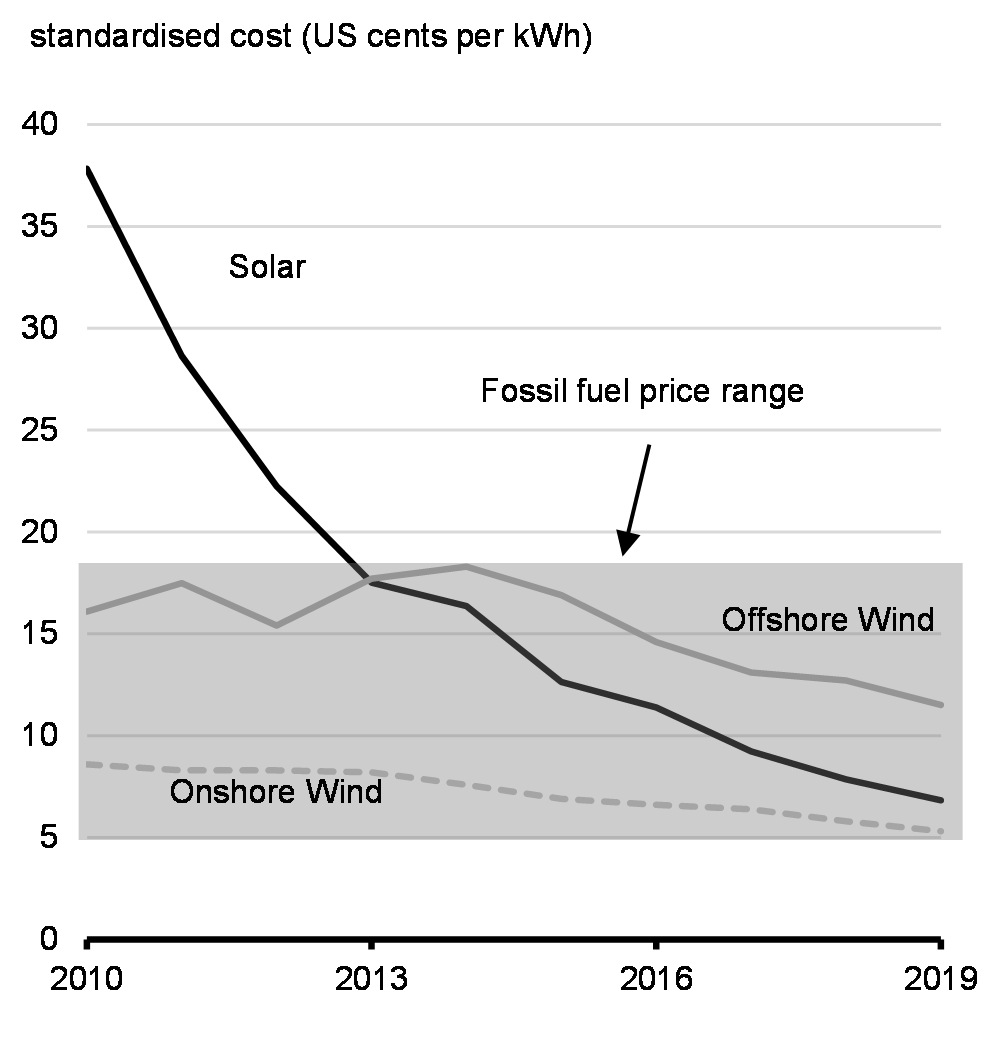
Canada’s energy sector is also being affected by the pandemic and broader global shifts. Crude oil exports remain well below pre-COVID-19 levels, as weak global demand – particularly in the oil-intensive transportation sector – continues to weigh on global oil prices and Canadian oil production and oil workers (Chart 3.5). Prospects are uncertain around the recovery in supply and demand related to the travel restrictions, the permanence of remote working, as well as the unwinding of supply cuts. Further, ongoing improvements in affordability for renewable energy sources, such as wind and solar generated electricity (Chart 3.6), are accelerating the transition towards low-carbon energy sources.
West Texas Intermediate (WTI) Crude Oil Price and Canadian Crude Oil Production
Cost of Renewable Energy vs Fossil Fuels
3.1.5 The Pandemic is Reshaping How Canadians Work and Live
The pandemic has meant a profound shift to working from home for many Canadians whose jobs can be done remotely, with many businesses rapidly pivoting to support remote work. The shift is helping slow the spread of COVID-19 by limiting the number of people congregating indoors.
The shift to remote work is presenting a unique opportunity for some businesses to advance and deploy long-awaited productivity-improving technologies, which could also be important for attracting and retaining highly skilled workers. For many businesses, however, this shift may not be possible or appropriate for all tasks. For some, it is a major logistical challenge, while for others, such as commercial real estate, public transit, and the many small local businesses, it has meant a loss of business at present, and significant uncertainty about their future.
Gender Results Framework
Gender Equality and Diversity in Canada
-

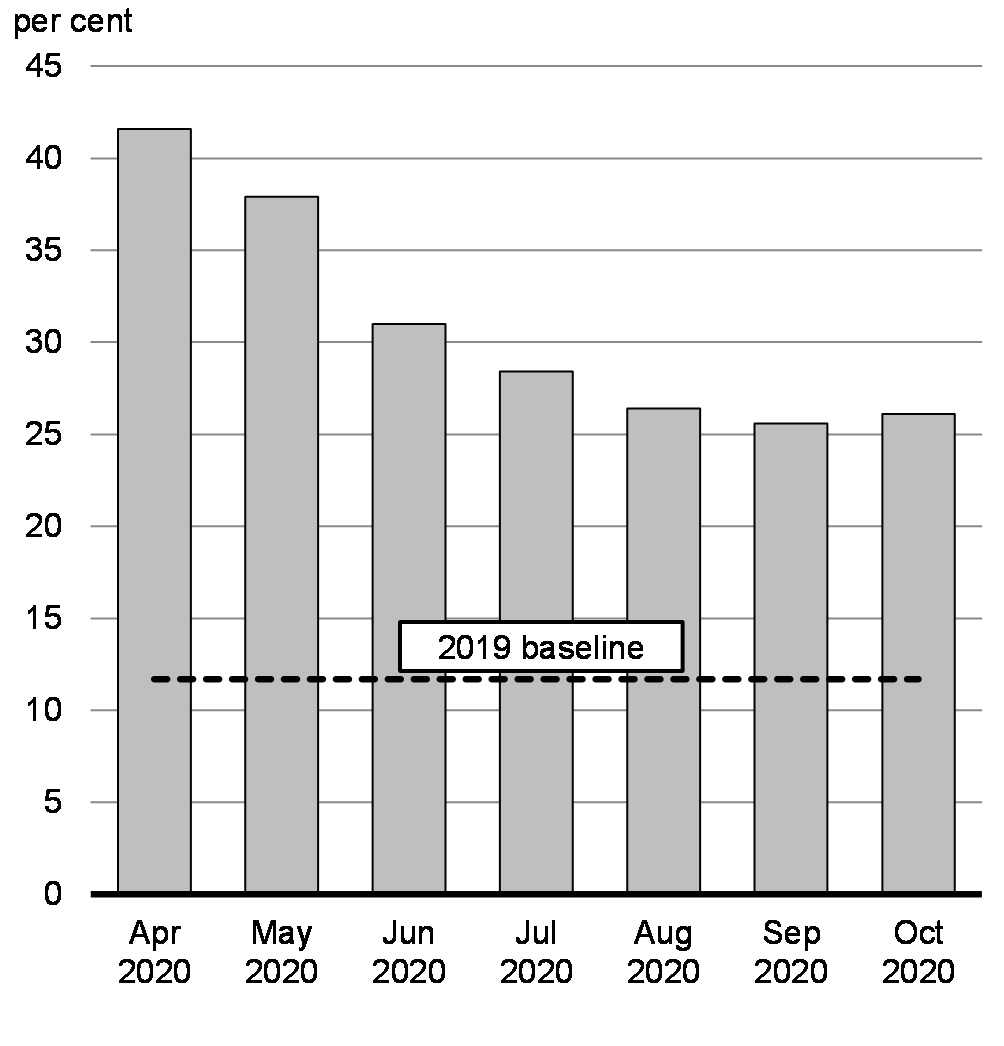
Leadership and Democratic Participation
Remote work requires that business owners be able to offer telework to their employees. According to the Canadian Survey on Business Conditions, 27 per cent of businesses where working remotely was a possibility for their employees had all employees working remotely on August 31, 2020. Of businesses where remote work was a possibility, businesses majority-owned by women (33 per cent), immigrants (41 per cent), members of LGBTQ2 communities (62 per cent) and visible minorities (44 per cent) were more likely to be working entirely remotely, while businesses majority-owned by Indigenous peoples (16 per cent) were less likely to have their entire workforce teleworking on August 31, 2020. Among businesses majority-owned by visible minorities where remote work was a possibility, there was substantial variation in the rate of teleworking: only 4 per cent of Arab-owned businesses were entirely remote, while 90 per cent of West Asian-owned businesses were entirely remote.
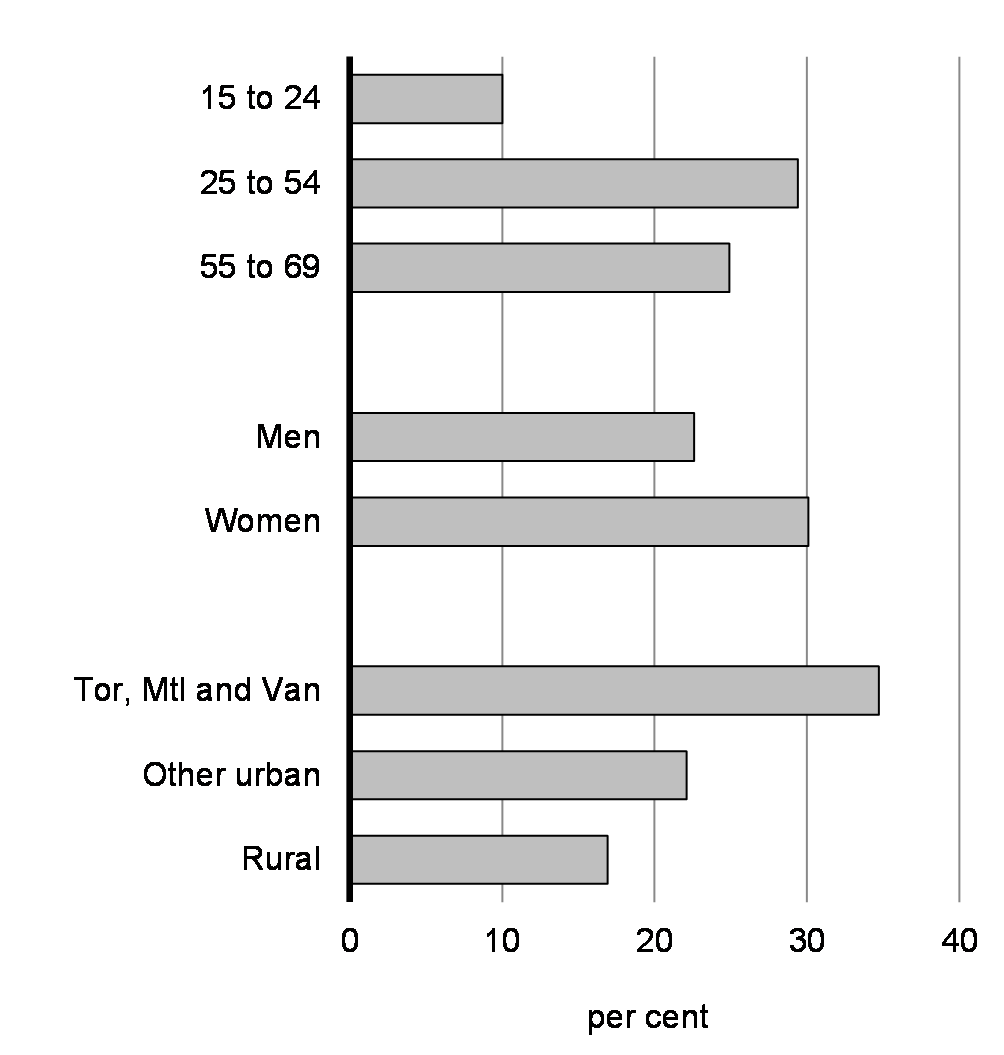
Remote work is out of reach for many Canadians, reflecting a range of barriers and generally lower feasibility for telework in lower-wage jobs and for some health care workers on the front lines of the pandemic. Adoption of remote work is much less common in rural areas, and for youth (Chart 3.7). A recent study from Statistics Canada found that financially vulnerable workers, including persons with lower educational attainment, and low-income families, are less likely to be found in jobs that can more easily be done from home.
Share Working Remotely, 2020
Share Working Remotely, by Age, Gender and Geography, October 2020
3.1.6 The Pandemic Could Leave Canada with Reduced Productive Capacity
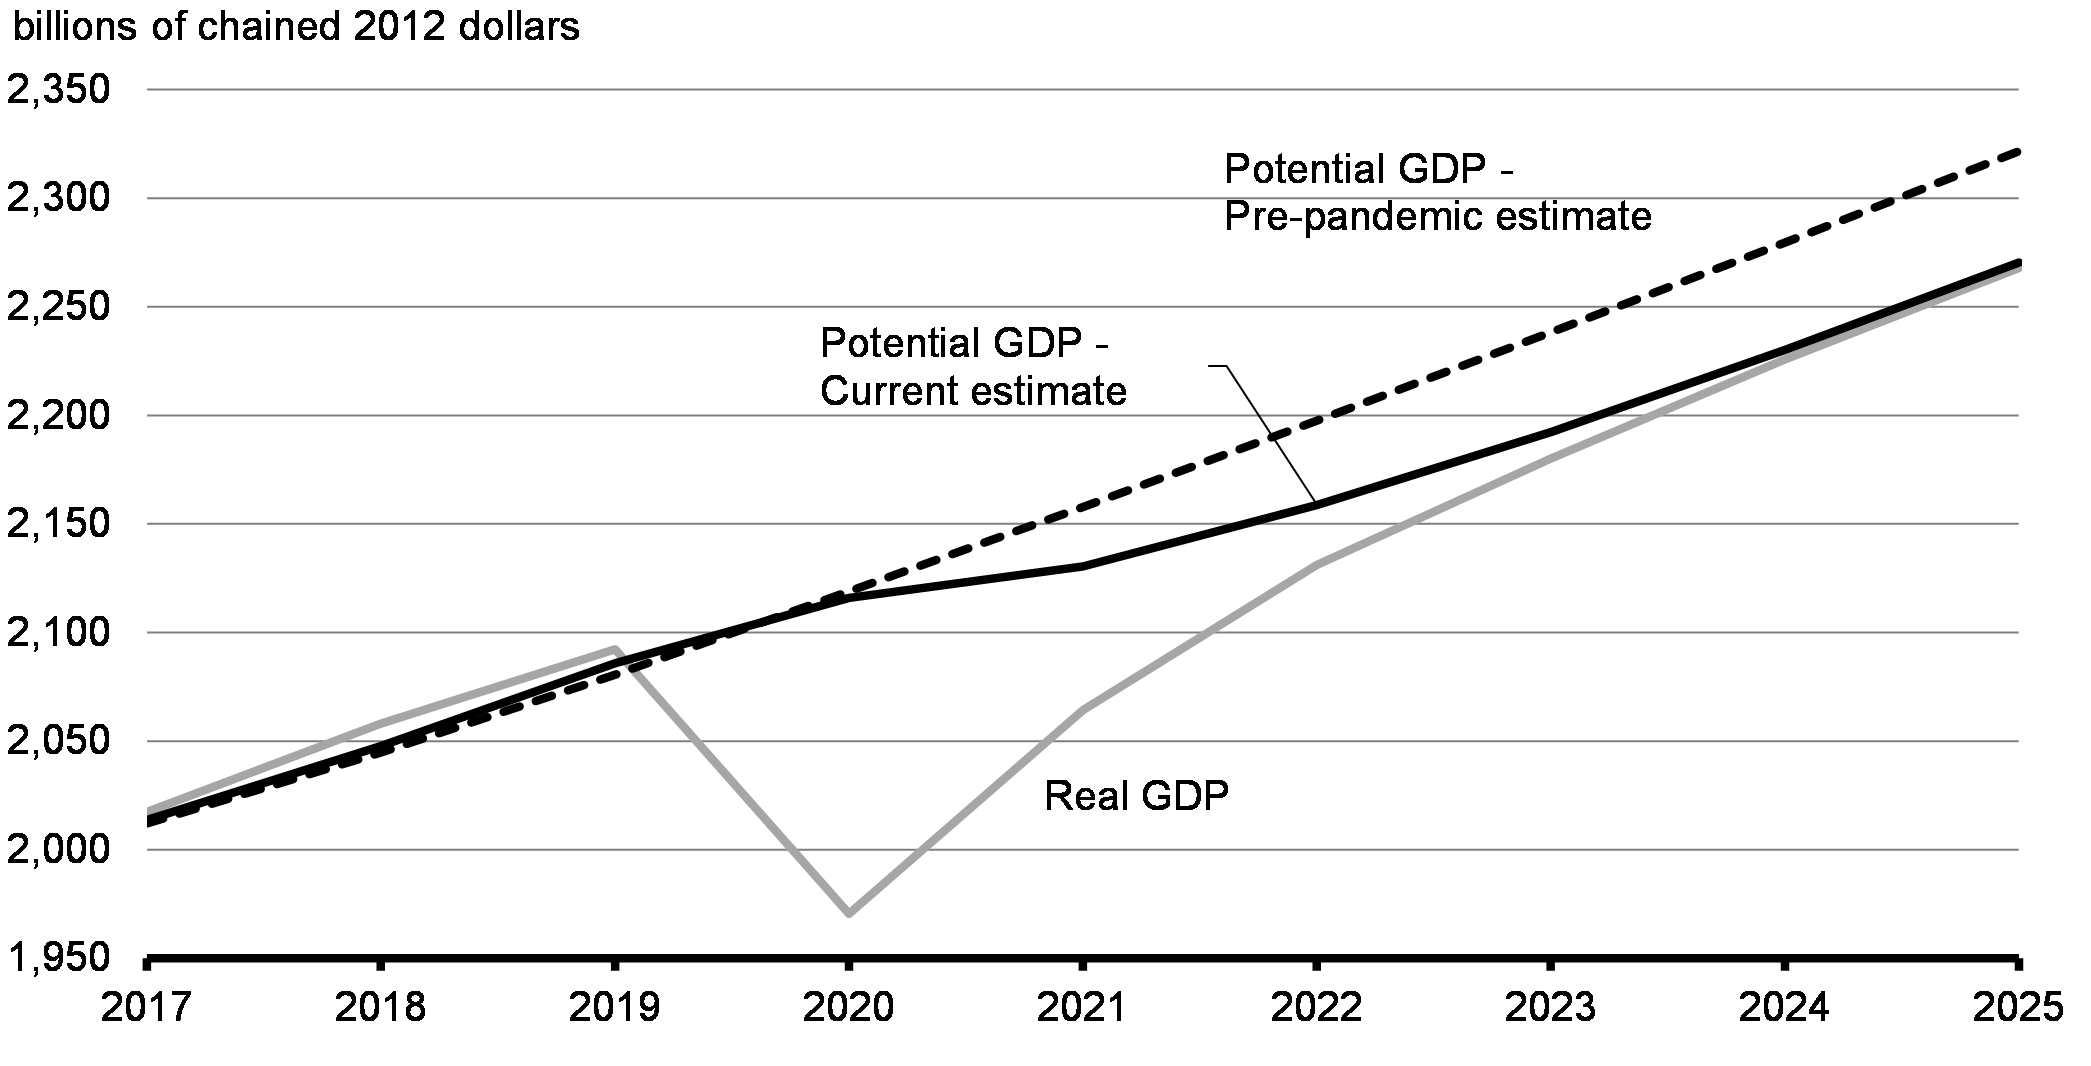
Canada’s potential economic growth could average around 1.4 per cent per year over the 2020-2025 period, compared to about 1.8 per cent before the crisis. Overall, the pandemic would be expected to lower potential GDP, from what it would have been without the pandemic, by about $50 billion by the end of 2025 – more than $2,000 on average for every Canadian aged 15 to 64 (Chart 3.9).
Revision to Potential GDP Estimate
3.2 A Plan to Fight the COVID-19 Recession
The government’s broad-based and ambitious suite of measures has been designed to protect Canadians’ health and safety, bridge Canada’s economy through the devastating effects of widespread lockdowns and cushion the pandemic’s impact on Canada’s longer-term prospects. Programs like the Canada Emergency Response Benefit, the Canada Emergency Wage Subsidy, and the broad continuum of tailored liquidity, credit and financing support for businesses of all sizes are working well to stave off mortgage defaults, business closures and other forms of long-term economic scarring. These programs are also working well to put Canada in a stronger position for a robust recovery, especially when compared to international peers. Overall, the government’s rapid and comprehensive supports have provided an unprecedented $407 billion (or nearly 19 per cent of GDP) in overall support to keep Canadians and Canadian businesses afloat, including $270 billion (or over 12 per cent of GDP) in direct support measures.
Federal government measures allowed Canada to fight the spread of COVID-19, while significantly minimizing the longer-term damage to the Canadian economy. Support provided by the Canada Emergency Wage Subsidy and other programs, such as those providing rent assistance, have allowed businesses to continue to pay workers and cover fixed costs even as revenue shortfalls persist. This is increasing the chance that they will survive and preserve jobs. Income support through the Canada Emergency Response Benefit, which covered millions of Canadian workers ineligible for other income supports, meant that Canadian workers were not forced to choose between public health directives and paying the bills. This stabilized overall demand for goods and services, removing the anxieties of consumers and businesses worried about being able to meet their basic needs and payments. In addition to direct effects, there are substantial indirect benefits for business and household confidence. This is consistent with international evidence that fiscal policy is likely to be more effective when the economy is operating well below its potential capacity, such as in recessions, and interest rates are low.
3.2.1 Fiscal Support Remains Necessary
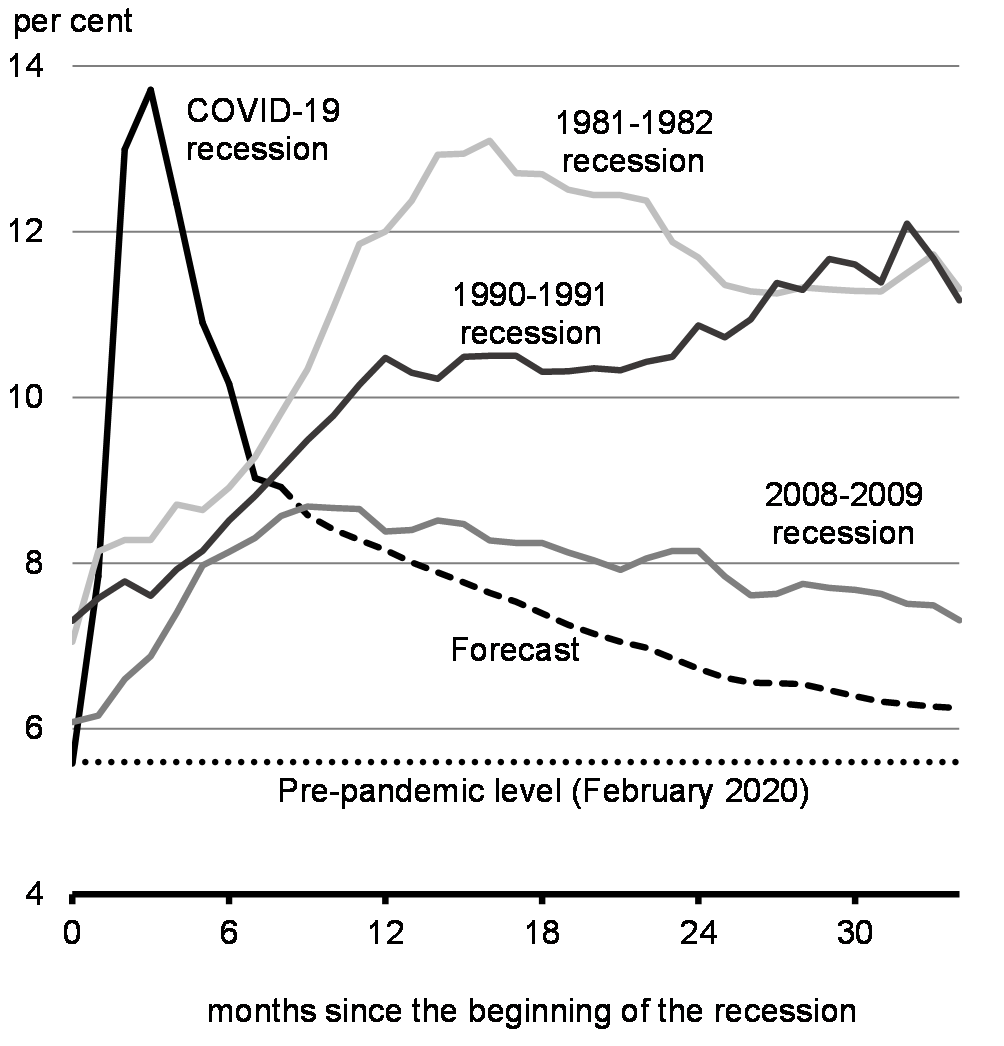
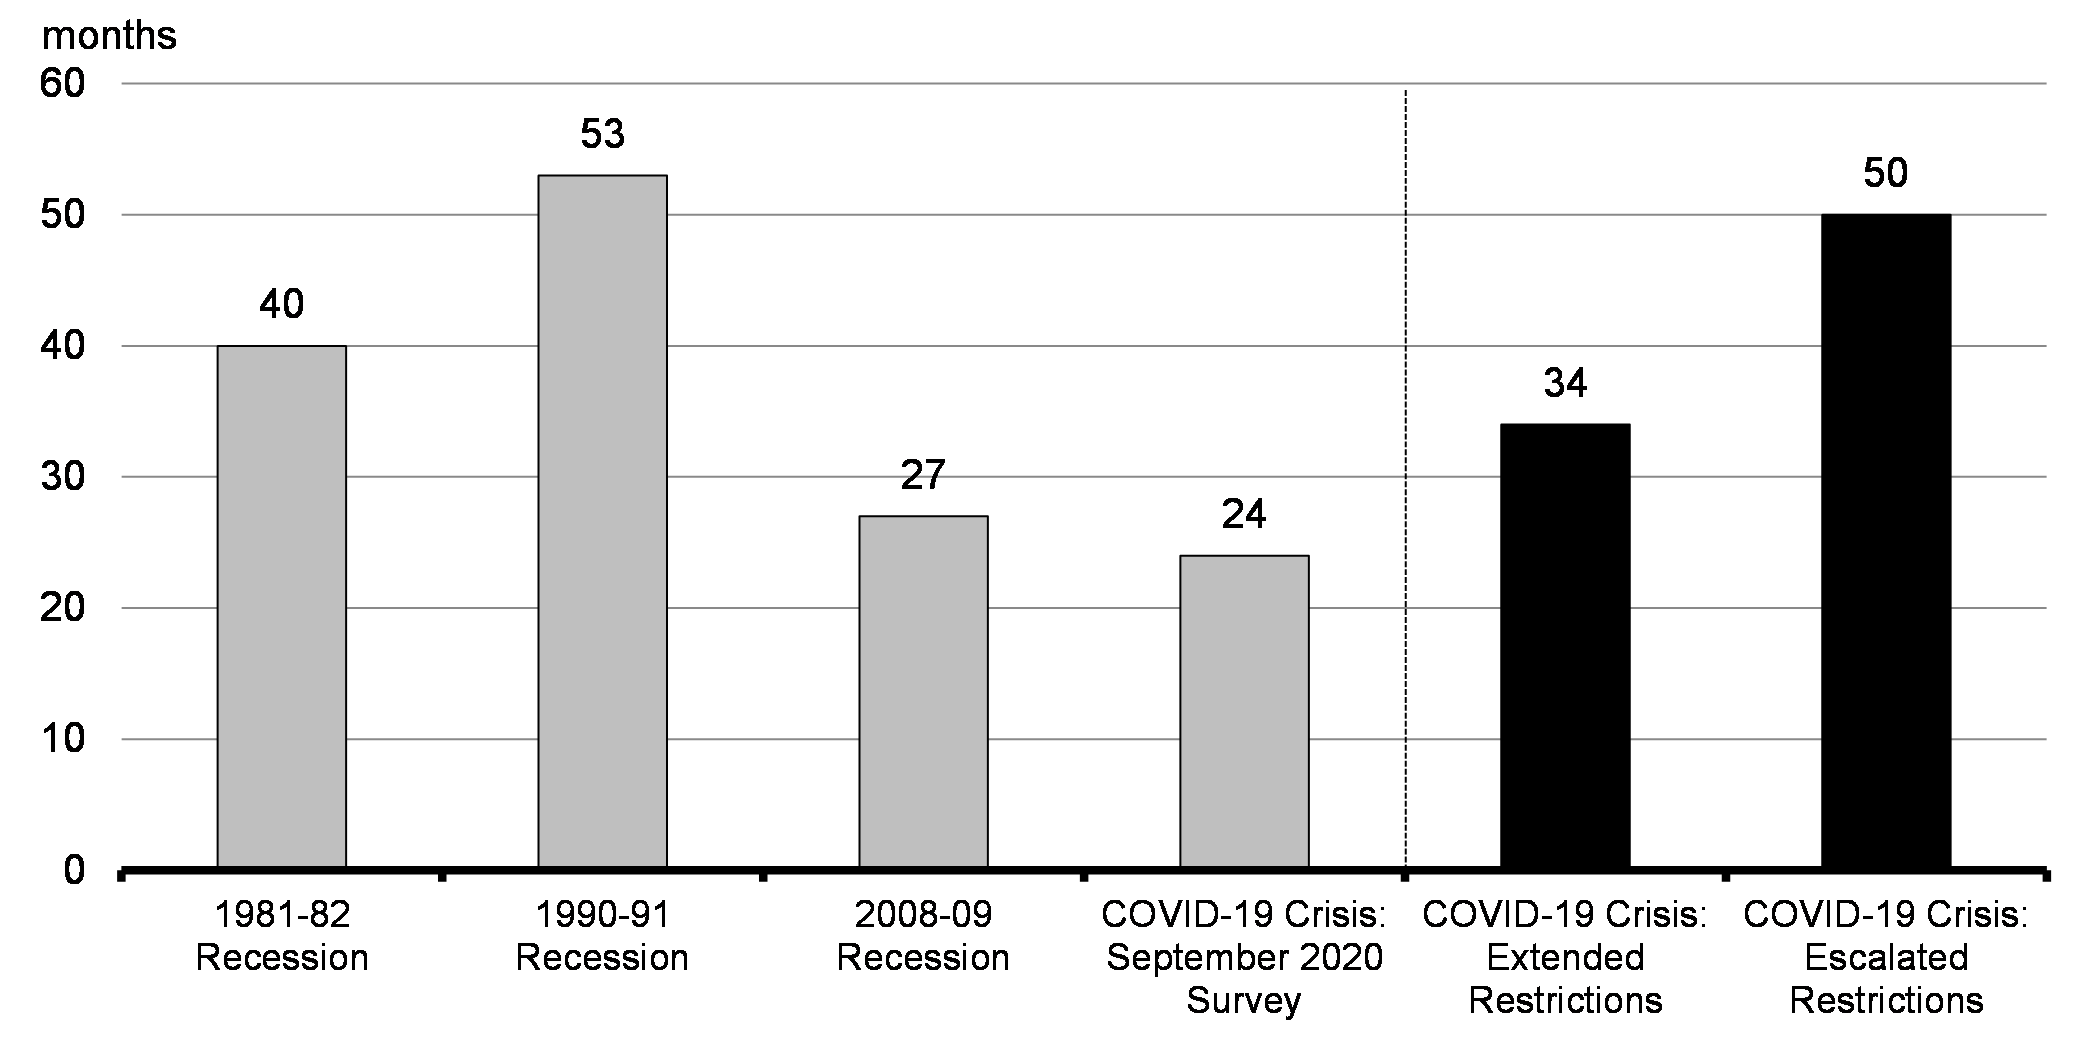
Canada is now facing a significant second wave of COVID-19. Ongoing fiscal support continues to be necessary to enable individuals and businesses to comply with public health measures, while also protecting jobs and businesses and preventing widespread permanent losses and thus positioning Canada to be ready to build back better. This additional support will help guard against the negative impacts of resurgent waves of the pandemic on employment (Chart 3.10). Failing to contain the virus properly and prevent further scarring could more than double the length of time employment is below its pre-crisis level. This would not only prolong, but also deepen the negative impact of the economic shock on Canadians’ living standards, particularly those who were already economically disadvantaged.
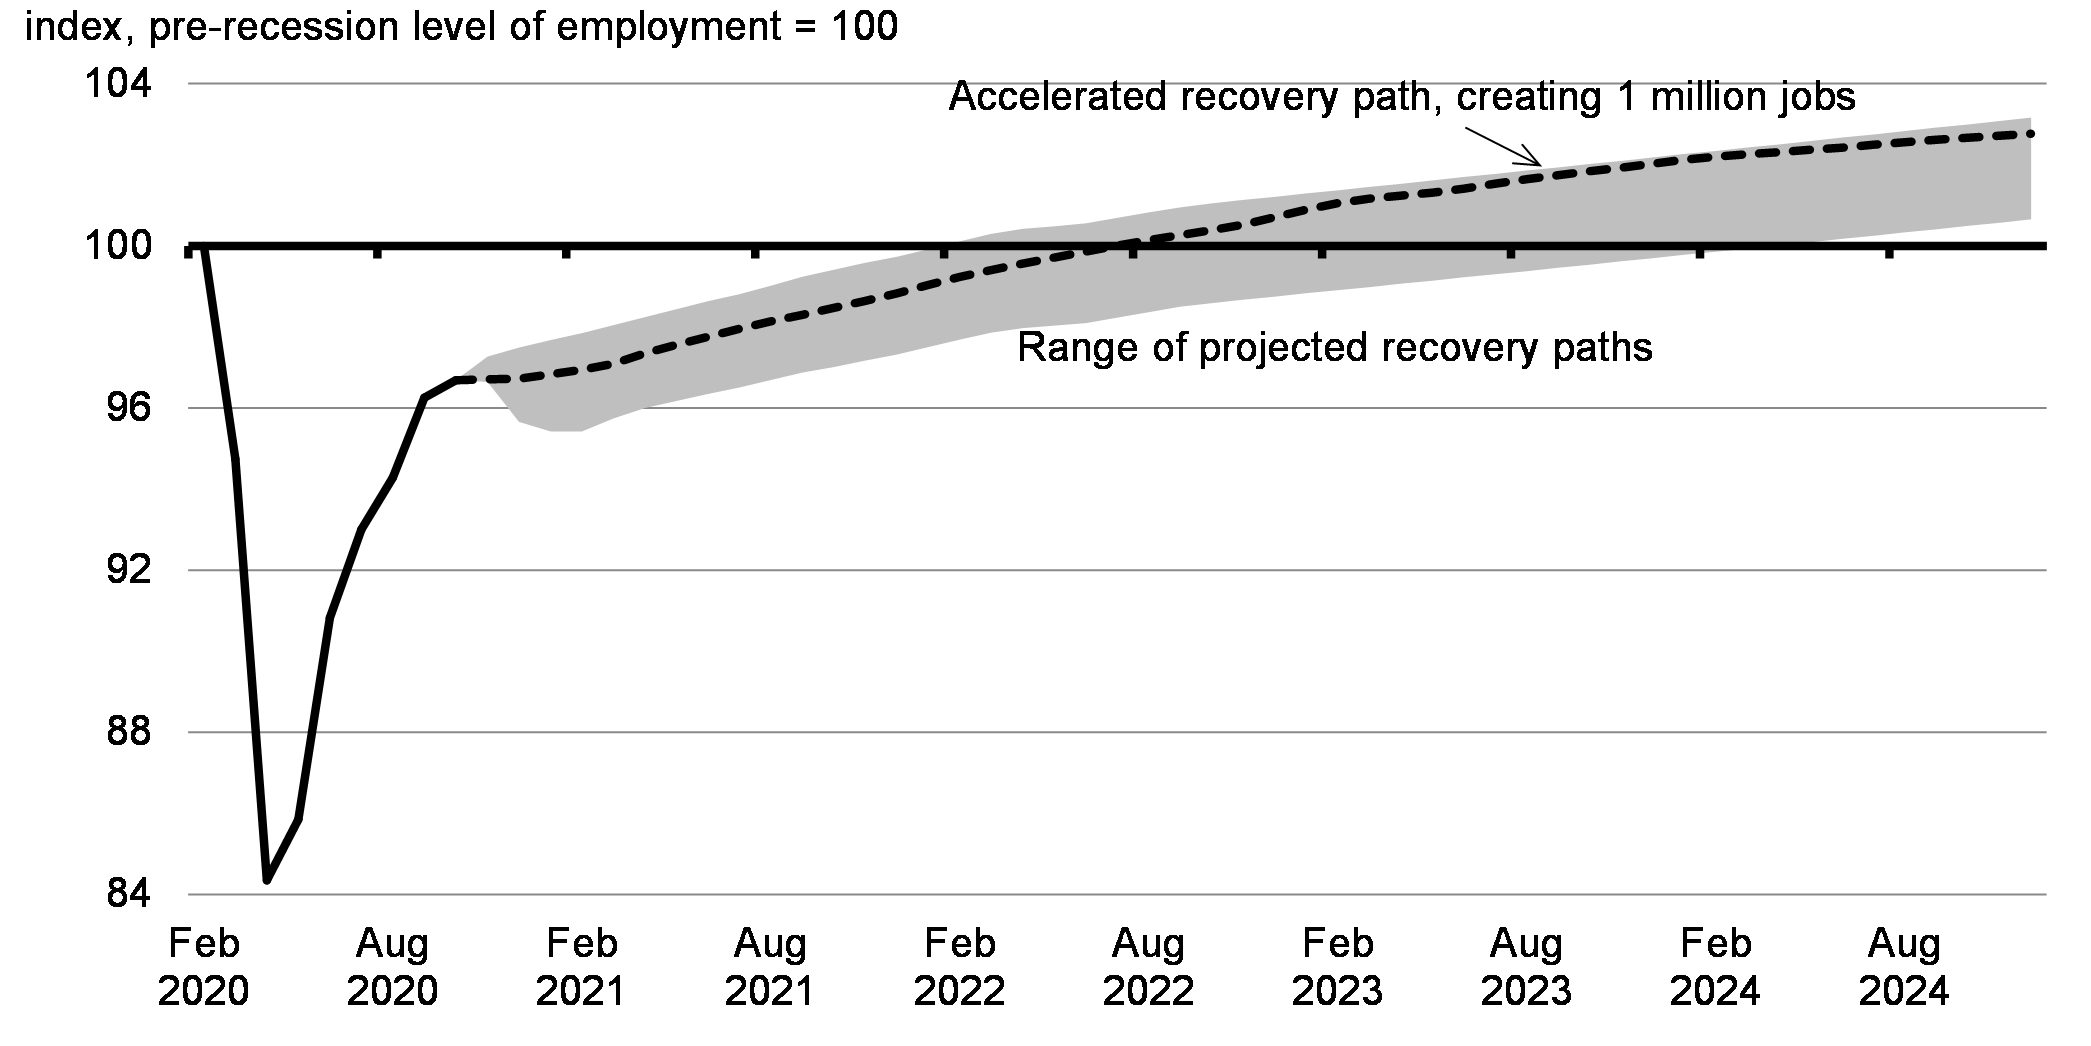
Once the virus is under control, getting the Canadian economy back to its full potential will be critical to reduce economic slack and limit lasting strains on workers and businesses. That’s why the government is now developing the details of a major investment plan to stimulate economic growth, accelerate Canada’s recovery, and create one million good jobs to strengthen and grow the middle class (Chart 3.11). These are investments to safeguard and improve Canadians’ living standards and future well-being.
Number of Months to Reach Employment Pre-Recession Peak
Employment Recovery Projections
3.2.2 Targeted Stimulus to Jumpstart Recovery
To ensure a robust and resilient recovery, the government is developing the details of a plan to help Canada build back better, by preparing to invest up to $100 billion over the next three fiscal years – roughly valued at between 3 to 4 per cent of GDP. This stimulus will help accelerate our economic recovery, and will be deployed at a time when the virus is under control and the economy is able to effectively absorb it.
The stimulus will help us build out of this recession towards an economy that is greener, more innovative, more inclusive and more competitive. In the coming months, leading into Budget 2021, we will be working with Canadians to further define the stimulus plan. This stimulus will be designed to create good middle class jobs, right here in Canada.
The heart of this stimulus plan will be smart, time-limited investments that can act fast to jumpstart the recovery and have long-run value by creating shared prosperity, improving Canadians’ quality of life and powering our green transformation. The government’s growth plan will include investments that create good, middle class jobs and unleash private spending in the short-run, and that also help us strengthen Canada’s competitiveness in the long-run. This will include growing a green economy, investing in infrastructure that supports our communities, workers and flow of goods, and supporting inclusive participation in the workforce.
We’ve also learned through this crisis that certain industries and commodities are critical to our ability to protect the health and safety of Canadians in a future pandemic. Over the past eight months we’ve worked hard to promote a made-in-Canada approach in our purchases of PPE and other medical equipment. Our recovery plan will invest in Canadian industries and Canadian jobs in areas like bio-manufacturing, where it is in Canada’s interest both now, and in the future, to have this capability within our borders.
Many stimulus investments will likely need to wait until we have a vaccine and the threat of further outbreaks and shutdowns is over. However, some measures can safely be implemented now. Measures the government takes now will be a down payment on the investments to come and will again help to minimize the scarring and assist in accelerating the broader recovery to come.
We also know that some measures can take time to plan and to organize. We will spend the winter working hard with Canadians so that we will be ready to shift into high gear when the virus is under control. That is why we are announcing the scope of the plan now, and committing to come back in Budget 2021 with more details.
A package of this size would be broadly comparable to those planned so far by international peers. This would be larger than the investments made in 2008-09 by Canada, which amounted to approximately 2.5 per cent of GDP at that time. This recession is worse than 2008. It stands to reason we will need to invest more, not less.
Measures for this next phase of the recovery will prioritize investments that act fast and help unleash some of the additional savings that have accumulated in Canadians’ bank accounts and on businesses’ balance sheets. These measures will help the economy grow, become more productive and help Canada build back better, greener and more resilient. This strong growth plan can turn a partial and uneven recovery into a broad-based and inclusive recovery from which we will all benefit.
Accelerating the recovery – International comparisons
“Government support should shift gradually from protecting old jobs to getting people back to work and helping viable but still-vulnerable firms safely reopen. The fiscal measures for the recovery are an opportunity to make the economy more inclusive and greener.”
Some of Canada’s peers have made stimulus announcements, broadly ranging from 1.4% of GDP to more than 4.5% of GDP, to strengthen the economic recovery.
| Country | Stimulus announcements | Size (% of 2019 GDP) |
|---|---|---|
| Italy | Relaunch Italy Decree (May 2020) and August 2020 Decree | 4.5% of GDP (€80 billion) |
| Draft Budget 2021 proposed stimulus (Oct. 2020) | 2.2% of GDP (€39 billion) |
|
| France | Plan de Relance (Sept. 2020) |
4.1% of GDP (€100 billion) |
| Germany | Economic Recovery Package (June 2020) |
3.8% of GDP (€130 billion) |
| Sweden | Budget 2021 proposed stimulus (Sept. 2020) |
3.8% of GDP (SEK190 billion over 2021 and 2022) |
| Australia | The Job Maker Plan (Budget 20-21, Oct. 2020) |
3.7% of GDP (A$74 billion over 2020-21 to 2023-24) |
| Denmark | Economic Recovery Package (Budget 2021, Aug. 2020) |
3.3% of GDP (DKK76 billion – estimate) |
| UK | A Plan for Jobs (July 2020) |
Up to 1.4% of GDP (up to £30 billion) |
Sources: European Commission; Ministero dell’Economia e delle Finanze; Australian Treasury; Sweden Ministry of Finance; German Federal Government; UK Treasury; Ministère de l’Économie, des Finances et de la Relance; Fitch Ratings and other public sources. NOTE: Stimulus announcements above are not directly comparable as they cover multiple years and include varying combinations of on-budget items such as increased discretionary spending or foregone revenues to support the economy, additional COVID-19 health spending, the extension of existing support measures, as well as off-budget items such as liquidity support and tax deferrals. |
||
3.2.3 Fiscal Guardrails
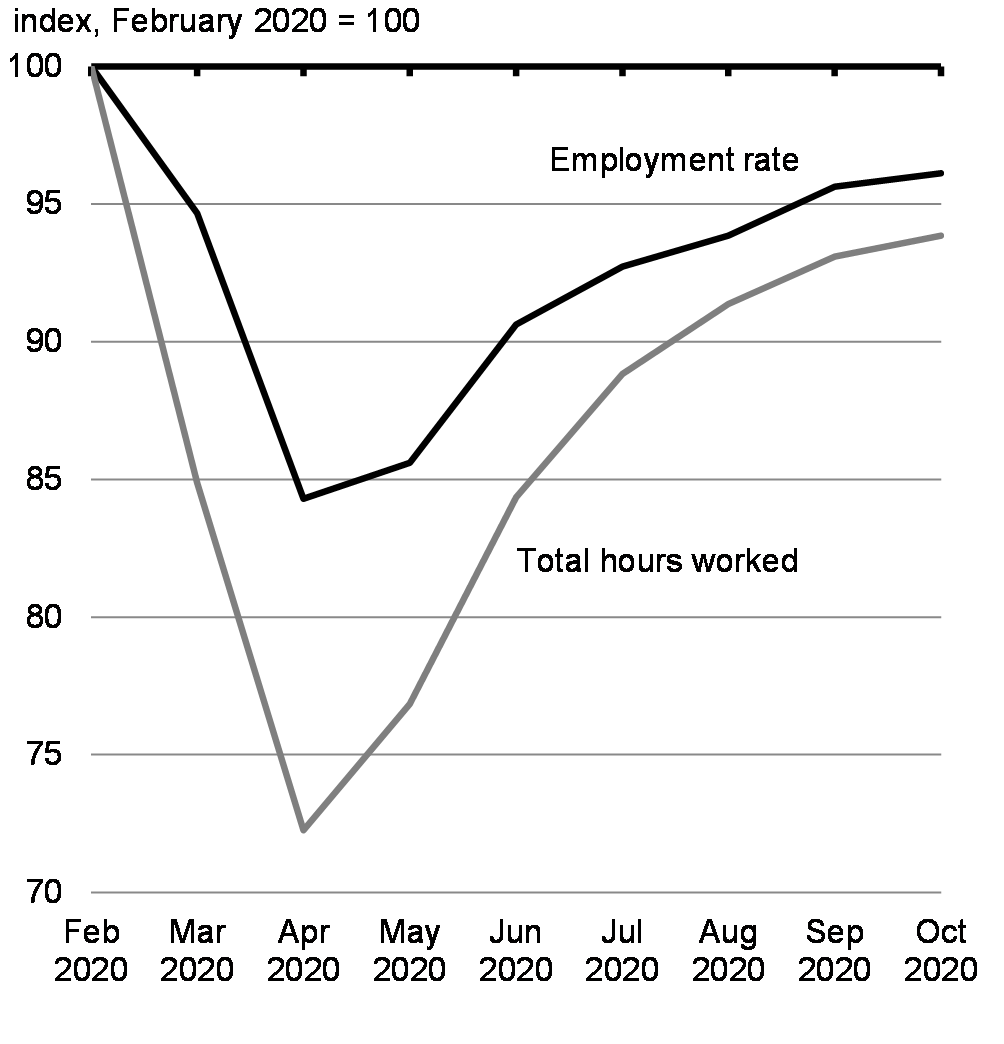
The supports and investments outlined in this plan will stimulate a robust and inclusive recovery of the Canadian economy. Fiscal guardrails will help establish when the stimulus will be wound down. Uncertainties about the timing of the pandemic and global economic developments mean that the timeline for the recovery should not be locked into a rigid pre-determined calendar. Instead, the government will track progress against several related indicators, recognizing that no one data point is a perfect representation of the health of the economy. These indicators include the employment rate, total hours worked and the level of unemployment in the economy (Charts 3.12 and 3.13). An approach which is guided by economic data will help ensure the recovery is appropriately tailored to the needs of Canadians and the circumstances at hand. These data-driven triggers will let us know when the job of building back from the COVID-19 recession is accomplished, and we can bring one-off stimulus spending to an end, returning to a prudent and responsible fiscal path, based on a long-term fiscal anchor we will outline when the economy is more stable.
Labour Market Indicator Path
Unemployment in Excess of February level
3.3 A Down Payment on a Stronger, More Resilient Canada
Once we conquer COVID-19, we will have an opportunity to build back better – for a greener, more inclusive, and more resilient economy.
Because our early response to the crisis was characterized by a clear focus on what was most important to the most vulnerable, we avoided many of the worst potential outcomes for thousands of Canadians. That approach – understanding what matters most and for whom – is the foundation of how we will build back better. As we look ahead to the future of our economy, it must be one that delivers not only growth, but better quality of life for every Canadian.
Our recovery plan will make smart investments that have value now, and well into the future – measures that have a real impact on jobs in the short-run and that strengthen Canada’s competitiveness in the long-run; measures that address the people and communities hardest hit by this unique economic crisis, and that seek to capture the economic benefit of a more inclusive workforce. Over the coming few months, we will be working with Canadians to further define this plan.
The investments we are making today are a down payment on this commitment. These are the first steps to creating jobs, growing the middle class, strengthening social supports, moving towards a low-carbon economy, unleashing private spending, and building up the infrastructure our economic success depends on. The decisions we make and the actions we take, today, have a fundamental impact on our future prosperity and well-being.
The July Economic and Fiscal Snapshot noted that traditional economic measurements such as gross domestic product (GDP) alone do not give a full picture of Canadians’ quality of life, and that the government is already incorporating broader quality of life measurements into decision-making.
To shape our investment priorities, the government will continue to draw on best practice internationally, advice from experts on the determinants of quality of life, and engagement with Canadians on what matters to them for a good quality of life. This means thinking holistically about factors like health and mental health, communities and culture, safety and human rights, job quality and opportunity. It also means thinking inclusively about the distribution of outcomes. And it means thinking about the long-term impact of decisions we make today on our future prosperity and way of life, including our green transformation.
3.3.1 An Inclusive Recovery
Inequality makes our economy less resilient which is why a robust and complete recovery must leave no one behind. Our recovery must be feminist and intersectional. This means ensuring that young people have opportunities to gain skills and work experience, that all Canadians have a roof over their heads, that women in all their diversity participate fully in our economy, that lost opportunities for racialized Canadians and Indigenous peoples are restored, and that all communities have the 21st century infrastructure people need. This approach also means supporting Canadians with disabilities, addressing gender-based violence, and ensuring that families have access to affordable child care. We will do all of this work while remaining committed to rigorous analysis of the ways our policies impact different groups of people, and bringing diverse voices into our decision making.
Gender Results Framework
Gender Equality and Diversity in Canada
-
Economic Participation and Prosperity
Experimental estimates of year-over-over changes in unemployment rates indicate that compared with a year earlier, the unemployment rate increased to a greater extent in October among Chinese, Black, South Asian and Filipino Canadians than among those who were not Indigenous and not a visible minority.
The proposed investments in Fall Economic Statement 2020 will create jobs, create growth, and lay a foundation for a recovery that is equitable, sustainable, and creates good jobs for all Canadians.
3.3.1.1 Creating One Million Jobs.
The economic shock of the COVID-19 pandemic caused Canada’s working age employment rate to go from record highs to record lows in a matter of weeks. The historically sudden economic contraction, the deepest since the Great Depression, led to over 5.5 million Canadians—more than 30 per cent of our workforce—either losing their jobs or having their hours severely cut back. The labour market has seen a strong rebound since then, with about 4.4 million Canadians regaining their job or lost hours as of October. Still, 636,000 jobs still hadn’t recovered by October and 433,000 workers had less than half the hours they worked before the pandemic. And more Canadians could lose work because of the resurgence of COVID-19.
In the Speech from the Throne, the government announced its commitment to create over one million jobs, restoring employment to previous levels. The government will be focused on measures that promote good, full time, middle class jobs and that bring Canadians experiencing long-term unemployment back into the workforce. Importantly, the government will invest in training and skills training opportunities for those most affected by job losses and help diversify sectors to include more women and other underrepresented groups so everyone has a fair chance to work and succeed.
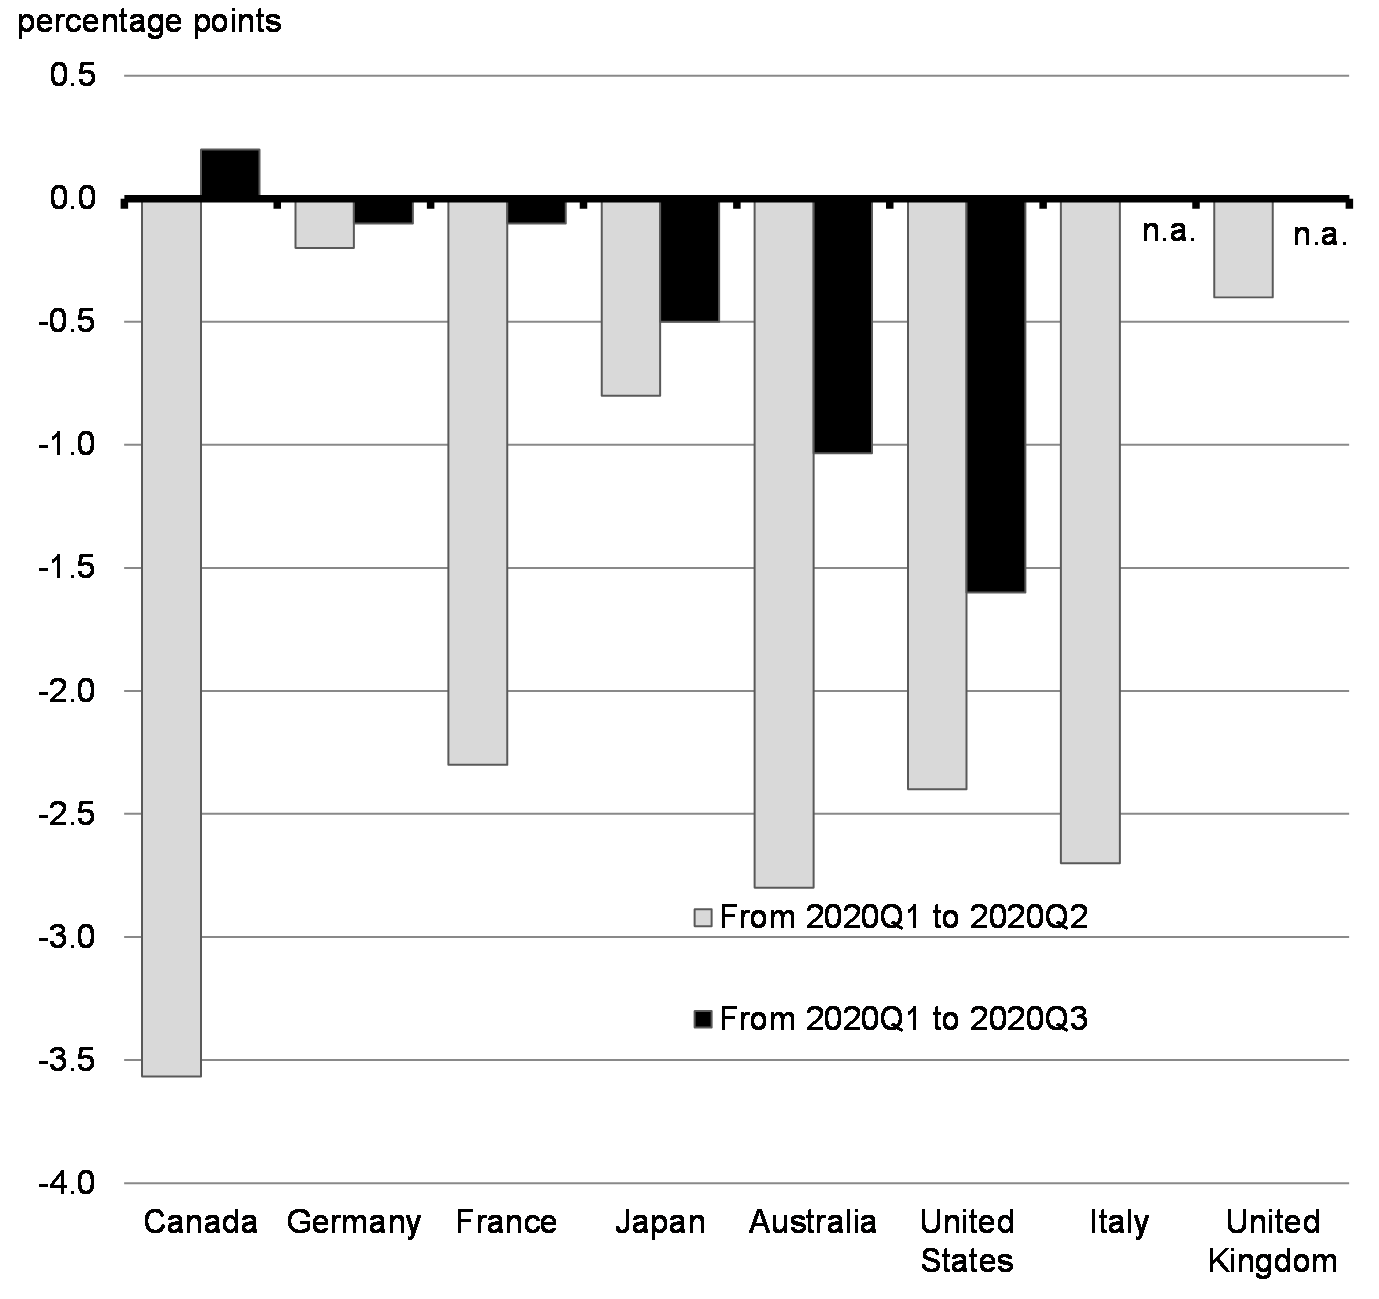
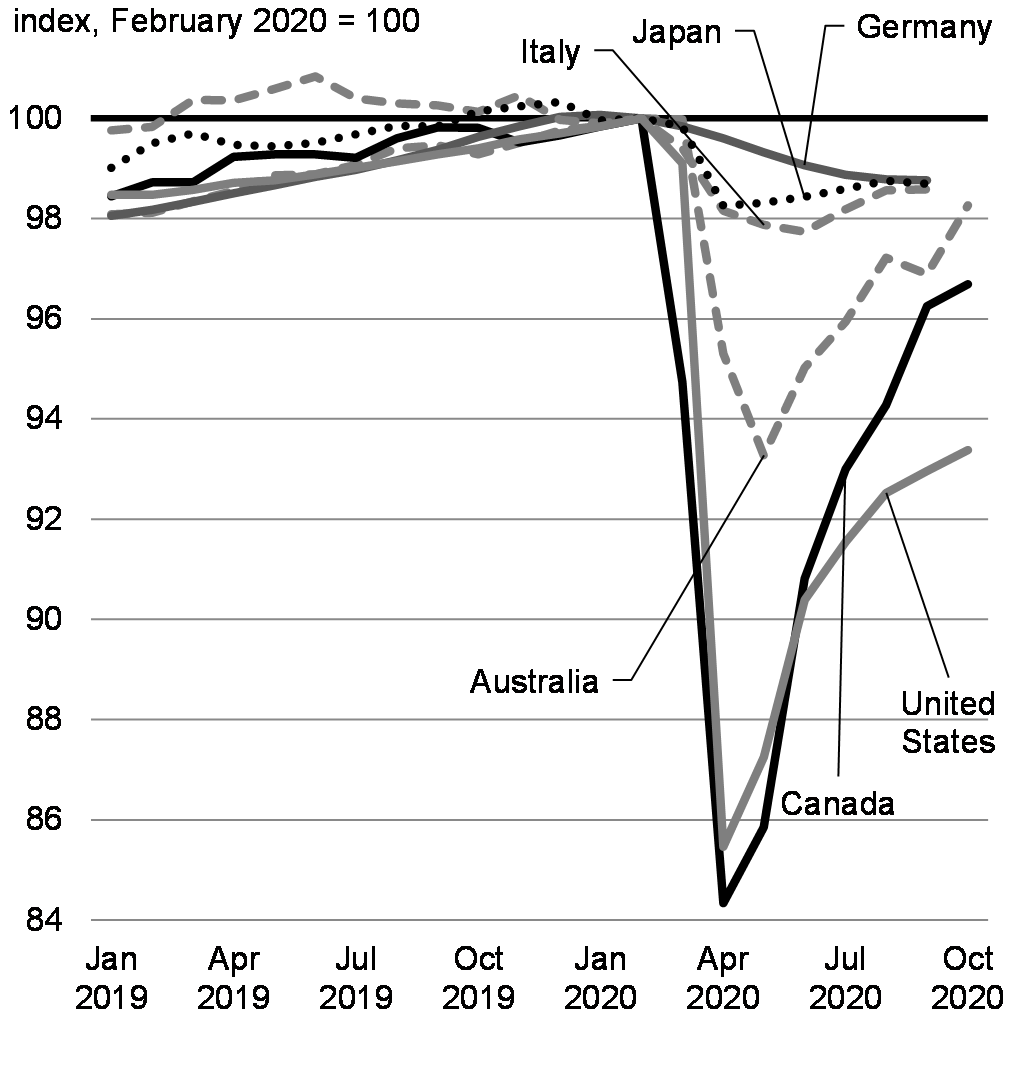
Even though Canada’s labour force participation has recovered faster than other jurisdictions, we still have work to do (Chart 3.14 and Chart 3.15).
Change in the Labour Force Participation Rate, 2020
Employment, February to October 2020
Investing in Training and Skills
Many Canadians who already faced barriers to employment are at risk of falling further behind as a result of the pandemic. This could have a long-term impact on their ability to build a career and create financial security for themselves and their families.
To help build a stronger workforce, the Government of Canada has already announced that it will invest an additional $1.5 billion in the Workforce Development Agreements with provinces and territories to offer Canadians the skills training and employment support they need. This is in addition to the $3.4 billion already being provided by the federal government to provinces and territories under the Labour Market Development Agreements and Workforce Development Agreements in 2020-2021. The government has also provided the provinces and territories greater flexibility to administer these agreements. This support will respond to the increased number of Canadians looking to re-enter the workforce, particularly workers and employers in hard-hit sectors and groups disadvantaged as a result of the pandemic.
- To further bolster training supports for those hardest hit by the pandemic, including marginalized and racialized women, Indigenous Peoples, persons with disabilities and recent newcomers to Canada, the government proposes to invest an additional $274.2 million over 2 years, starting in 2021-22. This funding will support the Indigenous Skills and Employment Training Program, the Foreign Credential Recognition Program, the Opportunities Fund for Persons with Disabilities, and the Women’s Employment Readiness Canada pilot project.
3.3.1.2 An Action Plan for Women in the Economy
The government is committed to ensuring that its job plan addresses the unique characteristics of this crisis and the disproportionate impact that COVID-19 has had on women. While past recessions have tended to affect the goods sector more heavily, the COVID crisis has hit service industries harder, with disproportionate impacts on women . In addition, the care impacts of the crisis (sickness as well as school and child care centre closures) have more often than not been borne by women. An appropriate stimulus plan needs to address these unequal impacts.
As announced in the Speech from the Throne, the government will create an Action Plan for Women in the Economy to help more women get back into the workforce and to ensure a feminist, intersectional response to this pandemic and recovery. By doing this, we are strengthening the economy as a whole, and that is good for everyone.
- The government is announcing the creation of a task force of diverse experts to help the government develop this plan. We will be bringing this task force together in the coming weeks to begin the work of advising the Deputy Prime Minister and Minister of Finance on policies and measures to be included in the government’s stimulus plan to support women’s employment through the recovery period. Advice of the task force will be intersectional and will support the government’s longer-term goal of building a more inclusive and resilient economy. The task force will provide advice on advancing gender equality and equity more broadly over the medium and longer-term, consistent with the goals and intent of the Canadian Gender Budgeting Act and the government’s Gender Results Framework, to address the inequities faced by Indigenous, Black and racialized women, as well as other vulnerable women.
3.3.1.3 Towards a Canada-wide Early Learning and Child Care System
Investing in accessible, high-quality, affordable and inclusive child care is not only good for families, it makes good economic sense. It gives children a good start in life and gives parents, especially mothers, the support they need to maintain good jobs and provide for their families. In Quebec, where the provincial government has been investing in high-quality accessible child care for over two decades, maternal labour force participation rates were 5 to 9 percentage points higher than in the rest of Canada in 2019. In particular, Quebec women with children under 3 have some of the highest employment rates in the world. Not only do good jobs help families individually, but increased maternal labour force participation is good for economic growth and increases GDP per capita. Just as Saskatchewan once showed Canada the way on health care and British Columbia showed Canada the way on pricing pollution, Quebec can show us the way on child care.
Across the country, child care providers have been particularly hard-hit by the COVID-19 pandemic. The initial lockdown meant the closure of most child care operations across the country. Even as the economy reopened, the implementation of new public health practices and the uneven return of children in care have resulted in financial challenges for many providers, and made more precarious the work of over 200,000 early childhood educators and child care workers across the country.
This is happening against the backdrop of what many experts like Armine Yalnizyan are calling a “She-cession.” In September, the number of mothers who worked less than half of their usual hours for reasons most likely related to COVID-19 was 70 per cent higher than in February, compared with 24 per cent among fathers.
Private sector, social sector and labour leaders agree that child care is a vital part of our social infrastructure that has been weakened by COVID-19. Pre-pandemic, most provinces and territories in Canada had only enough licensed child care spaces to accommodate 40 per cent or fewer children younger than six years of age. The sector was hit hard by the spring lockdown and is facing new financial challenges as new public health practices and physical distancing are implemented.
Fees have always varied widely from region to region, with some families seeing prices as high as $2,000 a month per child in some cities. Lower-income families who need a subsidized space often face long waiting lists. According to a recent study, many families find child care to be even less affordable than housing, seen by many to be “an unattainable luxury”.
Accessible and affordable child care helps create jobs and spurs economic growth. Investments in child care create more jobs compared to similar levels of investment in other industries, by not only creating direct employment for child care workers, but also enabling growth in women’s labour force participation.
Now is the time to make long-term, sustained investments so that every Canadian family has access to affordable and high-quality child care. As a first step, this Fall Economic Statement is announcing key early investments to lay the groundwork for a Canada-wide child care system, in partnership with provinces, territories and Indigenous peoples.
December 7, 2020, will mark the 50th anniversary of the Report of the Royal Commission on the Status of Women in Canada, a hallmark report that called for the federal government to immediately work with the provinces and territories to establish a national day care system. Those who were children when the report came out are now parents and grandparents. Canadians have waited, for generations, for their government to answer the call. On the eve of this anniversary, the government is committed to making historic investments to make this happen. Budget 2021 will lay out the plan to provide affordable, accessible, inclusive and high-quality child care from coast to coast to coast. This will also include enhanced support for before- and after-school care for older children – in order to provide all parents with the flexibility needed to balance work and family.
Bringing Partners Together Towards a Common Vision
- To help bring governments, experts and stakeholders together to collaborate in designing and implementing this new child care vision for Canada, the government is proposing to provide $20 million over 5 years, starting in 2021-22, with $4.3 million per year ongoing for a Federal Secretariat on Early Learning and Child Care. The Secretariat will build capacity within the government and engage stakeholders to provide child care policy analysis in support of a Canada wide-system.
- The government is also proposing to invest $70 million over 5 years, starting in 2021-22, and $15 million ongoing to sustain the existing federal Indigenous Early Learning and Child Care Secretariat, and to help build Indigenous governance capacity and support Indigenous participation in the development of a Canada-wide system.
Sustaining Previous Investments in Early Learning and Child Care
In Budgets 2016 and 2017, the federal government invested $7.5 billion over 11 years in early learning and child care. These investments have enhanced fee subsidies for families across the country, and created new quality, affordable spaces, including for parents that work non-traditional hours as well as for children from diverse populations.
- In order to sustain the progress made in collaboration with provinces, territories and Indigenous partners to date, the government is proposing to make this funding permanent at 2027-28 levels by providing $870 million per year and ongoing, starting in 2028-29. Of this amount, $210 million would support Indigenous early learning and child care programming.
Results to Date of Federal Investment in Early Learning and Child Care
Federal funding for early learning and child care since 2017 has supported the creation of almost 40,000 more affordable child care spaces, as well as training and professional development for 1,780 early childhood educators and staff across Canada, including:
- In New Brunswick, where almost 80 per cent of early learning and child care centres received funding to implement a low-fee policy, and to improve their capacity to serve children with disabilities and diverse learning needs;
- In Ontario, where federal and provincial funding supported grants for 1,570 child care workers to upgrade their skills and receive Early Childhood Educator Diplomas; and,
- In Saskatchewan, where new federal funding has supported the creation of 768 additional regulated child care spaces, including in the Fransaskois communities of Regina, Prince Albert and Vonda.
Supporting the Early Childhood Educator Workforce
The recruitment and retention of early childhood educators is a challenge across Canada. These workers often earn low wages, have minimal job protections and lack career development opportunities. Supporting the valuable work of early childhood educators is key to the success of a high-quality child care system, especially one which will expand the number of spaces across the country.
Gender Results Framework
Gender Equality and Diversity in Canada
-
Economic Participation and Prosperity
In February 2020, 96 per cent of early childhood educators and assistants were women, as were 97 per cent of home child care providers. In 2016, according to the Census, visible minorities accounted for 21 per cent of all wage earners, but they accounted for 24 per cent of early childhood educators and assistants and 41 per cent of home child care providers. Immigrants were similarly overrepresented, accounting for 27 per cent of early childhood educators and assistants and 33 per cent of home child care providers, but only 23 per cent of all wage earners. Recent immigrants were particularly overrepresented among home child care providers, accounting for 11 per cent of earners in this occupation, compared to only 4 per cent of wage earners in all occupations.
- To this end, the government is proposing to provide $420 million in 2021-22 for provinces and territories to support attraction and retention of these workers, such as through grants and bursaries for students studying early childhood education.
The government will also engage provinces and territories on future sustained investments in support of an Early Childhood Educator Workforce Strategy – as a key enabling feature of a Canada-wide child care system.
- Early childhood educators also play an important role in delivering quality, culturally-relevant care that meets the unique needs of Indigenous families. That’s why the government is proposing to invest an additional $75 million in 2021-22 to improve the quality and accessibility of Indigenous child care programs. This would enable providers to take steps to improve the retention of Indigenous early childhood educators and to offer more flexible and extended hours of care.
3.3.1.4 Immediate Support for Families with Children
Many families have been struggling with a wide range of expenses during the pandemic – from providing care to buying tools for at-home learning like books and technology. Many families with young children also had to find temporary alternatives to their regular child care arrangements which, for many, meant higher costs.
- In order to provide immediate relief for families with young children, the government proposes to introduce temporary support totaling up to $1,200 in 2021 for each child under the age of 6 for low- and middle-income families who are entitled to the Canada Child Benefit (CCB). This represents an almost 20 per cent increase over the maximum annual CCB payment. This support would automatically be delivered to families entitled to the CCB with net income at or below $120,000 as four tax-free payments of $300, with the first payment being made shortly after the enabling legislation is passed, and subsequent payments in the months of April, July, and October 2021. Families entitled to the CCB with net income above $120,000 would receive a tax-free payment of $150 at each of these times, for a total benefit of $600. This temporary assistance would benefit about 1.6 million families and about 2.1 million children, and would cost about $2.4 billion in 2021.
- Recognizing that federal, provincial, territorial and First Nation child protection agencies that care for vulnerable children have also faced higher costs, as a result of COVID-19, the government also proposes to provide equivalent temporary quarterly payments of $300 for each child under the age of 6 in respect of whom a Children’s Special Allowance is paid.
3.3.1.5 Better Working Conditions for the Care Economy
The COVID-19 pandemic has highlighted the low wages and poor working conditions of our essential workers, including of those personal support workers caring for our seniors and other vulnerable Canadians. Often, their employers do not offer the same opportunities to save for retirement that better-paid workers enjoy.
- To support personal support workers, homecare workers and essential workers involved in senior care, the government will work with labour and healthcare unions, among others, to seek solutions to improve retention, recruitment and retirement savings options for low- and modest-income workers, particularly those without existing workplace pension coverage.
3.3.1.6 Creating Opportunities for Youth
Young people continue to suffer disproportionate economic among other impacts due to COVID-19. The government is working to ensure the pandemic does not derail their futures. Making sure they can turn their hard-earned knowledge and skills into secure, well-paying jobs is important for their success, and important for Canada’s future prosperity.
The government proposes to build on the employment, job skills development and educational supports provided to youth and students over the summer, including the doubling of student grants and funding for new career opportunities, by introducing additional measures that will ease the financial burden on students and provide more opportunities for young people to gain work experience.
Enhancing Canada Summer Jobs funding
-
To help young people develop stronger connections to the job market, and to support employers through a period of economic recovery, the government intends to support up to 120,000 job placements through Canada Summer Jobs in 2021-22 – an increase of 40,000 from 2020-21 levels. To this end, the government proposes to provide approximately $447.5 million in new investments in the program next year.
This investment will support employers by helping reduce staffing costs and will be used to extend by one year program flexibilities introduced in 2020-21, including the ability to hire youth outside of the summer months. It will also increase the maximum available wage support, allowing employers to receive up to 100 per cent of minimum wage for each employee. Employers will also be able to more easily hire part-time workers, and employers will be able to adapt their projects and job activities to support essential services.
Youth Employment and Skills Strategy
- To help young people, including those who may face more complex barriers to employment, and who may have been driven further from the labour force due to the pandemic, gain the skills and experience needed to find and keep quality work, the government proposes to invest $575.3 million over the next two years in the Youth Employment and Skills Strategy to provide approximately 45,300 job placements for young people.
Eliminating Interest on Canada Student Loans and Canada Apprentice Loans
- To ease the financial burden of student debt during the economic recovery, the government intends to eliminate the interest on repayment of the federal portion of the Canada Student Loans and Canada Apprentice Loans for 2021-22. This measure will bring $329.4 million in relief to up to 1.4 million Canadians who are looking for work or otherwise in the early stages of their careers.
| Jobs and Training for Vulnerable Populations | Measure | Description | FES 2020 Funding TOTAL in 2021-22 |
| Foreign Credential Recognition Program | Expanding existing supports to attract skilled newcomers to Canada’s in-demand sectors. Up to 15,000 skilled newcomers would benefit. | $15M | |
| Indigenous Skills and Employment Training | Provide training and supports to young, Indigenous people, Indigenous people with disabilities, and out-of-territory and vulnerable Indigenous people to prepare them for good jobs. This funding also helps improve labour market data and service delivery. | $144.2M | |
| Opportunities Fund for Persons with Disabilities | Support persons with disabilities by creating inclusive workplaces, supporting career advancement and increasing support for existing activities. | $65M | |
| Women’s Employment Readiness Pilot | Establish a new pilot program to support marginalized women by providing and testing pre-employment and skill development supports. | $50M over two years | |
| Youth Employment and Skills Strategy | Helping Canadians aged 15-30 by supporting approximately 43,500 job placements over two years, of which approximately 17,500 are new job placements. | $575.3M over two years | |
| Canada Summer Jobs | Supporting 120,000 job placements for young Canadians ages 15-30 in 2021-22, and extend program flexibilities introduced in 2020-21 for one additional year. | $447.5M | |
| Total Incremental Funding $1.3B over two years | |||
3.3.1.7 Accelerating the Universal Broadband Fund
The COVID-19 pandemic has shifted much of our lives online and transformed how we live, work, and learn. Canadians in many rural and remote communities who still do not have access to high-speed Internet face a barrier to their ability to be equal participants in the economy.
Gender Results Framework
Gender Equality and Diversity in Canada
-

Education and Skills Development
-
Economic Participation and Prosperity
-

Poverty Reduction, Health and Well-Being
In 2018, only 41 per cent of rural households had access to high-speed Internet (i.e. download at 50 Mbps and upload at 10 Mbps), which is necessary to take full advantage of the opportunities offered by the modern Internet. This compares to 98 per cent of urban households in large and medium-sized population centres. On First Nations Reserves, only about 31 per cent of households had access to 50/10 speeds. The COVID-19 pandemic has amplified the urban/rural digital divide and the importance of high-speed Internet access, no matter where Canadians live and work. Many rural Canadians have struggled to work from home, continue their children’s education online, access government services, and maintain social connections with loved ones, all due to poor Internet access.
To accelerate its efforts to ensure all Canadians have access to high-speed Internet, no matter where they live, the government is committing an additional $750 million over five years for larger, high-impact projects. In total, $1.75 billion will be provided over seven years starting in 2020-21 through the Universal Broadband Fund. This level of funding is intended to connect 98 per cent of Canadians by 2026, up from the original target of 95 per cent in that year and 100 per cent of Canadians by 2030.
The Universal Broadband Fund leverages additional broadband investments by telecommunications businesses and also works in partnership with provinces and territories, and arms-length federal institutions, such as the Canada Infrastructure Bank and the Canadian Radio-television and Telecommunications Commission.
3.3.1.8 Compensation for Supply-managed Farmers
The agriculture and agri-food sector is an important contributor to Canada’s economy that is positioned for strong growth and increased exports over the coming years.
Canada is a trading nation and trade is an important part of the government's plan to create jobs and grow during our recovery from the pandemic recession. As part of negotiations for free trade agreements over the last few years, the Government of Canada provided our trading partners with increased access to the domestic market for dairy, poultry and eggs. During negotiations for the Canada-United States-Mexico Agreement (CUSMA), the government defended supply management from American efforts to dismantle it. We remain committed to engaging the sector on full and fair compensation for the CUSMA. Canada is delivering on our commitment to full and fair compensation for the Canadian-European Union Comprehensive Economic and Trade Agreement (CETA) and the Comprehensive and Progressive Agreement for Trans-Pacific Partnership (CPTPP). To deliver on this commitment, the Fall Economic Statement proposes to provide the following compensation to Canada’s over 14,000 supply-managed dairy, poultry and egg farmers:
- In addition to the $250 million Dairy Farm Investment Program, and the $345 million delivered through direct payments to dairy farmers in 2019-20, the government is announcing that dairy farmers will receive $1.4 billion in payments over three years, beginning in 2020-21, including a payment of $468 million this year. This brings the total compensation provided to dairy farmers, to date, to almost $1.1 billion and provides certainty on the schedule and form of remaining payments in the $2.0 billion total compensation package for dairy farmers.
- The government is also announcing $691 million for 10-year programs for supply-managed chicken, egg, broiler hatching egg and turkey farmers. These programs will provide support for farmers including support to make investments on their farms that improve productivity and for marketing activities. Further details will be announced by the Minister of Agriculture and Agri-Food.
3.3.1.9 Fighting Systemic Racism and Building Communities
In Canada, systemic racism and discrimination is a painful lived reality for Black Canadians, racialized Canadians, and Indigenous peoples. Data shows that racialized Canadians have experienced many of the worst health and economic impacts of the pandemic. Global events during the pandemic have also shone a spotlight on the realities of racism, particularly anti-Black racism, that still persist, including here in Canada.
Through this Fall Economic Statement, the Government of Canada is reiterating its commitment to fight racism in all its forms through clear and meaningful investments in a number of key areas: economic opportunity, representation at the highest levels of and throughout the public service, diversity in corporate Canada, modernization of equity legislation to be truly inclusive, community empowerment, and action to address systemic racism in the justice system.
The measures announced herewith reflect the advocacy and hard work of community leaders from across Canada.
Together these measures will begin the long-overdue process of building in institutional practices that prioritize addressing systemic racism. Building on previous investments, these are early steps in the work to be done to make sure that federal policies appropriately serve the historically underserved, in the manner all Canadians deserve.
Governments serve the people above all else and government must listen to and work with all people, directly, to make sure government is accomplishing the work it set out to do. For this reason, senior Government of Canada officials will work directly with community leaders to make sure these programs deliver as intended.
Federal programs are available to all Canadians, but different groups do not always access them equally. Government COVID-19 support for businesses also face this challenge. We cannot prevent economic scarring during the pandemic recession if all eligible Canadian businesses do not have universal access to federal programs. More work will be done to continue to engage, assist and ensure underrepresented groups are able to make use of government support measures.
We need all our businesses to stay strong in order to ensure a swift and inclusive recovery.
Economic Opportunities and Diversity in Procurement
Canada’s prosperity depends on ensuring all Canadians have access to the economic tools to build their businesses and access government procurement.
Black Entrepreneurship Program
COVID-19 has highlighted and exacerbated existing systemic barriers faced by Black entrepreneurs and owners of small and medium-sized businesses in Canada. On September 9, the government in partnership with Canadian financial institutions announced an investment of up to $221 million – including up to $93 million from the Government of Canada over the next four years – to launch Canada’s first-ever Black Entrepreneurship Program. This will help to ensure equitable access to support and opportunities for Black business owners and entrepreneurs.
The program will help thousands of Black business owners and entrepreneurs across the country recover from this crisis and grow their businesses. The program will be delivered with up to $93 million, including:
- up to $53 million to develop and implement a new National Ecosystem Fund to help Black business owners and entrepreneurs access funding and capital, mentorship, financial planning services, and business training;
- up to $33.3 million in support through the new Black Entrepreneurship Loan Fund that will provide loans of between $25,000 and $250,000 for Black business owners and entrepreneurs. The Government of Canada is also partnering with financial institutions, including RBC, BMO Financial Group, Scotiabank, CIBC, National Bank, TD, Vancity, and Alterna Savings, to make up to $128 million available in additional lending support; and
- up to $6.5 million to create and sustain a new Black Entrepreneurship Knowledge Hub that will collect data on the state of Black entrepreneurship in Canada and help identify Black entrepreneurs’ barriers to success as well as opportunities for growth. The Hub will be run by Black-led community and business organizations, in partnership with educational institutions.
Diversity in Procurement
- Delivering on the Speech from the Throne, which directed the government to pursue economic empowerment for specific communities, and increase diversity in procurement, the Department of Public Services and Procurement Canada will be launching a pilot program to open bidding opportunities for Black owned/operated businesses, building off the successful Procurement Strategy for Aboriginal Business. The department will also be examining greater opportunities for supplier diversity across the government.
Supporting Diversity and Fairness in the Workplace
Systemic barriers and discrimination in the workplace remain a challenge faced by many Canadians. Proactive approaches are required to tackle barriers and support workplaces to ensure all workers are treated equally in the workplace, including at the highest levels of leadership.
Building a Corporate Canada that Looks Like Canada
In Canada’s business community, women, racialized Canadians, LGBTQ2 Canadians, people with disabilities, and Indigenous people are underrepresented in positions of influence. The 50‑30 Challenge is a call to action to businesses across Canada to increase diverse representation on corporate boards and in senior management positions. The 50‑30 Challenge asks participating organizations to make two commitments and report regularly on progress towards:
- Gender parity (“50 per cent”) on boards and in senior management, and;
- Significant representation (“30 per cent”) on boards and in senior management of other underrepresented groups, including racialized Canadians, Indigenous people, people with disabilities, and members of LGBTQ2 communities.
- The government proposes to provide $33 million over 3 years, starting in 2021-22, to support the Challenge in collaboration with diversity-seeking groups and business stakeholders. This funding will assist diversity-serving organizations to support private and public sector organizations – including small and medium-sized businesses, not-for-profits and academic institutions – with the development of tools to help them achieve the program’s goals. These tools could include assistance with developing diversity strategies, the creation of mentorship and training opportunities and an online toolkit and resources that would be available to businesses and organizations across the country.
Renewing Our Commitment to Employment Equity
Creating equitable, diverse, and inclusive workplaces will help grow our middle class and build a country where every Canadian has a real and fair chance to succeed. While progress has been made for members of these groups since the Employment Equity Act was passed in 1986, more needs to be done, and the economic effects of COVID 19 must not be allowed to reverse the gains that have been made. At the same time, the nature of work is changing, and Canadians’ understanding of diversity and inclusion has evolved.
Gender Results Framework
Gender Equality and Diversity in Canada
-

Gender-Based Violence and Access to Justice
In an August 2020 crowdsourcing survey, 28 per cent of participants reported having experienced discrimination or having been treated unfairly by others during the pandemic. Gender diverse participants were much more likely to report these experiences (65 per cent), as were people with disabilities (48 per cent), visible minorities (48 per cent), Indigenous people (47 per cent), sexual minorities (45 per cent), and recent immigrants (41 per cent).
- Accordingly, the government is committing $6.6 million to support a task force on modernizing the Employment Equity Act. The task force will have a mandate to study, consult, and advise on how a renewed Employment Equity Act can help ensure that Canada’s economic recovery is equitable, inclusive, and fair.
- The government is also committing $3.6 million on an ongoing basis to expand the Workplace Opportunities and Barriers to Equity Program, to promote projects that help federally regulated workplaces become more representative of Canada’s diversity.
Centre for Diversity in the Federal Public Service
- $12 million over 3 years towards a dedicated Centre for Diversity in the Federal Public Service at Treasury Board Secretariat. This will accelerate and increase the government’s efforts to achieve a representative and inclusive public service. This includes implementing a government-wide strategy and action plan with specific actions necessary to accelerate progress on diversity and inclusion.
Empowering Communities
Communities have lived experience and expertise which must be empowered in our collective efforts to address racism and discrimination.
Supporting Community-led Initiatives
- To strengthen efforts to combat racism and promote multiculturalism, the government is providing $50 million over 2 years, starting in 2021-22, to expand Canadian Heritage’s Community Support, Multiculturalism and Anti-Racism Initiatives Program and its Anti-Racism Action Program. Funding will also enhance Canadian Heritage’s capacity to deliver on the government’s anti-racism objectives, including by expanding the Anti-Racism Secretariat.
Protecting Communities at Risk of Hate-motivated Crimes
- $13 million over 5 years and $2.6 million ongoing to protect communities at risk of hate-motivated crimes, by providing not-for-profit organizations such as places of worship, schools and community centres, with funding to enhance their security infrastructure. This investment will be delivered through Public Safety’s Communities at Risk: Security Infrastructure Program.
The Justice System and Tackling the Root Causes of Crime
There are systemic issues in the criminal justice system that have resulted in the overrepresentation of certain groups. These persistent issues merit new and proven approaches and greater accountability.
Impact of Race and Culture Assessments in Sentencing
- $6.6 million over 5 years and $1.6 million ongoing to support the implementation of Impact of Race and Culture Assessments, which allow sentencing judges to consider the disadvantages and systemic racism that contributed to racialized Canadians’ interaction with the criminal justice system.
Supporting Community Justice Centres
- $28.6 million over 5 years to support Community Justice Centres (CJC) pilot projects in British Columbia, Manitoba and Ontario. CJCs bring justice, health and social services together to address the root causes of crime, divert individuals accused of non-violent offences away from incarceration, and connect them with social supports. Through the integration of culturally appropriate services, CJCs can help decrease the overrepresentation of Indigenous peoples and Black Canadians in the criminal justice system and provide solutions to systemic issues.
3.3.1.10 Growing the Economy through Immigration
The Government of Canada is committed to an immigration system that supports economic growth, diversity, and helps build vibrant, dynamic and inclusive communities. Immigrants play an important role in driving Canada’s economic growth, contributing to half of the average real GDP growth over 2016-2019. Without immigration, Canada’s population would start to decline in slightly more than a decade and potential growth would slow to about 1 per cent per year.
Canada will continue welcoming newcomers who bring the skills our economy needs to grow. Our advantage in immigration helps keep Canada competitive on the world stage.
In the 2021-2023 Immigration Levels Plan, the government set out a path for responsible increases to immigration targets. Immigration is also an important factor in helping the Canadian economy recover, drive future growth and create jobs for middle class Canadians. The Levels Plan aims to continue welcoming immigrants at a rate of about 1 per cent of the population of Canada, including 401,000 permanent residents in 2021, 411,000 in 2022 and 421,000 in 2023.
Delivering on increased immigration levels will require that the system that supports application processing for immigration and future citizens – the Global Case Management System – be modernized, moving away from its current cumbersome paper-based system to a digital platform. Through the Economic and Fiscal Snapshot, the government announced $72.1 million for Immigration, Refugees and Citizenship Canada to begin this work, by stabilizing and standardizing its current information technology infrastructure, building the foundation for a new digital platform, and supporting more efficient processing through the responsible use of data-driven technologies. This modern processing system will contribute to Canada’s world-class immigration system through enhanced client service, operational efficiency and program integrity, ensuring a higher level of service and internal capacity to bring the skills and talents of new Canadians to our communities.
Supporting Skilled Newcomers
Attracting talented workers from around the world is an essential part of the government’s plan to help grow our economy and support the economy’s recovery from the COVID-19 recession.
Skilled newcomers are critical to Canada’s economic growth and recovery, but they are not always able to contribute to their full potential. At the same time, the demand for professionals in key sectors, such as Information Technology (IT), is increasing in many regions across Canada, leading to a situation where there are skilled workers without quality jobs, and quality jobs without skilled workers. These challenges are being exacerbated by the current economic slowdown.
The Foreign Credential Recognition Program helps address specific barriers faced by skilled newcomers, such as the length and cost of credential recognition, and has recently expanded its scope to provide direct employment supports.
- To scale up and expand existing supports for the labour market integration of skilled newcomers with a focus on in-demand sectors, such as health, IT, and skilled trades, the government proposes to invest $15 million in 2021-22 in the Foreign Credential Recognition Program. Up to 15,000 skilled newcomers are expected to benefit from this investment.
3.3.1.11 Addressing Affordable Housing and Homelessness
COVID-19 has exacerbated existing housing affordability and homelessness issues, and called attention to the public health risks of substandard and crowded living quarters. Without urgent action by the Government of Canada, the COVID-19 pandemic could lead to a dramatic increase in homelessness. Affordable housing is also essential for economic fairness and growth.
In 2017, the government committed to reducing chronic homelessness by 50 per cent. The government’s National Housing Strategy has already helped more than a million people find a safe and affordable place to call home, including through significant new support to homeless Canadians. Given this progress, the government promised, in the Speech from the Throne, that it is now focused on eliminating chronic homelessness in Canada.
The government is providing $1 billion in funding through the Rapid Housing Initiative. This initiative is managed by the Canada Mortgage and Housing Corporation, and funding is available to municipalities, provinces and territories, Indigenous governing bodies and organizations and non-profit organizations. Funding will be used for construction of modular housing, as well as the acquisition of land and conversion of existing buildings into affordable housing units.
Expanding the Rental Construction Financing Initiative
Finding an affordable place to rent is a challenge across Canada. To address this, the government launched the Rental Construction Financing Initiative in 2017 to provide low-interest loans and mortgage insurance to support the construction of purpose-built rental housing. Borrowers are required to offer units that are accessible, rented at more affordable rates, and adhere to high energy efficiency and greenhouse gas emissions standards. To date, the Rental Construction Financing Initiative has supported the construction of over 10,000 new purpose-built rental units in major Canadian cities.
- In order to expand this already successful initiative, the government will provide new resources to the Canada Mortgage and Housing Corporation to enable the Rental Construction Financing Initiative to provide an additional $12 billion in new lending over seven years, staring in 2021-22. This funding will increase the Rental Construction Financing Initiative’s total lending capacity from $13.75 billion to $25.75 billion in low-interest loans, and enable the construction of an additional 28,500 rental units.
The First-Time Home Buyer Incentive
To make homeownership more affordable, the government launched the $1.25 billion First-Time Home Buyer Incentive in September 2019, which gives eligible first-time home buyers the ability to lower their borrowing costs by sharing the cost of buying a home with the government.
The government is expanding the First-Time Home Buyer Incentive to enhance eligibility in the higher priced markets of Toronto, Vancouver and Victoria. This will help to make home ownership more affordable for Canadians who are buying their first home in these cities. To help people in Toronto, Vancouver and Victoria buy a house, the expansion will be available to eligible buyers to purchase a home up to 4.5 times their household income, an increase from the current limit of 4 times household income. Additionally, the eligible buyer’s income threshold is being raised from $120,000 to $150,000 for Toronto, Vancouver and Victoria. These changes will come into effect in spring 2021. With a minimum down payment, this targeted expansion will raise the maximum house price for eligible first-time home buyers in these cities from about $505,000—the current program parameters—to about $722,000.
3.3.1.12 Making Communities Safer
Canadians deserve to feel safe in their communities. The government proposes to invest in a variety of measures to support public safety by providing resources to community organizations to protect youth from violence, and driving greater accountability among the RCMP to the people they serve.
- To crack down on gun crime and make our communities safer places to live, the government proposes to provide dedicated funding of $250 million over 5 years, starting in 2021-22, for municipalities, community-led initiatives and Indigenous communities, to support anti-gang programming. This investment will be delivered by Public Safety Canada and will support programs aimed at youth gang interventions through wrap-around supports. This funding will complement the government’s previous investments to support provincial and territorial initiatives.
- $238.5 million over 6 years, starting in 2020-21, and $50 million ongoing to implement a National Body-worn Camera Program for frontline RCMP officers to improve transparency and accountability, and more effectively respond to concerns about policing from racialized and Indigenous communities.
Gender Results Framework
Gender Equality and Diversity in Canada
-
Poverty Reduction, Health and Well-being
Air pollution costs Canadians and the Canadian economy billions of dollars per year. Part of this cost is the lost labour from employees who must take time off to recover from air pollution related illnesses or care for young or elderly family members recovering from such illnesses. Given that a greater share of caregiving responsibilities continue to be shouldered by women, the value of this lost labour is likely borne by women. In addition, mortality and morbidity costs from air pollution are not equally distributed across the population. Fine particulate matter (PM2.5) and ground-level ozone (O3) – components of urban smog – have particularly important impacts on health and well-being. Individuals with heart or lung diseases, children and the elderly are the most likely to be at risk of illness from air pollution. In 2012, men and women had a similar share of deaths due to O3, but women had more deaths attributable to PM2.5 than men.
3.3.2 A Competitive, Green Economy
A resilient economy is not just a more inclusive economy, but also one that is sustainable, competitive, and responsive to global demand. We need to invest in meaningful climate action. Failure to do so will only increase the costs and the risks of climate change to all Canadians. COVID-19 has reminded us all of the importance of early, sustained action to address systemic risks that threaten our daily lives.
According to the Organisation for Economic Co-operation and Development, our international peers have allocated approximately US$312 billion to support a green recovery. G7 economies such as France, Germany and the United Kingdom have already announced considerable investments in green transition measures including funding for energy efficient renovations, fostering the development of new technologies, such as hydrogen, and electric vehicle infrastructure and incentives. To secure a prosperous future and compete in a changing landscape, Canada must continue to invest to position us as a key player in an increasingly green worldwide economy.
This is why the government has committed to putting climate action at the heart of its plan to create a million jobs. These will be good middle class jobs for today, and for the decades to come, creating opportunities for our current workforce and for our children and grandchildren. Canadians from all regions need to be part of this collective effort, and the government will also work to make many of these traditionally male-dominated industries more inclusive.
Canada remains strongly committed to meeting and exceeding its Paris targets and achieving net-zero by 2050. The government’s plan to do this will be released in the coming weeks. The investments made in Fall Economic Statement 2020 will lay the foundation for a green recovery that will create opportunities for all Canadians.
Gender Results Framework
Gender Equality and Diversity in Canada
-
Poverty Reduction, Health and Well-Being
A changing climate can mean longer and more intense heat events that can be dangerous for the health of Canadians. For example, during extreme heat events, many people succumb to underlying health conditions, such as respiratory and cardiovascular illnesses, while some may experience heat stroke that could result in death. According to Health Canada, while extreme heat can put everyone at risk from heat illnesses, health risks are greatest for heat-vulnerable groups including older adults, infants and young children, people with chronic illnesses or who are physically impaired, socially disadvantaged individuals such as those with low incomes, those who are homeless and those who are living alone, newcomers to Canada and people who work outdoors, most of whom are men. Pregnant women are also at greater risk during extreme heat events, as there is an increased chance of early delivery and stillbirth, and exposure to high temperatures during the first trimester increases the risk of certain types of congenital heart defects. According to the Canadian Disaster Database, seven extreme heat events were reported in Canada between 1900 and 2018 (1912, 1936, 1953, 1963, 1988, 2009, and 2018) causing over 1,750 deaths. Most recently, in 2018, an extreme heat event in Quebec killed 93 people.
3.3.2.1 Action Starts at Home: Home Energy Retrofits
Buildings, including our homes, account for 17 per cent of Canada’s greenhouse gas emissions, so helping Canadians make their homes more energy efficient can support our environmental objectives while making homes more comfortable and more affordable to maintain. And will create good, middle-class jobs in their communities.The energy efficiency sector accounted for more than 436,000 direct jobs in 2018.
- The government proposes to provide $2.6 billion over 7 years, starting in 2020-21, to Natural Resources Canada to help homeowners improve their home energy efficiency by providing up to 700,000 grants of up to $5,000 to help homeowners make energy-efficient improvements to their homes, up to one million free EnerGuide energy assessments, and support to recruit and train EnerGuide energy auditors to meet increased demand. Additional information on home energy efficiency grants will be provided in a future announcement, and eligibility for these grants will be retroactive to December 1, 2020.
The government also recognizes that homeowners and landlords need to be able to access simple and affordable financing to make deeper home energy retrofits. Over the coming months the government will outline details of a low-cost loan program that integrates and builds on available energy audits and grants, and which can be easily accessed by Canadians.
3.3.2.2 Zero-emission Vehicle Infrastructure
The government is taking action to help more Canadians choose zero-emission vehicles to support Canada’s transition to a low-carbon economy. Since 2016, the government has invested $226.4 million to build new recharging and refuelling infrastructure along highways and in places where people live and work. To date, 433 charging and fueling stations have been built, and more than 800 are currently under construction.
- The government proposes to accelerate this work by providing $150 million over 3 years to Natural Resources Canada, starting in 2021-22. These investments in infrastructure for zero-emission vehicles will help increase confidence that charging and refuelling stations are available and conveniently located where and when they are needed.
3.3.2.3 Nature-based Climate Solutions
Investing in nature, and its protection, is among the most affordable climate action governments can take. Forests, wetlands, oceans, and more, absorb and store enormous amounts of carbon, which can mitigate the impacts of climate change, and keep our air and water clean. In fact, nature-based solutions to climate change can provide almost 40 per cent of the emission reductions needed by 2030 – 30 per cent more than previously estimated. Pristine green and blue spaces provide recreational opportunities that improve quality of life and are part of Canadian culture and identity.
Gender Results Framework
Gender Equality and Diversity in Canada
-
Poverty Reduction, Health and Well-Being
Climate change disproportionately impacts vulnerable groups such as children, seniors, women and people living off the land and in the North through socio-economic impacts on community health, well-being and livelihoods. For example, people living on First Nations reserves in Canada are on average 18 times more likely to be evacuated because of natural disaster events compared to people living off reserve. Nature-based solutions are intended to help reduce these community impacts.
- To fight climate change, protect forests and create good jobs, the government proposes to provide up to $3.16 billion, over ten years, starting in 2021-22, with $2 million in remaining amortization, to Natural Resources Canada to partner with provinces, territories, non-governmental organizations, Indigenous communities, municipalities, and others to plant 2 billion trees. In addition, $30 million was provided to Natural Resources Canada to work with provinces and territories to support small and medium-sized forest businesses in managing the increased costs of safely operating due to COVID-19. This funding also helped to ensure that approximately 660 million trees were planted in Canada in 2020, and that forestry firms and nurseries are ready for the next planting season.
- Canada’s grasslands, wetlands and peatlands are also highly valuable for their ability to store greenhouse gases. To restore degraded ecosystems, protect wildlife, and improve land and resource management practices, the government proposes to provide up to $631 million over ten years, starting in 2021-22, with $0.1 million in remaining amortization, to Environment and Climate Change Canada. With this funding, the government will work with provinces, territories, conservation organizations, federal landowners and Indigenous communities to implement climate smart, natural solutions to reduce greenhouse gas emissions related to ecosystem loss.
- Canada’s farms have significant potential to increase carbon sequestration and realize other environmental benefits through the adoption of beneficial management practices. The Government proposes to provide $98.4 million over ten years, starting in 2021-22, with $1.6 million in remaining amortization, to Agriculture and AgriFood Canada to establish a new Natural Climate Solutions for Agriculture Fund. This fund will leverage $85 million in existing programming and will be guided by a new Canadian Agri-Environmental Strategy to be developed in collaboration with partners to support the sector’s actions on climate change and other environmental priorities towards 2030 and 2050.
3.3.2.4 Public Transit Infrastructure
Public transit gives Canadians faster, cheaper, and cleaner ways to get around. It also enhances our economy’s productivity, reduces congestion and pollution, provides efficient and affordable commuting options, and improves quality of life. Investing in public transit helps grow local economies and create more livable, vibrant, and inclusive communities.
That is why, in Budget 2017, the government announced unprecedented investments in public transit infrastructure as part of the Investing in Canada Plan.
Gender Results Framework
Gender Equality and Diversity in Canada
-
Economic Participation and Prosperity
New Canadians are overrepresented as users of public transit. According to the 2016 Census, immigrants accounted for 24 per cent of all commuters, but 40 per cent of commuters using public transit. Recent immigrants accounted for 3 per cent of all commuters, but 9 per cent of public transit users. Immigrant women were more likely to use public transit than immigrant men, representing 60 per cent of all immigrant public transit users, but only 48 per cent of immigrant commuters. Non-immigrant women are also more likely to use public transportation than non-immigrant men.
To build on these investments the government will outline its next steps on public transit, including its plan to help electrify public transit systems across Canada, and provide permanent public transit funding, in partnership with the provinces and territories.
This investment will accelerate Canada’s transition to a low-carbon economy, accelerate growth in local economies, and accelerate improvement to Canadians’ quality of life.
3.3.2.5 Strategic Interties
Canada has immense clean energy resources but many regions of this country still rely on coal power. Getting clean power to more communities remains a challenge as traditional financing models make it difficult for electricity providers to build large-scale transmission projects while keeping rates affordable for customers.
To bring clean power to more Canadians and accelerate Canada’s coal phase-out, the government is committed to working with the provinces and territories to help build new electricity transmission infrastructure with support from the Canada Infrastructure Bank (CIB). As part of its $10 billion Growth Plan, the CIB has earmarked $2.5 billion for clean power and is currently working in collaboration with provincial and regional partners to connect Canadians to clean electricity across Canada through the Atlantic Loop and other regional projects.
- In addition, to further support necessary project predevelopment work, the government proposes to provide $25 million in 2021-22 to help some proponents complete engineering assessments, community engagement, and environmental and regulatory studies. This work will help inform and complement the CIB’s efforts to identify and address financial gaps in the projects.
The Canada Infrastructure Bank’s Growth Plan
In October 2020, the Canada Infrastructure Bank (CIB) announced a $10 billion Growth Plan to invest in infrastructure that will create good jobs for Canadians, build stronger communities, and make the economy more sustainable and resilient for everyone. Over the next three years, the CIB will work in partnership with provincial, territorial, municipal, and Indigenous communities, and leverage the private sector, to build infrastructure across Canada.
- $2.5 billion for clean power to support renewable generation and storage and to transmit clean electricity between provinces, territories, and regions, including to northern and Indigenous communities;
- $2 billion to connect about 750,000 homes and small businesses to broadband in underserved communities;
- $2 billion to invest in large-scale building retrofits;
- $1.5 billion for agriculture irrigation projects; and
- $1.5 billion to accelerate the adoption of zero-emission buses and associated charging infrastructure.
To accelerate the delivery of projects in which the CIB intends to invest, the plan will also allocate $500 million for project development and early construction works.
3.3.2.6 Sustainable Finance
Mobilizing private sector capital is critical to financing the transition to a low-carbon economy. Around the world, institutions and investors are increasingly factoring environmental, social and governance considerations into their business and investment decisions, and evaluating the climate change risks and climate action opportunities of their assets and portfolios. Developing sustainable finance in Canada will promote the long-term growth and stability of our financial system in the face of climate change. Sustainable finance will also create new opportunities for Canadian businesses and investors.
The government has committed $7.3 million over three years for the Department of Finance Canada and Environment and Climate Change Canada to create a public-private Sustainable Finance Action Council aimed at developing a well-functioning sustainable finance market in Canada.
The Action Council will make recommendations on critical market infrastructure needed to attract and scale sustainable finance in Canada, including enhancing climate disclosures, ensuring access to useful data on sustainability and climate risks, and developing standards for investments to be identified as sustainable. The government will launch the Action Council in early 2021.
3.3.2.7 Building the Foundation for a Net-zero Carbon Future
Achieving net-zero emissions by 2050 is a pan-Canadian project to transform our economy, and is a commitment Canada joins with over 120 other countries. As such, it is critical to maintaining our competitiveness and ability to create and sustain good, middle class jobs across all sectors of the economy.
On November 19, 2020, the government delivered on its commitment to legislate Canada’s goal of achieving net-zero greenhouse gas emissions by 2050 by introducing bill C-12, the Canadian Net-Zero Emissions Accountability Act,to Parliament. This legislation would legally bind the government to a process to achieve net-zero emissions by 2050, and require the Minister of Finance to report annually on key measures that the federal government, including Crown Corporations, has taken to manage climate-related financial risks and opportunities.
The work to achieve net-zero emissions requires continued, urgent, systemic and sustained action from all orders of government, the financial sector, businesses, communities and individual Canadians. It requires working together across our country to build a better, cleaner future for all Canadians. To create long-term jobs, we need to secure long-term investments, and investors and consumers are increasingly supporting low-carbon, climate-resilient projects.
Canadians are full of innovative new ideas that will lead to the development and deployment of important new clean technologies. In particular, Canadians can lead the development and deployment of new zero-emission technologies. This includes technologies that create carbon-free heat and electricity. Following on the Small Modular Reactor (SMR) Roadmap released in 2018, the government intends to launch an SMR Action Plan by the end of 2020 to lay out the next steps to develop and deploy this technology. The government intends to work with interested parties, including New Brunswick, Ontario, Alberta and Saskatchewan, to advance this important work. The government’s upcoming climate plan will highlight further work and investments in areas like renewables, clean fuels, and hydrogen.
Canadian firms face challenges in scaling-up their operations. Often, they cannot get access to the right financing when needed. Targeted action by the government to mobilize private capital will better position Canadian firms to bring their technologies to market, unlocking both the economic and environmental potential of the growing global clean technology market.
3.3.2.8 Border Carbon Adjustments
The government is committed to ensuring that Canada’s transition to a low-carbon economy is achieved in a way that is fair and predictable for our businesses, and supports Canada’s international competitiveness. To this end, the government is exploring the potential of border carbon adjustments, and will be discussing this issue with our international partners. Border carbon adjustments are about levelling the playing field across jurisdictions on carbon pricing: they propose to establish a carbon fee on imports from countries that do not have carbon pricing so that those products face the same costs as those supplied by domestic producers who pay a price on carbon pollution.
The government will work with like-minded economies, including the European Union and our North American partners, to consider how this approach could fit into a broader strategy to meet climate targets while ensuring a fair environment for businesses.
3.3.3 Reconciliation
In 2015, the Government of Canada promised a new relationship with Indigenous peoples – one that would help deliver a better quality of life for families and communities. Building back to a better, more inclusive Canada will mean building stronger Indigenous communities with access to safe drinking water and community infrastructure. Healthy communities are prosperous communities, which is why the Government of Canada will continue to make progress towards a co-developed, distinctions-based approach to improving health and well-being outcomes for Indigenous peoples. Building a better future also means acknowledging the past, including the legacy of colonization. The Government of Canada remains committed to walking the road of reconciliation. We will work together with First Nations, Inuit, and Métis Nation partners, and all Canadians, to end the national tragedy of violence towards Indigenous women, girls and LGBTQ and two-spirit people.
3.3.3.1 Supporting Infrastructure in Indigenous Communities
There is a significant gap in infrastructure in Indigenous communities when compared with non-Indigenous communities in Canada. This can affect overall quality of life, widen socio-economic gaps and reduce Indigenous peoples’ participation in the economy. To keep building strong communities together, the government proposes to invest:
- $1.5 billion, starting in 2020-21, and $114.1 million per year ongoing thereafter to accelerate work to lift all long-term drinking water advisories and stabilize funding for water and wastewater infrastructure, including operation and maintenance costs, in First Nations communities.
- $25.9 million in 2020-21 to accelerate the government’s 10 year commitment to close the infrastructure gap in Indigenous communities by supporting the co-development of infrastructure plans with Indigenous partners, which will help pave the way to address critical needs in First Nations, Inuit and Métis Nation communities. To support early action, $1.8 billion over 7 years, starting in 2021-22, will be directed to support community infrastructure priorities.
3.3.3.2 Supporting Health and Well-being in Indigenous Communities
The COVID-19 pandemic has highlighted how critical access to health care is to safety, security and long-term economic prosperity. Now more than ever, the government is committed to making high quality health care, designed to meet the unique needs of Indigenous communities, a reality for Indigenous peoples.
- To move forward with this commitment, the government proposes an initial investment of $15.6 million over 2 years, starting in 2021-22, to support the co-development of distinctions-based health legislation with First Nations, Inuit and Métis Nation partners. This will begin the process of transforming health care delivery in Indigenous communities by ensuring Indigenous control over the development and delivery of health services.
Gender Results Framework
Gender Equality and Diversity in Canada
-
Poverty Reduction, Health and Well-Being
Compared to Indigenous men, Indigenous women are at a higher risk of COVID-19 infection due to pre-existing conditions and they are more likely to be providing care. According to Phase 3 of the First Nations Regional Health Survey, with data collected between March 2015 and December 2016, among First Nations adults, a higher percentage of women (47 per cent) than men (36 per cent) reported having two or more chronic health conditions, which may indicate that Indigenous women are at higher risk of needing long-term medical and personal care. Women also make up the vast majority of care and personal support workers. For example, according to the 2016 Census, 93 per cent of Indigenous Registered Nurses were women.
3.3.4.3 Mercury Treatment Centres
Since the 1960s, the First Nations communities of Asubpeeschoseewagong (Grassy Narrows) and Wabaseemoong have suffered from the physical and mental effects of mercury poisoning due to the contamination of the English-Wabigoon river system. Residents experience higher rates of chronic health problems related to mercury exposure and the programs and services currently available in the communities do not meet their unique health care needs. Community members are often required to travel to urban centres for extended stays to receive specialized treatment or access long-term care.
- In order to address the long-standing mercury-related health issues facing these communities, the government proposes to provide $200.1 million over 5 years, starting in 2021-22, and $0.3 million ongoing to support the construction and operations of a mercury treatment centre in each community. These centres will offer specialized care for residents to address their unique health care needs, as well as supported living for those who require it. As a result, residents in both Asubpeeschoseewagong and Wabaseemoong will receive the care they need while staying closer to home, community and family.
3.3.3.4 National Inquiry into Missing and Murdered Indigenous Women and Girls
The National Inquiry into Missing and Murdered Indigenous Women and Girls laid bare the long-lasting effects of colonization, discrimination and stigmatization. Thanks to the brave voices and tireless efforts of survivors, loved ones, truth keepers and advocacy organizations, the National Inquiry’s Final Report, and its 231 Calls for Justice, provides a roadmap to move beyond a legacy of silence and inaction and put an end to systemic violence and discrimination against Indigenous women, girls and LGBTQ and two-spirit people.
Gender Results Framework
Gender Equality and Diversity in Canada
-
Gender-Based Violence and Access to Justice
Women in Canada are more likely than men to experience gender-based violence, a reality which has been compounded by pandemic restrictions. According to 2018 police-reported data, women accounted for almost 8 in 10 victims (79 per cent) of intimate partner violence. Some populations are at higher risk for gender-based violence, including Indigenous women (on- and off-reserve), women living with a disability, women living in rural and remote communities, and LGBT2Q populations.
For example, self-reported data from the 2014 General Social Survey (GSS) show that Indigenous women were three times more likely to have experienced spousal violence than non-Indigenous women. Additionally, in the 2018 Survey of Safety in Public and Private Spaces, Indigenous women living in the provinces were more likely than non-Indigenous women to report experiencing violence since the age of 15 (55 per cent versus 38 per cent, respectively).
Healing and reconciliation, however, require action. Together with families and survivors and provincial, territorial and Indigenous partners, the government is working toward the development and implementation of a distinctions-based, regionally relevant and accountable National Action Plan. The government is also investing to make communities safer for Indigenous women and children and address systemic discrimination against Indigenous Peoples. Early actions include extending critical supports to families and survivors, supporting the Moose Hide Campaign, the renewal of the Aboriginal Community Safety Planning Initiative, supporting the construction and operation of new shelters in Indigenous communities, and the implementation of the Indigenous Languages Act and An Act respecting First Nations, Inuit and Métis children, youth and families.
Building on these investments, the government proposes to invest an additional $781.5 million over 5 years starting in 2021–22, and $106.3 million ongoing to combat systemic discrimination against Indigenous peoples and expand efforts to combat violence against Indigenous women, girls and LGBTQ and two-spirit people. This includes:
- $49.3 million to support the implementation of Gladue Principles in the mainstream justice system and Indigenous-led responses in order to help reduce the overrepresentation of Indigenous Peoples in the criminal justice and correctional systems.
- $8.1 million to develop Administration of Justice Agreements with Indigenous communities to strengthen community-based justice systems and support self-determination.
- $724.1 million to launch a comprehensive Violence Prevention Strategy to expand access to a continuum of culturally relevant supports for Indigenous women, children and LGBTQ and two-spirit people facing gender-based violence. This strategy will support new shelters and transition housing for First Nations, Inuit and Métis peoples across the country, including on reserve, and in the North and in urban areas.
| 2020– 2021 |
2021– 2022 |
2022– 2023 |
2023– 2024 |
2024– 2025 |
2025– 2026 |
Total | Included in or Announced: | |
|---|---|---|---|---|---|---|---|---|
| 3.3.1 An Inclusive Recovery | 1,840 | 4,185 | 569 | 529 | 576 | 520 | 8,219 | |
| - Investing in Training and Skills | ||||||||
Investments in Workforce Development Agreements with Provinces and Territories |
Profile included in summary table at the end of chapter 2. | |||||||
| Training Supports for Vulnerable Populations | - | 224 | 35 | - | - | - | 259 | New in this fall Economic Statement |
| 3.3.1.2 An Action Plan for Women in the Economy | ||||||||
| Action Plan for Women in the Economy | 0.3 | 0.6 | - | - | - | - | 0.9 | New in this fall Economic Statement |
| 3.3.1.3 Towards a Canada-wide Early Learning and Child Care System | - | 509 | 18 | 20 | 19 | 19 | 585 | |
| Federal Secretariat on Early Learning and Child Care | - | 2 | 4 | 5 | 4 | 4 | 20 | New in this fall Economic Statement |
| Sustaining the Indigenous Early Learning and Child Care Secretariat, and building Indigenous Governance Capacity | - | 12 | 14 | 15 | 15 | 15 | 70 | New in this fall Economic Statement |
| Supporting the Early Childhood Educator Workforce | - | 420 | - | - | - | - | 420 | New in this fall Economic Statement |
| Improving the Quality and Accessibility of Indigenous Child Care Programs | - | 75 | - | - | - | - | 75 | New in this fall Economic Statement |
| 3.3.1.4 Immediate Support for Families with Children | ||||||||
| Immediate Support for Families with Children | 580 | 1,775 | - | - | - | - | 2,355 | New in this fall Economic Statement |
| 3.3.1.6 Creating Opportunities for Youth | - | 1,284 | 58 | - | - | - | 1,342 | |
| Enhancing Canada Summer Jobs funding | - | 448 | - | - | - | - | 448 | New in this fall Economic Statement |
| Youth Employment and Skills Strategy | - | 516 | 60 | - | - | - | 575 | New in this fall Economic Statement |
| Eliminating Interest on Canada Student Loans (Net) | - | 321 | -2 | - | - | - | 319 | New in this fall Economic Statement |
| 3.3.1.7 Accelerating the Universal Broadband Fund | ||||||||
Universal Broadband Fund: Acceleration and Top-Up |
58 | 154 | 165 | 248 | 333 | 263 | 1,221 | Policy Action Announced since the July 2020 Snapshot |
| 3.3.1.8 Compensation for Supply-managed Farmers | 1,197 | -102 | -108 | -115 | -120 | -118 | 635 | |
| Compensation for supply-managed dairy, poultry and egg farmers | 1,405 | 109 | 105 | 102 | 102 | 102 | 1,925 | New in this fall Economic Statement |
Less: Funds from Previous Budgets or Fall Statements |
-208 | -210 | -214 | -217 | -222 | -220 | -1,290 | |
| 3.3.1.9 Fighting Systemic Racism and Building Communities | 4 | 55 | 53 | 24 | 14 | 14 | 164 | |
Black Entrepreneurship Program |
Profile included in summary table at the end of chapter 2. | |||||||
| Building a Corporate Canada that looks like Canada | - | 13 | 10 | 10 | - | - | 33 | New in this fall Economic Statement |
| Task Force on Modernizing the Employment Equity Act | - | 7 | - | - | - | - | 7 | New in this fall Economic Statement |
| Workplace Opportunities and Barriers to Equity Program Expansion | - | - | 4 | 4 | 4 | 4 | 14 | New in this fall Economic Statement |
| Centre for Diversity in the Federal Public Service | 4 | 4 | 4 | - | - | - | 12 | New in this fall Economic Statement |
| Supporting Community-led Initiatives that combat Racism and promote Multiculturalism | - | 25 | 25 | - | - | - | 50 | New in this fall Economic Statement |
| Protecting Communities at Risk of Hate-motivated Crimes | - | 3 | 3 | 3 | 3 | 3 | 13 | New in this fall Economic Statement |
| Impact of Race and Culture Assessments in Sentencing | - | 1 | 1 | 1 | 2 | 2 | 7 | New in this fall Economic Statement |
| Supporting Community Justice Centres | - | 4 | 7 | 6 | 6 | 6 | 29 | New in this fall Economic Statement |
| 3.3.1.10 Growing the Economy through Immigration | - | 188 | 170 | 143 | 131 | 132 | 765 | |
| 2021-2023 Immigration Levels Plan | - | 173 | 170 | 143 | 131 | 132 | 750 | Policy Action Announced since the July 2020 Snapshot |
| Supporting Skilled Newcomers - Foreign Credential Recognition Program | - | 15 | - | - | - | - | 15 | New in this fall Economic Statement |
| 3.3.1.11 Affordable Housing | - | 44 | 69 | 100 | 118 | 128 | 458 | |
Rapid Housing Initiative |
Profile included in summary table at the end of chapter 2. | |||||||
| Expanding the Rental Construction Financing Initiative | - | 44 | 69 | 100 | 118 | 128 | 458 | New in this fall Economic Statement |
| First-Time Home Buyer Incentive Expansion | - | - | - | - | - | - | - | New in this fall Economic Statement |
| 3.3.1.12 Making Communities Safer | - | 53 | 109 | 109 | 82 | 82 | 434 | |
| Prevention of Gang-related Violence | - | 15 | 59 | 59 | 59 | 59 | 250 | New in this fall Economic Statement |
| Equipping RCMP Officers with Body-worn Cameras (gross) | - | 38 | 50 | 50 | 50 | 50 | 239 | New in this fall Economic Statement |
| Less: Costs Recovered | - | - | - | - | -27 | -27 | -54 | |
| 3.3.2 A Competitive, Green Economy | 174 | 685 | 782 | 1,265 | 1,260 | 569 | 4,735 | |
| Home Energy Retrofits | 122 | 299 | 453 | 818 | 817 | 110 | 2,619 | New in this fall Economic Statement |
| Zero Emission Vehicle Infrastructure | - | 20 | 65 | 65 | - | - | 150 | New in this fall Economic Statement |
Incentives for Zero-Emission Vehicles Program Top-up |
54 | 232 | - | - | 1 | - | 287 | Policy Action Announced since the July 2020 Snapshot |
| Nature Based Climate Solutions: Planting 2 Billion Trees | - | 71 | 209 | 301 | 357 | 372 | 1,309 | New in this fall Economic Statement |
| Nature Based Climate Solutions: Climate Smart Ecosystems | - | 38 | 55 | 79 | 85 | 87 | 344 | New in this fall Economic Statement |
Support for Commercial Tree Planting in 2020 and 2021 |
Profile included in summary table at the end of chapter 2. | |||||||
| Strategic Interties | - | 25 | - | - | - | - | 25 | New in this fall Economic Statement |
| Sustainable Finance | - | 2 | 2 | 2 | - | - | 7 | New in this fall Economic Statement |
| Less: Funds from 2020 Snapshot | -2 | -2 | -2 | - | - | - | -7 | |
| 3.3.4 Reconciliation | 391 | 826 | 267 | 368 | 385 | 267 | 2,503 | |
| Supporting Water and Wastewater Infrastructure in First Nations Communities | 365 | 731 | 84 | 86 | 100 | 114 | 1,479 | New in this fall Economic Statement |
| Supporting Infrastructure in Indigenous Communities | 26 | 198 | 229 | 239 | 230 | 253 | 1,175 | New in this fall Economic Statement |
| Less: Funds from Existing Resources | -198 | -229 | -239 | -230 | -253 | -1,149 | ||
| Co-Development of Distinctions-Based Health Legislation | - | 13 | 3 | - | - | - | 16 | New in this fall Economic Statement |
| Mercury Treatment Centres | - | 28 | 32 | 70 | 70 | - | 200 | New in this fall Economic Statement |
| Supporting a National Action Plan for Ending Violence against Indigenous Women, Girls and LGBTQ and Two-Spirit People | - | 54 | 148 | 212 | 215 | 152 | 782 | New in this fall Economic Statement |
| Total - | ||||||||
Policy Actions since EFS 2020 |
58 | 327 | 336 | 391 | 464 | 395 | 1,972 | |
New Investments in Chapter 3 |
2,346 | 5,370 | 1,282 | 1,770 | 1,757 | 960 | 13,485 | |
| Chapter 3 – Net Fiscal Impact | 2,405 | 5,697 | 1,618 | 2,162 | 2,221 | 1,356 | 15,457 | |
Report a problem on this page
- Date modified: