
Chapter 1 - Economic and Fiscal Update
Introduction
Canada’s economy continues to show solid growth. Recent economic performance is rooted in strong domestic conditions, supported by employment gains, which have left the share of working-age Canadians employed at its highest level in Canada’s history, and strong consumer confidence. At the same time, business investment continues to recover.
Since the end of 2015, economic growth has averaged almost 2½ per cent, putting Canada among the leaders for the strongest pace of growth in the Group of Seven (G7) (Chart 1.1). Over the last three years, the unemployment rate has fallen to 5.8 per cent, its lowest level in the past 40 years. As a result of a strong labour market, Canadians are also now benefiting from strong wage growth.
Canada is among the leaders for economic growth in the G7 since late 2015, and the unemployment rate is at a 40-year low
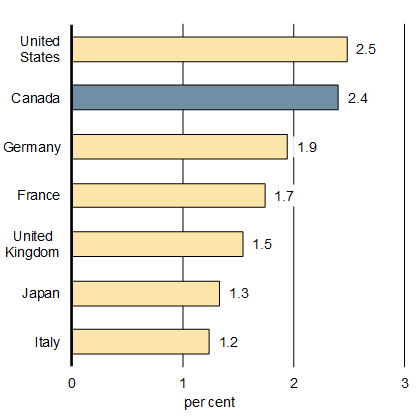
Source: Haver Analytics.
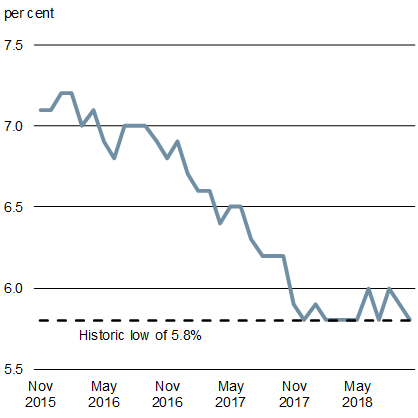
Source: Statistics Canada.
Recent Economic Developments
The Canadian economy has rebounded strongly since the end of 2015. The pick-up in growth can be attributed to a variety of factors—including solid household consumption growth, the positive impacts of coordinated monetary and fiscal policy, and improved global economic conditions. All of these have contributed to strong job growth, rising wages and confidence, and a recovery in business investment.
Stronger growth has been particularly evident in Canada’s job market. Since November 2015, the hard work of Canadians has helped to create about 550,000 full-time positions (Chart 1.2). Employment gains by women have been especially strong, with the pace of job gains more than doubling over the most recent period. As a result, the share of working-age Canadians who are employed—for both the overall population and for women—is at its highest level in Canada’s history. These gains are helping to offset some of the pressures of an aging population, which is weighing on the overall employment-to-population ratio.
The Canadian economy has added 550,000 full-time jobs since November 2015
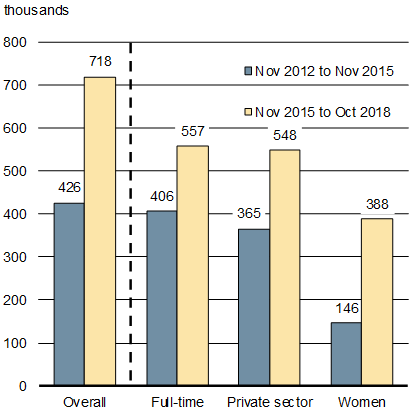
Sources: Statistics Canada; Department of Finance Canada calculations.
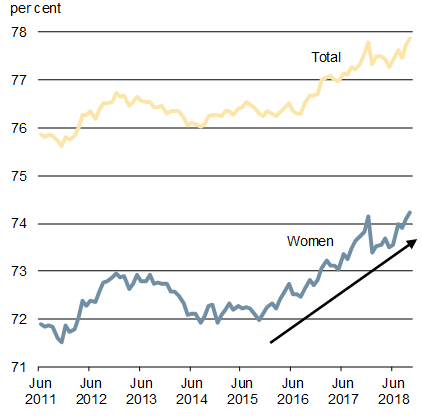
Sources: Statistics Canada; Department of Finance Canada calculations.
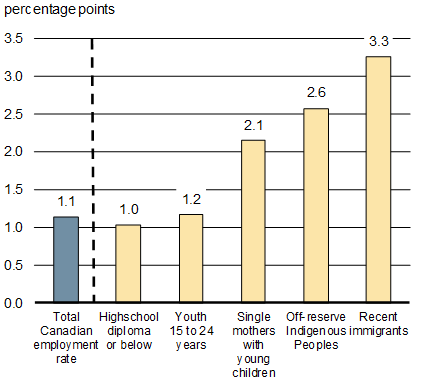
Also encouraging is the clear evidence that vulnerable groups are benefiting from Canada’s economic performance and solid job growth (see below). This development, along with other government investments for children, seniors, lower-wage workers and other vulnerable Canadians, is expected to help support a reduction in the share of Canadians living in poverty. Bringing more people from underrepresented groups into the workforce has been a powerful source of economic growth in recent decades, helping to strengthen the economy.
Recent economic growth is creating employment opportunities for Canadians across the country
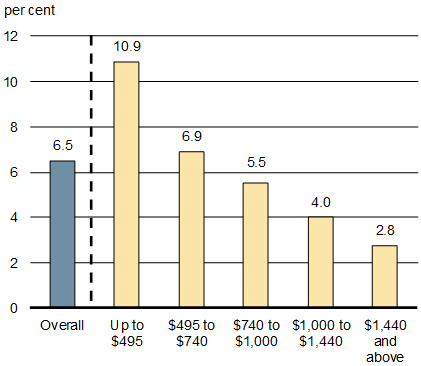
The recent improvement in labour market conditions has been strongest for people who are often underrepresented in the labour market. Over the past few years, the share of working-age Canadians employed has increased notably for recent immigrants, off-reserve Indigenous Peoples, single mothers, youth, and individuals with lower educational attainment (Chart 1.3). As well, the recent pick-up in earnings growth has been shared across income groups, with the lowest income groups seeing the strongest gains (Chart 1.3).
Sources: Statistics Canada; Department of Finance Canada calculations.
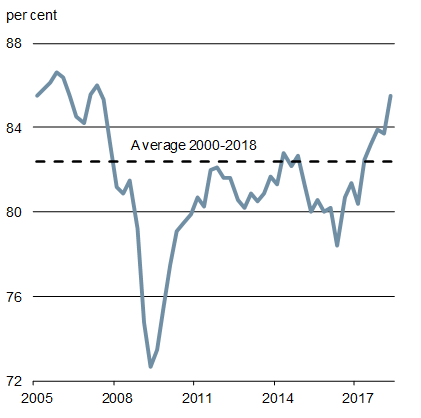
With a tight job market and the economy operating close to its capacity, wage growth has picked up. To date in 2018, Canadians are seeing the strongest wage growth in eight years. Stronger wage growth and improved labour market outcomes have contributed to higher consumer confidence over the past couple of years, which has further supported household spending and overall growth (Chart 1.4). Recently, household spending growth has slowed, led by interest rate-sensitive spending. However, it nonetheless remains at a solid pace.
Rising employment, wage growth and consumer confidence have supported household spending
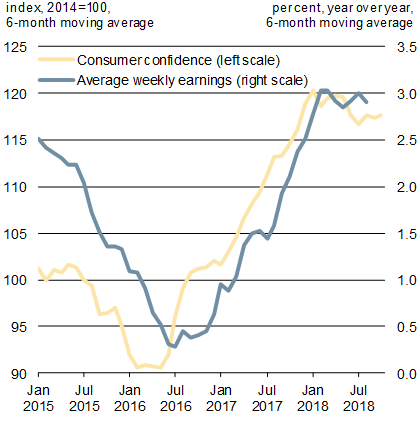
Notes: Survey of Employment, Payrolls and Hours average weekly earnings (all industries including overtime). Last data points are August 2018 for earnings and October 2018 for consumer confidence.
Sources: Statistics Canada; The Conference Board of Canada.
Note: Last data points are 2018Q2.
Source: Statistics Canada.
Improved business confidence and rising capacity pressures have contributed to an upturn in business investment, with business investment climbing by roughly 8 per cent per quarter on average since the end of 2016—the fastest rate of growth over the last six years (Chart 1.5). Since the end of 2016, business investment has improved in the vast majority of provinces, and across a wide range of capital goods.
Businesses appear to be responding to capacity pressures, investing in a wide range of capital goods
Source: Statistics Canada.
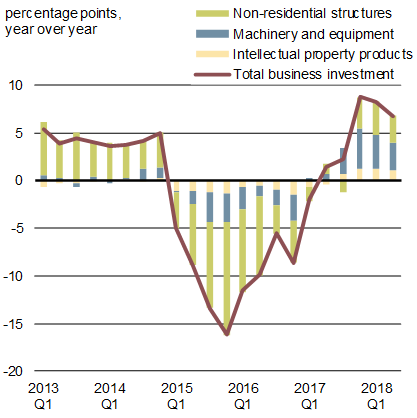
Notes: Average of annualized quarterly growth rate.
Last observation is 2018Q2.
Sources: Statistics Canada; Department of Finance Canada calculations.
All regions of Canada have benefitted from stronger domestic and global conditions. As a result, all provinces realized positive growth in 2017 for the first time since 2011 (Chart 1.6). Similarly, stronger economic conditions have been distributed across the economy, with both services- and goods-producing sectors, including energy and non-energy, contributing positively to economic growth since the end of 2016.
Growth has been broad-based across regions and sectors
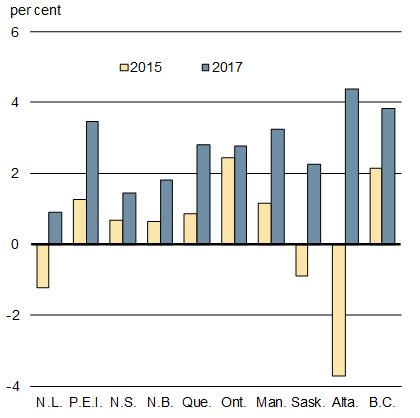
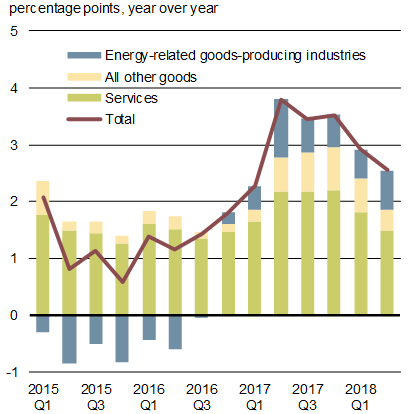
Sources: Statistics Canada; Department of Finance Canada calculations.
There are indications that household financial vulnerabilities are beginning to ease in response to higher interest rates and government actions, including the introduction of a mortgage rate stress test. Growth in household credit has slowed to its weakest pace since 2001, and the household debt-to-income ratio has plateaued. Most importantly, the number of households taking on mortgages that will make them highly indebted (i.e., loan-to-income ratios above 450 per cent) has declined (Chart 1.7).
Housing markets across the country have also cooled, easing concerns about market stability. Recent data indicate that markets where resale activity had weakened—such as Toronto, Vancouver and Calgary—have since steadied or shown some recovery. Price growth in Toronto and Vancouver has softened, particularly for single-family homes, but low inventories are keeping prices high and making affordability challenging for many people.
Vulnerabilities related to high household debt levels are beginning to ease and housing markets have cooled
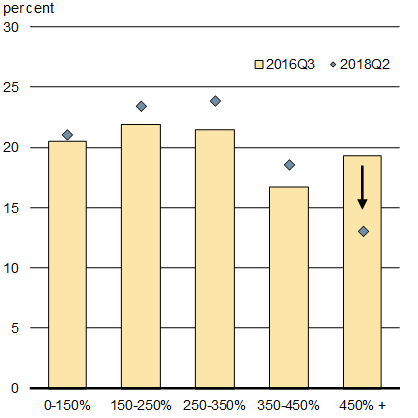
Sources: Regulatory filings of Canadian banks; Department of Finance Canada.
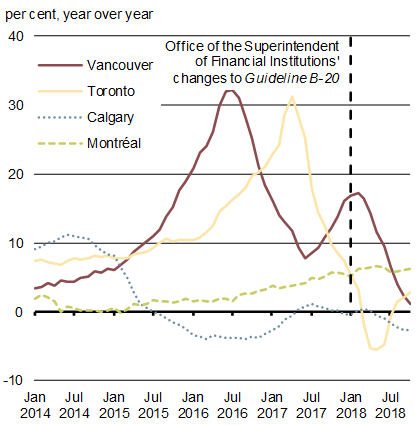
Source: Canadian Real Estate Association.
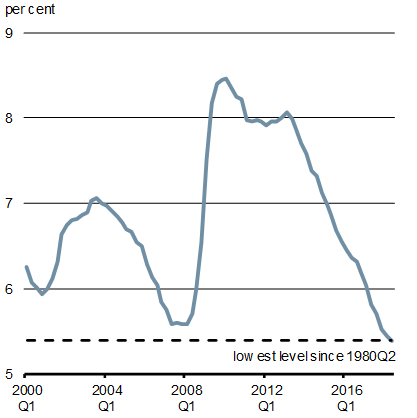
Along with improved domestic economic conditions, a pick-up in global economic activity over the past two years has also supported the rebound in Canada. After reaching a post-recession trough in 2016, global growth has firmed, buoyed by improved performance across most regions of the world and, more recently, by vigorous economic activity in the United States. This widespread growth has helped create the best job market in advanced economies in 40 years, with the unemployment rate in Organisation for Economic Co-operation and Development (OECD) countries at a level unseen since 1980 (Chart 1.8).
Global growth appears to have peaked earlier this year, however, with leading indicators of economic activity suggesting that global growth will slow over the coming quarters to a more moderate pace.
Stronger global growth has also supported the Canadian economy
Sources: OECD Economic Outlook, May 2018.
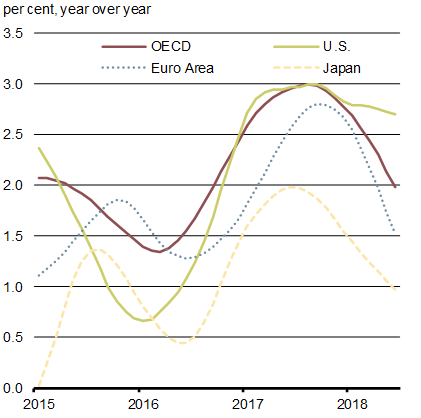
Notes: Trend-restored is one version of the OECD’s leading indicators, designed to give a proxy for GDP growth. Last data point is June 2018.
Source: OECD composite leading indicator.
Updated Economic Outlook
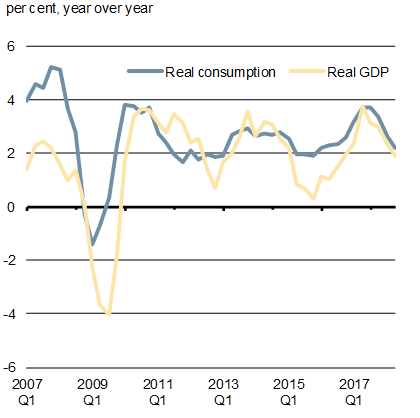
For Canada, real GDP growth has recently moderated to a more sustainable pace, averaging slightly less than 2 per cent per quarter since mid-2017. Over the outlook, private sector economists expect this more sustainable pace to continue, reflecting an economy operating close to its capacity and growing in line with its long-term potential growth rate.
In both 2018 and 2019, real GDP growth is expected to be 2.0 per cent (see Annex 1 for full details of the updated outlook). Over the five-year projection period, real GDP growth is expected to average 1.8 per cent, unchanged compared to Budget 2018 (Chart 1.9).
The outlook for GDP inflation (the broadest measure of economy-wide inflation) has been revised up in both 2018 and 2019 relative to Budget 2018. As a result of these developments, the level of nominal GDP (the broadest measure of the tax base) is higher than the Budget 2018 projection by an average of $9 billion per year over the forecast horizon.
Economists expect real GDP growth to be 2.0 per cent in both 2018 and 2019
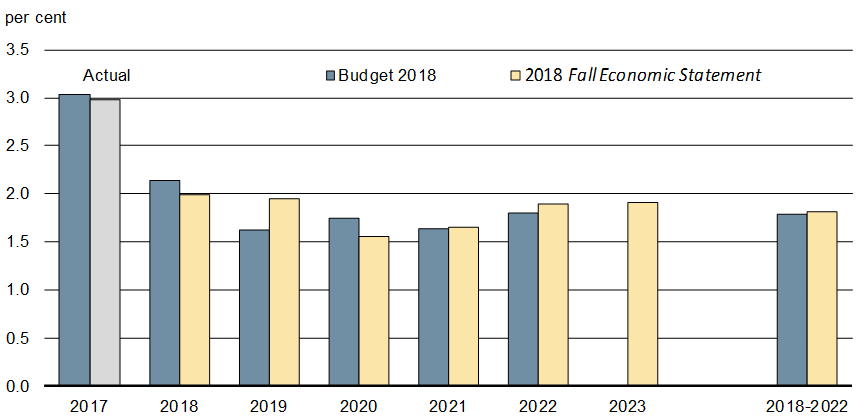
Note: Figures have been restated to reflect the historical revisions to Canadian real GDP series published along with the Provincial and Territorial Gross Domestic Product by Income and by Expenditure Accounts for 2017, released on November 8, 2018.
Sources: For Budget 2018, Department of Finance Canada December 2017 survey of private sector economists, for 2018 Fall Economic Statement, Department of Finance Canada September 2018 survey of private sector economists; Statistics Canada.
Several upside and downside risks could affect the economic outlook. On the upside, household spending and business investment in Canada could be stronger than expected, especially in the context of tight labour market conditions, which is supportive of wage growth, and a more intensive use of existing production capacity by businesses to fulfill growing demand.
For the global economy, there is a risk that the U.S. economy could overheat in light of significant fiscal stimulus at a time when the economy is already performing above capacity. This could induce the Federal Reserve to increase interest rates faster than markets expect, potentially stifling economic activity in the U.S., with negative implications for an open, trading economy like Canada. It could also lead to bouts of global financial turbulence as even tighter global financial conditions driven by higher rates and a stronger U.S. dollar exacerbate vulnerabilities in some emerging economies.
At the same time, the shift towards greater economic protectionism, which has already dampened global trade activity over the past year, could ramp up further. This would present an additional headwind to global trade flows and investment, which could spill over into Canada.
Amid rising trade tensions, financial vulnerabilities have emerged and global trade has slowed
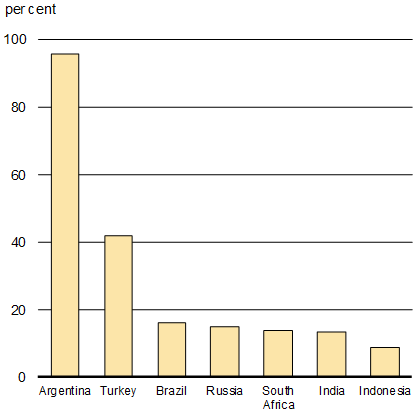
Note: Last data point is November 15, 2018.
Sources: Haver Analytics; Wall Street Journal.
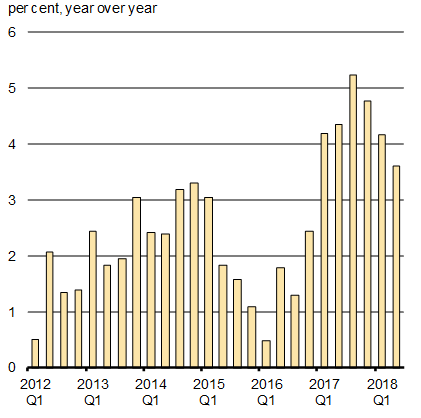
Note: Last data point is 2018Q2.
Sources: CPB Netherlands Bureau for Economic Policy Analysis, CPB World Trade Monitor August 2018; Department of Finance Canada calculations.
Opportunities Ahead
The Canadian economy is well-positioned for continued growth—wages are growing at their fastest rate in eight years, and the recovery in business investment is expected to continue amid a positive investment climate that has been further reinforced with measures included in this Fall Economic Statement and by the recent United States-Mexico-Canada Agreement on trade. This positive outlook is also a reflection of Canada’s many competitive strengths, such as an abundance of natural resources, a highly skilled labour force, preferential access to global markets, and a strong research and start-up capacity in important emerging fields.
Reflecting these strengths, Canada continues to attract top-quality international investments. Public announcements include:
- LNG Canada, a joint venture of five large global companies, recently announced its decision to build a major liquefied natural gas export facility in Kitimat, British Columbia; at $40 billion, this represents the largest single private sector investment in Canadian history.
- Amazon, a global e-commerce and computing company, announced this past spring that it plans to expand its tech hub in Vancouver, British Columbia, with a new office that will employ 3,000 people, in addition to about 1,000 people already working at an existing office in the city. The company has also announced plans to open several new fulfillment centres in Canada, including in Caledon and Ottawa, Ontario.
- Siemens, a large German industrial manufacturer, announced this past spring that it has chosen to establish the Siemens Cybersecurity Centre in Fredericton, New Brunswick. The new centre is expected bring together the company’s expertise in critical infrastructure protection with the province’s emerging cybersecurity ecosystem, and create potential for global exports of locally created technology.
At the same time, Canadian firms are continuing to compete and succeed globally:
- Canada Goose, a maker of iconic winter coats, recently announced the opening of its third clothing manufacturing facility in Winnipeg, Manitoba. The 128,000 square foot plant is the largest of the company’s facilities in Canada, and is expected to create 700 new jobs over the next three years.
- Assent Compliance, an Ottawa-based software firm, raised $130 million from a global private equity firm to continue its global expansion. In providing cloud-based enterprise supply chain data management software and solutions, the company serves suppliers around the world.
- GFL Environmental, a waste management services company headquartered in Toronto, recently merged with Waste Industries—valued at $3.7 billion. The transaction is expected to result in the largest privately owned environmental services company in North America with operations in most Canadian provinces and many U.S. states.
While Canada should be confident in its competitive strengths, there are continued opportunities to improve the performance of Canada’s economy and provide more opportunities for the middle class to benefit from the global economy.
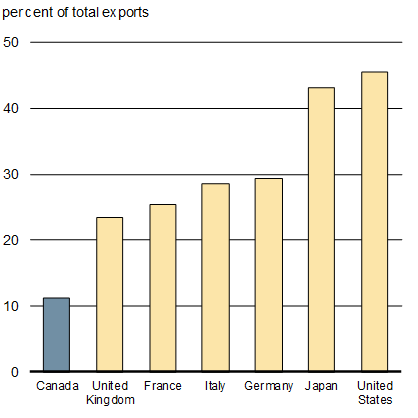
For example, exports of non-energy goods, which represent roughly two-thirds of Canada’s goods’ export volumes, have continued to perform below expectations, and have remained largely unchanged for more than a decade (Chart 1.11).
At the same time, Canada’s share of goods exports going to emerging economies is by far the lowest among its peers, reflecting our close trading relationship with the U.S., as well as intense and growing global competition for growth opportunities abroad.
Non-energy goods exports have been flat over the last decade amidst growing global competition
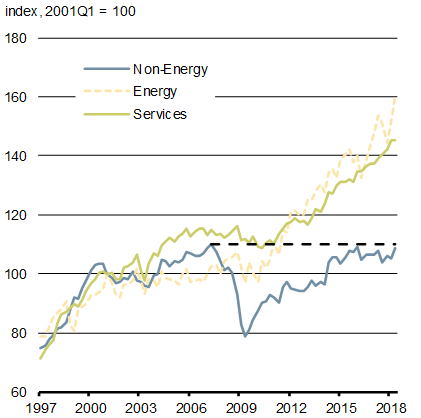
Sources: Statistics Canada; Department of Finance Canada calculations.
Sources: United Nations Comtrade database; International Monetary Fund.
In some instances, Canadian companies are not getting a fair price for their exports. For example, pipeline transportation constraints in Western Canada mean that an increasing amount of Canadian oil is being transported by rail. Since shipping crude oil by rail is costlier, this development has contributed to a higher discount on the Canadian price of crude oil since the end of 2017 (Chart 1.12).
Further, the Western Canadian oil industry’s near-total reliance on the U.S. market for its exports makes Canadian crude oil prices particularly vulnerable to developments in the U.S., such as increases in U.S. production, and pipeline and refinery shutdowns. Indeed, a number of temporary refinery shutdowns in the U.S. have recently contributed to the discount rising to its highest level in more than a decade. As a result, market prices for Western Canada crude oil have declined to historic lows, while world benchmark oil prices remain well above those observed in 2016, in the aftermath of the oil price shock. This has further contributed to a significant loss in income for Canadian oil producers.
As well, not only is shipping crude oil by rail costlier than shipping by pipeline, it also poses a higher risk of spills and raises concerns about oil competing for rail capacity with other commodities produced in Western Canada.
A rising amount of Canadian crude oil is being transported by rail, contributing to a higher discount on the Canadian price of crude oil
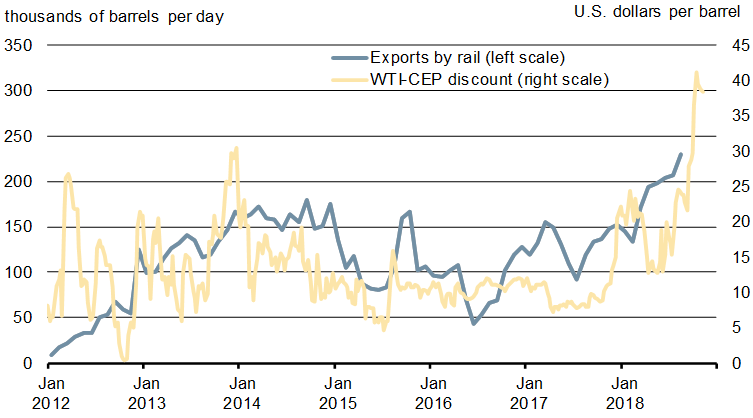
Notes: The Canadian effective price (CEP) is an export-weighted composite of Canadian Light Sweet, Brent (the benchmark for Newfoundland and Labrador light crude oil) and Western Canada Select crude oil prices. The last data point for crude oil exports by rail is August 2018 and the last data point for the Canadian crude oil discount is the week ending November 9, 2018. WTI = West Texas Intermediate crude oil.
Sources: National Energy Board; Commodity Research Bureau; Bloomberg; Department of Finance Canada calculations.
Canada’s oil and gas sector plays an important role in providing the world with a secure, reliable and affordable supply of energy, produced responsibly by a country that has a credible approach to meeting its international greenhouse gas reduction commitments. In addition to providing government revenues to help fund transfers and programs that benefit all Canadians, the sector also provides important economic opportunities for Canada’s Indigenous communities. In 2017, the sector’s labour force had twice as many Indigenous people compared to the average for all industries across Canada.
Updated Fiscal Outlook
The Government continues to deliver on its commitment to strengthen and grow the middle class and offer real help to people working hard to join it—while at the same time carefully managing deficits. Canada’s strong fiscal position has allowed the Government to respond to international developments, such as the recent U.S. tax reform, while maintaining the debt-to-GDP ratio on a downward track and protecting the long-term fiscal sustainability of Canada’s economy. Table 1.1 outlines the fiscal impact of economic and fiscal developments since Budget 2018, including the cost of new measures announced in this Fall Economic Statement. A detailed summary of changes to the fiscal outlook since Budget 2018 is provided in Annex 1.
| Projection | |||||||
|---|---|---|---|---|---|---|---|
| 2017– 2018 |
2018– 2019 |
2019– 2020 |
2020– 2021 |
2021– 2022 |
2022– 2023 |
2023– 2024 |
|
| Budget 2018 budgetary balance1, 2 | -19.9 | -18.8 | -17.8 | -16.5 | -13.2 | -12.0 | n/a |
| Adjustment for risk from Budget 2018 | 3.0 | 3.0 | 3.0 | 3.0 | 3.0 | ||
| Budget 2018 budgetary balance (without risk adjustment) |
-19.9 | -15.8 | -14.8 | -13.5 | -10.2 | -9.0 | |
| Economic and fiscal developments since Budget 2018 | 0.9 | 4.6 | 5.3 | 4.5 | 3.8 | 4.1 | |
| Revised balance before policy actions and investments | -19.0 | -11.2 | -9.5 | -9.0 | -6.4 | -4.9 | -3.2 |
| Policy actions since Budget 20183 | -3.5 | -1.7 | -1.5 | -3.0 | -2.4 | -3.3 | |
| Investments in 2018 Fall Economic Statement | |||||||
| Continued Progress for the Middle Class | -0.0 | -0.1 | -0.2 | -0.2 | -0.2 | -0.3 | |
| Confidence in Canada’s Economic Future | -0.5 | -5.3 | -4.4 | -2.5 | -2.1 | -1.7 | |
| Total investments in 2018 Fall Economic Statement | -0.5 | -5.5 | -4.7 | -2.7 | -2.3 | -1.9 | |
| Total policy actions and investments | -4.0 | -7.1 | -6.2 | -5.7 | -4.7 | -5.2 | |
| Budgetary balance | -19.0 | -15.1 | -16.6 | -15.1 | -12.1 | -9.6 | -8.4 |
| Adjustment for risk | -3.0 | -3.0 | -3.0 | -3.0 | -3.0 | -3.0 | |
| Final budgetary balance (with risk adjustment) | -19.0 | -18.1 | -19.6 | -18.1 | -15.1 | -12.6 | -11.4 |
| Federal debt (per cent of GDP) | 31.4 | 30.9 | 30.5 | 30.3 | 29.8 | 29.2 | 28.5 |
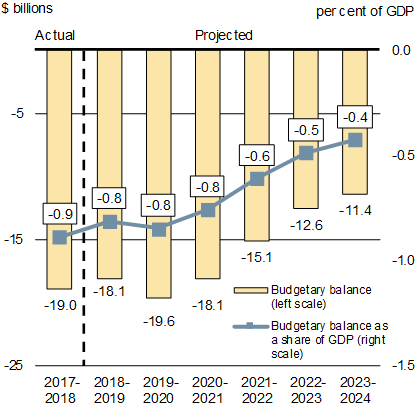
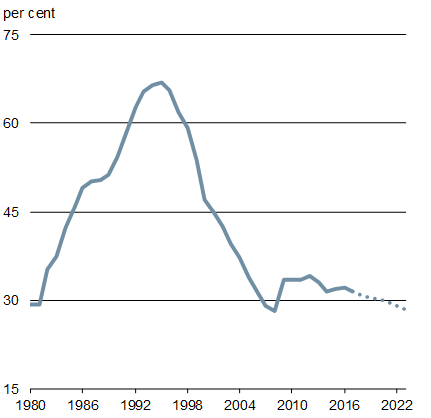
The 2018 Fall Economic Statement continues to carefully manage deficits over the medium term. After including the measures proposed in this Statement, the deficit is projected to decline from $19.6 billion in 2019–20 to $11.4 billion by 2023–24, with a projected continuous decline in the federal debt-to-GDP ratio, which is expected to reach 28.5 per cent in 2023–24 (Chart 1.13).
The Government continues to carefully manage deficits to ensure long-term fiscal sustainability for future generations of Canadians
Sources: Fiscal Reference Tables; Department of Finance Canada calculations.
Sources: Fiscal Reference Tables; Department of Finance Canada calculations.
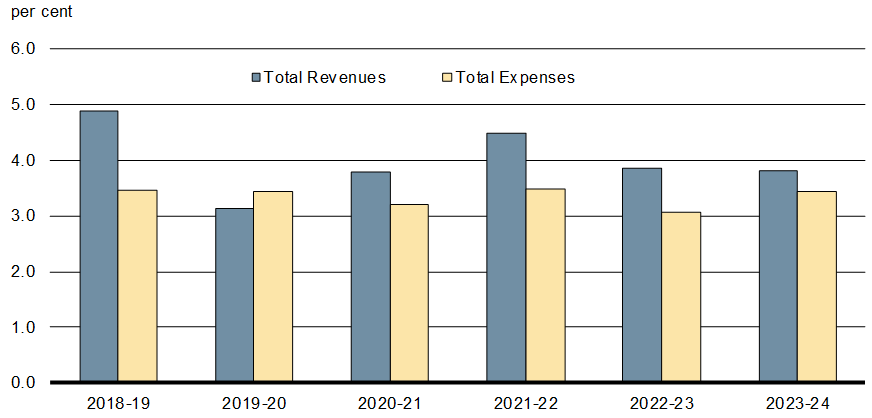
Budgetary revenues are expected to grow on average by 4.0 per cent annually over the forecast horizon, in line with economic growth over the period, while expenses are expected to grow at approximately 3.3 per cent per year (Chart 1.14).
On average, budgetary revenues are expected to grow faster than expenses over the forecast horizon
Source: Department of Finance Canada calculations
- Date modified: