Archived - Update of Economic and Fiscal Projections — 2014: Part 2 of 4
Archived information
Archived information is provided for reference, research or recordkeeping purposes. It is not subject to the Government of Canada Web Standards and has not been altered or updated since it was archived. Please contact us to request a format other than those available.
Chapter 2
Economic Developments and Prospects
Introduction
While Canada's economy has continued to post solid growth, the global economy has continued to surprise on the downside. Growth in China has been weaker than expected and growth in the euro area has once again stalled. This much softer-than-anticipated pace of economic activity early this year has led forecasters to again revise down the global growth outlook, and to postpone to 2015 their expectations for a return to a stronger global growth path.
In part reflecting expectations of weaker global growth, financial markets underwent a period of heightened volatility starting in mid-October, with sharp declines recorded in major equity markets, a fall in bond yields in advanced economies and an increase in risk spreads. Global commodity prices also declined sharply, reflecting expectations of weaker demand and concerns about oversupply in crude oil markets. Although markets have stabilized more recently, this period of turbulence points to the continued fragile and uncertain nature of the global recovery.
In this challenging economic environment, the Canadian economy has performed relatively well. Over the recovery, the expansion in Canada's real gross domestic product (GDP) has outpaced that of all its Group of Seven (G-7) peers and employment growth has been among the strongest in the group. Over 1.2 million net new jobs have been created in Canada since the end of the recession, overwhelmingly full-time, in high-paying sectors and in the private sector.
However, weak global growth continues to weigh on the Canadian economy. Weak external demand has restrained export growth since the end of 2011, increasing uncertainty over future demand prospects and weighing on business investment.
This chapter reviews major global and Canadian economic developments since Budget 2014, presents the September 2014 average private sector economic forecast that forms the basis for the fiscal projections presented in this Update, and discusses the risks and uncertainties surrounding this economic forecast.
Note: All growth rates in this chapter are reported at annual rates unless otherwise noted.
Global Economic Developments and Outlook
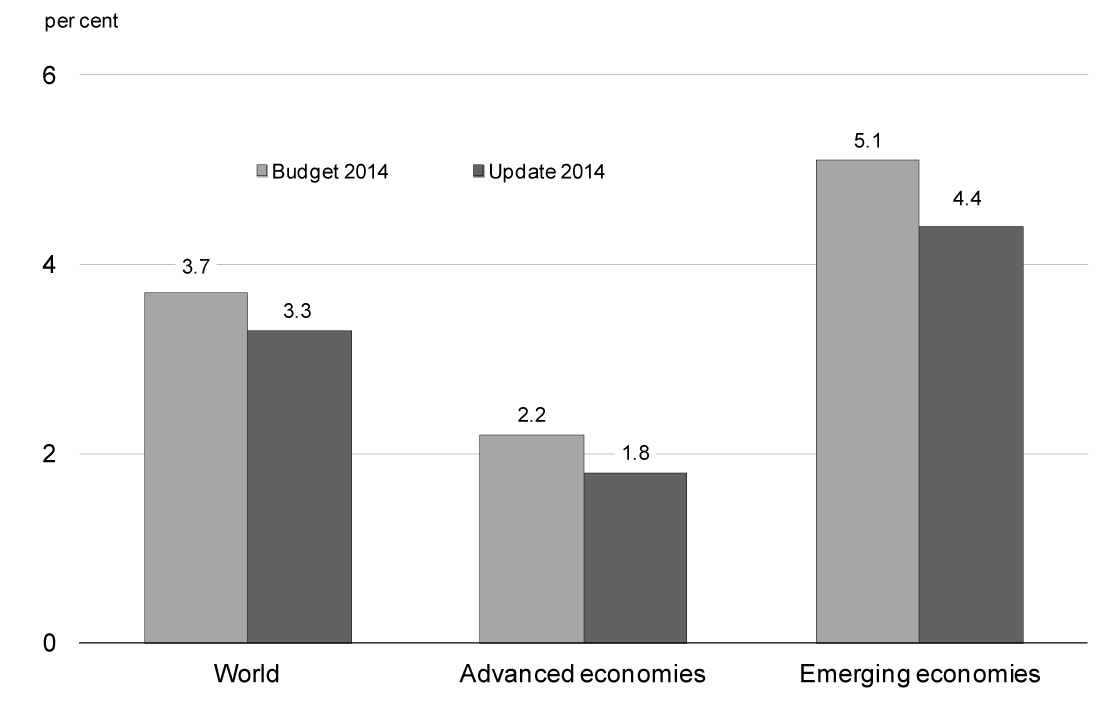
The global economy grew at a subdued pace in the first half of 2014. This largely reflected a contraction in the U.S. at the start of the year, stagnation in euro-area activity and slower growth in the first quarter in China. As well, growth in a number of other large emerging economies was below expectations. As a result, global growth projections for the year as a whole have been marked down from expectations at the time of Budget 2014 (Chart 2.1).
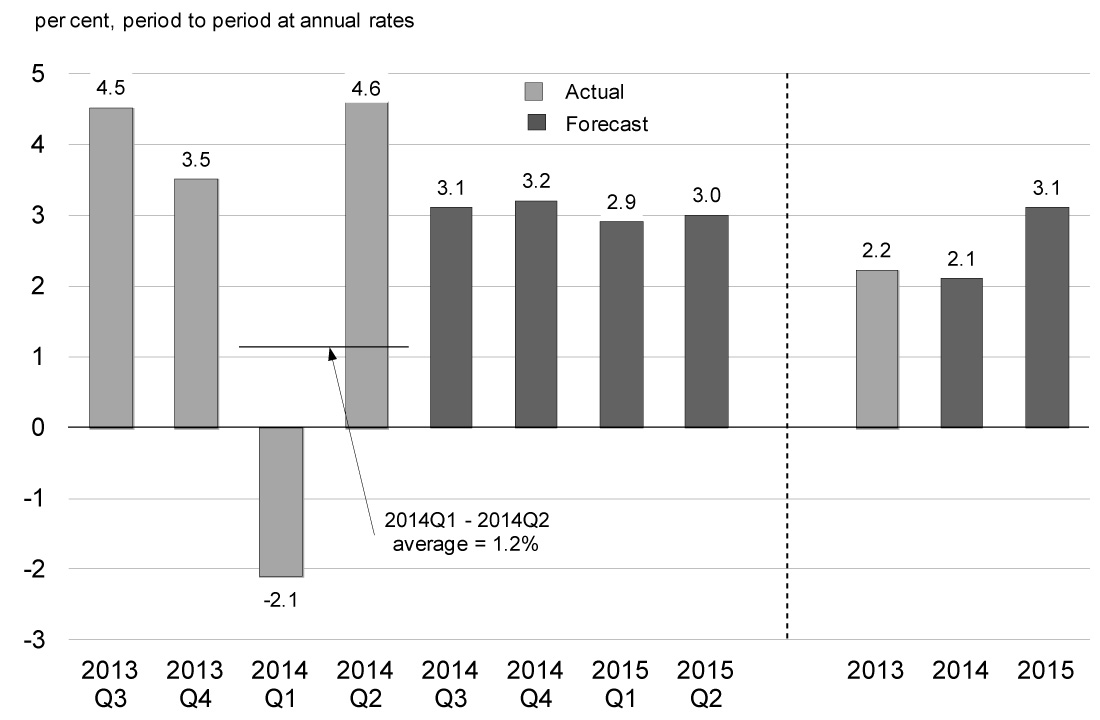
In the United States, output contracted unexpectedly by 2.1 per cent in the first quarter of this year, before rebounding to a robust 4.6 per cent in the second quarter as temporary factors, including inclement weather, receded. Growth averaged a weak 1.2 per cent over the first half of the year. Growth was 3.5 per cent in the third quarter, modestly above expectations in the September survey of private sector economists (Chart 2.2). Economic activity is expected to continue at about 3 per cent for several quarters, similar to what was anticipated at the time of Budget 2014. Overall, private sector economists expect U.S. real GDP to grow by 2.1 per cent this year, similar to its pace of 2.2 per cent in 2013, but then to improve to 3.1 per cent in 2015.
Domestic demand is expected to be a key driver of the improvement in U.S. growth, supported by rising financial and housing wealth, improving labour market conditions, expanding credit and continuing accommodative monetary policy. Moreover, there has been a reduction in fiscal uncertainty in the near term as recent budget deals have set out the government’s funding levels until September 2015. However, negotiations on the U.S. debt limit are set to ramp up in March 2015, potentially increasing uncertainty.
U.S. labour market indicators, which lagged Canada's gains coming out of the recession, have been encouraging. Monthly job gains have picked up from about 195,000 on average in 2013 to about 230,000 so far this year, while the unemployment rate has declined to 5.8 per cent. Nonetheless, wage growth is modest, broader measures of unemployment (such as those which include individuals who are working part-time but would prefer to be working full-time) remain elevated and the labour force participation rate has declined markedly. Reflecting this, U.S. forecasters expect inflation to rise only gradually going forward.
Consistent with the improvement in the U.S. outlook, the U.S. Federal Reserve had been reducing the pace of asset purchases under quantitative easing since the beginning of this year, and decided at its October 29th meeting to conclude purchases at the end of October. Financial markets expect the first policy rate increase in the second half of 2015. Nonetheless, the overall monetary policy stance is expected to remain highly accommodative, as the policy rate is expected to remain low for some time.
In the euro area, the recovery remains elusive. In mid-2013, the economy returned to tepid growth after a year-and-a-half-long recession. However, the recovery stalled in the second quarter of 2014, as economic activity in the three largest economies—Germany, France and Italy—contracted.
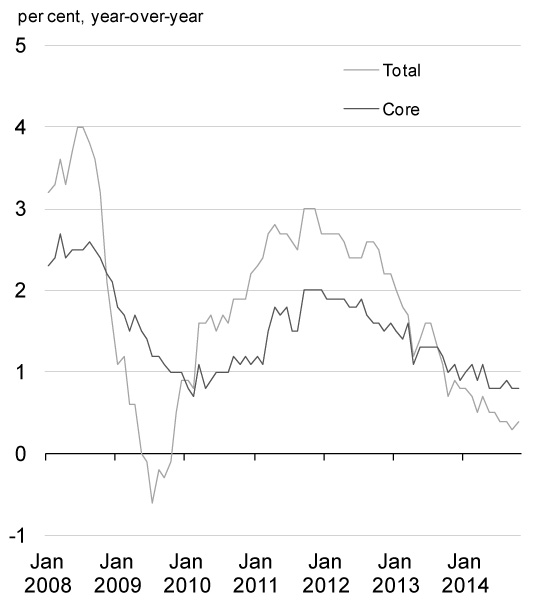
Persistently low inflation (0.4 per cent in October 2014 and below 1 per cent for 13 consecutive months) is posing new challenges as it raises real borrowing costs, which could slow the recovery and make it more difficult to reduce already-high debt burdens (Chart 2.3). Indeed, inflation expectations have recently drifted down, raising the risk of even lower inflation or deflation.
Source: Haver Analytics.
Despite some improvement over the past year, euro-area peripheral economies (Greece, Italy, Portugal and Spain) remain a source of uncertainty in the region. Financial conditions are still tight and the repair of European banks’ balance sheets is progressing slowly, leaving the banking sector vulnerable to negative shocks. In addition, Spain and Greece are currently in deflation, putting further pressure on fiscal sustainability in these countries. In Greece, political uncertainty has risen and markets are questioning the country’s ability to secure sufficient funding in the coming years. Progress on individual countries’ structural reforms has also generally been disappointing and risk of reform slippage is rising. As a result, sovereign borrowing costs for some of these at-risk economies have once again begun to rise.
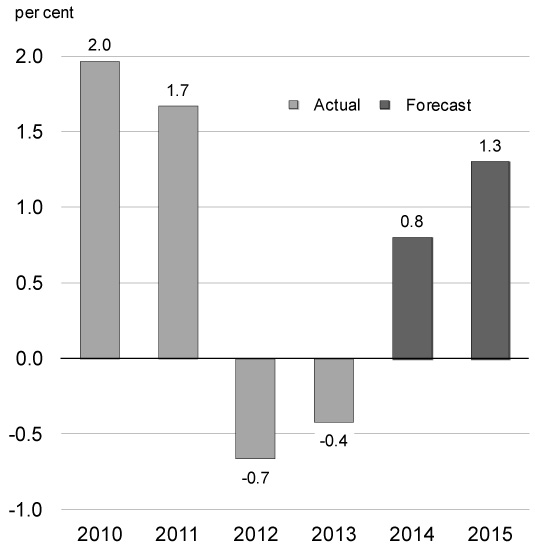
In response to the deteriorating economic situation and threats to price stability, the European Central Bank introduced two rounds of monetary easing measures in June and September. These include reducing its interest rates to the effective lower bound, introducing targeted liquidity provisions for banks, which began in September, and introducing two new purchase programs for certain private assets, including covered bonds (which began on October 20) and asset-backed securities (scheduled to start sometime in the fourth quarter). Looking ahead, after a contraction in economic activity in both 2012 and 2013, the IMF expects the euro area to post positive but weak growth of 0.8 per cent in 2014, with a modest pickup to 1.3 per cent in 2015. The recovery will continue to be constrained by high unemployment, the need for structural reforms and the necessary balance sheet adjustments in the public and banking sectors.
In the United Kingdom, output growth has continued at a brisk pace since Budget 2014 and unemployment has fallen to post-crisis lows. The IMF projects that growth will pick up from 1.7 per cent in 2013 to 3.2 per cent in 2014 and 2.7 per cent in 2015, driven by both consumption and business investment.
Japan faces an uncertain growth outlook. After growth above 3 per cent on average over the five preceding quarters, real GDP contracted by 7.1 per cent in the second quarter of 2014, as consumers brought forward purchases ahead of an April 1 consumption tax increase. Recent inflation readings have also been lower than expected. As a result, the Bank of Japan recently announced additional easing measures, including increasing the pace of its asset purchases under quantitative easing. The IMF expects growth to slow from 1.5 per cent in 2013 to 0.9 per cent in 2014 and 0.8 per cent in 2015.
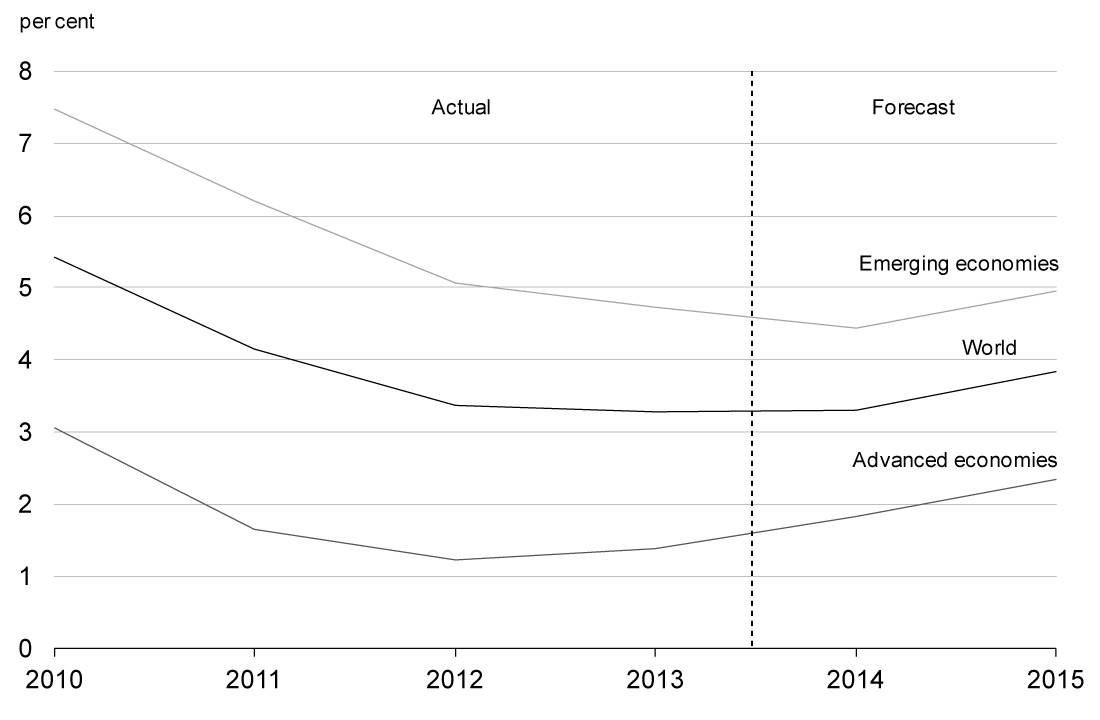
In emerging economies, growth appears to have eased further in 2014, driven by negative developments in a few large economies. In particular, growth in China is slowing, Brazil is in recession and the Russian economy has decelerated sharply. Looking to 2015, the IMF expects growth in emerging economies to improve to 5.0 per cent from 4.4 per cent this year, reflecting increased policy support, a lessening in geopolitical and domestic tensions, and stronger external demand from advanced economies.
In China, the IMF expects real GDP growth in 2014 to ease to 7.4 per cent, down from 7.7 per cent in both 2013 and 2012. This is well below the 10-per-cent average annual growth over the decade preceding the global recession and the weakest pace since 1990. Growth is expected to ease further to 7.1 per cent in 2015 (Chart 2.4).
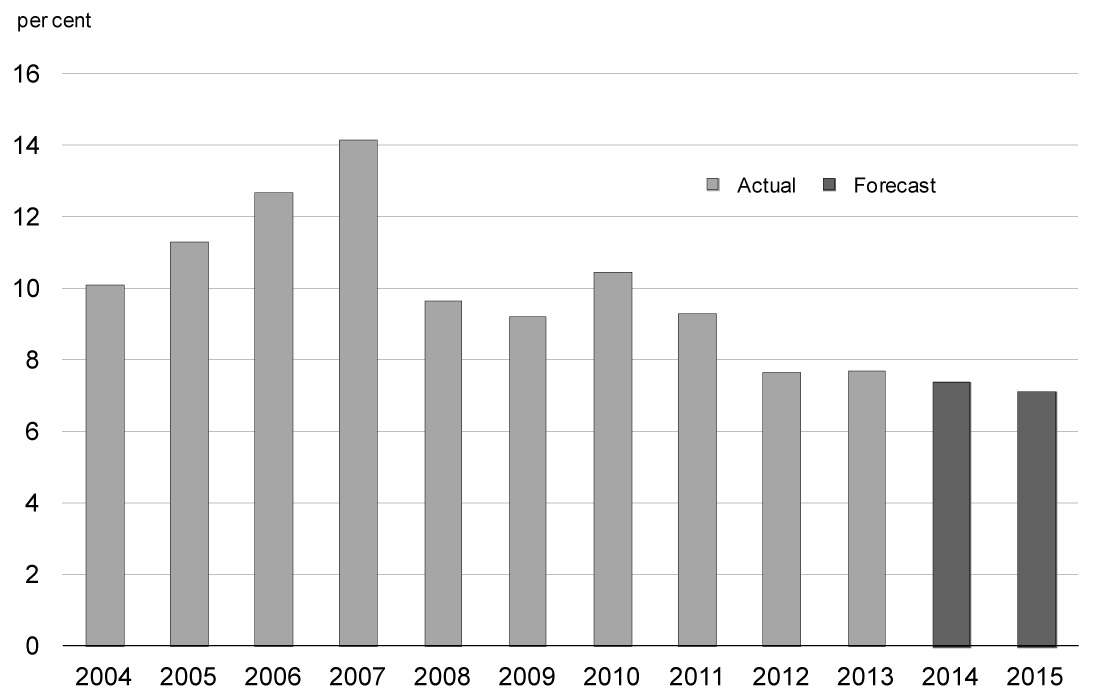
To some extent, this growth slowdown has been intentional and reflects measures to rein in credit growth and high property prices, as authorities seek to shift to a more sustainable growth model with greater reliance on domestic consumption. However, in the past several months, Chinese authorities have implemented targeted stimulus measures including an acceleration of infrastructure projects, a selective loosening of banks’ reserve requirements, liquidity injections in certain banks and an easing of mortgage policies. The uneven nature of these policies reflects the challenge facing the authorities of implementing financial and economic reforms, while at the same time maintaining the pace of growth near its 7.5-per-cent official target. Moreover, China’s economy continues to face risks from its lightly regulated shadow banking sector, the state of the housing sector, and high levels of local government debt.
Overall, the IMF now expects global growth of 3.3 per cent for 2014, unchanged from 2013, with slightly stronger growth in advanced economies offset by a modest deceleration in emerging economies’ growth. For 2015, global growth is expected to pick up to 3.8 per cent (Chart 2.5).
Financial Market Developments
Ongoing accommodative monetary policies across most major advanced economies have led to declines in 10-year government bond rates since Budget 2014. In particular, anticipation of an eventual reduction of policy rates and targeted credit easing by the European Central Bank pushed euro-area interest rates down significantly through the first half of the year, while safe-haven flows into U.S. and Canadian government bonds led to lower rates in these countries. While government bond rates in major economies ticked up temporarily over the first half of September, growing uncertainty over the strength of the global recovery has weighed on market sentiment more recently. This has resulted in a return of safe-haven inflows, pushing rates down to historical lows (Chart 2.6).
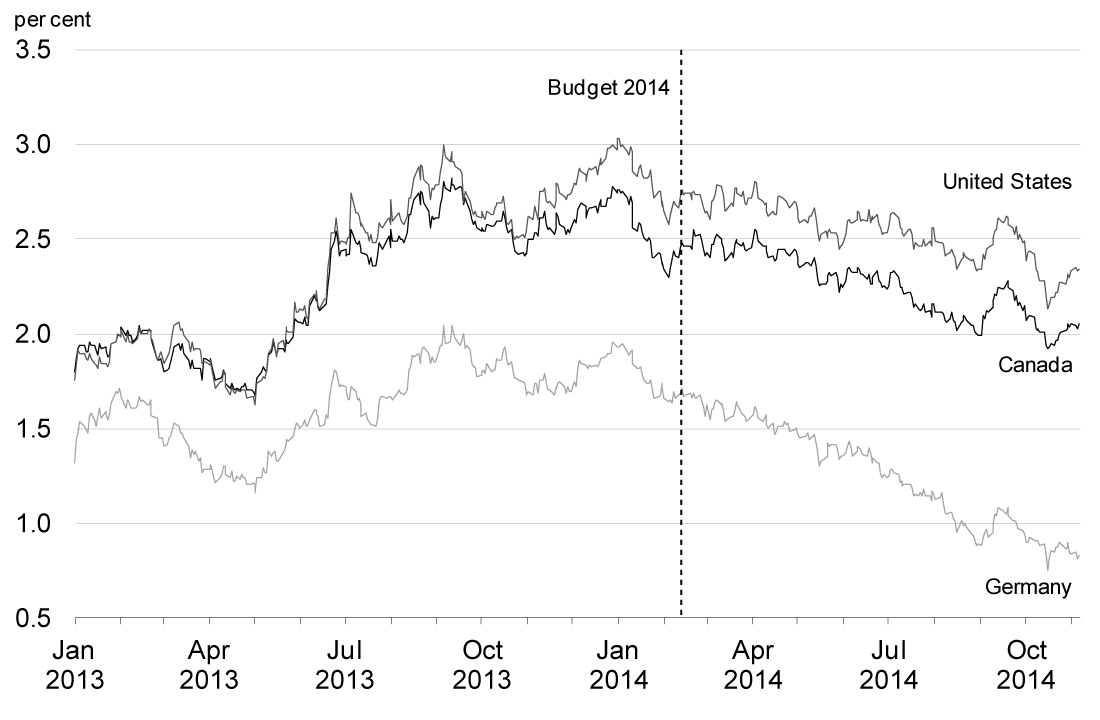
Source: Bloomberg.
Accommodative monetary policies, which have helped to support global growth over the recovery, have been accompanied by greater investment in equity markets. This, along with signs of improving economic growth in the U.S., translated into higher equity prices during 2013 and most of 2014 (Chart 2.7). More recently, however, market uncertainty over the global economic outlook has translated into significant declines in equity prices since mid-September, culminating in a sharp retrenchment by mid-October. While equity markets have since recouped some lost ground, with a new record high reached in the United States, Canadian and European equity market indexes remain below their recent peaks.
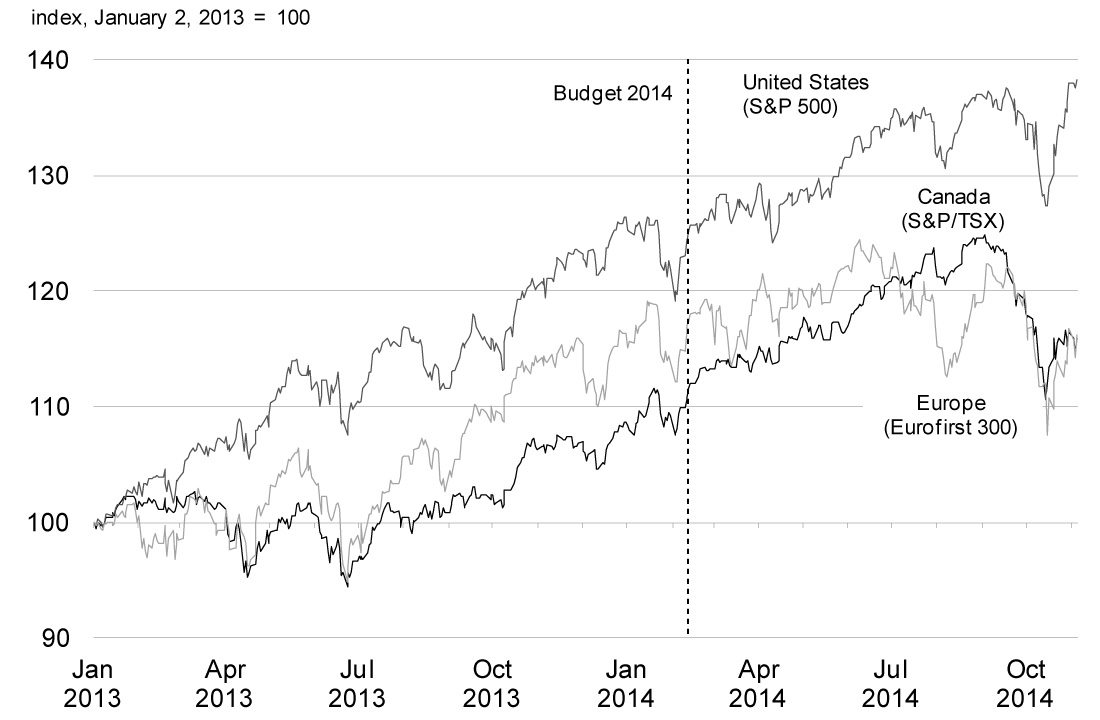
Source: Haver Analytics.
Commodity Prices
Since Budget 2014, the Department of Finance total commodity index has declined by 14 per cent, driven by a decline in energy prices (Chart 2.8). As discussed below, this decline was led by lower crude oil prices, reflecting both strong supply growth and weaker-than-expected global demand as well as growing uncertainty over the strength of the global recovery. Natural gas prices have also declined sharply, after spiking earlier this year due to the very strong demand and sharp drawdown in inventories that resulted from an extremely cold U.S. winter. Non-energy commodity prices have declined slightly since Budget 2014, as modest gains in agriculture prices, reflecting low supply, have been offset by lower metals and forestry prices.
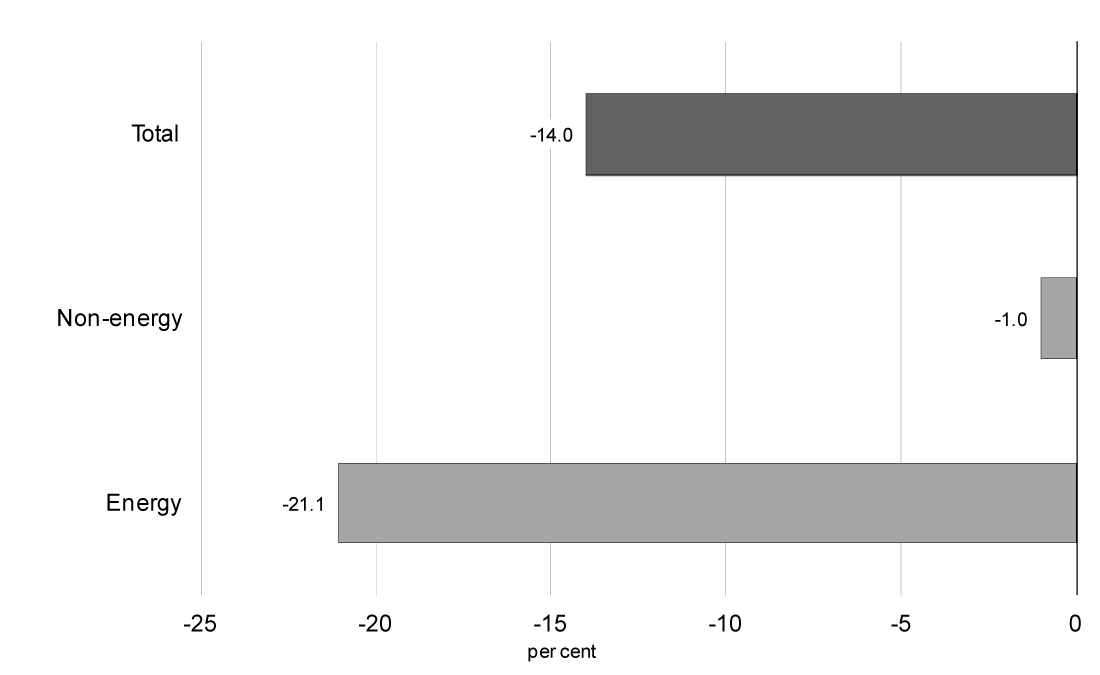
Sources: Commodity Research Bureau; Bloomberg; Flint Hills Resources; Department of Finance calculations.
Global crude oil prices have declined markedly since Budget 2014, with the bulk of this decline occurring since July. The decline in global prices reflects a number of factors including weaker-than-expected global demand, ongoing production increases in North America which have displaced crude oil imports from overseas, and an easing of concerns of supply disruptions due to geopolitical unrest in Iraq and Libya.
Increased supply from Libya, in particular, has put significant downward pressure on prices since mid-2014, as its production rose from near-zero early in the year as a result of civil unrest to close to 1 million barrels per day currently. In response, Saudi Arabia announced in August that it had cut its production by approximately 400,000 barrels per day, and market watchers at that time anticipated that the Organization of the Petroleum Exporting Countries (OPEC) would formally reduce production quotas at its upcoming meeting in late November. More recently, however, Saudi Arabia has signalled that it would be prepared to accept prices (the OPEC Basket Price, which is very similar to the global Brent benchmark) in the US$80 range, raising doubts over whether OPEC will reduce production levels in late November, which has put further downward pressure on global prices. Finally, global crude oil prices have been further depressed recently by refinery maintenance shutdowns in Europe, which are temporarily adding to the oversupply of crude in the region.
Canadian crude oil prices have also declined since the summer, reflecting lower global prices and continued increases in North American production. The decline in Canadian prices was initially more modest than for either the global Brent or the U.S. West Texas Intermediate (WTI) benchmarks, as prices for Canadian heavy crude oil, which represents approximately two-thirds of Canadian crude oil exports, were much less affected by oversupply than light crude (such as the Brent and WTI benchmarks) in global markets (Chart 2.9). However, increasing downward pressure from lower global crude oil price benchmarks has pushed down Canadian heavy crude oil prices since early October, leaving the decline in overall Canadian oil prices since the summer broadly in line with the fall of global oil price benchmarks.
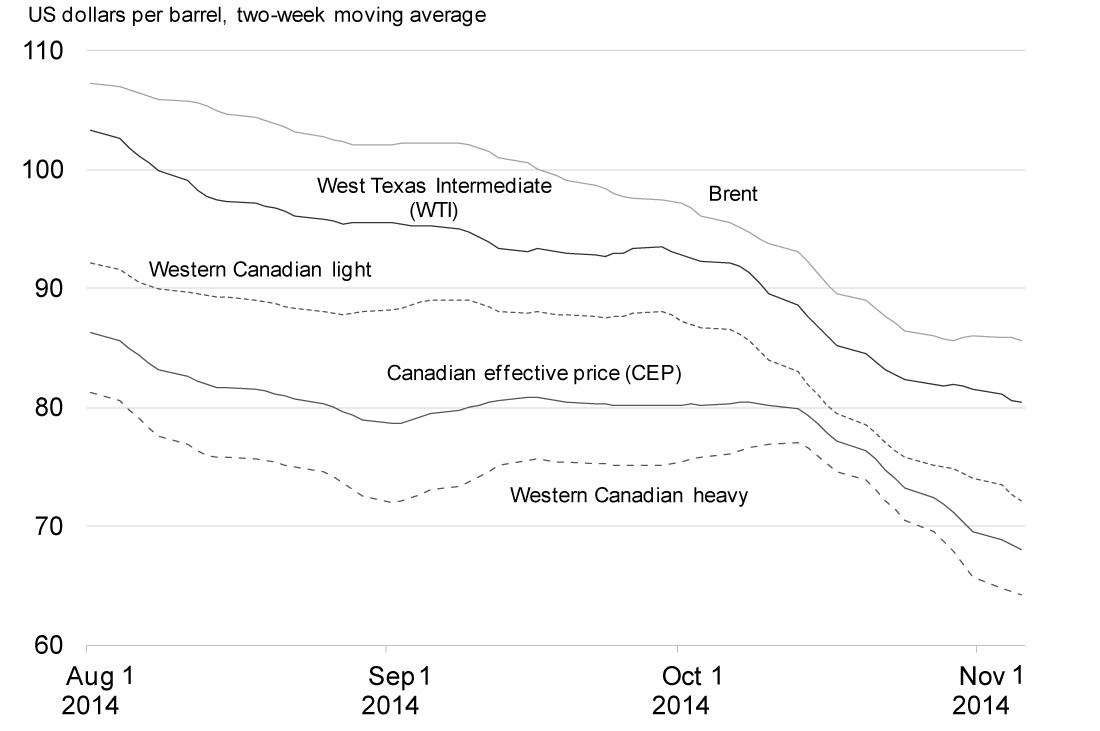
Sources: Commodity Research Bureau; Bloomberg; Flint Hills Resources; Department of Finance calculations.
As a result, while the discount on Canadian crude oil relative to the global Brent benchmark had narrowed to approximately US$12 per barrel on average over the first half of October, only modestly above its average discount over the 2005–2010 period, by early November this discount had once again risen to approximately US$17 per barrel (Chart 2.10). This ongoing variation in Canadian prices relative to global benchmarks underscores the continued uncertainty facing Canadian producers over U.S. refinery demand amid the potential for continued growth in U.S. crude oil supply. As a result, without improved access to global markets, Canada's continued dependence on the United States as the destination for virtually all of its crude oil exports will continue to translate into Canadian crude oil prices that are both lower and more volatile than those prevailing globally going forward.
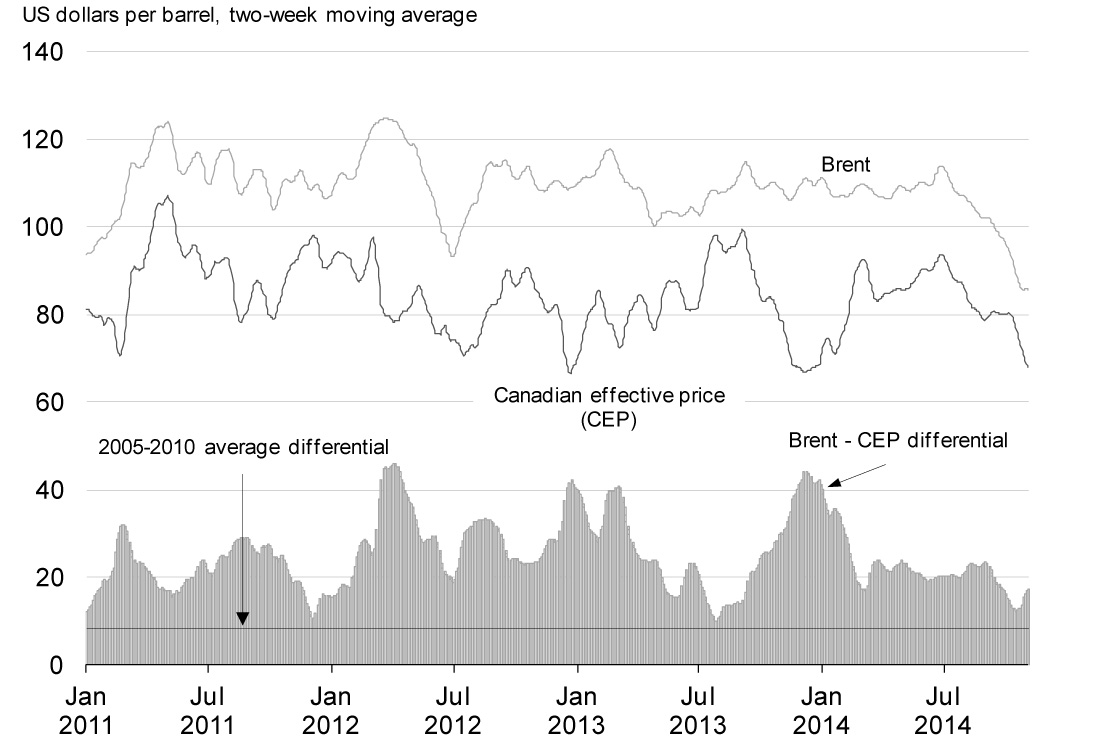
Sources: Commodity Research Bureau; Bloomberg; Flint Hills Resources; Department of Finance calculations.
Canada's Economic Performance
The Canadian economy remains resilient despite the challenges posed by a weak and uncertain global economic environment, and Canada continues to lead all other G-7 economies in real GDP growth over the recovery (Chart 2.11).
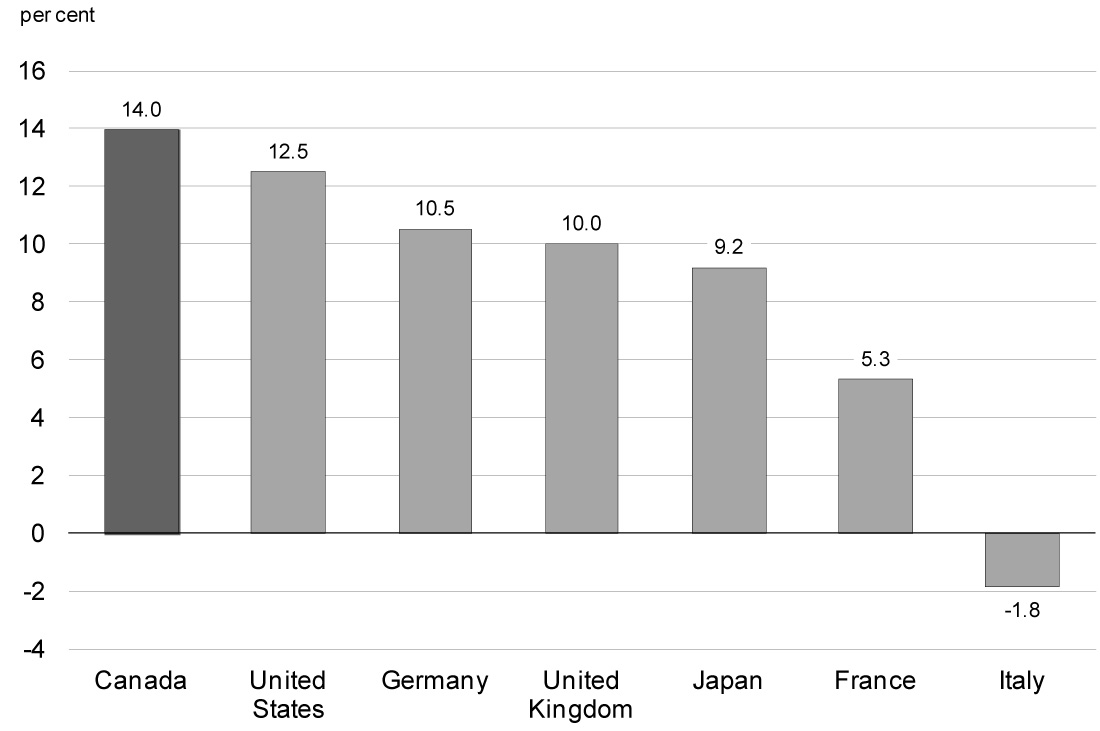
Sources: Haver Analytics; Department of Finance calculations.
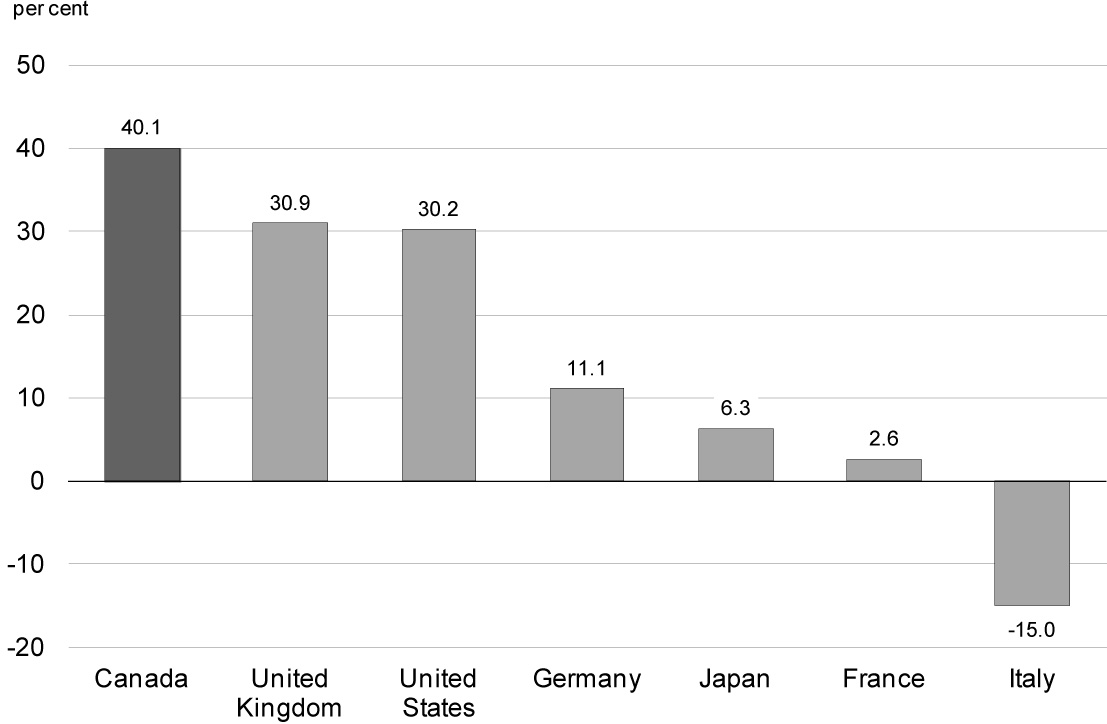
Canada's strong economic performance has been driven by a solid domestic economy, with Canada enjoying continuous growth in private domestic demand since the end of the recession. This sustained growth has been led by the strongest growth in real business investment in the G-7 over the recovery (Chart 2.12).
Sources: Statistics Canada; United Kingdom Office for National Statistics; German Federal Statistical Office; Haver Analytics; Department of Finance calculations.
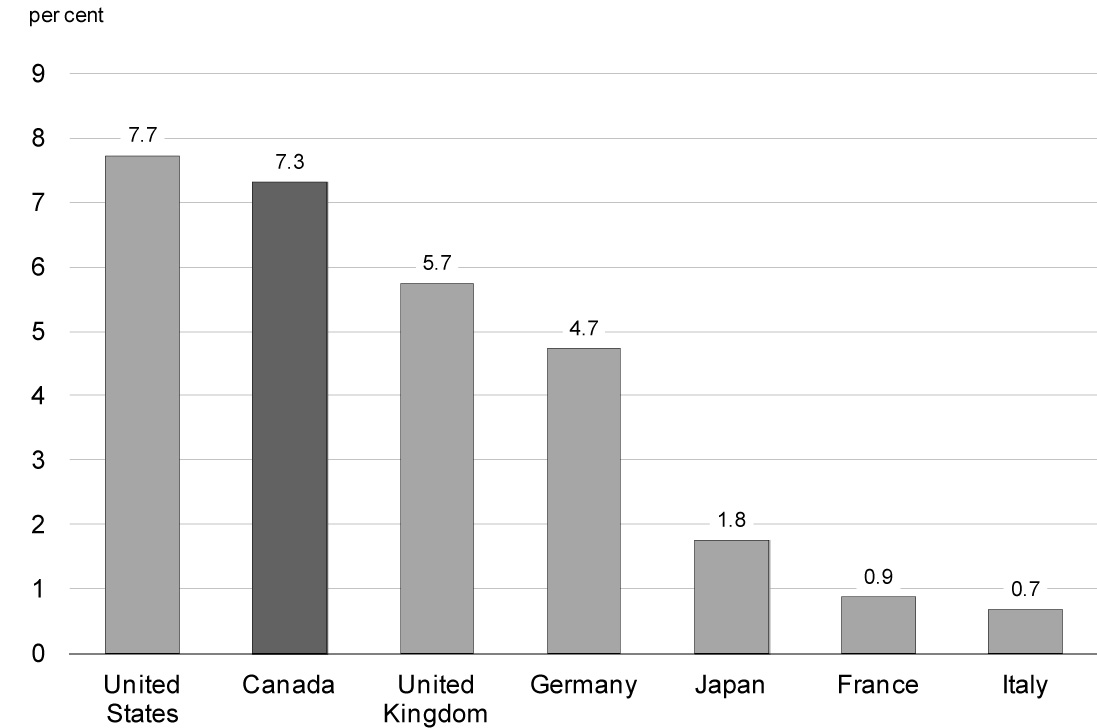
Canada's strong real GDP growth over the recovery has translated into one of the strongest job creation performances in the G-7, with over 1.2 million more Canadians now working than in July 2009, when the recovery began—an increase of 7.3 per cent (Chart 2.13).
Sources: Haver Analytics; Department of Finance calculations.
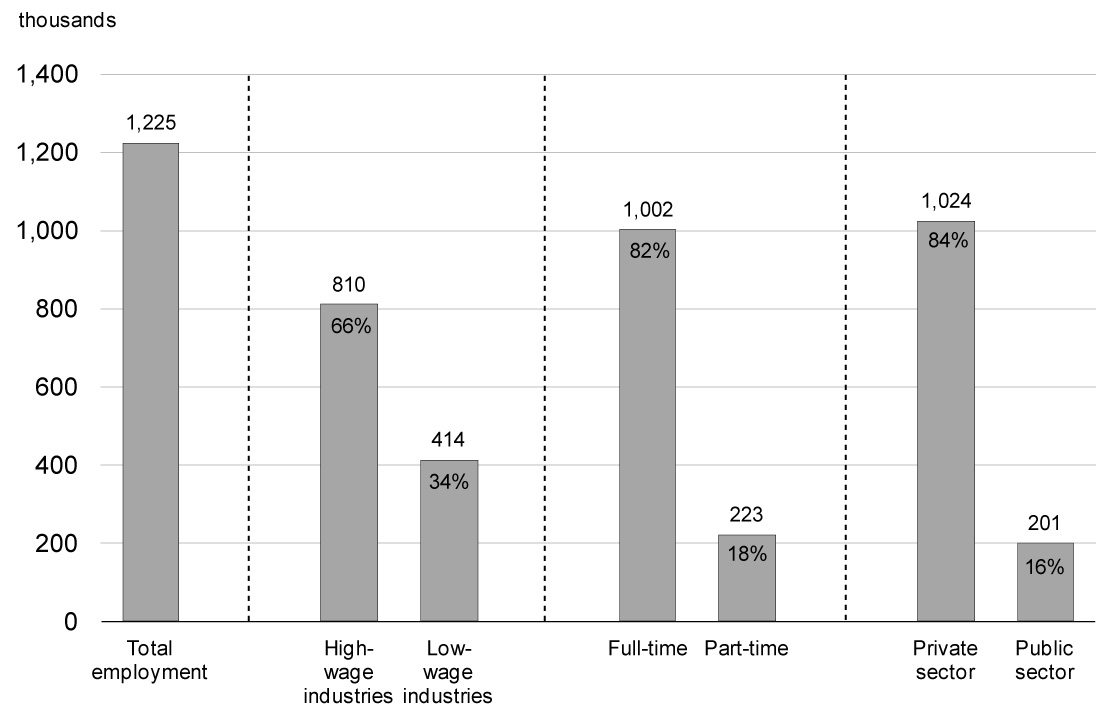
Moreover, over the recovery, more than 80 per cent of all jobs created have been full-time positions and about two-thirds in high-wage industries. Most importantly, almost 85 per cent of the jobs created have been in the private sector, which has been an important factor supporting Canada's sustained economic growth (Chart 2.14).
Sources: Statistics Canada; Department of Finance calculations.
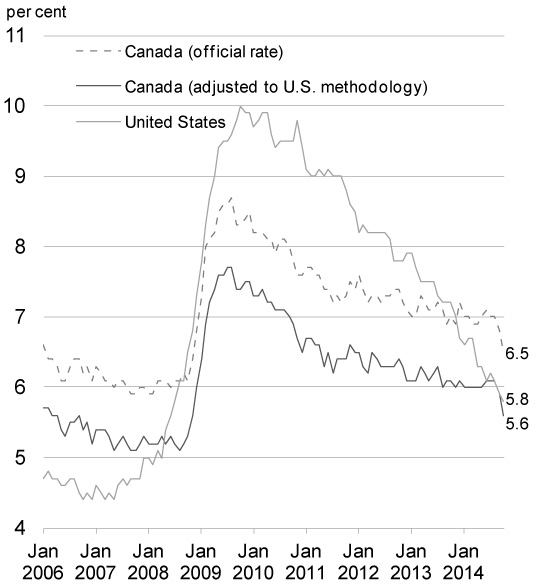
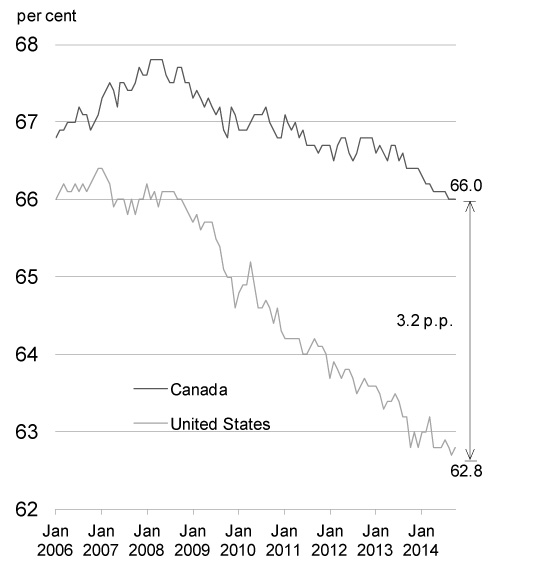
Canada's employment situation contrasts sharply with that of the U.S., where employment is now only 1.0 per cent above its pre-recession peak, compared to 4.6 per cent in Canada. When measured on the same basis, the unemployment rate in the U.S. is 0.2 percentage points higher than in Canada1 (Chart 2.15). Moreover, this comparison does not take into account the large difference in the labour force participation rate between the two countries. The Canadian labour market has maintained a much higher labour force participation rate compared to the United States, where the participation rate has fallen by 2.7 percentage points since mid-2009 and stands near a 36-year low.2 As a result, Canada's labour force participation rate remains more than 3 percentage points higher than in the United States.
The stronger performance of the Canadian labour market is also reflected in the long-term unemployment rate (the number of people unemployed for a period of at least 27 weeks as a share of the labour force). Canada's long-term unemployment rate stood at 1.4 per cent in 2013, below its historical average since 1976 and well below the U.S. level of 2.8 per cent, which remains more than double its average over the same period (Chart 2.16).
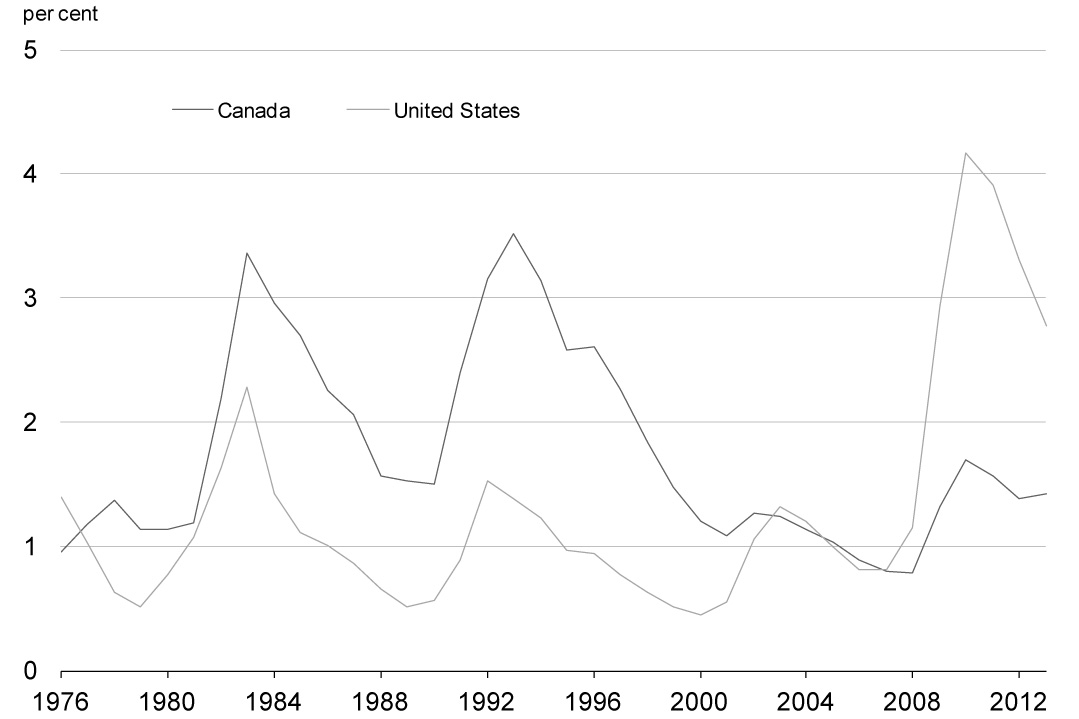
Sources: Statistics Canada; U.S. Bureau of Labor Statistics.
While Canada's economic record over the recession and recovery has been strong, particularly relative to its peer countries in the G-7, Canada has not been immune to developments outside its borders. The weaker global economy, combined with ongoing uncertainty over the outlook, has weighed on global trade volumes and dampened business investment throughout the world. For Canada, slower growth in U.S. demand for the goods and services that Canada exports has been an important factor in the slowdown in our export growth since the end of 2011, with Canadian exports further dampened in 2012 by U.S. pipeline restrictions and closures and unplanned refinery shutdowns (Chart 2.17). Since late 2012, Canadian real exports have regained ground and by mid-2014 were in line with U.S. demand.
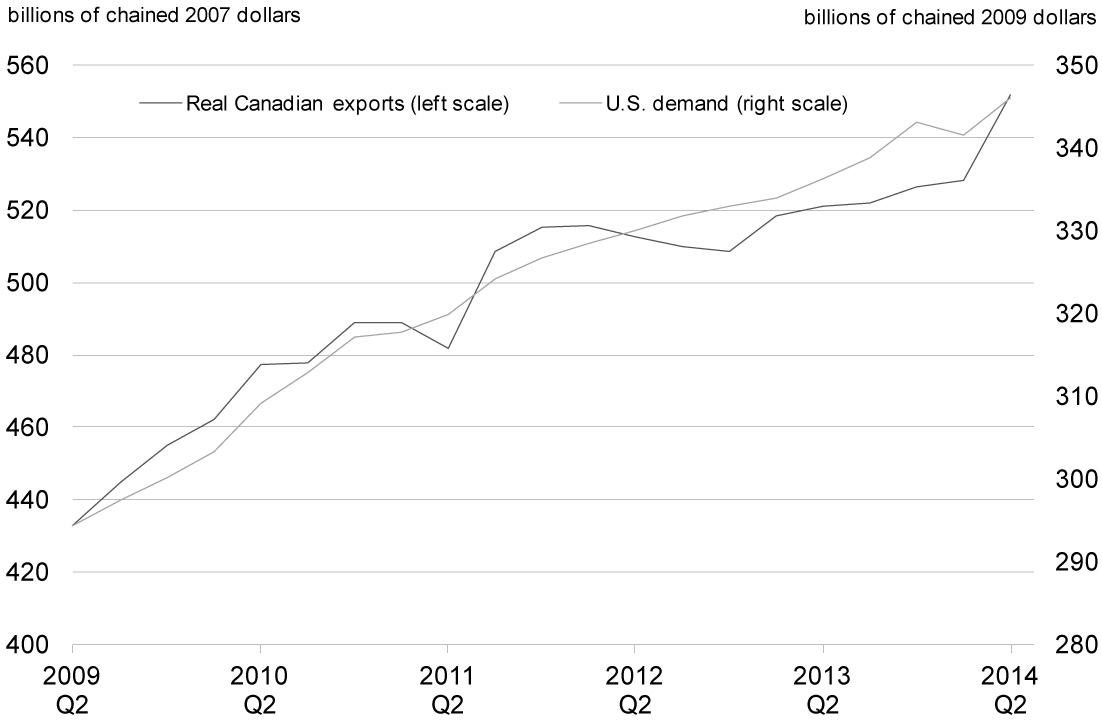
Sources: Statistics Canada; U.S. Bureau of Economic Analysis; Department of Finance calculations.
Despite the recent weakness in real export growth, there are some encouraging signs going forward. In particular, Canada has largely maintained its share of U.S. manufactured goods imports since 2009 after a significant decline over the previous decade. Over this earlier period, Canadian manufacturers faced the dual headwinds of a rising dollar and increasing competition from China, which underwent a period of rapid productivity growth over the decade, leading to an increase in its share of U.S. imports at the expense of Canada and other developed economies.
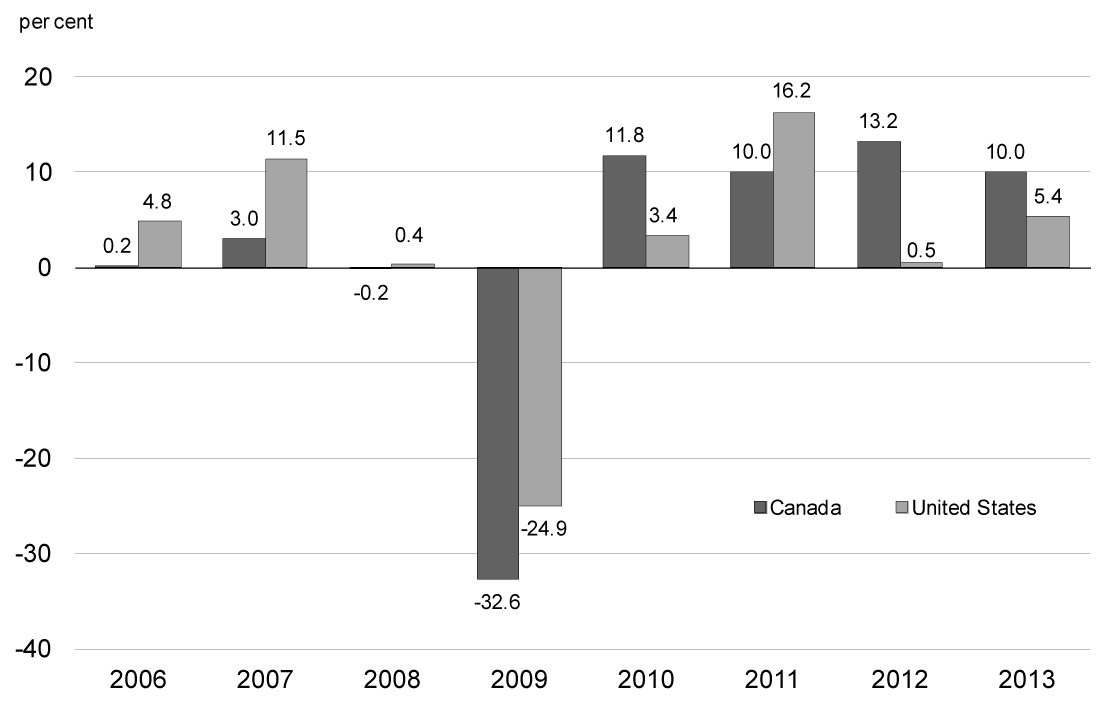
At the same time, the high Canadian dollar reduced prices for imported machinery and equipment (M&E) and intermediate inputs, allowing Canadian exporters to make productivity-enhancing investments and reduce their production costs. In addition, Government actions since 2006 have provided significant support to manufacturers and exporters. In particular, real investment in M&E by Canadian manufacturers, which is an important determinant of productivity growth and international competitiveness, has grown by more than 50 per cent over the recovery, outpacing that in the U.S. after lagging in prior years, with almost all industries posting very strong growth (Chart 2.18). As a result, Canadian manufacturers are now well placed to benefit from stronger demand from the U.S. and elsewhere when external economic conditions begin to improve. The strong rise in real exports in the second quarter of 2014 is a positive signal that Canadian exporters are beginning to take advantage of stronger U.S. demand as well as of the positive impacts of the decline in the Canadian dollar since early 2013.
While Canada's export prospects are positive going forward, weaker export growth since the end of 2011 has translated into slower growth in business investment, with firms delaying capacity-increasing investment in the face of weak and uncertain global demand. Together, these factors have resulted in more modest real GDP growth since the end of 2011.
With the moderation in real GDP growth, the pace of job creation eased in 2013 and in the first half of 2014 following very strong growth earlier in the recovery. This pace has picked up in recent months and going forward, private sector economists expect that employment will remain solid, forecasting that employment growth will average 20,000 per month for the coming year.
Global economic weakness and more moderate domestic growth have also been reflected in lower economy-wide prices in Canada. Prices for our key export commodities declined by 11.0 per cent between mid-2011 and mid-2014, which translated into a decline of 3.0 per cent in Canada's terms of trade (the price of our exports relative to our imports—Chart 2.19). Since mid-2014, commodity prices have declined by a further 13 per cent, led by lower crude oil prices, which will put downward pressure on Canada's terms of trade over the second half of 2014.
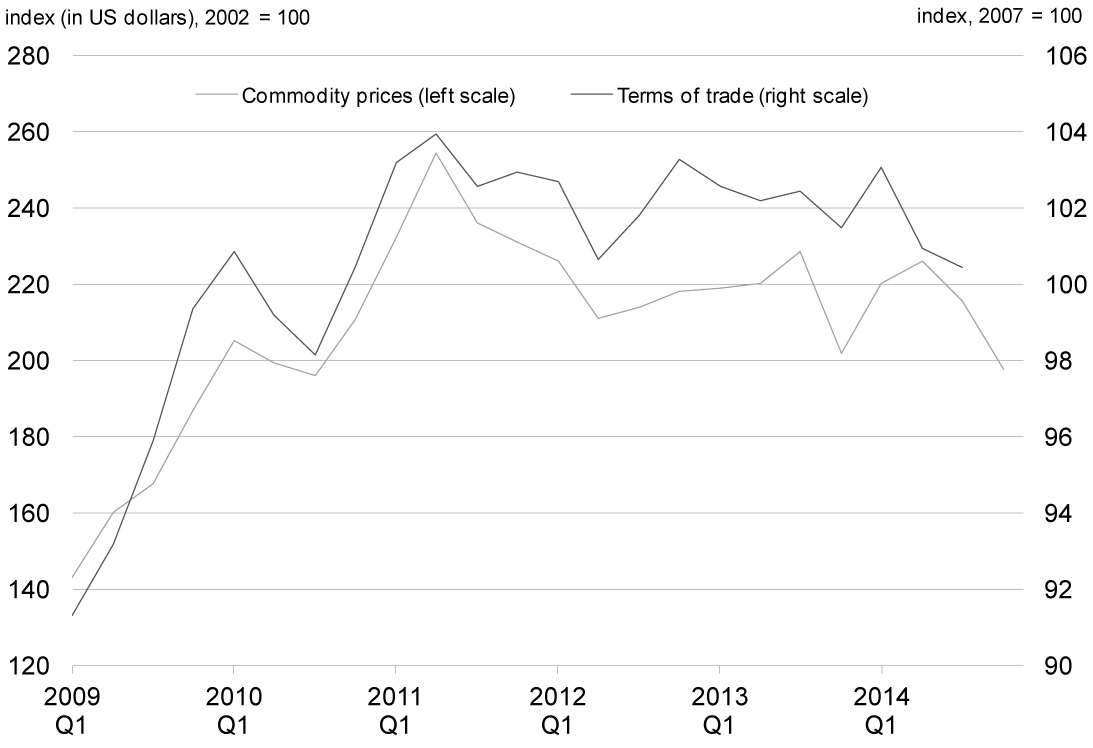
Sources: Statistics Canada; Commodity Research Bureau; Bloomberg; Flint Hills Resources; Department of Finance calculations.
Similarly, Canada's Consumer Price Index (CPI) inflation averaged 1.2 per cent over 2012 and 2013, reflecting both commodity price weakness and weaker domestic growth. While CPI inflation has accelerated more recently, this largely reflects transitory increases in energy prices (Chart 2.20). In particular, the severe winter weather experienced in early 2014 in much of the United States resulted in a temporary spike in natural gas prices. This translated into higher costs for firms (including indirectly through higher electricity costs), and in turn has resulted in higher prices more broadly in the economy (including core CPI inflation). As these impacts were temporary, they will not affect year-over-year inflation by early 2015, while recent declines in gasoline prices will begin to put downward pressure on prices in late 2014. As a result, private sector economists expect both core and total CPI inflation to ease back to below 2 per cent by mid-2015.
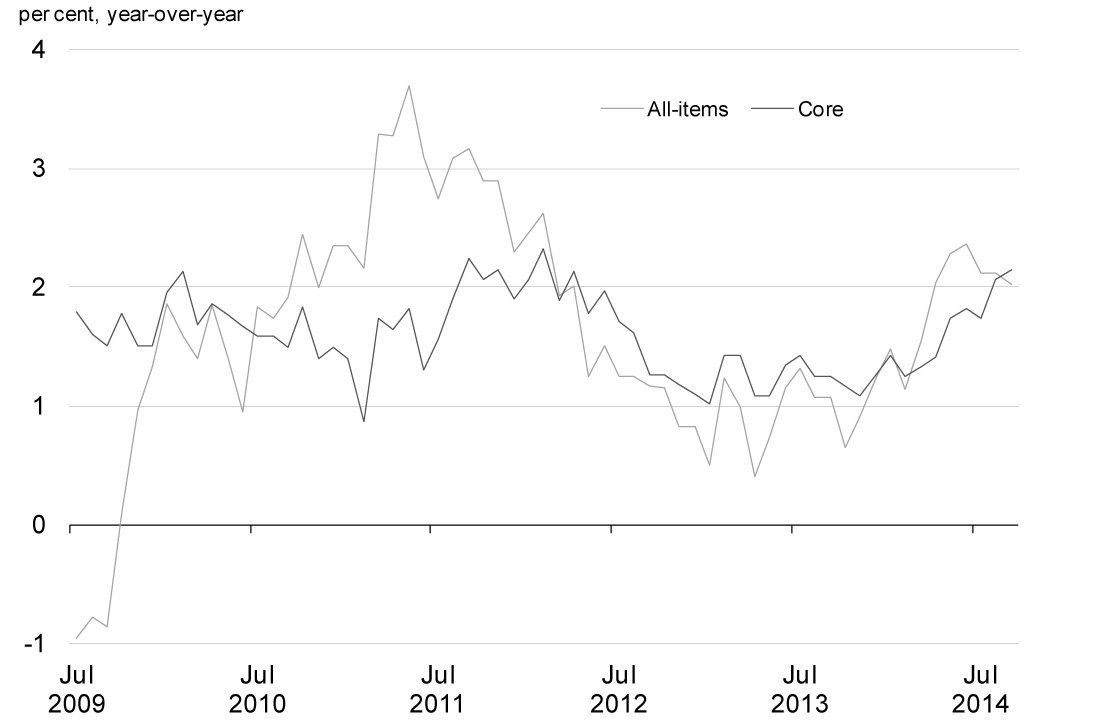
Source: Statistics Canada.
Canadian Economic Outlook—Private Sector Forecasts
The average of private sector economic forecasts has been used as the basis for fiscal planning since 1994 and introduces an element of independence into the Government’s fiscal forecast. This practice has been supported by international organizations such as the IMF.
The Department of Finance regularly surveys private sector economists on their views on the outlook for the Canadian economy. The economic forecast presented in this section is based on a survey conducted in September 2014, and includes the views of 15 private sector economists.
The September 2014 survey of private sector economists included
- BMO Capital Markets,
- Caisse de dépôt et placement du Québec,
- Canadian Federation of Independent Business,
- CIBC World Markets,
- The Conference Board of Canada,
- Desjardins,
- Deutsche Bank of Canada,
- IHS Global Insight,
- Industrial Alliance Insurance and Financial Services Inc.,
- Laurentian Bank Securities,
- National Bank Financial Group,
- Royal Bank of Canada,
- Scotiabank,
- TD Bank Financial Group, and
- the University of Toronto (Policy and Economic Analysis Program).
The September survey was completed in the first half of September, prior to the recent financial market volatility and the acceleration in the decline in Canadian crude oil prices in mid-October.
In the survey, private sector economists expect Canadian real GDP growth to pick up to 2.4 per cent in 2014 from 2.0 per cent growth recorded in 2013 (Chart 2.21). Real GDP growth is expected to average 2.5 per cent over the second half of 2014, compared to 2.3 per cent in the first half of the year, and then to pick up to 2.6 per cent for 2015 as a whole. Overall, economists expect real growth to average 2.4 per cent per year over the 2014 to 2018 period. This is unchanged from their expectations at the time of Budget 2014.
While the private sector forecast for real GDP growth is largely unchanged since Budget 2014, strong GDP inflation (the broadest measure of economy-wide price inflation) in the first quarter of 2014 has led to an increase in the outlook for GDP inflation in 2014 as a whole. As a result, nominal GDP growth in the September 2014 survey of private sector economists is expected to be 4.4 per cent in 2014 (compared with expectations of 3.9 per cent growth in Budget 2014). This has increased the projected level of nominal GDP in the September survey by about $6 billion per year, on average, over the 2014 to 2018 period, compared to the outlook in Budget 2014.
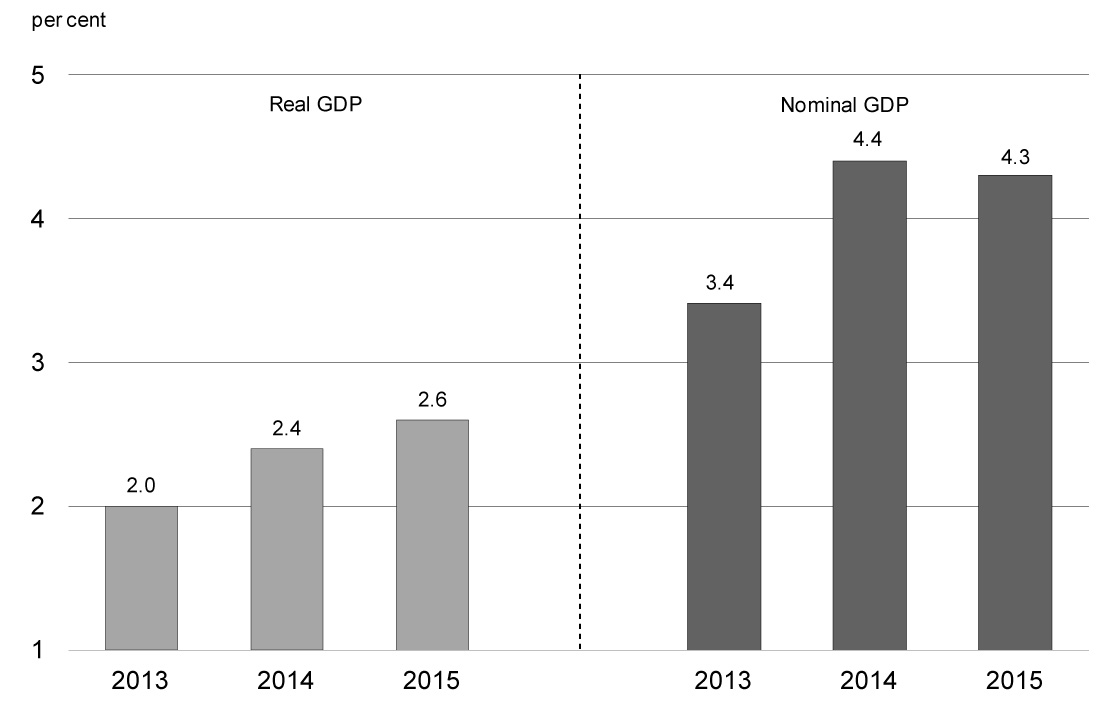
Sources: Statistics Canada; Department of Finance September 2014 survey of private sector economists.
The economists have slightly revised their outlook for the unemployment rate over the 2014 to 2018 period. They expect the unemployment rate to fall to 6.3 per cent in 2018.
Reflecting higher CPI inflation in the last quarter of 2013 and the first two quarters of 2014 than anticipated at the time of Budget 2014, the outlook for CPI inflation has been revised up to 2.0 per cent in 2014 from 1.5 per cent at the time of the budget. Beyond 2014, the inflation rate is anticipated to remain at around 2 per cent.
Private sector economists have revised down their expectations for both short- and long-term interest rates over the medium term relative to the budget survey as they now expect the increase in interest rates to be more gradual.
The outlook for short-term rates has been lowered by 30 basis points in 2015 and 60 basis points in subsequent years, indicating that private sector economists believe there will be a slightly slower ramp-up in rates than previously expected. On average, the economists’ forecast for short-term rates is consistent with policy rate increases starting in the third quarter of 2015, one quarter later than in the budget survey.
The economists have also decreased their outlook for long-term rates by 70 basis points in 2014 and 50 basis points thereafter compared to the budget survey. The economists expect a Canadian dollar value of just under 91 cents U.S. going forward.
The economists have revised down their forecast for U.S. real GDP growth for this year from 2.7 per cent to 2.1 per cent, reflecting the unexpected decline in U.S. real GDP in the first quarter of 2014. In addition, the outlook for U.S. growth is somewhat lower in subsequent years. As a consequence, the economists’ outlook for annual U.S. growth has fallen from 2.9 per cent to 2.7 per cent, on average, over the 2014 to 2018 period.
| 2014 | 2015 | 2016 | 2017 | 2018 | 2019 | 2014– 2018 |
|
|---|---|---|---|---|---|---|---|
| Real GDP Growth1 | |||||||
| Budget 2014 | 2.3 | 2.5 | 2.5 | 2.3 | 2.2 | - | 2.4 |
| 2014 Fall Update | 2.4 | 2.6 | 2.4 | 2.3 | 2.2 | 2.1 | 2.4 |
| GDP Inflation1 | |||||||
| Budget 2014 | 1.5 | 2.0 | 2.0 | 2.0 | 2.0 | - | 1.9 |
| 2014 Fall Update | 1.9 | 1.6 | 2.0 | 2.1 | 2.0 | 2.0 | 1.9 |
| Nominal GDP Growth1 | |||||||
| Budget 2014 | 3.9 | 4.5 | 4.5 | 4.4 | 4.2 | - | 4.3 |
| 2014 Fall Update | 4.4 | 4.3 | 4.4 | 4.4 | 4.2 | 4.1 | 4.4 |
| Nominal GDP Level1 ($ billions) | |||||||
| Budget 2014 | 1,968 | 2,056 | 2,150 | 2,244 | 2,339 | - | |
| 2014 Fall Update | 1,977 | 2,062 | 2,153 | 2,249 | 2,345 | 2,442 | |
| Difference between 2014 Fall Update and Budget 2014 | 9 | 5 | 4 | 5 | 6 | - | |
| 3-Month Treasury Bill Rate | |||||||
| Budget 2014 | 1.0 | 1.5 | 2.7 | 3.6 | 4.0 | - | 2.6 |
| 2014 Fall Update | 0.9 | 1.2 | 2.1 | 2.9 | 3.4 | 3.6 | 2.1 |
| 10-Year Government Bond Rate | |||||||
| Budget 2014 | 3.0 | 3.5 | 4.1 | 4.6 | 4.8 | - | 4.0 |
| 2014 Fall Update | 2.3 | 3.0 | 3.6 | 4.1 | 4.3 | 4.4 | 3.5 |
| Exchange Rate (US cents/C$) | |||||||
| Budget 2014 | 93.7 | 95.3 | 95.9 | 96.2 | 96.3 | - | 95.5 |
| 2014 Fall Update | 91.3 | 89.6 | 90.8 | 90.6 | 90.8 | 91.1 | 90.6 |
| Unemployment Rate | |||||||
| Budget 2014 | 6.8 | 6.6 | 6.4 | 6.3 | 6.2 | - | 6.5 |
| 2014 Fall Update | 7.0 | 6.8 | 6.5 | 6.4 | 6.3 | 6.3 | 6.6 |
| Consumer Price Index Inflation | |||||||
| Budget 2014 | 1.5 | 1.9 | 2.0 | 2.0 | 2.0 | - | 1.9 |
| 2014 Fall Update | 2.0 | 1.9 | 2.0 | 2.0 | 2.0 | 2.0 | 2.0 |
| U.S. Real GDP Growth | |||||||
| Budget 2014 | 2.7 | 3.1 | 3.0 | 2.9 | 2.6 | - | 2.9 |
| 2014 Fall Update | 2.1 | 3.1 | 2.9 | 2.8 | 2.5 | 2.5 | 2.7 |
| 1 Figures have been restated due to historical revisions to the Canadian System of National Accounts from Statistics Canada released on November 5, 2014.
Sources: For Budget 2014, the Department of Finance’s December 2013 survey of private sector economists; for the 2014 Fall Update, the September 2014 survey of private sector economists. |
|||||||
Adjustment to the September Survey of Private Sector Economists
The September survey of private sector economists was completed in the first half of September, prior to the recent financial market volatility and the acceleration in the decline in Canadian crude oil prices in mid-October.
The September survey is consistent with an outlook of U.S. WTI crude oil prices of approximately US$98 per barrel in the fourth quarter of 2014, largely unchanged from their levels in the third quarter. However, WTI crude oil prices have declined by just over 15 per cent from third-quarter levels, averaging about US$81 per barrel since mid-October. This decline3 is likely to weigh on real GDP growth, but more importantly, on Canada's terms of trade (the ratio of our export prices to our import prices) and therefore economy-wide prices (GDP inflation). At the same time, lower crude oil prices have also been accompanied by a lower level of the Canadian dollar, which has offset some of the oil price decline in Canadian-dollar terms and provided support to exporters in other industries. In addition, lower crude oil prices are translating into reduced prices for gasoline and other fuels, reducing costs for households and businesses. However, the Department of Finance expects the decline in crude oil prices to reduce the level of nominal GDP, and, therefore, the Government’s revenues.
If crude oil prices were to remain near their current levels, the Department of Finance estimates that this would reduce the level of nominal GDP by approximately $3 billion in 2014 and $16 billion per year thereafter, relative to the levels forecast in the September 2014 survey. To account for this decline in crude oil prices, the Government is therefore reducing the September private sector forecast for nominal GDP by $3 billion in 2014 and by $16 billion per year over the 2015–2019 period (Table 2.2). The impact of this adjustment on the fiscal projection is described in Chapter 3.
As a result, the projected level of nominal GDP in the adjusted September survey is $6 billion higher in 2014 and $10 billion to $12 billion lower over the 2015 to 2018 period, compared to the outlook in Budget 2014.
| 2014 | 2015 | 2016 | 2017 | 2018 | 2019 | |
|---|---|---|---|---|---|---|
| September 2014 survey of private sector economists1 | 1,977 | 2,062 | 2,153 | 2,249 | 2,345 | 2,442 |
| Adjustment for lower crude oil prices | -3 | -16 | -16 | -16 | -16 | -16 |
| Adjusted September 2014 survey of private sector economists | 1,974 | 2,046 | 2,137 | 2,233 | 2,329 | 2,426 |
| Difference between Update 2014 and Budget 20141 | 6 | -11 | -12 | -11 | -10 | - |
| 1 Annual nominal GDP levels have been restated to reflect historical revisions to the Canadian System of National Accounts, as noted in Table 2.1 above. | ||||||
Risk Assessment
On October 14, 2014, the Minister of Finance met with the private sector economists to discuss the economic projections resulting from the September 2014 survey, as well as the risks surrounding the outlook. At that time, the economists agreed that the average forecast from the September survey was a reasonable basis for fiscal planning. However, the economists also noted that there was some downside risk to GDP inflation in the September survey given how oil prices were evolving. This risk has since materialized, as discussed above, and the Government has lowered the private sector outlook for nominal GDP in the September survey accordingly.
This being said, downside risks to this updated nominal GDP outlook remain, and are to a large extent external to the Canadian economy. In the euro area, the economic recovery appears to be uncertain and the risk of deflation is rising. In China, the challenges that the authorities face in introducing necessary policy reforms on the one hand, and maintaining their targeted growth objectives on the other, could lead to slower and more variable-than-expected growth. There is also the risk posed by ongoing geopolitical unrest in Ukraine and the Middle East.
Against this ongoing backdrop of weak and uncertain global growth, there had been broad-based concern that financial markets were underpricing risk in their search for higher returns. This concern reflected the steady gains in equity prices, and a reduction in risk spreads and market volatility to very low levels, which had occurred through 2013 and into late 2014. Some unwinding of these developments took place beginning in mid-September. As the U.S. Federal Reserve continued on its path towards normalization of its monetary policy and on the heels of a spate of negative economic news from the euro area and China, global equity prices retreated, government bond yields in advanced economies fell, risk spreads widened and overall financial market volatility spiked. More recently, global financial markets appear to have stabilized to some extent. However, should financial market volatility re-emerge, or become deeper and more enduring, this would weigh further on global and Canadian growth.
Along with the rise in volatility in global equities, considerable uncertainty remains over commodity prices, particularly for crude oil. While the outlook presented here has been adjusted to reflect recent declines in Canadian crude oil prices, the potential for further declines remains, particularly if global growth once again surprises on the downside. As discussed above, further crude oil price declines would dampen growth in economy-wide prices and ultimately nominal GDP.
In contrast to these developments, in the U.S. the recovery appears to be gaining traction. Surveys of business activity and consumer confidence are at or near post-recession highs, and this could translate into stronger-than-expected growth. On the downside, however, growth may once again not pick up as expected, similar to the pattern of the last few years (Chart 2.22). In particular, despite strong fundamentals, the anticipated improvement in domestic demand significantly lagged expectations in the first half of the year, suggesting that underlying economic momentum may have weakened. The potential for weaker domestic demand could also be triggered, and exacerbated, by the recent rise in global market volatility.
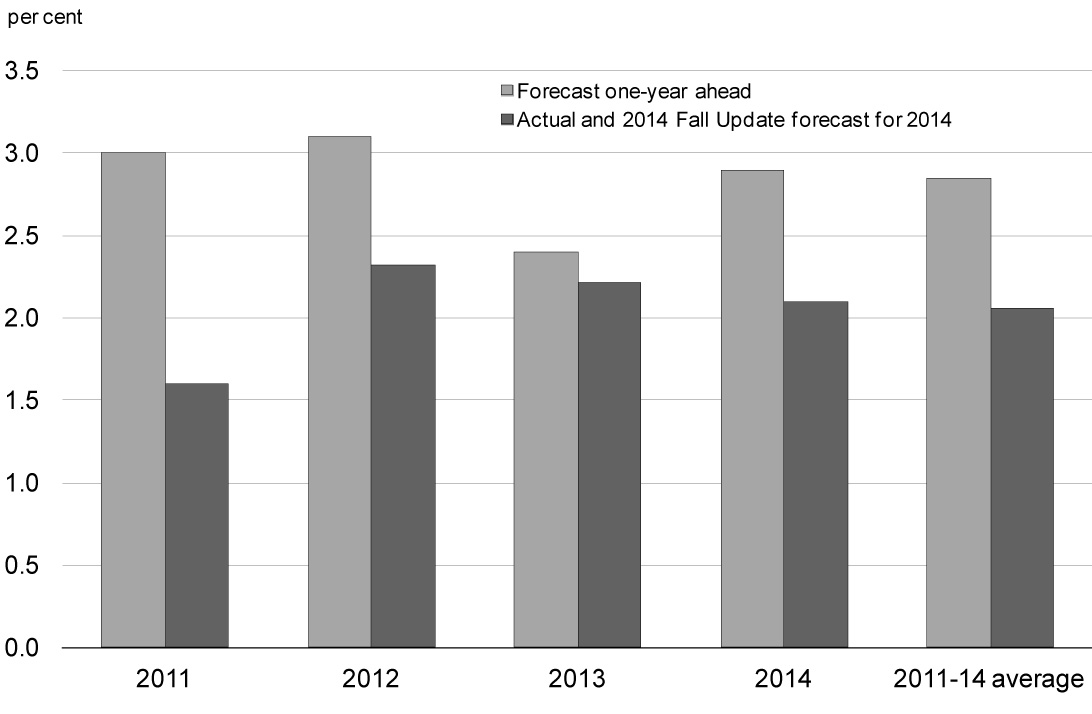
Sources: U.S. Bureau of Economic Analysis; Budget 2010, Budget 2011, Economic Action Plan 2012 and Economic Action Plan 2013; Department of Finance September 2014 survey of private sector economists.
Interest rates are expected to normalize in the U.S. and other advanced economies from their low levels since the recession. However, even before the recent period of global financial market volatility, there was significant divergence in expectations about the pace of tightening among the Federal Reserve governors and regional bank presidents that form the body that determines the U.S. monetary policy stance (Chart 2.23). On the one hand, interest rates may again come in below expectations if global growth continues to disappoint, as has been the pattern over the past few years. However, it is also possible that monetary policy may tighten more quickly if U.S. growth or inflation pick up more than expected. Recent global developments have further increased the uncertainty around the timing of policy rate normalization.
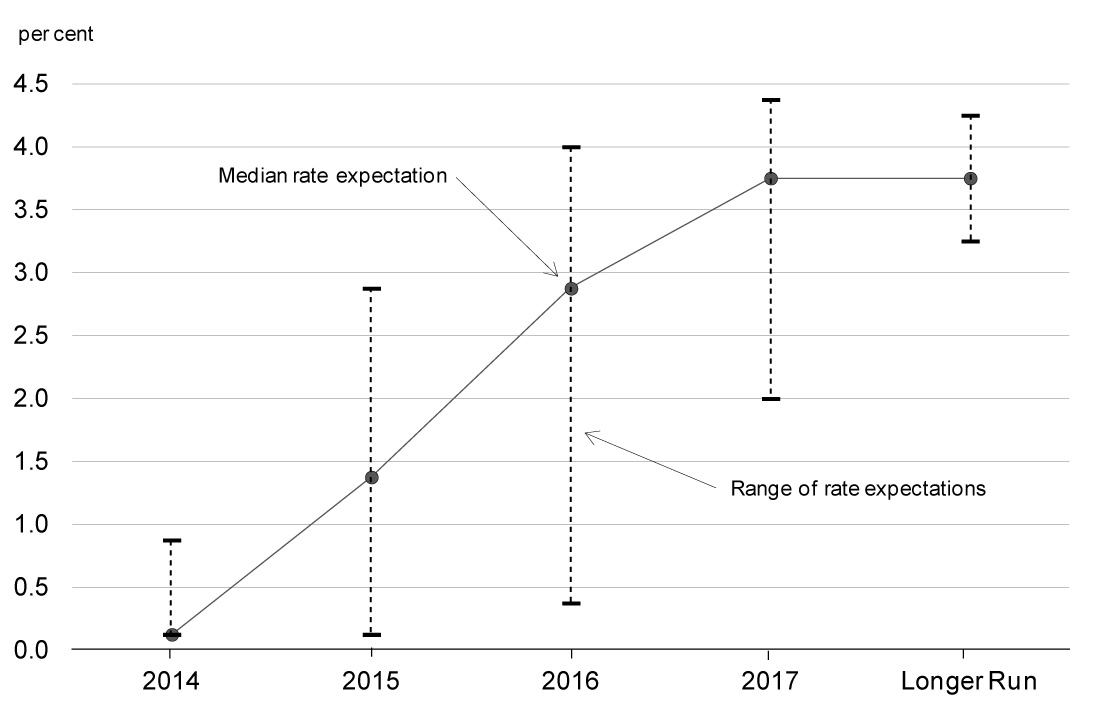
Source: U.S. Federal Reserve.
On the domestic front, household debt remains the main risk to the Canadian outlook. Although household debt accumulation has moderated and the household debt-to-income ratio has broadly stabilized, there remains the risk that, given the ongoing low rate environment, stronger-than-expected underlying momentum in housing market activity could translate into further debt accumulation. As well, the lack of momentum in business investment, if maintained, would pose a downside risk to Canada's near-term growth prospects.
Planning Assumptions
As discussed above, in light of the impact of recent declines in crude oil prices, the Government is reducing the private sector forecast for nominal GDP by $3 billion in 2014 and by $16 billion per year over the 2015 to 2019 period. Further, to address the risks posed by uncertainty over the global economic outlook and the possibility of further declines in crude oil prices, for fiscal planning purposes, the Government has maintained the downward adjustment for risk to the private sector forecast for nominal GDP for 2014 at $20 billion, whereas in recent years, the adjustment for risk for the year underway had been lowered. For the 2015 through 2019 period, the adjustment for risk has been maintained at $20 billion included in Budget 2014 (Table 2.3) The Government will continue to evaluate economic developments and risks to determine whether or not it would be appropriate to maintain this adjustment for risk in the future. The fiscal outlook, including the fiscal impact of the adjustment for risk, is presented in Chapter 3.
| 2014 | 2015 | 2016 | 2017 | 2018 | 2019 | |
|---|---|---|---|---|---|---|
| Adjusted September 2014 survey of private sector economists | 1,974 | 2,046 | 2,137 | 2,233 | 2,329 | 2,426 |
| Adjustment for risk | -20 | -20 | -20 | -20 | -20 | -20 |
| 2014 Fall Update fiscal planning assumption | 1,954 | 2,026 | 2,117 | 2,213 | 2,309 | 2,406 |
| Addendum: Adjustment for risk in Budget 2014 | -20 | -20 | -20 | -20 | -20 | - |
1 Conceptual differences raise the Canadian unemployment rate relative to the U.S. rate. In particular, Statistics Canada considers as unemployed those passively looking for work (e.g. reading want ads) as well as those who will begin work in the near future, while the U.S. Bureau of Labor Statistics does not include either group in the labour force. In addition, the Canadian methodology includes 15-year-olds (who have a higher-than-average unemployment rate), while the U.S. does not.
2 The U.S. participation rate has fallen by 2.7 percentage points since July 2009, whereas Canada's participation rate has declined by 1.1 percentage points over the same period. If the U.S. participation rate had fallen by the same amount as Canada's, and the level of U.S. employment had stayed the same, the U.S. unemployment rate would currently be 8.0 per cent.
3 In practice, the impact on nominal GDP is determined by Canadian crude oil prices, not the U.S. WTI benchmark. However, as Canadian crude oil prices have also declined by just over 15 per cent relative to their third-quarter levels (from US$83 per barrel to US$70 per barrel on average since mid-October), the impact on nominal GDP is the same regardless of the benchmark used.