Archived - Update of Economic and Fiscal Projections — 2014: Part 1 of 4
Archived information
Archived information is provided for reference, research or recordkeeping purposes. It is not subject to the Government of Canada Web Standards and has not been altered or updated since it was archived. Please contact us to request a format other than those available.
Highlights
- Since 2006, the Government’s low-tax plan for jobs and growth has focused on creating jobs and growing our economy, keeping taxes low and supporting Canadian families.
- Five years after the global recession, despite ongoing uncertainty and an uneven global economy, the Government’s low-tax plan for jobs and growth continues to deliver results for Canadians.
- Indeed, not only has the Canadian economy performed well since 2009, outpacing most of its Group of Seven (G-7) peers, but the International Monetary Fund and the Organisation for Economic Co-operation and Development expect Canada to be among the strongest growing economies in the G-7 over this year and next.
- The Government’s low-tax plan to support jobs and growth is underpinned by a track record of sound fiscal management and a plan to return to balanced budgets in 2015. The Government is on track to meet this goal.
- But balancing the budget is not an end in itself. It is a means to further increase Canada’s economic potential, improve employment opportunities for Canadians and raise our standard of living.
- With balanced budgets in sight, the Government can now continue delivering on its commitment to provide further tax relief for Canadian families and businesses.
- On October 30, the Government announced its intention to increase and expand the Universal Child Care Benefit, introduce the Family Tax Cut and increase the Child Care Expense Deduction dollar limits to provide additional tax relief and enhanced benefits for hard-working Canadian families. Earlier in October, the Government announced its intention to double the Children’s Fitness Tax Credit and make it refundable, thereby making it more affordable for Canadian families to enroll their children in fitness activities.
- Taken together, these recently proposed initiatives amount to close to $27 billion of additional tax relief and benefits for families for this and the next five years.
- The Government also remains committed to help businesses thrive and create well-paid jobs for Canadians. To that end, in September it proposed to introduce the new Small Business Job Credit, which will make hiring new workers or investing in additional training easier for entrepreneurs and help them grow their businesses.
- Only as a result of its unrelenting commitment to responsible fiscal management can the Government now be in a position to deliver these initiatives, without having raised taxes or cut transfers to persons or other levels of government, while still expecting a surplus of $1.9 billion in 2015–16, steadily growing to $13.1 billion in 2019–20.
- The Government has judged it appropriate to continue to set aside $3.0 billion per year between 2014–15 and 2019–20 for contingencies. If the set-aside for contingencies is not required, it will be used to reduce the federal debt.
- The Government is also on track to meeting its commitment to reduce the federal debt to 25 per cent of gross domestic product (GDP) by 2021. In fact, the federal debt-to-GDP ratio is expected to fall to below its pre-recession level by 2017, helping to ensure that Canada’s total government net debt continues to decline and remains the lowest of any G-7 country.
Note: This document incorporates economic, financial and fiscal data available up to and including November 7, 2014, unless otherwise indicated.
Chapter 1
Creating Jobs and Growth and Supporting Families
in a Fragile Global Economy
Five years into the recovery from the global recession, Canada remains exposed to a fragile and uneven global economy. A moderation in growth in China, combined with stalled growth in the euro area, has led forecasters to again revise down the global growth outlook, and to postpone to 2015 their expectations for the return to a stronger global growth path.
Fears over the sustainability of global growth also translated into significant volatility in global financial markets in early October, with sharp declines recorded among major equity markets, a fall in bond yields in advanced economies and an increase in risk spreads. Financial market turbulence also added to concerns of oversupply in crude oil markets, resulting in sharp declines in commodity prices. While markets have since stabilized to a large degree, this volatility underscores ongoing uncertainty of the global recovery.
Faced with this ongoing uncertainty and external weakness, the Government remains committed to the principles that have underpinned its actions since 2006, which are creating jobs and supporting growth, keeping taxes low, and supporting Canadian families and businesses.
Throughout the economic recovery, the Government remained steadfast in its efforts to create jobs and growth through measures focused on:
- Connecting Canadians with available jobs and equipping them with the skills and training they need to succeed in the labour market;
- Supporting advanced research and innovation to foster a vibrant entrepreneurial culture where new ideas are translated into new businesses, products and services in the marketplace;
- Reducing red tape and the regulatory burden faced by businesses;
- Helping conserve Canada’s natural heritage and developing natural resources in a responsible and secure way;
- Helping Canadian businesses succeed in the global economy by encouraging trade and foreign investment and supporting our manufacturing sector; and,
- Investing in public infrastructure, including by delivering the New Building Canada Plan—the largest long-term federal investment in infrastructure in Canadian history.
The Government has also provided significant tax relief for individuals, families and businesses, further contributing to an environment where Canadians can succeed and Canadian businesses can grow, create new well-paying jobs and compete internationally. Today, in spite of years of global economic uncertainty, Canada’s low-tax plan and sound fiscal management are bearing fruit. Real gross domestic product (GDP) is significantly above pre-recession levels and Canada has enjoyed one of the strongest economic performances among the Group of Seven (G-7) countries over the recovery (Chart 1.1).
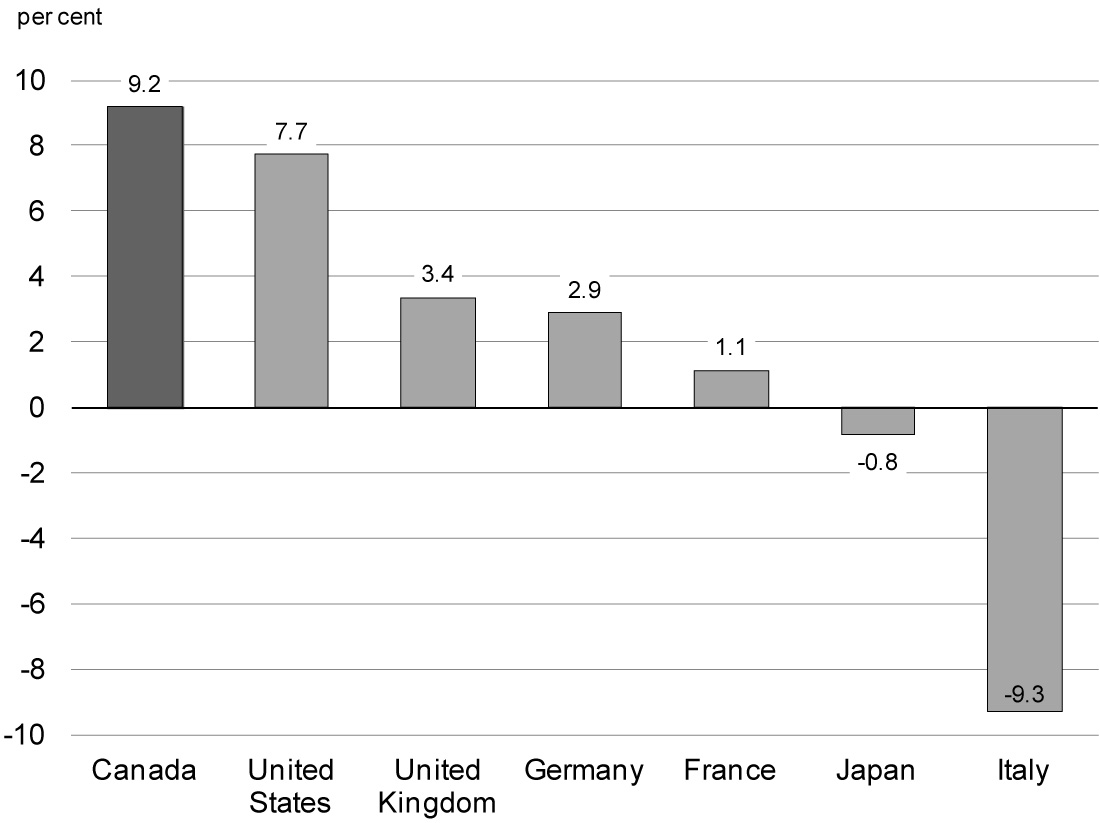
Sources: Haver Analytics; Department of Finance calculations.
Both the International Monetary Fund and the Organisation for Economic Co-operation and Development expect Canada to be among the strongest growing economies in the G-7 over this year and the next. Over 1.2 million more Canadians are working now than in July 2009 (when the recovery began)—an increase of 7.3 per cent—representing one of the strongest job creation performances in the G-7.
Actions taken by this Government to reduce the tax burden on families and individuals have been instrumental in allowing Canadians to keep more of their hard-earned money in their pockets. Tax relief measures introduced since 2006, not including recently announced measures, have resulted in a tax reduction of approximately $3,400 in 2014 for an average two-earner family with two children. In addition, more than 1 million low-income Canadians, including 380,000 seniors, have been removed from the tax rolls.
By 2010, the median per capita income of Canadians had caught up with the U.S. level—something that had never been seen before (Chart 1.2). More recent data suggest that middle-class incomes in Canada are now even higher than in the United States.
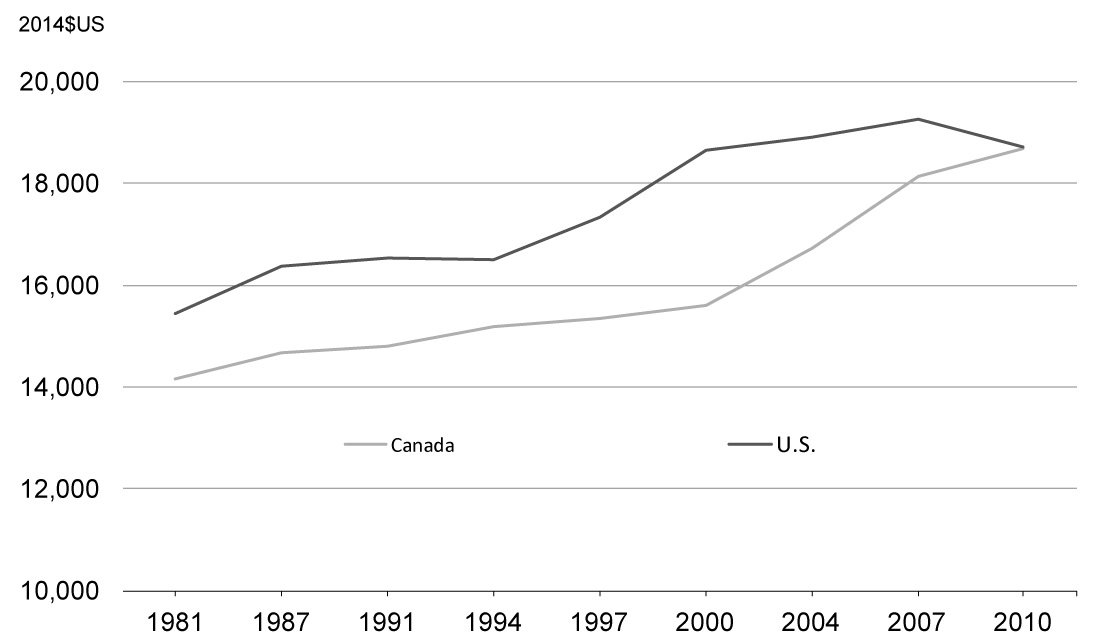
Sources: Department of Finance calculations based on New York Times/Luxembourg Income Study analysis.
Furthermore, Canadian families in all major income groups have seen increases of about 10 per cent or more in their take-home incomes since 2006, with the largest gains in income growth occurring among low-income Canadians (Chart 1.3).
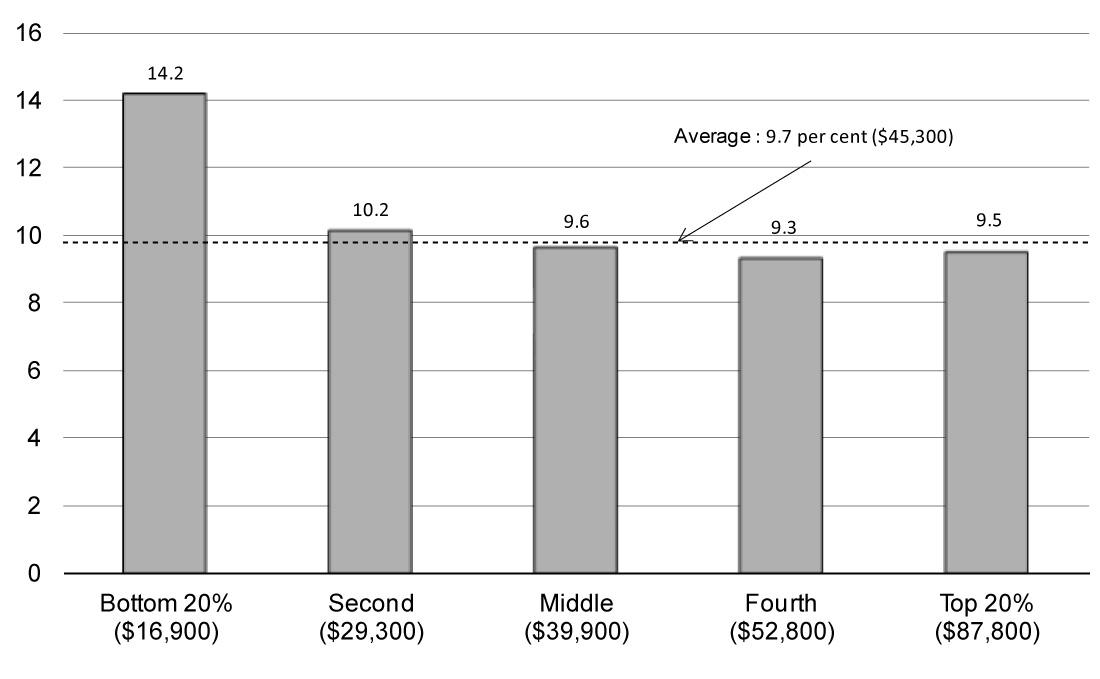
Source: Statistics Canada.
Throughout the global recession and recovery, the Government remained steadfast in its commitment to returning Canada to balanced budgets. This commitment is founded on the recognition that a sound fiscal position is necessary to ensure ongoing economic growth and job creation over the longer term. The Government achieved this by controlling program spending by federal departments. Federal direct program spending has declined for four consecutive years, a trend that has not been achieved in decades. By controlling the cost of government, Canadian families and businesses were protected from higher taxes or reduced transfers to individuals that provide important income support, such as Old Age Security and Employment Insurance benefits. Similarly, major transfers to provincial and territorial governments for social programs and health care continued to increase through the recession and recovery, reaching all-time high levels.
Balancing the budget is not an end in itself. It is a means to increase Canada’s economic potential, improve employment opportunities for Canadians and raise our standard of living. Indeed, balancing the budget and reducing debt will provide benefits to Canadians for years to come, notably by:
- Ensuring that tax dollars are used to support important social services—like elderly benefits and health care—rather than paying interest costs;
- Instilling confidence in consumers and investors, whose dollars spur economic growth and job creation; and,
- Strengthening the country’s ability to respond to longer-term challenges, such as population aging, unexpected global economic shocks, and global security threats.
Most importantly, with balanced budgets in sight, the Government can continue delivering on its commitment to provide further tax relief for Canadian families so that they can keep even more of what they earn and get ahead. As such, the Government recently proposed measures to make life affordable for Canadian families by reducing taxes to help them keep more of their hard-earned money and increasing benefits.
Supporting Canadian Families
On October 30, the Government announced its intention to implement four measures to help families prosper through additional tax reductions and benefit increases:
- Increasing the Universal Child Care Benefit (UCCB) for children under the age of 6. Under the proposed changes, parents would receive a benefit of $160 per month for each child under the age of 6—up from $100 per month—as of January 1, 2015. In a single year, a parent would receive up to $1,920 per child.
- Expanding the UCCB to children aged 6 through 17. Under the expanded benefit, parents would receive $60 per month, as of January 1, 2015, for children aged 6 through 17. In a single year, a parent would receive up to $720 per child. The enhanced UCCB will replace the existing Child Tax Credit for the 2015 and subsequent taxation years.
- Introducing the Family Tax Cut. This federal non-refundable tax credit will allow a spouse to, in effect, transfer up to $50,000 of taxable income to a spouse in a lower tax bracket. Effective as of the 2014 taxation year, the credit would provide tax relief to couples with minor children, up to a maximum of $2,000.
- Increasing the Child Care Expense Deduction dollar limits by $1,000, effective for the 2015 taxation year. The maximum amounts that can be claimed would increase to $8,000 from $7,000 for children under age 7, to $5,000 from $4,000 for children aged 7 through 16 (and infirm dependent children over age 16), and to $11,000 from $10,000 for children who are eligible for the Disability Tax Credit.
Example 1—Two-Earner Couple
Dale and Kelly are a two-earner couple with two children aged 7 and 3. Kelly earns $95,000 and Dale earns $25,000. For the 2015 taxation year, the family would receive a net federal benefit of $2,835 as a result of the proposed new measures. This is in addition to the $2,000 in tax relief the couple would be receiving in early 2015 when they claim the Family Tax Cut on their 2014 returns.
- In 2015, the couple would begin receiving monthly Universal Child Care Benefit payments of $220, which includes $160 for their younger child plus $60 for their 7 year old (their first enhanced Universal Child Care Benefit payment would actually be received in July 2015 and would include a $720 catch-up payment for the January to June period). Previously, they had been receiving $100 per month for the younger child. Over a 12-month period, the Universal Child Care Benefit enhancement would represent a benefit of $1,440 for this family. Since the enhancements to the Universal Child Care Benefit would be taxable, and the Child Tax Credit would be repealed, the net federal benefit from the Universal Child Care Benefit for the family would be $536.
- Since the younger child attends full-time daycare and the older one attends summer camp and after-school care, Dale and Kelly would fully benefit from the $2,000 increase in the amount they can claim under the Child Care Expense Deduction for the 2015 taxation year. This enhancement to the Child Care Expense Deduction would provide $300 in additional federal tax relief.
- For the 2015 taxation year, the family’s tax payable would be further reduced by $2,000 due to the new Family Tax Cut.
As a result of the tax relief and benefit measures introduced since 2006, including those announced on October 30, this family would be better off by about $7,285 in 2015.
Example 2—One-Earner Couple
Isabelle and Marc are a one-earner couple earning $60,000. They have two children aged 2 and 4. As a result of the proposed new measures, this family would benefit from about $1,605 in federal relief for the 2015 taxation year. This is in addition to about $1,055 in tax relief they would receive in early 2015 when they claim the Family Tax Cut on their 2014 returns.
- The Universal Child Care Benefit enhancement would represent a benefit of $1,440 over a 12-month period. Since the enhancements to the Universal Child Care Benefit would be taxable, and the Child Tax Credit would be repealed, the net federal benefit from the enhanced Universal Child Care Benefit for the family would be $536 for the 2015 taxation year.
- For the 2015 taxation year, the new Family Tax Cut would reduce the family’s tax payable by about $1,070.
Example 3—Single Parent
Alison is a single parent raising one child age 4 and earning $45,000. As a result of the proposed new measures, Alison would benefit from about $420 in federal relief for the 2015 taxation year.
- The Universal Child Care Benefit enhancement would represent a benefit of $720 over a 12-month period. Since the enhancement to the Universal Child Care Benefit would be taxable, and the Child Tax Credit would be repealed, the net federal benefit from the enhanced Universal Child Care Benefit for the family would be $268.
- Since her child attends full-time daycare, Alison would benefit from the $1,000 increase in the amount she can claim under the Child Care Expense Deduction for the 2015 taxation year. The enhancement to the Child Care Expense Deduction would provide $150 in additional federal tax relief.
As a result of the tax relief and benefit measures introduced since 2006, including those announced on October 30, Alison would be better off by about $3,325 in 2015.
Example 4—Two-Earner Couple With Equal Earnings
Thomas and Matty are a two-earner couple with two children aged 3 and 6. They each earn $60,000. For the 2015 taxation year, the family would receive a net federal benefit of $875 as a result of the proposed new measures.
- In 2015, the couple would begin receiving monthly Universal Child Care Benefit payments of $220, which includes $160 for their younger child plus $60 for their 6 year old (their first enhanced Universal Child Care Benefit payment would actually be received in July 2015 and would include a $720 catch-up payment for the January to June period). Previously, they had been receiving $100 per month for the younger child. Over a 12-month period, the Universal Child Care Benefit enhancement would represent a benefit of $1,440 for this family. Since the enhancements to the Universal Child Care Benefit would be taxable, and the Child Tax Credit would be repealed, the net federal benefit from the Universal Child Care Benefit for the family would be $435.
- Since the younger child attends full-time daycare and the older one attends summer camp and after-school care, Thomas and Matty would fully benefit from the $2,000 increase in the amount they can claim under the Child Care Expense Deduction for the 2015 taxation year. This enhancement to the Child Care Expense Deduction would provide $440 in additional federal tax relief.
In addition to these most recent proposed changes, the Government also announced on October 9 its intention to double the Children’s Fitness Tax Credit (CFTC) and make it refundable. Parents will be able to take advantage of the new $1,000 maximum limit in the spring of 2015 when they file their tax returns for 2014. Making the credit refundable will increase the benefits to low-income families claiming the new credit for the 2015 and subsequent taxation years. When fully implemented, the proposed enhancements to the CFTC would deliver additional tax relief to about 850,000 families.
Taken together, these proposed changes would provide about $3.1 billion in tax relief and enhanced benefits in 2014–15, amounting to close to $27 billion over this and the next five years, and benefit more than 4 million Canadian families. The average tax relief and benefits for these families will be over $1,100 in 2015.
Supporting Businesses
The Government also remains committed to help businesses prosper here in Canada and succeed in the global economy. To do so, businesses need their government to be a partner in achieving success and fostering job creation.
In September 2013, the Government announced a three-year freeze of the Employment Insurance (EI) rate at its 2013 level of $1.88 per $100 of insurable earnings to prevent it from rising to $1.93 in 2014, saving employers and employees an expected $660 million in 2014 alone.
Building on this measure, on September 11, 2014, the Government announced further action to create jobs, growth and long-term prosperity with the introduction of the new Small Business Job Credit. This credit is expected to save small businesses more than $550 million over 2015 and 2016. Any firm that pays employer EI premiums equal to or less than $15,000 in those years will be eligible for the credit, representing close to 90 per cent of all EI premium-paying businesses in Canada. The Canada Revenue Agency will automatically calculate the credit on a business’ T4 information return, ensuring that no new paper burden will be imposed on business owners.
In addition, all employers and employees will benefit from a substantial reduction in the EI premium rate in 2017 from the currently legislated $1.88 per $100 of insurable earnings to an estimated $1.45, when the new seven-year break-even rate-setting mechanism takes effect. This will ensure that EI premiums are no higher than needed to pay for the EI program over time.
Returning to Balanced Budgets
Canadian families recognize the importance of a balanced budget. Likewise, governments cannot indefinitely spend beyond their means. The Government has taken responsible and deliberate steps to reduce the deficit and return to a balanced budget. It remains committed to keeping its budget in balance. To that end, the Government will introduce balanced budget legislation that will require balanced budgets during normal economic times and concrete timelines for returning to balance in the event of an economic crisis.
It is only through its unrelenting commitment to responsible and sustainable management of public finances that the Government is now in a position to deliver more than $27 billion worth of additional tax relief and benefits to families and businesses over this and the next five years, while remaining on track to balance the budget in 2015.
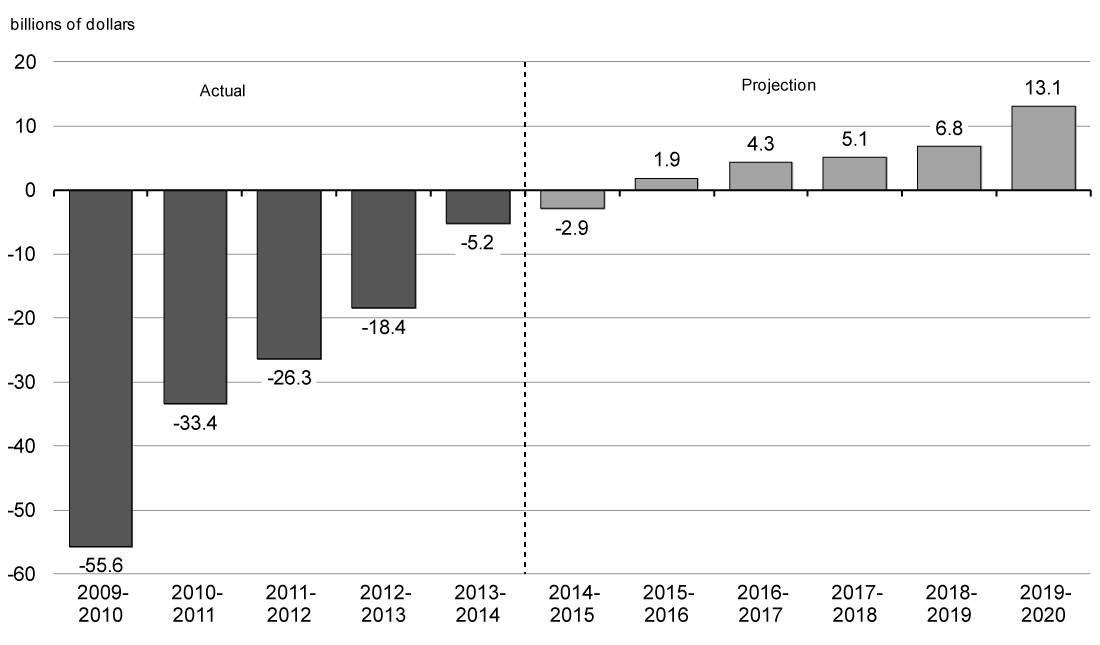
Indeed, in 2009, at the height of the global economic and financial crisis, the deficit stood at $55.6 billion. In recent years, the Government took important and responsible steps to reduce the deficit and ensure the sustainability of public finances and social programs for future generations. Today, after accounting for the initiatives described above, a surplus of $1.9 billion is projected for 2015–16, steadily growing to $13.1 billion in 2019–20 (Chart 1.4). In addition, the Government has judged it appropriate to continue to set aside $3.0 billion per year between 2014–15 and 2019–20 for contingencies. If the set-aside for contingencies is not required, it will be used to reduce the federal debt.
The federal debt-to-GDP ratio declined last year and is projected to steadily continue on that downward path, putting the Government well on its way to meeting its commitment to reduce the federal debt to 25 per cent of GDP by 2021. Indeed, the federal debt-to-GDP ratio is expected to fall below its pre-recession level by 2017. This will help to ensure that Canada’s total government net debt (which includes that of the federal, provincial, territorial and local governments as well as the net assets of the Canada Pension Plan and Québec Pension Plan) continues to decline. Indeed, the International Monetary Fund projects that Canada’s total government net debt-to-GDP ratio will remain the lowest of any G-7 country (Chart 1.5).
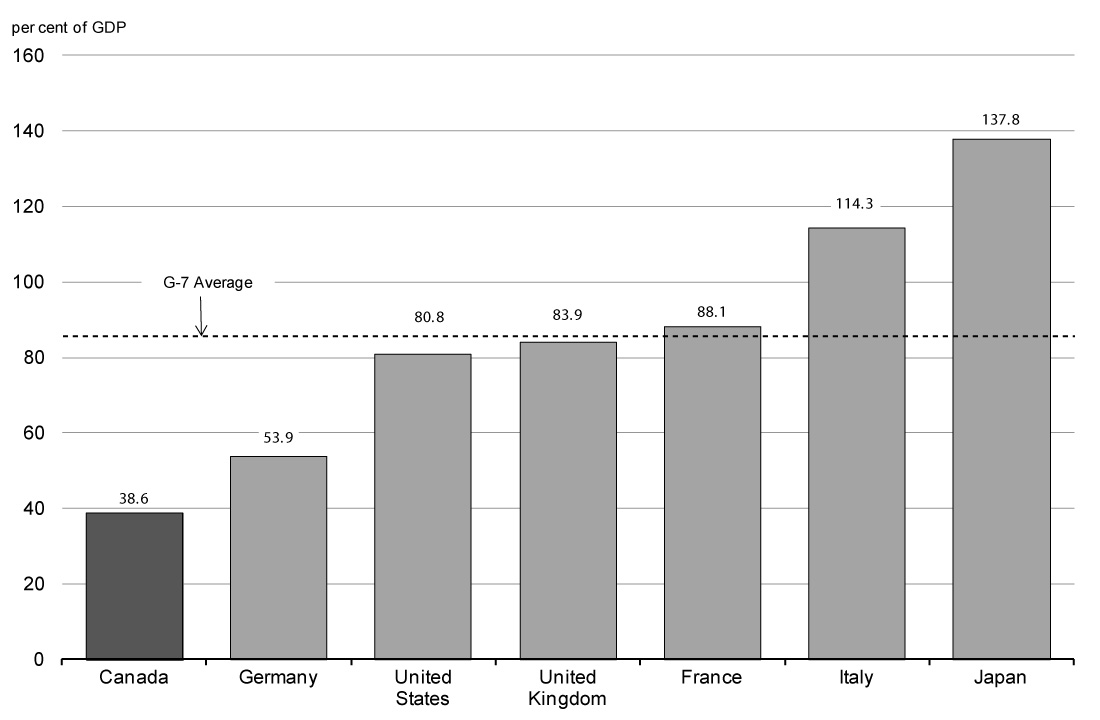
Source: International Monetary Fund, Fiscal Monitor, October 2014.