Archived - Update of Economic and Fiscal Projections — 2014: Part 3 of 4
Archived information
Archived information is provided for reference, research or recordkeeping purposes. It is not subject to the Government of Canada Web Standards and has not been altered or updated since it was archived. Please contact us to request a format other than those available.
Chapter 3
Fiscal Situation and Outlook
While the Canadian economy has recovered from the global recession better than other Group of Seven (G-7) economies, the global economic environment remains fragile and risks continue to weigh on global growth prospects. Canada is not immune to these external developments. By continuing to control growth in direct program spending, the Government has been able to provide significant tax relief to Canadian families while remaining on track to return to balanced budgets in 2015.
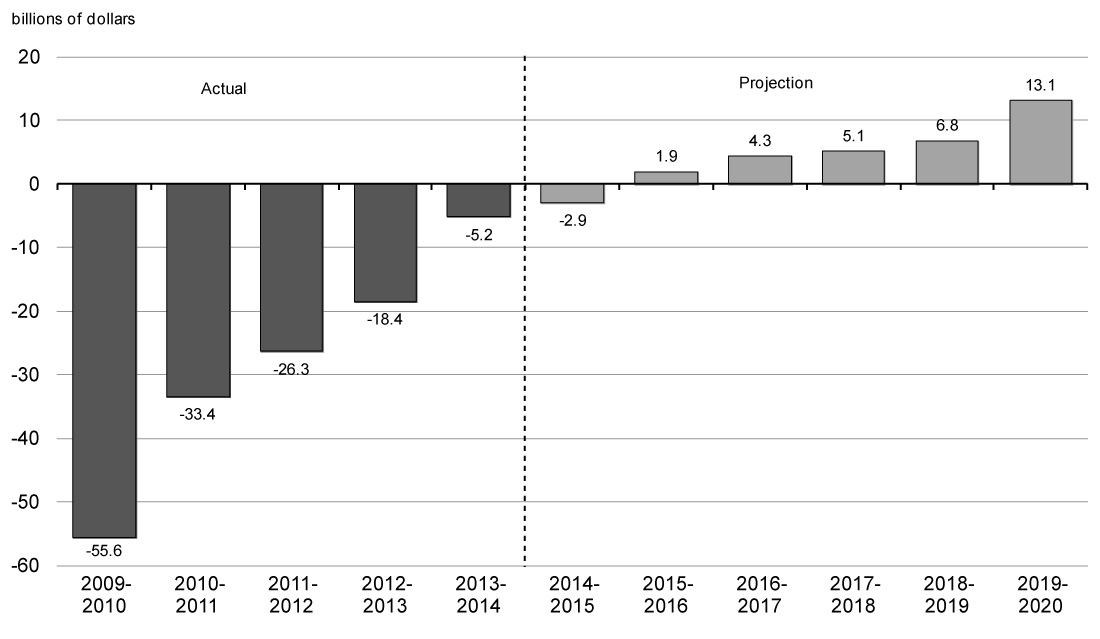
The deficit has been reduced from $55.6 billion in 2009–10 to $5.2 billion in 2013–14. A deficit of $2.9 billion is projected in 2014–15 after taking into account the set-aside for contingencies. Looking forward, after taking into account recently announced measures, a surplus of $1.9 billion is projected for 2015–16, with surpluses increasing to $13.1 billion in 2019–20.
This chapter reviews the major fiscal developments since Budget 2014 and updates the Government’s fiscal projections for the 2014–15 to 2019–20 period.
Fiscal Planning Assumptions
To ensure objectivity and transparency, the economic forecast underlying the Government’s fiscal projections is based on an average of private sector economic forecasts. As discussed in Chapter 2, in light of the impact of recent declines in crude oil prices, which accelerated between the time of the forecast and the Update, the Government has reduced the private sector forecast for nominal gross domestic product (GDP) by $3 billion in 2014 and $16 billion per year over the 2015–2019 period. This lower level of nominal GDP translates into a reduction in government revenues and, hence, lowers the budgetary balance by $0.5 billion in 2014–15 and by $2.5 billion per year over the 2015–2019 period. Furthermore, the Government has judged it appropriate to maintain the adjustment for risk at $20 billion per year, translating into a set-aside of $3.0 billion per year between 2014–15 and 2019–20 for contingencies. If the set-aside for contingencies is not required, it will be used to reduce the federal debt.
| 2014–15 | 2015–16 | 2016–17 | 2017–18 | 2018–19 | 2019–20 | |
|---|---|---|---|---|---|---|
| Set-aside for contingencies | -3.0 | -3.0 | -3.0 | -3.0 | -3.0 | -3.0 |
Changes in the Fiscal Outlook Since Budget 2014
While the global economy remains fragile, economic and fiscal developments have modestly improved the budgetary balance since Budget 2014. As a result, adjusting for the significant tax relief and enhanced benefits for Canadian families and small businesses, the projected budgetary balance remains broadly in line with Budget 2014 projections. Table 3.2 provides a summary of the changes in the fiscal projections between Budget 2014 and this Update.
| 2013–14 | Projection | ||||||
|---|---|---|---|---|---|---|---|
| 2014–15 | 2015–16 | 2016–17 | 2017–18 | 2018–19 | 2019–20 | ||
| Budget 2014 budgetary balance | -16.6 | -2.9 | 6.4 | 8.1 | 8.1 | 10.3 | n/a |
| Accounting adjustment | 0.7 | ||||||
| Budget 2014 budgetary balance, restated1 | -15.9 | -2.9 | 6.4 | 8.1 | 8.1 | 10.3 | n/a |
| Add: Set-aside for contingencies in Budget 2014 | 1.5 | 3.0 | 3.0 | 3.0 | 3.0 | 3.0 | |
| Budget 2014 budgetary balance before set-aside for contingencies | -14.4 | 0.1 | 9.4 | 11.1 | 11.1 | 13.3 | n/a |
| Impact of economic and fiscal developments2 | |||||||
| Budgetary revenues | 6.2 | 3.2 | 1.0 | 0.6 | 0.5 | 0.1 | |
| Program expenses | 2.6 | -1.2 | -1.8 | -1.3 | -0.9 | -0.7 | |
| Public debt charges1 | 0.4 | 1.2 | 1.2 | 1.8 | 2.1 | 1.9 | |
| Total economic and fiscal developments | 9.2 | 3.2 | 0.5 | 1.1 | 1.8 | 1.4 | |
| Measures since Budget 2014 | |||||||
| Supporting Canadian families and small businesses | -3.2 | -5.0 | -4.9 | -4.7 | -4.8 | -4.9 | |
| 2014 Update budgetary balance before set-aside for contingencies | -5.2 | 0.1 | 4.9 | 7.3 | 8.1 | 9.8 | 16.1 |
| Less: Set-aside for contingencies | -3.0 | -3.0 | -3.0 | -3.0 | -3.0 | -3.0 | |
| 2014 Update budgetary balance | -5.2 | -2.9 | 1.9 | 4.3 | 5.1 | 6.8 | 13.1 |
| Note: Totals may not add due to rounding. 1 The Budget 2014 forecast of the 2013–14 budgetary balance was restated in the Annual Financial Report of the Government of Canada—Fiscal Year 2013–2014, from $16.6 billion in Budget 2014 to $15.9 billion. The restatement was made to reflect an accounting change in 2013–14 relating to bond buybacks, which has resulted in a roughly $700-million decrease in budgeted public debt charges. Restating budget forecasts on a retroactive basis to reflect accounting changes is consistent with generally accepted accounting principles and past practice. 2 A negative number implies a deterioration in the budgetary balance (lower revenues or higher spending). A positive number implies an improvement in the budgetary balance (higher revenues or lower spending). |
|||||||
Accounting changes and restatements of previous years’ actual results were made in 2013–14, and are described in greater detail in the notes to the audited Condensed Consolidated Financial Statements of the Government of Canada included in the Annual Financial Report of the Government of Canada—Fiscal Year 2013–2014. The fiscal outlook tables and charts in this Update reflect these restatements.
To enhance the comparability of the forecasted and actual results, the Budget 2014 forecast of the 2013–14 budgetary deficit was also restated, from $16.6 billion to $15.9 billion. This restatement was made to reflect an accounting change in 2013–14 relating to bond buybacks, which resulted in an approximately $700-million decrease in budgeted public debt charges in 2013–14.
The Government of Canada engages in bond buyback operations in which bonds are exchanged or repurchased and refinanced with similar debt with the intent of sustaining market liquidity. Previously, premiums and discounts arising from these transactions were deferred and amortized. In light of developments regarding generally accepted accounting principles, these premiums and discounts on the buyback of bonds that result in the extinguishment of debt will now be expensed in the year they are incurred.
Impact of Economic and Fiscal Developments
The $5.2-billion deficit in 2013–14 was down from an $18.4-billion deficit in 2012–13 and was $10.7 billion lower than the restated $15.9-billion deficit forecast in Budget 2014. Revenues in 2013–14 were $6.2 billion higher than projected in Budget 2014, reflecting unanticipated gains in all major revenue streams due, in part, to a number of specific one-time factors. These one-time factors include large tax assessments and foreign exchange gains, which do not carry forward to future years. In addition, the $1.5-billion set-aside for contingencies included in the Budget 2014 revenue projection was not required. Program expenses in 2013–14 were $2.6 billion lower than forecast, largely reflecting a $1.2-billion reduction in the estimated federal liability under the Disaster Financial Assistance Arrangements for assistance related to the 2013 flood in Alberta, following updated information from the province.
Compared to Budget 2014, projected budgetary revenues are higher over the forecast horizon, reflecting the partial carry-forward of better-than-expected revenue results for 2013–14. The improvement in the revenue outlook diminishes over the forecast horizon as a result of the downward revisions to the outlook for nominal GDP as a result of significant reductions in commodity prices, and the impact of lower interest rates, which decrease the rate of return on the Government’s interest-bearing assets, recorded as part of other revenues.
| Projection | ||||||
|---|---|---|---|---|---|---|
| 2014–15 | 2015–16 | 2016–17 | 2017–18 | 2018–19 | 2019–20 | |
| Budget 2014 asset sales provision | 0.5 | 1.5 | ||||
| Less: Spectrum auction revenues | 0.3 | 0.3 | 0.3 | 0.3 | 0.3 | 0.3 |
| Impact on budgetary balance | 0.0 | 0.0 | 0.3 | 0.3 | 0.3 | 0.3 |
| Remaining asset sales provision | 0.2 | 1.2 | ||||
The provision of $0.5 billion in 2014–15 and $1.5 billion in 2015–16 for future asset sales was introduced in the 2013 Update of Economic and Fiscal Projections and maintained in Budget 2014. This provision reflected expected gains from actions the Government has undertaken to systematically review federally owned assets to improve their efficiency and effectiveness and to ensure value for taxpayers. This review seeks to ensure that government ownership of federal assets remains in the best interests of Canadians. If it is determined that divestiture of an asset would create economic value and would represent the most efficient use of taxpayer resources, the Government will proceed with a sale process.
Since Budget 2014, the Government has completed the 700-megahertz spectrum auction. Consistent with the Government’s accounting policy, the revenues from this auction will be recognized evenly over the 20-year term of the licences.
This leaves the remaining asset sales provision at $0.2 billion for 2014–15 and $1.2 billion for 2015–16, amounts that the Government judges to be conservative and not reflective of the full potential gain that could be realized from the expected sale of assets.
Program expenses are expected to be above the level projected in Budget 2014 over the forecast horizon, driven largely by changes to employee pension and benefit expenses which have increased direct program expenses. This is largely due to changes to demographic assumptions and a change in the timing of when employee pension and benefit liabilities are expensed. Because long-term interest rates, which are used to discount those liabilities, are now expected to be lower than previously projected, relatively more of those liabilities must be expensed in the near term as opposed to the future. That said, the long-term total pension and benefit liability of the Government has not changed as a result of changes in interest rates. The outlook for direct program expenses has also been revised to reflect changes to the forecast for capital amortization expenses.
Public debt charges are expected to be lower than projected in Budget 2014 over the entire forecast horizon, largely due to lower projected interest rates, as well as the ongoing impact of the change in the accounting treatment of bond buybacks.
Supporting Canadian Families and Small Businesses
On October 30, 2014, the Government proposed new measures to help make life more affordable for Canadian families. All families with children are expected to benefit from these measures, which include a new Family Tax Cut, an increase and expansion of the Universal Child Care Benefit and an increase in the Child Care Expense Deduction dollar limits. Earlier in the month, on October 9, 2014, the Government also announced its intention to double the Children’s Fitness Tax Credit and make it refundable. Taken together, these measures will provide Canadian families with children with additional tax relief and enhanced benefits of $3.1 billion in 2014–15, and more than $4.6 billion per year in 2015–16 and beyond.
All Canadians are benefiting from the Government’s long-term commitment to keeping taxes low. Since 2006, the Government has introduced close to 180 tax relief measures. As a result of actions taken since 2006, including the recently proposed measures, Canadian families and individuals will receive about $35 billion in tax relief and increased benefits in 2014–15. Going forward, the Government will continue to examine ways of reducing the tax burden on Canadians.
In September 2013, the Government announced a three-year freeze of the Employment Insurance (EI) rate at its 2013 level of $1.88 per $100 of insurable earnings to prevent it from rising to $1.93 in 2014, saving employers and employees an expected $660 million in 2014 alone.
Building on this measure, on September 11, 2014, the Government announced further action to create jobs, growth and long-term prosperity with the introduction of the new Small Business Job Credit. The credit is expected to save small businesses more than $550 million over 2015 and 2016, by effectively lowering small businesses’ EI premiums from the current legislated rate of $1.88 to $1.60 per $100 of insurable earnings in 2015 and 2016. Any firm that pays employer EI premiums equal to or less than $15,000 in those years will be eligible for the credit, representing close to 90 per cent of all EI premium-paying businesses in Canada. The Canada Revenue Agency will automatically calculate the credit on a business’ T4 information return, ensuring that no new paper burden will be imposed on business owners.
In addition, all employers and employees will benefit from a substantial reduction in the EI premium rate in 2017 from the currently legislated $1.88 per $100 of insurable earnings to an estimated $1.45 when the new seven-year break-even rate-setting mechanism takes effect. This will ensure that EI premiums are no higher than needed to pay for the EI program over time.
Altogether, measures taken by the Government since Budget 2014 to support Canadian families and small businesses total $27.6 billion over six years.
Summary Statement of Transactions
Table 3.3 summarizes the Government’s financial position over the forecast horizon. These projections are based on the adjusted average private sector forecast for the economy as described in Chapter 2, and the set-aside for contingencies discussed above.
| 2013–14 | Projection | ||||||
|---|---|---|---|---|---|---|---|
| 2014–15 | 2015–16 | 2016–17 | 2017–18 | 2018–19 | 2019–20 | ||
| Budgetary revenues | 271.7 | 277.6 | 294.5 | 307.6 | 318.6 | 332.8 | 347.9 |
| Program expenses | 248.6 | 252.7 | 263.9 | 273.0 | 281.3 | 292.2 | 299.6 |
| Public debt charges | 28.2 | 27.7 | 28.7 | 30.4 | 32.3 | 33.8 | 35.2 |
| Total expenses | 276.8 | 280.5 | 292.6 | 303.3 | 313.6 | 326.1 | 334.8 |
| Budgetary balance | -5.2 | -2.9 | 1.9 | 4.3 | 5.1 | 6.8 | 13.1 |
| Federal debt1 | 611.9 | 615.8 | 613.9 | 609.5 | 604.4 | 597.6 | 584.5 |
| Per cent of GDP | |||||||
| Budgetary revenues | 14.3 | 14.2 | 14.5 | 14.5 | 14.4 | 14.4 | 14.5 |
| Program expenses | 13.1 | 12.9 | 13.0 | 12.9 | 12.7 | 12.7 | 12.5 |
| Public debt charges | 1.5 | 1.4 | 1.4 | 1.4 | 1.5 | 1.5 | 1.5 |
| Budgetary balance | -0.3 | -0.1 | 0.1 | 0.2 | 0.2 | 0.3 | 0.5 |
| Federal debt | 32.3 | 31.5 | 30.3 | 28.8 | 27.3 | 25.9 | 24.3 |
| Note: Totals may not add due to rounding. 1 The projected level of federal debt for 2014–15 includes an estimate of other comprehensive income. |
|||||||
As a result of the Government’s responsible management of public finances, a surplus of $1.9 billion is projected for 2015–16, growing to a surplus of $13.1 billion in 2019–20 (Chart 3.1).
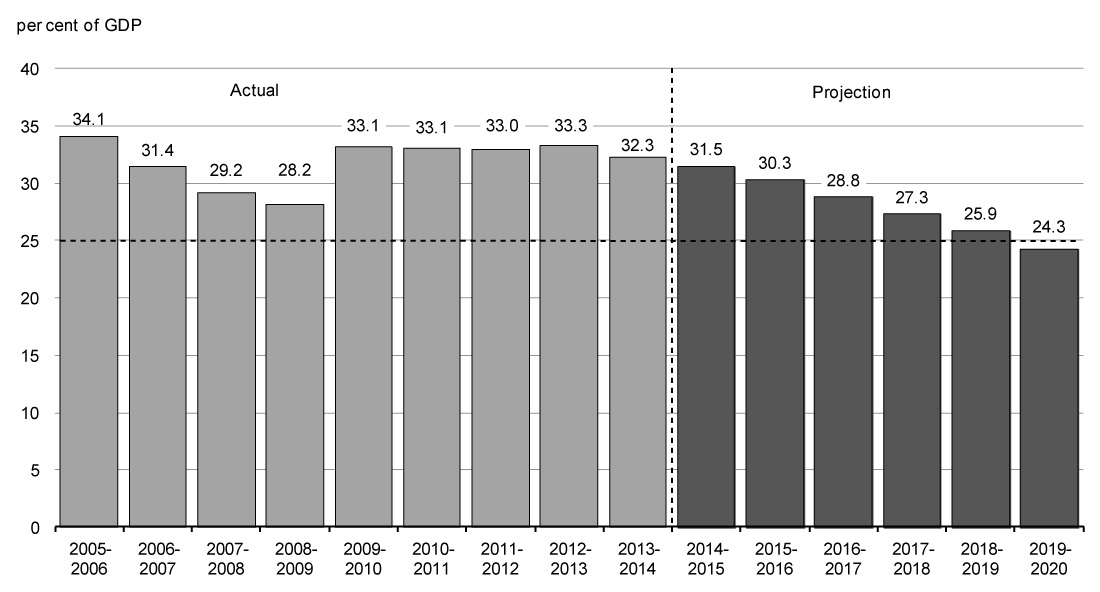
The federal debt-to-GDP ratio (accumulated deficit) fell to 32.3 per cent in 2013–14 and is projected to steadily continue on a downward path, putting the Government well on its way to meeting its commitment to reduce the federal debt to 25 per cent of GDP by 2021. Indeed, the federal debt-to-GDP ratio is expected to fall to below its pre-recession level by 2017 (Chart 3.2). This will help to ensure that Canada’s total government net debt-to-GDP ratio (which includes that of the federal, provincial, territorial and local governments as well as the net assets of the Canada Pension Plan and Québec Pension Plan) continues to decline. Indeed, the International Monetary Fund (IMF) projects that Canada’s total government net debt-to-GDP ratio will remain the lowest of any G-7 country.
Outlook for Budgetary Revenues
| 2013–14 | Projection | ||||||
|---|---|---|---|---|---|---|---|
| 2014–15 | 2015–16 | 2016–17 | 2017–18 | 2018–19 | 2019–20 | ||
| Income taxes | |||||||
| Personal income tax | 130.8 | 134.2 | 143.9 | 152.3 | 160.1 | 167.1 | 175.1 |
| Corporate income tax | 36.6 | 38.3 | 40.4 | 42.6 | 44.3 | 46.1 | 48.2 |
| Non-resident income tax | 6.4 | 6.4 | 6.5 | 7.0 | 7.5 | 7.9 | 8.3 |
| Total income tax | 173.8 | 178.9 | 190.9 | 201.9 | 211.9 | 221.1 | 231.6 |
| Excise taxes/duties | |||||||
| Goods and Services Tax | 31.0 | 31.8 | 33.5 | 35.4 | 37.2 | 38.9 | 40.6 |
| Customs import duties | 4.2 | 4.5 | 5.0 | 4.6 | 4.8 | 5.0 | 5.2 |
| Other excise taxes/duties | 10.9 | 11.5 | 11.5 | 11.5 | 11.5 | 11.5 | 11.5 |
| Total excise taxes/duties | 46.1 | 47.8 | 50.0 | 51.4 | 53.5 | 55.4 | 57.3 |
| Total tax revenues | 219.9 | 226.7 | 240.9 | 253.3 | 265.4 | 276.5 | 288.9 |
| Employment Insurance premium revenues | 21.8 | 22.6 | 23.3 | 22.9 | 19.4 | 20.1 | 21.0 |
| Other revenues | 30.0 | 28.3 | 30.3 | 31.4 | 33.9 | 36.2 | 38.0 |
| Total budgetary revenues | 271.7 | 277.6 | 294.5 | 307.6 | 318.6 | 332.8 | 347.9 |
| Per cent of GDP | |||||||
| Personal income tax | 6.9 | 6.9 | 7.1 | 7.2 | 7.2 | 7.2 | 7.3 |
| Corporate income tax | 1.9 | 2.0 | 2.0 | 2.0 | 2.0 | 2.0 | 2.0 |
| Goods and Services Tax | 1.6 | 1.6 | 1.7 | 1.7 | 1.7 | 1.7 | 1.7 |
| Total tax revenues | 11.6 | 11.6 | 11.9 | 12.0 | 12.0 | 12.0 | 12.0 |
| Employment Insurance premium revenues | 1.1 | 1.2 | 1.2 | 1.1 | 0.9 | 0.9 | 0.9 |
| Other revenues | 1.6 | 1.4 | 1.5 | 1.5 | 1.5 | 1.6 | 1.6 |
| Total | 14.3 | 14.2 | 14.5 | 14.5 | 14.4 | 14.4 | 14.5 |
| Note: Totals may not add due to rounding. | |||||||
Table 3.4 sets out the Government’s projection for budgetary revenues after factoring in the set-aside for contingencies. For planning purposes, the set-aside for contingencies is allocated proportionally to tax revenues and other revenues, net of flow-through revenues. Revenues are expected to increase by 2.2 per cent in 2014–15. Over the remainder of the forecast horizon, revenues are projected to grow at an average annual rate of 4.6 per cent.
Personal income tax revenues—the largest component of budgetary revenues—are projected to increase by only $3.4 billion or 2.6 per cent in 2014–15, reflecting the introduction of tax relief measures for families via the new Family Tax Cut. Over the remainder of the projection period, personal income tax revenues are forecast to increase somewhat faster than growth in nominal GDP, averaging 5.5 per cent annual growth, reflecting the progressive nature of the income tax system combined with projected real income gains.
Corporate income tax revenues are projected to increase by $1.7 billion, or 4.8 per cent, in 2014–15, reflecting growth in corporate taxable income. Over the remainder of the projection period, corporate income tax revenues are forecast to grow at an annual rate of 4.7 per cent, based on projected profit growth, previously announced actions to close tax loopholes and improve the fairness and integrity of the tax system, and changes to the Canada Revenue Agency’s compliance programs.
Non-resident income tax revenues are income taxes paid by non-residents of Canada on Canadian-sourced income, notably dividends and interest payments. For 2014–15, non-resident income tax revenues are projected to remain at the same level as in 2013–14 ($6.4 billion), as non-resident income tax revenues were increased by one-time factors in 2013–14. Over the remainder of the forecast horizon, they are projected to increase at an average annual rate of 5.4 per cent, reflecting projected growth in corporate profits and dividends.
Goods and Services Tax (GST) revenues are projected to grow by 2.6 per cent in 2014–15 based on projected growth in taxable consumption and year-to-date results. Over the remainder of the projection period, GST revenues are projected to grow by 5.0 per cent per year on average, based on projected growth in taxable consumption and in the GST credit.
Customs import duties are projected to increase by 6.5 per cent in 2014–15, reflecting year-to-date results and projected growth in imports, followed by an increase of 10.4 per cent in 2015–16. However, customs import duties are projected to decline by 7.8 per cent in 2016–17, reflecting the expected impacts of the Canada-European Union Comprehensive Economic and Trade Agreement and the Canada-Korea Free Trade Agreement. Over the remainder of the projection period, annual growth in customs import duties is projected to average 4.2 per cent, based on projected growth in imports.
Other excise taxes and duties are projected to increase by 5.4 per cent to $11.5 billion in 2014–15, reflecting year-to-date results and adjustments to the excise duty rate for tobacco announced in Budget 2014, and are expected to remain stable over the remainder of the projection period.
Employment Insurance (EI) premium revenues are projected to grow by 3.8 per cent in 2014–15 and by 3.3 per cent in 2015–16, reflecting the growth in insurable earnings, as well as the offsetting impact of the Small Business Job Credit. Reflecting the introduction of the seven-year break-even rate mechanism in 2017, EI premium rates are expected to decrease to $1.45, bringing expected declines in EI premium revenues of 1.8 per cent in 2016–17 and 15.4 per cent in 2017–18. EI premium revenues are expected to resume their upward trend in 2018–19.
| 2013– 2014 |
2014– 2015 |
2015– 2016 |
2016– 2017 |
2017– 2018 |
2018– 2019 |
2019– 2020 |
|
|---|---|---|---|---|---|---|---|
| EI premium revenues | 21.8 | 22.6 | 23.3 | 22.9 | 19.4 | 20.1 | 21.0 |
| EI benefits1 | 17.3 | 17.6 | 18.2 | 18.8 | 19.5 | 20.3 | 21.0 |
| 2013 | 2014 | 2015 | 2016 | 2017 | 2018 | 2019 | |
| EI Operating Account annual balance2 | 2.9 | 3.8 | 3.9 | 4.5 | -1.3 | -1.3 | -1.3 |
| EI Operating Account cumulative balance2 | -5.2 | -1.4 | 2.5 | 7.0 | 5.6 | 4.4 | 3.1 |
| Reference: | |||||||
| Projected premium rate (per $100 of insurable earnings) |
1.88 | 1.88 | 1.88 | 1.88 | 1.45 | 1.45 | 1.45 |
| 1 EI benefits include regular EI benefits, sickness, maternity, parental, compassionate care, fishing and work-sharing benefits, and employment benefits and support measures. These represent 90 per cent of total EI program expenses. The remaining EI costs relate mainly to administration and are included in direct program expenses. 2 The EI Operating Account annual and cumulative balances are net of EI premium revenues and EI expenses, including administration costs. The balances are presented on a calendar-year basis since the EI premium rate is set on a calendar-year basis. |
|||||||
The EI Operating Account reached a cumulative deficit of $9.2 billion in 2011, due to the impact of the recession. Since then, the EI Operating Account has been recording annual surpluses which will eventually eliminate the cumulative deficit, consistent with the principle of breaking even over time. With the continued growth in EI premium revenues, annual surpluses are also expected for 2014 and 2015. As a result, the EI Operating Account is expected to return to cumulative balance in 2015.
The accumulated surplus will be gradually eliminated after the introduction of the seven-year break-even rate mechanism in 2017, resulting in a significant reduction in the premium rate that year. This new rate-setting mechanism will ensure that EI premiums are no higher than needed to pay for the EI program over time. The seven-year break-even rate will be set by the Canada Employment Insurance Commission, based on the projections of the EI Chief Actuary.
Other revenues include revenues from consolidated Crown corporations, net income from enterprise Crown corporations, returns on investments, foreign exchange revenues and proceeds from the sales of goods and services. These revenues are generally volatile, owing principally to the impact of interest rates on returns on investments and the assets in the Exchange Fund Account, and the net gains or losses from enterprise Crown corporations. These revenues are also affected by the impact of exchange rate movements on the Canadian-dollar value of foreign-denominated assets as well as flow-through items that give rise to an offsetting expense and therefore do not impact the budgetary balance.
For 2014–15, other revenues are projected to decrease by 5.7 per cent to $28.3 billion due in part to the fact that in 2013–14, other revenue results included two significant one-time transactions: the $0.7-billion gain realized by the Canada Development Investment Corporation on the Government’s sale of 30 million shares of General Motors common stock in September 2013; and a $0.6-billion gain on the March 27, 2014 sale of Macdonald House, a Canadian High Commission property in London. In addition, other revenues are lower in 2014–15 due to lower flow-through revenues, which are revenues that give rise to an equal and offsetting reduction in total expenses with no impact on the budgetary balance. Growth in other revenues is expected to average 6.1 per cent over the remainder of the forecast horizon, based on the projected profiles of interest rates and nominal GDP and the provision for future asset sales.
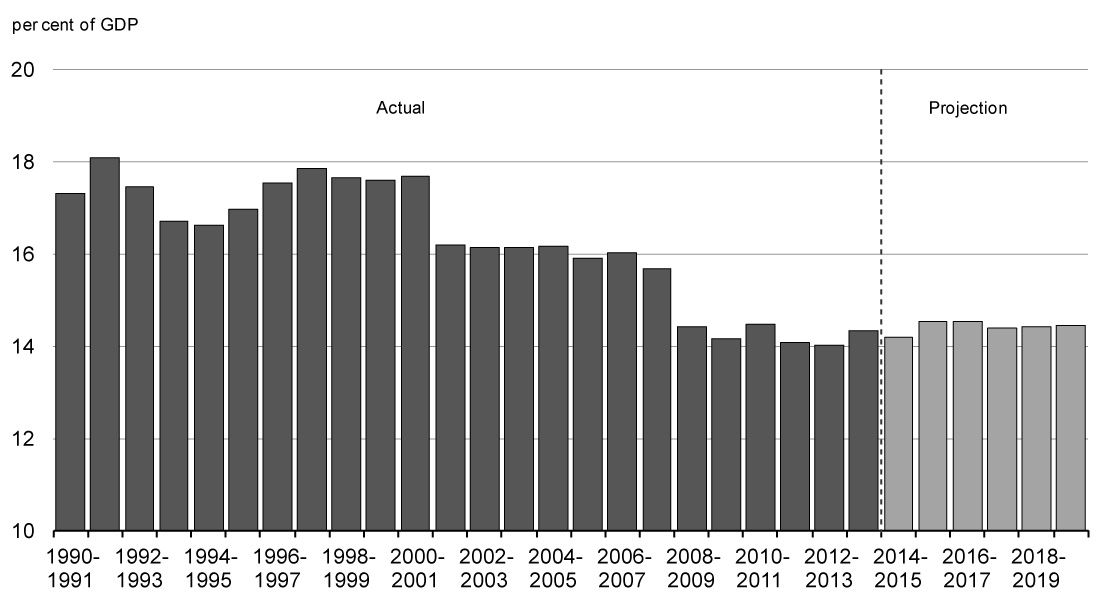
The revenue-to-GDP ratio declined substantially since 2006–07 and is at its lowest level in more than 50 years, averaging just over 14 per cent since 2008–09 (Chart 3.3). This decline is due primarily to tax reduction measures. Over the forecast horizon, the revenue-to-GDP ratio is projected to remain relatively stable around its current level.
Outlook for Program Expenses
| 2013–14 | Projection | ||||||
|---|---|---|---|---|---|---|---|
| 2014–15 | 2015–16 | 2016–17 | 2017–18 | 2018–19 | 2019–20 | ||
| Major transfers to persons | |||||||
| Elderly benefits | 41.8 | 43.9 | 46.2 | 48.8 | 51.4 | 54.3 | 57.3 |
| Employment Insurance benefits1 | 17.3 | 17.6 | 18.2 | 18.8 | 19.5 | 20.3 | 21.0 |
| Children’s benefits | 13.1 | 14.5 | 18.3 | 18.5 | 18.7 | 18.9 | 19.1 |
| Total | 72.2 | 76.0 | 82.7 | 86.1 | 89.7 | 93.4 | 97.5 |
| Major transfers to other levels of government | |||||||
| Canada Health Transfer | 30.3 | 32.1 | 34.0 | 36.1 | 37.7 | 39.3 | 41.0 |
| Canada Social Transfer | 12.2 | 12.6 | 13.0 | 13.3 | 13.7 | 14.2 | 14.6 |
| Fiscal arrangements2 | 18.7 | 19.4 | 20.1 | 20.9 | 21.8 | 22.6 | 23.5 |
| Gas Tax Fund | 2.1 | 2.0 | 2.0 | 2.1 | 2.1 | 2.2 | 2.2 |
| Other major transfers3 | 0.7 | 0.2 | 0.2 | 0.1 | 0.1 | 0.0 | 0.0 |
| Alternative Payments for Standing Programs4 | -3.5 | -3.7 | -3.9 | -4.1 | -4.3 | -4.5 | -4.7 |
| Total | 60.5 | 62.6 | 65.4 | 68.4 | 71.0 | 73.8 | 76.6 |
| Direct program expenses | |||||||
| Operating expenses | 74.7 | 73.0 | 74.5 | 75.1 | 76.7 | 79.7 | 80.1 |
| Transfer payments | 36.7 | 35.9 | 35.6 | 37.4 | 37.6 | 38.4 | 38.5 |
| Capital amortization | 4.5 | 5.2 | 5.7 | 6.0 | 6.3 | 6.9 | 7.0 |
| Total | 115.9 | 114.1 | 115.7 | 118.5 | 120.6 | 125.0 | 125.5 |
| Total program expenses | 248.6 | 252.7 | 263.9 | 273.0 | 281.3 | 292.2 | 299.6 |
| Per cent of GDP | |||||||
| Major transfers to persons | 3.8 | 3.9 | 4.1 | 4.1 | 4.1 | 4.0 | 4.1 |
| Major transfers to other levels of government | 3.2 | 3.2 | 3.2 | 3.2 | 3.2 | 3.2 | 3.2 |
| Direct program expenses | 6.1 | 5.8 | 5.7 | 5.6 | 5.4 | 5.4 | 5.2 |
| Total program expenses | 13.1 | 12.9 | 13.0 | 12.9 | 12.7 | 12.7 | 12.5 |
| Note: Totals may not add due to rounding. 1 EI benefits include regular EI benefits, sickness, maternity, parental, compassionate care, fishing and work-sharing benefits, and employment benefits and support measures. These represent 90 per cent of total EI program expenses. The remaining EI costs relate mainly to administration and are part of operating expenses. 2 Fiscal arrangements include Equalization, Territorial Formula Financing, the Youth Allowances Recovery and statutory subsidies. 3 Other major transfers to other levels of government include transitional payments; transfer protection payments in 2013–14; payments under the 2005 Offshore Accords; the Wait Times Reduction Transfer; and other health-related transfers. 4 Alternative Payments for Standing Programs represent a recovery from Quebec of an additional tax point transfer above and beyond the tax point transfer under the Canada Health Transfer and the Canada Social Transfer. |
|||||||
Table 3.5 sets out the main components of program expenses: major transfers to persons, major transfers to other levels of government, and direct program expenses.
Major transfers to persons are projected to increase steadily over the forecast horizon, from $76.0 billion in 2014–15 to $97.5 billion in 2019–20. Major transfers to persons consist of elderly, EI and children’s benefits.
Elderly benefits are comprised of Old Age Security, Guaranteed Income Supplement and Allowance payments to qualifying seniors. Elderly benefits are projected to grow from $43.9 billion in 2014–15 to $57.3 billion in 2019–20, or approximately 5.5 per cent per year—faster than nominal GDP, which is projected to grow on average by 4.2 per cent per year. The projected increase in elderly benefits is due to consumer price inflation, to which benefits are fully indexed, and a projected increase in the seniors’ population from 5.6 million in 2014–15 to 6.6 million in 2019–20, an average increase of 3.5 per cent per year.
EI benefits are projected to increase by 2.0 per cent to $17.6 billion in 2014–15 based on year-to-date results and projected growth in average benefits. Over the remainder of the projection period, EI benefits are projected to grow moderately, averaging 3.6 per cent annually, as projected increases in the average benefits paid to EI recipients more than offset the impacts of the reduction in the number of unemployed.
Children’s benefits are projected to increase over the forecast horizon from $14.5 billion in 2014–15 to $19.1 billion in 2019–20, reflecting growth in the eligible population, adjustments for inflation and, most importantly, the increase and expansion of the Universal Child Care Benefit, effective January 2015.
Major transfers to other levels of government are expected to increase over the forecast horizon, from $62.6 billion in 2014–15 to $76.6 billion in 2019–20. Major transfers to other levels of government include transfers in support of health and social programs, Equalization and Territorial Formula Financing, among others. The Canada Health Transfer (CHT) is projected to grow from $32.1 billion in 2014–15 to $41.0 billion in 2019–20. Starting in 2017–18, the CHT will grow in line with a three-year moving average of nominal GDP growth, with funding guaranteed to increase by at least 3 per cent per year. The Canada Social Transfer will continue to grow at 3 per cent per year.
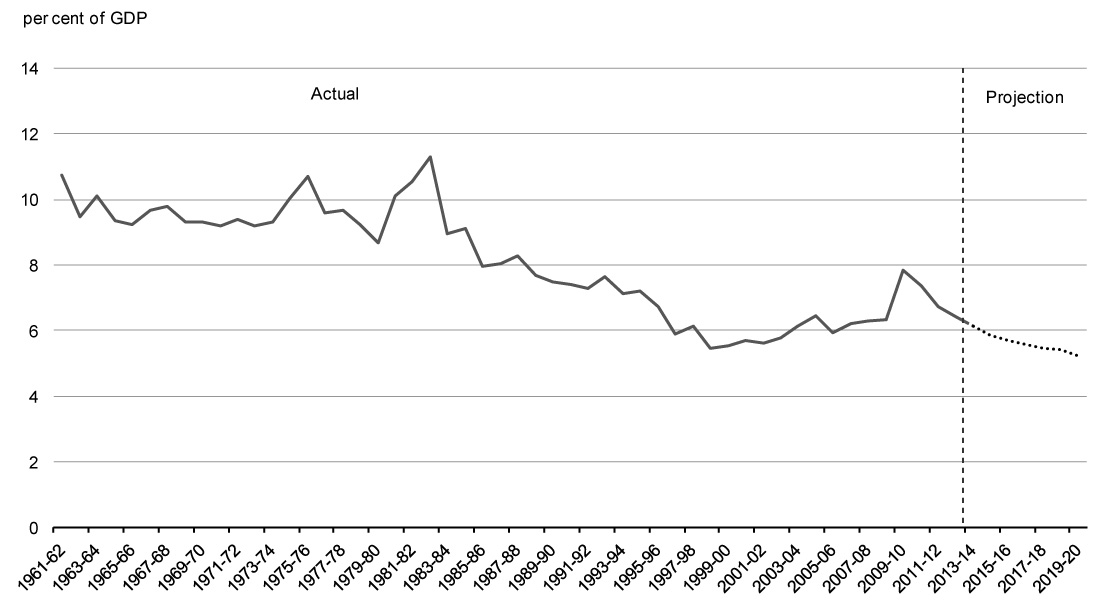
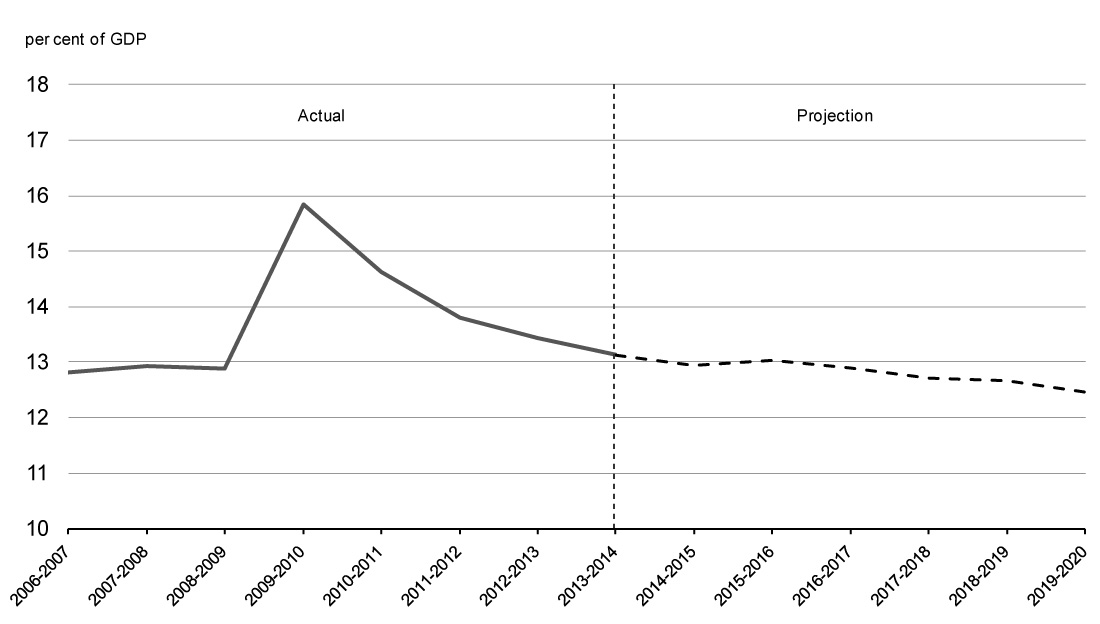
The Government is committed to controlling the spending of federal departments. Direct program expenses have fallen over the last four years, decreasing from $122.8 billion in 2009–10 to $115.9 billion in 2013–14, the first time this has occurred since 1961–62, the earliest year for which data are readily available. This trend is expected to continue for a fifth year in a row, with projected direct program expenses dropping to $114.1 billion in 2014–15. Over the forecast horizon, direct program expenses are expected to decrease as a percentage of GDP, reaching a low of 5.2 per cent of GDP in 2019–20 (Chart 3.4).
Direct program expenses include operating expenses, transfer payments administered by departments and capital amortization. Operating expenses reflect the cost of doing business for more than 100 government departments and agencies, including National Defence. Operating expenses are projected to increase modestly over the forecast horizon, rising from $73.0 billion in 2014–15 to $80.1 billion in 2019–20. This increase is a result of growth in National Defence funding reflecting increases provided under the Canada First Defence Strategy, as well as cost pressures related to funding for essential services such as public safety and non-discretionary payments (e.g. utilities, leases). Transfer payments administered by departments are broadly stable over the forecast horizon, rising from $35.9 billion in 2014–15 to $38.5 billion in 2019–20. Capital amortization expenses are expected to increase from $5.2 billion in 2014–15 to $7.0 billion in 2019–20. Capital expenditures are amortized over the expected useful life of assets. The increase in capital amortization expenses is a result of significant recent and planned investments in new capital as well as upgrades to existing capital.
As a share of GDP, total program expenses are projected to decline from 13.1 per cent in 2013–14 to 12.5 per cent in 2019–20, which is below its pre-recession level (Chart 3.5).
per cent of GDP
Risks to the Fiscal Projections
Risks to the economic outlook are the greatest source of uncertainty to the fiscal projections. To help quantify these risks, tables illustrating the sensitivity of the budgetary balance to a number of economic shocks are provided below.
Beyond the economic outlook, there remain upside and downside risks associated with the fiscal projections, as several key drivers of the fiscal outlook are not directly linked to economic variables (such as the relationship between personal income taxes and personal income or the extent to which departments and agencies do not fully use all of the resources appropriated by Parliament).
Sensitivity of the Budgetary Balance to Economic Shocks
Changes in economic assumptions affect the projections for revenues and expenses. The following tables illustrate the sensitivity of the budgetary balance to a number of economic shocks:
- A one-year, 1-percentage-point decrease in real GDP growth driven equally by lower productivity and employment growth.
- A decrease in nominal GDP growth resulting solely from a one-year, 1-percentage-point decrease in the rate of GDP inflation (assuming that the Consumer Price Index (CPI) moves in line with GDP inflation).
- A sustained 100-basis-point increase in all interest rates.
These sensitivities are generalized rules of thumb that assume any decrease in economic activity is proportional across income and expenditure components, and are meant to provide a broad illustration of the impact of economic shocks on the outlook for the budgetary balance. Actual economic shocks may have different fiscal impacts. For example, they may be concentrated in specific sectors of the economy or cause different responses in key economic variables (e.g. GDP inflation and CPI inflation may have different responses to a given shock).
| Year 1 | Year 2 | Year 5 | |
|---|---|---|---|
| Federal revenues | |||
| Tax revenues | |||
| Personal income tax | -2.6 | -2.8 | -3.2 |
| Corporate income tax | -0.4 | -0.5 | -0.5 |
| Goods and Services Tax | -0.3 | -0.4 | -0.4 |
| Other | 0.0 | -0.2 | -0.2 |
| Total tax revenues | -3.4 | -3.8 | -4.4 |
| Employment Insurance premiums | -0.2 | -0.2 | -0.2 |
| Other revenues | -0.1 | -0.1 | -0.1 |
| Total budgetary revenues | -3.7 | -4.1 | -4.7 |
| Federal expenses | |||
| Major transfers to persons | |||
| Elderly benefits | 0.0 | 0.0 | -0.1 |
| Employment Insurance benefits | 0.8 | 0.8 | 0.6 |
| Children’s benefits | 0.0 | 0.0 | 0.2 |
| Total | 0.8 | 0.8 | 0.8 |
| Other program expenses | -0.2 | -0.2 | -0.2 |
| Public debt charges | 0.0 | 0.1 | 0.7 |
| Total expenses | 0.7 | 0.8 | 1.2 |
| Budgetary balance | -4.3 | -4.9 | -5.9 |
| Note: Totals may not add due to rounding. | |||
A 1-percentage-point decrease in real GDP growth proportional across income and expenditure components reduces the budgetary balance by $4.3 billion in the first year, $4.9 billion in the second year and $5.9 billion in the fifth year (Table 3.6).
- Tax revenues from all sources fall by a total of $3.4 billion in the first year and by $3.8 billion in the second year. Personal income tax revenues decrease as employment and wages and salaries fall. Corporate income tax revenues fall as output and profits decrease. GST revenues decrease as a result of lower consumer spending associated with the fall in employment and personal income.
- EI premium revenues decrease as employment and wages and salaries fall. In order to isolate the direct impact of the economic shock and provide a general overview of the fiscal impacts, the EI premium revenue impacts do not include changes in the premium rate.
- Expenses rise, mainly reflecting higher EI benefits (due to an increase in the number of unemployed) and higher public debt charges (reflecting a higher stock of debt due to the lower budgetary balance). This rise is partially offset by lower other program expenses (as certain programs are tied directly to growth in nominal GDP).
| Year 1 | Year 2 | Year 5 | |
|---|---|---|---|
| Federal revenues | |||
| Tax revenues | |||
| Personal income tax | -2.4 | -1.7 | -1.6 |
| Corporate income tax | -0.4 | -0.5 | -0.5 |
| Goods and Services Tax | -0.3 | -0.4 | -0.4 |
| Other | -0.2 | -0.2 | -0.2 |
| Total tax revenues | -3.4 | -2.7 | -2.8 |
| Employment Insurance premiums | -0.1 | -0.2 | -0.2 |
| Other revenues | -0.1 | -0.1 | -0.2 |
| Total budgetary revenues | -3.6 | -3.0 | -3.2 |
| Federal expenses | |||
| Major transfers to persons | |||
| Elderly benefits | -0.4 | -0.5 | -0.6 |
| Employment Insurance benefits | -0.1 | -0.1 | -0.1 |
| Children’s benefits | 0.0 | 0.0 | 0.0 |
| Total | -0.5 | -0.6 | -0.8 |
| Other program expenses | -0.4 | -0.5 | -0.9 |
| Public debt charges | -0.5 | 0.1 | 0.5 |
| Total expenses | -1.3 | -1.0 | -1.2 |
| Budgetary balance | -2.3 | -2.0 | -2.0 |
| Note: Totals may not add due to rounding. | |||
A 1-percentage-point decrease in nominal GDP growth proportional across income and expenditure components resulting solely from lower GDP inflation (assuming that the Consumer Price Index moves in line with GDP inflation) lowers the budgetary balance by $2.3 billion in the first year, and by $2.0 billion in the second and fifth years (Table 3.7).
- Lower prices result in lower nominal income and, as a result, personal income tax revenues decrease, reflecting declines in the underlying nominal tax base. As the parameters of the personal income tax system are indexed to inflation and automatically adjust in response to the shock, the fiscal impact is smaller than under the real shock. For the other sources of tax revenue, the negative impacts are similar under the real and nominal GDP shocks.
- EI premium revenues, absent any change in the premium rate, decrease in response to lower earnings. In order to isolate the direct impact of the economic shock and provide a general overview of the fiscal impacts, the EI premium revenue impacts do not include changes in the premium rate.
- Other revenues decline slightly as lower prices lead to lower revenues from the sales of goods and services.
- Partly offsetting lower revenues are the declines in the cost of statutory programs that are indexed to inflation, such as elderly benefit payments and the Canada Child Tax Benefit, and downward pressure on federal program expenses. Payments under these programs are smaller if inflation is lower. Other program expenses are also lower as certain programs are tied directly to growth in nominal GDP.
- Public debt charges decline in the first year due to lower costs associated with Real Return Bonds, then rise due to the higher stock of debt.
| Year 1 | Year 2 | Year 5 | |
|---|---|---|---|
| Federal revenues | 1.4 | 1.8 | 2.5 |
| Federal expenses | 1.5 | 2.7 | 4.1 |
| Budgetary balance | -0.1 | -0.9 | -1.6 |
An increase in interest rates decreases the budgetary balance by $0.1 billion in the first year, $0.9 billion in the second year and $1.6 billion in the fifth year (Table 3.8). The decline stems entirely from increased expenses associated with public debt charges. The impact on debt charges rises through time as longer-term debt matures and is refinanced at higher rates. Moderating the overall impact is an increase in revenues associated with the increase in the rate of return on the Government’s interest-bearing assets, which are recorded as part of other revenues. The impacts of changes in interest rates on public sector pension and benefit expenses are excluded from the sensitivity analysis.