Annex 1: Economic and Fiscal Outlook
Notes: This section incorporates data available up to and including February 16, 2018, unless otherwise indicated. All rates are reported at annual rates unless otherwise noted. All dollar values are expressed in Canadian currency unless otherwise indicated.
Introduction
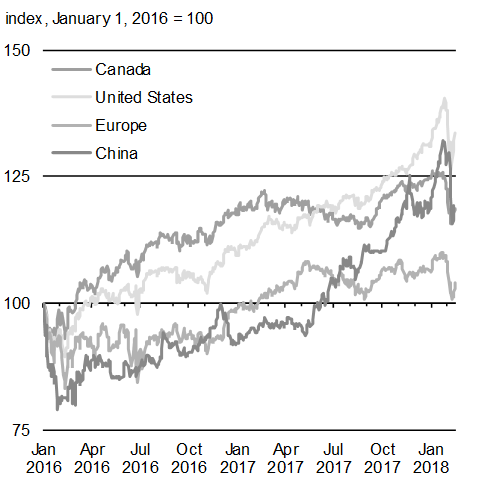
Thanks to the hard work of Canadians supported by a plan that focuses on investment over austerity, the Canadian economy has been remarkably strong, growing at a pace well above that of all other Group of Seven (G7) countries since mid-2016 (Chart A1.1). Since November 2015, Canadians have created almost 600,000 new jobs and the unemployment rate has fallen from 7.1 per cent to 5.9 per cent—close to its lowest level in over four decades.
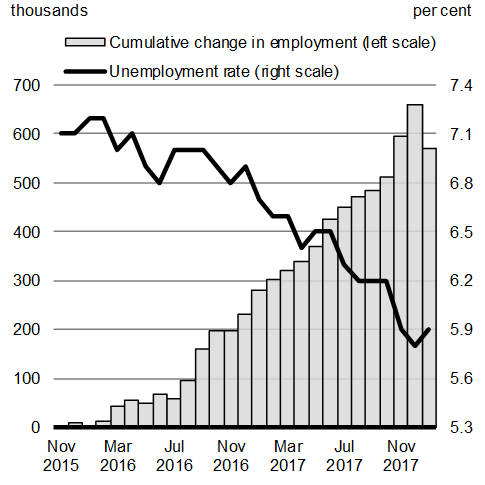
Source: Statistics Canada.
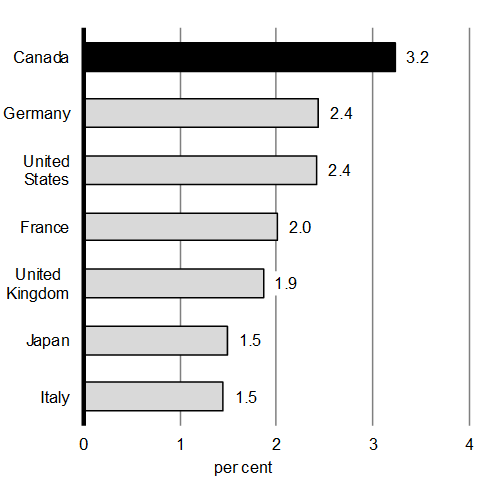
Source: Haver Analytics.
Canada’s strong economic growth over this period has been driven by growth in consumer spending, strong regional housing markets as well as supportive monetary and fiscal policy, including the Canada Child Benefit and significant investments in infrastructure. At the same time, stronger global economic conditions have contributed to a recovery in business investment and higher exports. Growth is being shared more broadly across sectors and regions of the country.
Going forward, Canadian economic growth is expected to continue at a more sustainable pace, reflecting in part the combination of higher interest rates and the waning impacts of recent fiscal policy measures. While the level of economic activity is expected to remain strong, growth is anticipated to moderate with little remaining slack in the economy. This is readily apparent in very strong labour market conditions, most notably an unemployment rate that is near a four-decade low, high rates of labour market participation and strengthening wage growth.
Canadian Economic Developments
Unemployment Rate Near its Lowest Level in Four Decades
The economy added 427,300 jobs in 2017, leading the unemployment rate to fall to 5.8 per cent in December 2017—a four-decade low. As of January of this year, it remains near this low level.
The pace of job creation in 2017—an average of 35,600 jobs per month, most of which were full-time positions—was the fastest since 2002 (Chart A1.2). According to the Bank of Canada’s Business Outlook Survey, the share of firms facing more intense labour shortages compared to one year ago is near its highest level in over a decade. This tightening in the labour market bodes well for future wage growth, which picked up in 2017. Consistent with strong employment gains, a sharply lower unemployment rate and an economy that is estimated to be operating close to its potential, year-over-year growth in average weekly earnings has accelerated sharply from no growth in 2016 to 2.8 per cent currently.
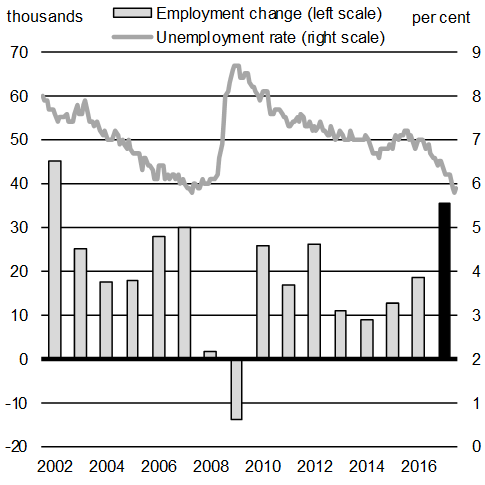
Source: Statistics Canada, Labour Force Survey (LFS).
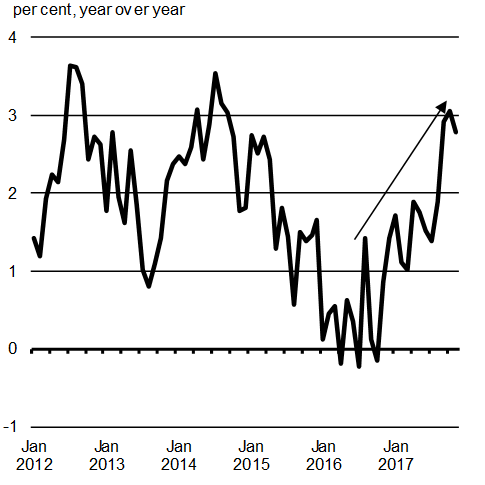
Source: Statistics Canada, Survey of Employment, Payroll and Hours (SEPH).
Earnings and Confidence Are Expected to Continue to Underpin Growth
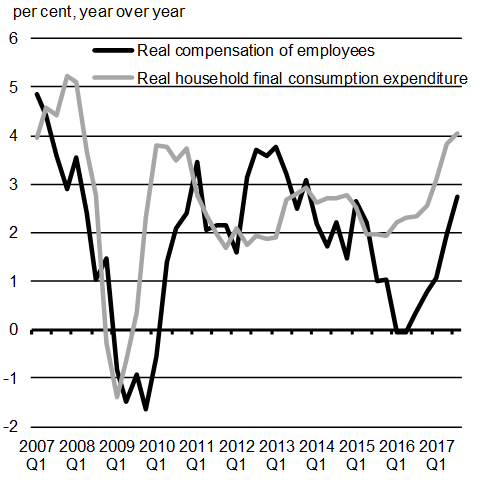
Since mid-2016, household consumption has been the main driver of economic growth, increasing at an average annualized pace of 3.9 per cent per quarter (Chart A1.3). Growth has been fairly broad-based across consumption categories and regions. This includes solid growth in most oil producing provinces, notably Alberta, where a recovery in employment is underway.
Going forward, continued growth in employment earnings and improved consumer confidence are expected to continue to underpin solid consumption growth. However, the pace of growth is expected to moderate to its potential or trend rate.
Sources: Statistics Canada; Department of Finance Canada calculations.
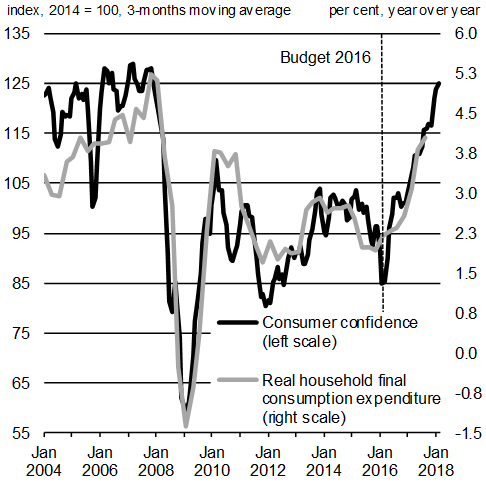
Sources: Statistics Canada; The Conference Board of Canada.
Labour Market Slack Remains in Some Provincial Economies
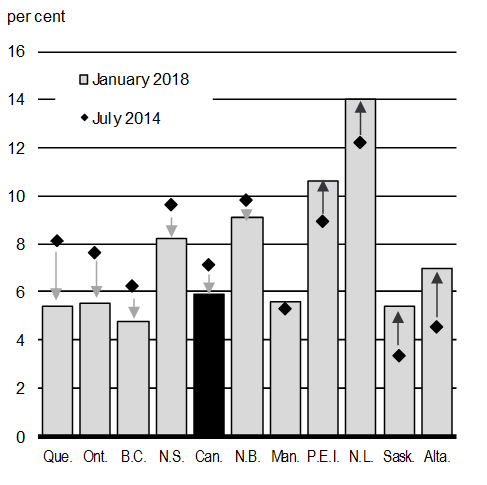
Particularly strong economic activity in British Columbia, Ontario and Quebec has resulted in historically low unemployment rates for these provinces. In contrast, unemployment rates in the oil-producing provinces, while generally falling, remain significantly higher than prior to the oil price shock in 2014 (Chart A1.4).
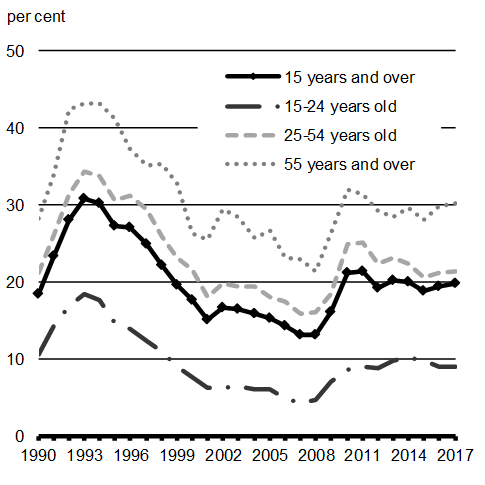
As well, despite the national unemployment rate being near a four-decade low, long-term unemployment1 as a share of total unemployment remains above pre-recession levels for all age groups (although the rate for individuals between 25 and 54 has improved).
Source: Statistics Canada.
Recent Indicators Point to Ongoing Business Investment Gains
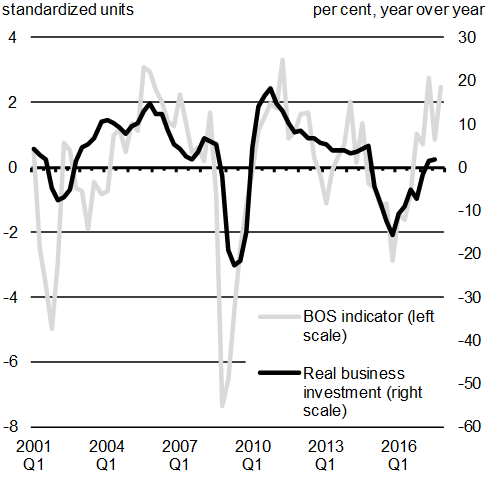
Business investment is growing again. The pick-up has been underpinned by stronger economic activity in both the resource and non-resource sectors and much-improved business sentiment. The Bank of Canada’s Business Outlook Survey shows a strong improvement in business investment intentions over the last year (Chart A1.5).
Plans to increase investment are now broad-based across all regions and sectors. Respondents to the Bank of Canada’s survey report favourable demand conditions and, together with higher capacity pressures, plans to expand capacity.
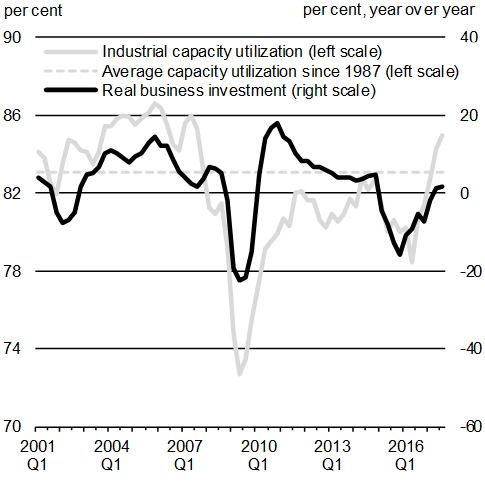
Capacity utilization has also risen sharply and is currently close to its pre-recession peak. In the Business Outlook Survey, the share of firms reporting that they would have some or significant difficulty meeting an unanticipated increase in demand has risen. However, the degree of slack continues to differ across regions, with pressures being the most acute in British Columbia and becoming more apparent in central Canada. In contrast, excess capacity remains in energy-producing regions. Together with improved business investment intentions, this points to a further recovery in business investment going forward.
Sources: Statistics Canada; Bank of Canada; Department of Finance Canada calculations.
Sources: Statistics Canada; Department of Finance Canada calculations.
Export Growth Is Anticipated to Rise
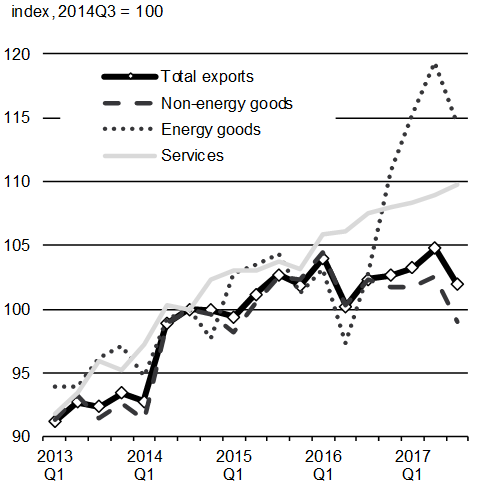
Total real exports have risen modestly since mid-2014, as solid growth in exports of services and energy commodities has been offset by weakness in non-energy goods exports (Chart A1.6).
In particular, export growth has been lower than might have been expected given the significant depreciation in the Canadian dollar since mid-2014. That being said, it is important to recognize that the currencies of many other important U.S. trading partners—with whom Canada competes in the U.S. and other international markets—have also depreciated since 2014.
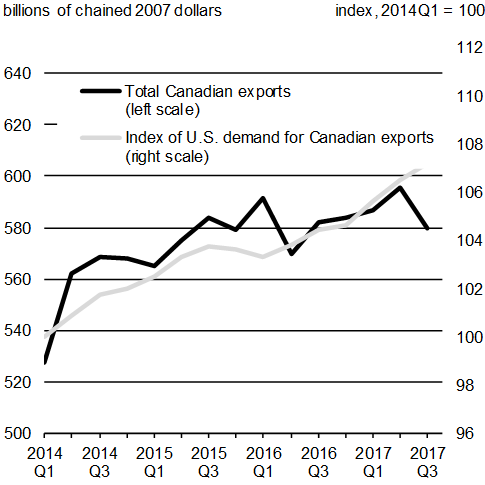
Going forward, export growth is expected to grow in line with foreign demand. The positive global growth backdrop is expected to boost demand for Canadian exports.
Sources: Statistics Canada; Department of Finance Canada calculations.
Sources: Statistics Canada; U.S. Bureau of Economic Analysis; Department of Finance Canada calculations.
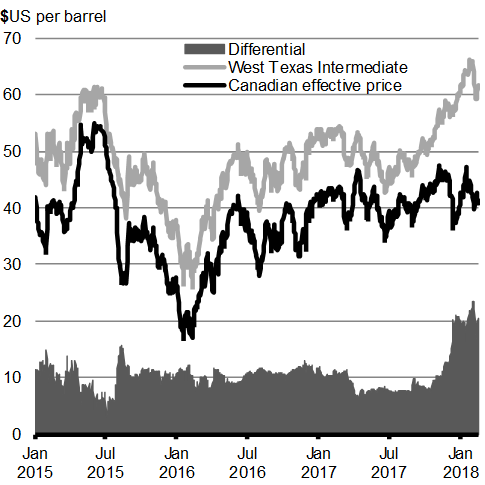
Crude Oil Prices Have Increased, but the Discount on Canadian Oil Has Also Risen
Global crude oil prices continued to increase in 2017, with the price of West Texas Intermediate (WTI) crude oil averaging just under US$51 per barrel, compared with an average of US$43 per barrel in 2016 (Chart A1.7). Prices were supported by stronger global demand and a supply agreement between Organization of the Petroleum Exporting Countries (OPEC) nations and 10 non-OPEC producers to restrain their collective output. As a result, in January WTI prices rose as high as US$66 per barrel for the first time since December 2014, before declining slightly in February.
Increasing U.S. production, driven by growth in the shale oil sector, has put a limit on price increases. U.S. crude oil production increased steadily through 2017, reaching its highest level in more than three decades. The U.S. Energy Information Administration estimates that U.S. crude oil production will increase further this year, reaching a historical high of 10 million barrels per day. Observers have noted that should the U.S. exceed these production levels, it could potentially overtake Saudi Arabia and Russia to become the world’s top crude oil producer.
The recent rise in global benchmark prices has not been matched by higher prices for Western Canadian producers. While Canadian production has continued to rise, reflecting past investments, pipeline capacity constraints have limited producers’ options for moving their products to U.S. markets. As a result, the discount on the Canadian effective price vis-à-vis WTI has risen to over US$20 to date in early 2018, more than double its 2017 average (US$9.61).
Looking ahead, crude oil futures prices continue to suggest that the benchmark WTI oil price will ease from current levels back to the US$50 range over the forecast horizon. Private sector economists surveyed by the Department of Finance Canada currently project that WTI prices will improve modestly over time to US$62 per barrel by 2022. These private sector projections are broadly on par with those in the 2017 Fall Economic Statement.
Sources: Commodity Research Bureau; Bloomberg; Department of Finance Canada calculations.
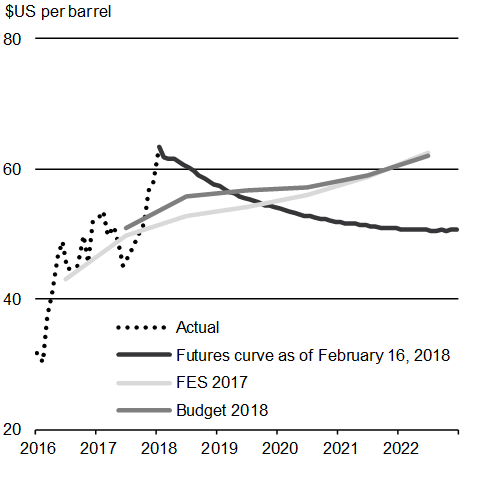
Sources: Commodity Research Bureau; Department of Finance Canada September 2017 and December 2017 surveys of private sector economists.
Starting in 2017, Western Canadian crude oil supply was projected to outstrip the combined capacity of existing pipelines and the region’s refining capacity (Chart A1.8). This means that the industry is now having to rely on higher-cost rail to transport a growing share of supply until additional pipeline capacity comes on stream.
Further, with very little spare capacity, the impact of unexpected pipeline or refinery shutdowns (such as the recent temporary shutdown of the TransCanada Keystone pipeline) could become larger, resulting in increased volatility in prices for Canadian producers. This situation is expected to prevail into 2020 until major pipeline projects—such as the Trans Mountain Expansion Project, the TransCanada Keystone XL pipeline and the replacement of Enbridge’s Line 3—become operational, diversifying our export markets and providing additional capacity.
The discount on the Canadian effective price (CEP) vis-à-vis WTI has risen to over US$20, more than double its 2017 average (US$9.61). Futures contracts currently suggest that the differential between WTI and the CEP will narrow to the US$15 range by the summer, in line with a return to full capacity of the TransCanada Keystone pipeline and as rail transport adjusts to higher volumes, and to remain at this level on average over the 2018–2022 forecast horizon.
Western Canada Oil Supply Versus Transportation and Refining Capacity
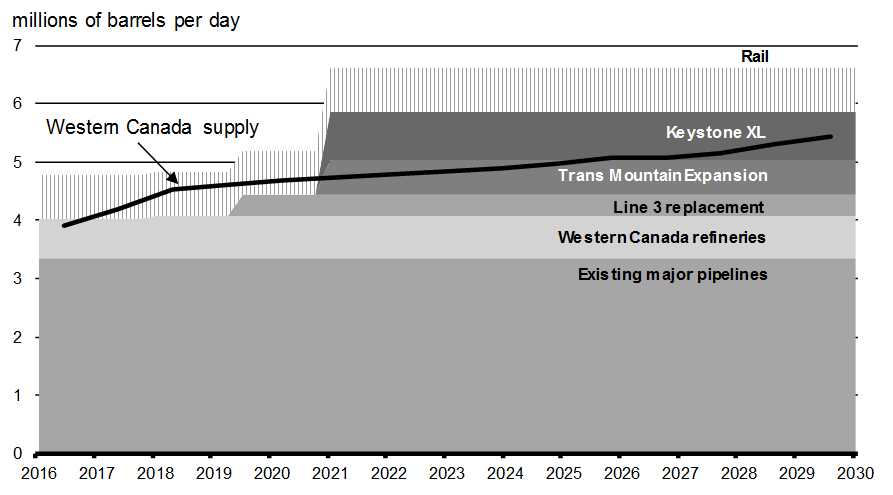
Sources: Canadian Association of Petroleum Producers; company statements; Department of Finance Canada calculations.
Housing Market Pressures Easing
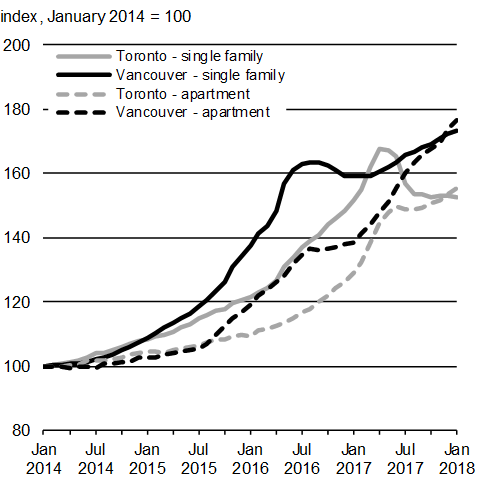
Following rapid growth in prices and sales in recent years, housing market conditions have become more balanced in Toronto and Vancouver, and their surrounding regions.
While price gains for all dwelling types have been robust in these markets over the past few years, price growth of single-detached homes has slowed recently. Price growth for other dwelling types—notably apartment condominiums—has remained strong. Tight supply conditions in these markets remain an important factor affecting prices. Meanwhile, housing activity in the oil-producing provinces had been soft but has picked up in recent months, while activity in the rest of the country remains positive (Chart A1.9).
Going forward, housing demand across the country should continue to be supported by solid job and income gains, but tempered by rising interest rates and recent changes to mortgage underwriting Guideline B-20 for federally regulated lenders (including a mortgage rate stress test for uninsured mortgages).
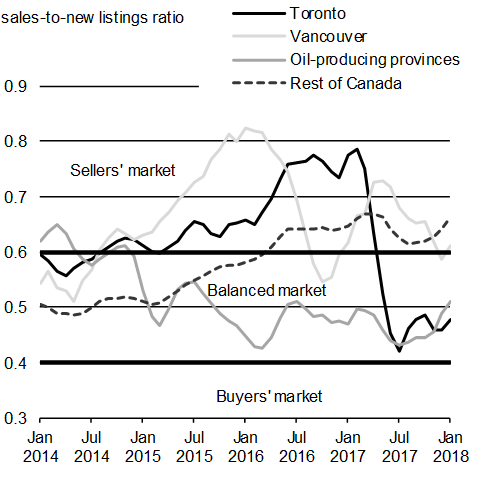
Sources: Canadian Real Estate Association; Department of Finance Canada calculations.
Sources: Canadian Real Estate Association; Department of Finance Canada calculations.
Global Economic Developments
Global Economic Activity Is Firming
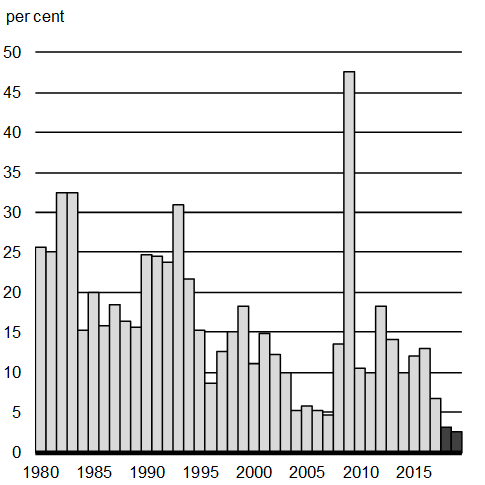
Internationally, economic momentum continues to strengthen. Following two consecutive years of deceleration, global growth finally accelerated in 2017, and was highly synchronized across regions with almost every part of the world registering growth. Building on this momentum, the pace of global economic expansion is expected to pick up further in 2018. In addition, the share of countries in recession is projected to decline to a record low (Chart A1.10).
However, the acceleration in global economic activity is expected to be somewhat constrained. While economic activity in emerging economies as a whole is expected to strengthen this year and next, most advanced economies are already growing faster than their estimated potential or trend growth rates, and thus as a group are not expected to accelerate further.
Source: IMF, January 2018 WEO Update and October 2017 WEO.
Global Financial Conditions Remain Supportive Despite a Recent Pullback in Equities
Monetary policy continues to be very accommodative, with the policy interest rates of most major central banks remaining low and some central banks continuing to deploy extraordinary monetary policy measures to support economic growth, close output gaps and help revive inflation.
Equity markets, which rose over much of the past two years, have recently seen declines accompanied by a surge in volatility. While sudden, these declines brought most indices back to where they were late last fall. Moreover, the factors that have supported markets for most of the past year remain largely in place, including an improving global economic backdrop, rising expectations for corporate profits, still highly accommodative monetary policy, and investors’ continued search for yield.
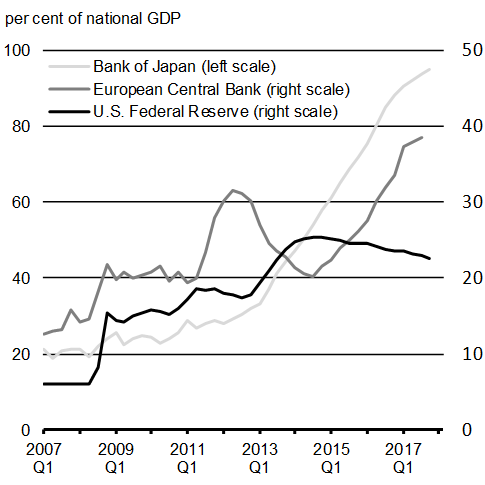
Improving economic momentum is leading a number of central banks—most notably the U.S. Federal Reserve—to gradually increase their policy interest rates and reduce their extraordinary measures (Chart A1.11). In this context, some longer-term interest rates have risen modestly, though they remain near historic lows. As central banks continue to normalize monetary policy, interest rates are expected to continue to gradually rise.
Source: Haver Analytics.
Source: Haver Analytics.
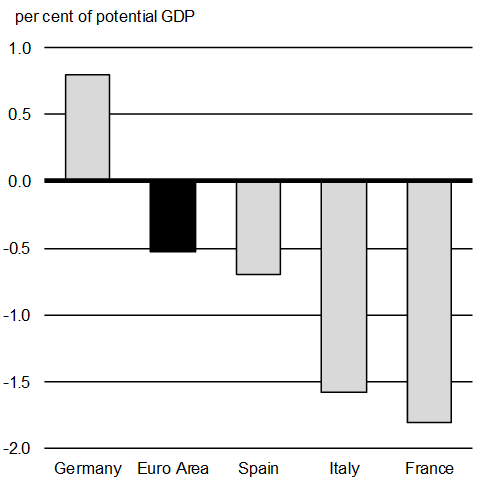
The U.S. Economy Is Operating at Potential
In the United States, the long recovery from the effects of the Great Recession appears to be complete. The U.S. economy has been operating near or even slightly above its potential in recent years, after almost a decade of running below its long-term trend level (Chart A1.12).
Alongside strong output growth, the U.S. labour market continues to strengthen, with solid job creation and steady gains in the employment rate of the 25 to 54 age group. The unemployment rate, at 4.1 per cent since October 2017, is at its lowest level since 2001. However, average hourly wages grew 2.5 per cent in 2017, broadly the same increase as in 2016. While wage growth has gradually trended higher since the end of the recession, the progression of both monthly and annual gains has been uneven.
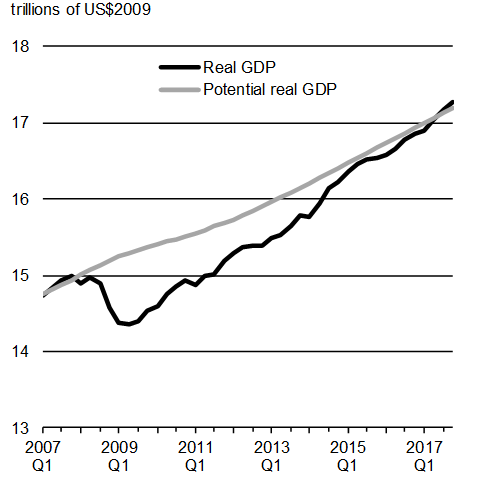
Sources: U.S. Bureau of Economic Analysis; Congressional Budget Office.
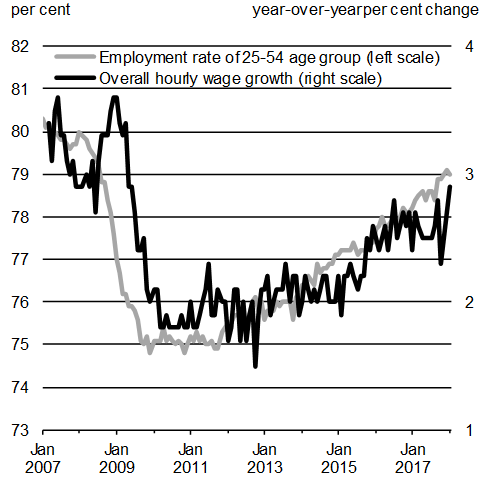
Source: U.S. Bureau of Labor Statistics.
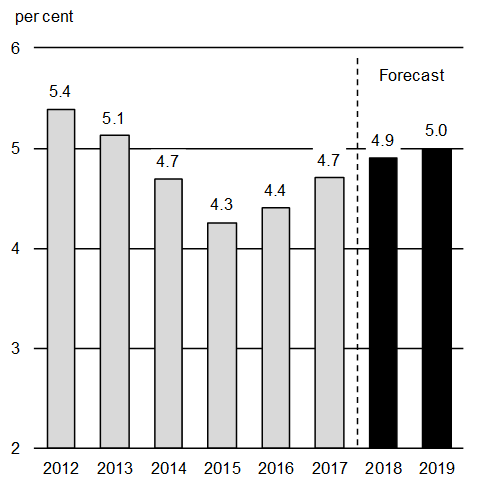
Looking forward, the U.S. economy could see improved growth in 2018. However, the U.S. federal government deficit is projected to grow to over one trillion dollars next year, or about 5 per cent of GDP. Over the coming months, the Department of Finance Canada will conduct detailed analysis of the U.S. federal tax reforms to assess any potential impacts on Canada.
European Economies Surprised on the Upside in 2017
Economic growth has also accelerated across the euro area, increasing from 1.8 per cent in 2016 to an estimated 2.5 per cent in 2017. This is more than two times faster than the estimated potential growth rate of about 1 per cent for the euro area as a whole. Further, high-frequency indicators suggest a continuation of strong growth in early 2018 (Chart A1.13), and the IMF expects the pace of euro area growth to remain fairly elevated, at 2.2 per cent this year. This should result in the continued absorption of remaining economic spare capacity across euro area countries.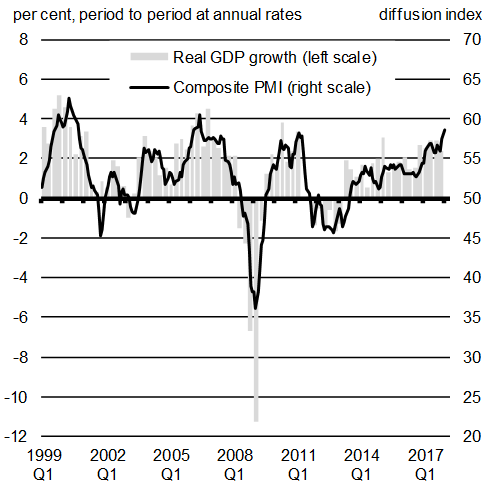
Sources: IHS Markit; Haver Analytics.
In the United Kingdom, growth slipped from 1.9 per cent in 2016 to 1.8 per cent last year, and is expected to continue to gradually slow over the near term. Weak consumer confidence and business investment, along with uncertainty related to the UK’s future trade relationship with the European Union (EU), should weigh on UK growth.
Canada is well placed to benefit from the steady economic activity in Europe. The Comprehensive Economic and Trade Agreement (CETA), which entered into force on September 21, 2017, eliminates virtually all tariffs on goods between Canada and the EU. The agreement gives Canadian exporters new access to one of the world’s largest single markets—at $21.8 trillion, the EU represents 22 per cent of global GDP, with half a billion consumers.
Strong Growth in China and Emerging Economies
Among the major emerging economies, overall growth firmed in 2017. This was largely due to recessions ending in Brazil and Russia, rather than a marked acceleration of growth in other emerging nations.
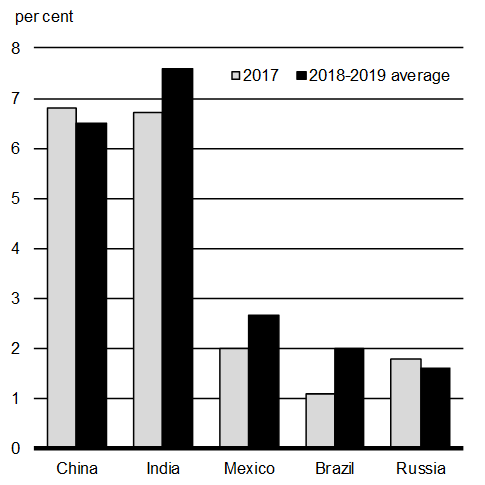
Nonetheless, growth among emerging economies is expected to continue to increase in 2018, mainly reflecting a pick-up in growth in Latin America and the Middle East, in part attributable to firmer commodity prices. In addition, a rising rate of economic expansion in India will further support the overall rate of growth in emerging economies (Chart A1.14).
However, a number of emerging economies remain vulnerable to sudden shifts in capital flows that could be triggered by an unexpected sharp appreciation of the U.S. dollar or a global repricing of risk. This is particularly true for countries with significant amounts of U.S.-dollar-denominated debt.
In China, growth is expected to continue to gradually slow in 2018 and beyond. However, China will continue to grow faster than most other countries, and faster than expected one year ago. Economic activity is expected to be supported by stronger external demand, and economic reforms and deleveraging are taking place very gradually to reduce the risk of an abrupt growth slowdown.
Source: IMF, January 2018 WEO Update.
Canada has gained important new market access into the fast-growing Asia-Pacific region. On January 23, 2018, Canada was among the eleven countries that successfully concluded negotiations on the Comprehensive and Progressive Agreement for Trans-Pacific Partnership (CPTPP). This agreement will provide access to markets totalling $11.5 trillion, representing 12 per cent of the global economy and over 450 million consumers. This includes key markets such as Japan, Malaysia and Vietnam—representing $9.7 trillion in GDP—with which Canada has no existing preferential trading relationship. Nearly 87 per cent of tariffs faced by Canadian exporters will be eliminated upon the entry into force of the CPTPP, with most remaining tariffs to be eliminated within 15 years.
Budget 2018 Economic Outlook
The economic and fiscal projections contained in this budget are based on the December 2017 survey of private sector economists. Details of the full private sector economic outlook are presented in Annex 2.
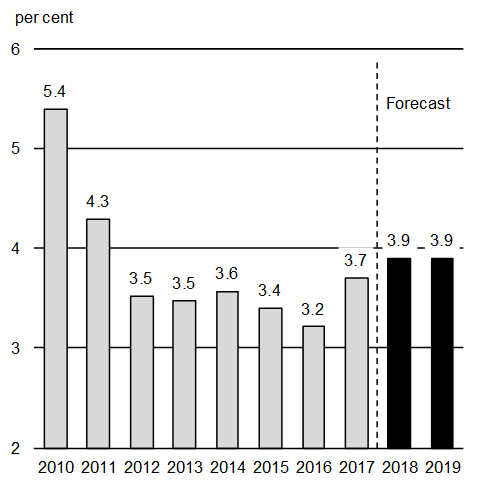
In summary, economists expect real GDP growth of 3.0 per cent in 2017, the same rate as in the 2017 Fall Economic Statement but significantly higher than the 2.1 per cent originally projected in Budget 2017. The outlook for real GDP growth is slightly improved for 2018 but little changed thereafter (Table A1.1). The outlook for GDP inflation (the broadest measure of economy-wide price inflation) has been revised down in both 2017 and 2018 compared to the 2017 Fall Economic Statement forecast. Going forward, the outlook for GDP inflation is broadly in line with the previous forecast.
As a result, expectations for growth in nominal GDP—the broadest measure of the tax base—have been revised down for 2017 (from 5.5 per cent to 5.2 per cent), but are largely unchanged thereafter. The level of nominal GDP over the projection horizon is $4 billion lower per year, on average, than was anticipated in the 2017 Fall Economic Statement, but still more than $20 billion higher than projected in Budget 2017.
| 2017 | 2018 | 2019 | 2020 | 2021 | 2022 | 2017– 2022 |
|
|---|---|---|---|---|---|---|---|
| Real GDP growth | |||||||
| Budget 20171 | 2.1 | 2.0 | 1.7 | 1.7 | 1.8 | – | – |
| 2017 Fall Economic Statement1 | 3.0 | 2.1 | 1.6 | 1.7 | 1.7 | 1.8 | 2.0 |
| Budget 2018 | 3.0 | 2.2 | 1.6 | 1.7 | 1.6 | 1.8 | 2.0 |
| GDP inflation | |||||||
| Budget 20171 | 2.2 | 2.0 | 1.8 | 2.1 | 2.0 | – | – |
| 2017 Fall Economic Statement1 | 2.4 | 1.9 | 1.8 | 2.0 | 1.9 | 1.9 | 2.0 |
| Budget 2018 | 2.2 | 1.8 | 1.9 | 2.0 | 2.0 | 1.9 | 2.0 |
| Nominal GDP growth | |||||||
| Budget 20171 | 4.3 | 4.0 | 3.5 | 3.8 | 3.8 | – | – |
| 2017 Fall Economic Statement1 | 5.5 | 4.1 | 3.4 | 3.7 | 3.6 | 3.8 | 4.0 |
| Budget 2018 | 5.2 | 4.0 | 3.5 | 3.8 | 3.6 | 3.8 | 4.0 |
| Nominal GDP level (billions of dollars) |
|||||||
| Budget 20171 | 2,120 | 2,205 | 2,282 | 2,369 | 2,459 | – | – |
| 2017 Fall Economic Statement1 | 2,146 | 2,234 | 2,311 | 2,397 | 2,483 | 2,577 | |
| Budget 2018 | 2,142 | 2,228 | 2,306 | 2,394 | 2,481 | 2,575 | |
| Difference between Budget 2017 and Budget 2018 | 22 | 23 | 24 | 25 | 22 | – | – |
| Difference between 2017 Fall Economic Statement and Budget 2018 | -5 | -6 | -5 | -3 | -2 | -2 | -4 |
Risk Assessment
While the global and Canadian economies have evolved largely as expected since the Fall Economic Statement, both upside and downside risks remain which could affect the economic outlook. In particular:
- Stronger and more durable growth in the global economy than currently expected would benefit Canadian economic activity.
- Household spending and business investment in Canada could continue to surprise on the upside given elevated business and consumer confidence, tightened business capacity and labour market conditions, and rising wage growth.
- As global oil markets continue to move closer to balance, oil prices could be higher than expected in the medium term. Higher-than-expected demand for oil with more significant supply constraints in the future, reflecting recent cuts in global oil and gas investment, could tip the balance towards higher oil prices, benefitting income and investment in Canada. However, a persistent or widening gap between Western Texas Intermediate and Western Canada Select crude oil prices could partially erode this benefit.
At the same time, there are a number of downside risks to the outlook.
- Uncertainty regarding the outcome of North American Free Trade Agreement negotiations as well as a notable shift towards more protectionism globally could impact Canada.
- As some advanced economy central banks, such as the U.S. Federal Reserve, continue to normalize monetary policy, financial conditions could tighten faster than anticipated, especially as they have remained surprisingly favourable over the past year. Tighter-than-expected financial conditions could create turbulence in world financial markets, especially in the context of elevated market valuations, although the recent pullback in global markets has relieved some pressure. This would affect Canadian businesses and households through a combination of higher interest rates, negative wealth effects and/or lower confidence.
- High household debt remains a key domestic vulnerability for Canadian consumption and housing activity in the case of a large shock to income, house prices or interest rates.
Overall, the risks to the December 2017 economic outlook are broadly balanced in the short term, and continuing engagement with survey participants has confirmed that the outlook is an appropriate basis for fiscal planning. Budget 2018 includes an adjustment for risk of $3.0 billion in 2018–19 and future years to account for risks and uncertainty in the economic and fiscal forecast.
Budget 2018 Fiscal Outlook
Baseline economic and year-to-date developments since the 2017 Fall Economic Statement (FES 2017) have improved the outlook for the budgetary balance over the forecast horizon, by an average of approximately $3.3 billion per year. A detailed summary of changes to the fiscal outlook since FES 2017 is provided in Annex 2.
Continued Investments in a Strong Middle Class
Budget 2018 builds on the Government’s previous actions, and proposes smart, targeted investments that will help create the conditions required to foster economic growth and provide more opportunities for the middle class. The fiscal implications of developments since FES 2017, including the costs of Budget 2018 proposals, are shown in Table A1.2 below.
| Projection | ||||||
|---|---|---|---|---|---|---|
| 2017– 2018 |
2018– 2019 |
2019– 2020 |
2020– 2021 |
2021– 2022 |
2022– 2023 |
|
| FES 2017 budgetary balance | -19.9 | -18.6 | -17.3 | -16.8 | -13.9 | -12.5 |
| Adjustment for risk from FES 2017 | 1.5 | 3.0 | 3.0 | 3.0 | 3.0 | 3.0 |
| FES 2017 budgetary balance (without risk adjustment) |
-18.4 | -15.6 | -14.3 | -13.8 | -10.9 | -9.5 |
| Economic and fiscal developments since FES 2017 | 3.0 | 3.6 | 4.1 | 3.5 | 2.8 | 2.8 |
| Revised budgetary balance before policy actions and investments | -15.4 | -12.0 | -10.3 | -10.3 | -8.1 | -6.7 |
| Policy actions since FES 2017 | 2.4 | 2.2 | -1.7 | -1.6 | -0.5 | 0.3 |
| Investments in Budget 2018 | ||||||
| Growth | 0.0 | 0.3 | -0.1 | 0.3 | 0.2 | 0.3 |
| Progress | 0.0 | -0.9 | -1.2 | -1.4 | -1.4 | -1.6 |
| Reconciliation | -0.1 | -1.4 | -1.2 | -0.8 | -0.7 | -0.6 |
| Advancement | -4.2 | -1.8 | -1.3 | -1.3 | -1.2 | -0.6 |
| Other Budget 2018 investments | -2.1 | -1.6 | 1.1 | 1.1 | 0.9 | -0.4 |
| Total investments in Budget 2018 | -6.3 | -5.4 | -2.6 | -2.0 | -2.2 | -3.0 |
| Total policy actions and investments | -4.0 | -3.1 | -4.3 | -3.6 | -2.7 | -2.6 |
| Budgetary balance | -19.4 | -15.1 | -14.5 | -13.9 | -10.8 | -9.3 |
| Adjustment for risk | -3.0 | -3.0 | -3.0 | -3.0 | -3.0 | |
| Final budgetary balance (with risk adjustment) |
-19.4 | -18.1 | -17.5 | -16.9 | -13.8 | -12.3 |
| Federal debt (per cent of GDP) | 30.4 | 30.1 | 29.8 | 29.4 | 28.9 | 28.4 |
A Downward Deficit and Debt Ratio Track
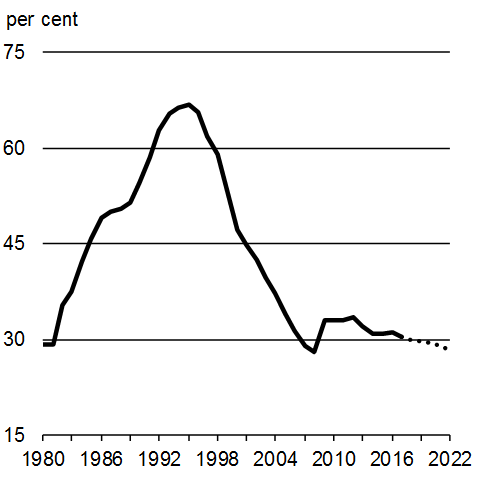
Growth-generating investments in people, in communities and in the economy are balanced by sound fiscal management. The federal debt-to-GDP ratio is projected to decline gradually over the forecast horizon, reaching 28.4 per cent in 2022–23. According to the IMF, Canada’s net debt-to-GDP ratio is by far the lowest among G7 countries and less than half the G7 average (Chart A1.15).
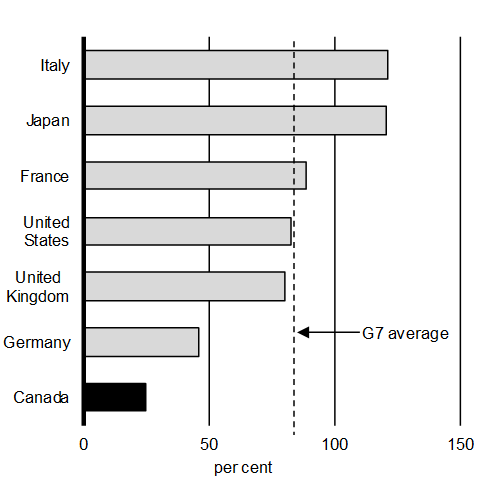
Source: IMF, October 2017 Fiscal Monitor.
The Budget 2018 fiscal track continues to show steady improvements in the Government’s annual budgetary balance, which is nearly $7 billion lower annually, on average, than projected in Budget 2017.
Budgetary Balance
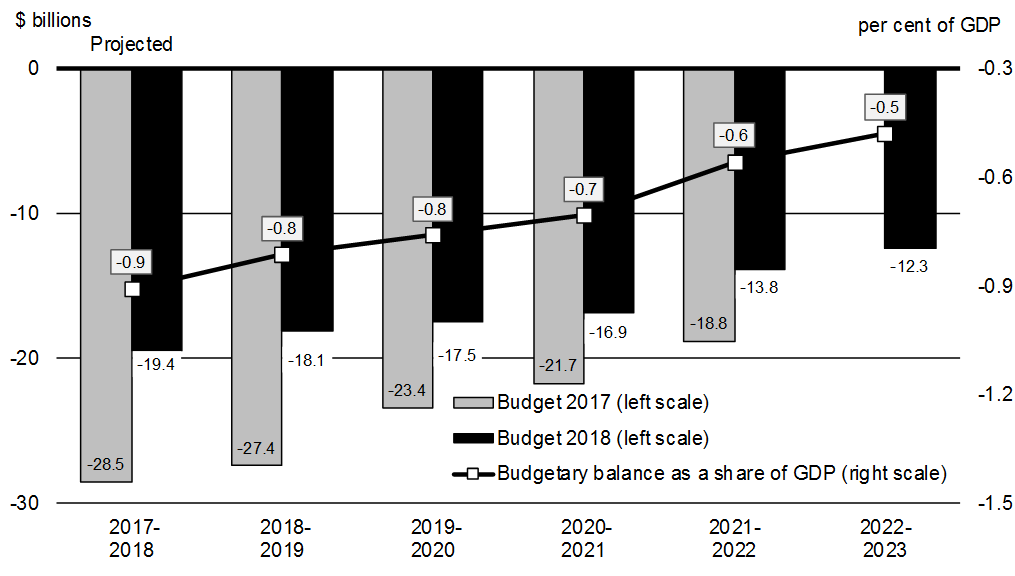
The Government will maintain this downward deficit and debt ratio track. Low debt levels support economic growth and intergenerational equity by keeping interest costs low and preserving flexibility to face future economic shocks and challenges.
Continued Economic Strength Would Accelerate Deficit Reduction
The fiscal projections presented in this budgetare based on an average of the December 2017 private sector economic outlook survey. However, economists surveyed offered a wide range of views regarding future economic growth and, therefore, the path of nominal GDP (the broadest measure of the tax base). Changes in economic growth assumptions can also have large impacts on the budgetary balance and debt-to-GDP profile over an extended projection horizon.
For example, if the Government based current fiscal projections on the average of the top four individual forecasts for nominal GDP growth—which is equivalent to nominal GDP growth being 0.3 percentage points per year higher, on average, than in the full survey—the budgetary balance would improve by $3.0 billion per year on average (Chart A1.17).
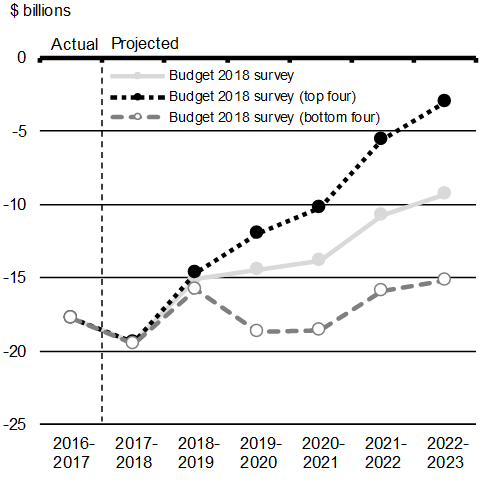
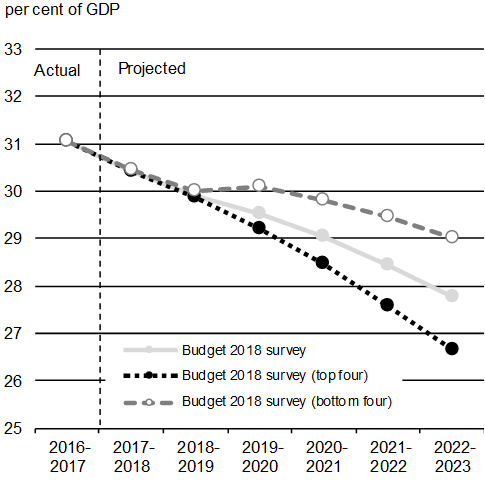
Conversely, basing fiscal projections on the average of the bottom four individual forecasts for nominal GDP growth—which is equivalent to nominal GDP growth being 0.3 percentage points per year lower, on average, than in the full survey—the budgetary balance would worsen by $3.5 billion per year on average, and the federal debt-to-GDP ratio would still decline, but be 1.2 percentage points higher than projected in 2022–23.
1 Unemployed for 27 weeks or more.
- Date modified: