Archived information
Archived information is provided for reference, research or recordkeeping purposes. It is not subject to the Government of Canada Web Standards and has not been altered or updated since it was archived. Please contact us to request a format other than those available.
Chapter 2 - Economic Developments and Prospects
Highlights
- The Canadian economy has experienced one of the best performances among the Group of Seven (G-7) countries over the recovery.
- Over 1.2 million more Canadians are working now than at the end of the recession, one of the strongest job performances among G-7 countries over this period.
- Since mid-2014, weak global growth, combined with continued steady increases in oil supply, has led to significant declines in world crude oil prices.
- This is affecting Canada, which is a producer and net exporter of crude oil.
- However, the Canadian economy is resilient: real gross domestic product (GDP) is expected to grow at a pace of about 2 per cent in both 2015 and 2016.
- Moreover, actions taken by the Government in the fall of 2014 and in Economic Action Plan 2015 will provide almost $10 billion of support to the Canadian economy this fiscal year, starting in the second quarter of 2015.
- Risks to the Canadian economic outlook remain largely external, stemming from the uncertainty surrounding both the future path of oil prices and global growth.
Notes: This chapter incorporates data available up to and including April 17, 2015, unless otherwise indicated. All rates are reported at annual rates unless otherwise noted.
Introduction
The Canadian economy continues to grow, in the context of a global recovery that remains fragile. The global economy continued to expand at a modest pace in 2014, reflecting relatively weak growth in the euro area and Japan and moderating growth in China. The U.S. remains a bright spot in the global economy, showing encouraging signs of stronger momentum.
Crude oil prices have declined sharply since mid-2014, largely reflecting increased supply. While this will be generally positive for global growth, it is expected to be largely offset by ongoing underlying weakness in economic momentum. As a result, global economic growth is expected to remain modest again in 2015.
For Canada, as a producer and net exporter of crude oil, lower oil prices have led to a significant downward revision to the outlook for economy-wide prices and therefore, nominal GDP. Despite the sharply lower oil prices, economic growth is expected to be resilient, with real GDP expected to grow by 2.0 per cent in 2015 and 2.2 per cent in 2016.
This chapter reviews major global and Canadian economic developments over the past year, presents the March 2015 average private sector economic forecast that forms the basis for the fiscal projections presented in Economic Action Plan 2015, and discusses the risks and uncertainties surrounding this economic forecast.
Global Economic Developments
and Outlook
The global economy expanded at a modest rate in 2014. This softness reflected very modest growth in the euro area, a continuing downshift in Chinese growth, and either contraction or stagnation for much of the year in Japan, Russia and Brazil. The U.S. economy, however, has shown signs of strengthening, which is an encouraging sign for Canada, as the United States is Canada's largest export market.
In the context of ongoing modest global growth, a key development has been the decline in crude oil prices of about 50 per cent since mid-2014. As most countries are net importers of oil, this should support global growth in 2015 through lower energy costs and hence real income gains for households and firms. However, underlying economic weakness is expected to persist in a number of economies, leading to only a modest expected pickup in global growth in 2015 (Chart 2.1).
Europe
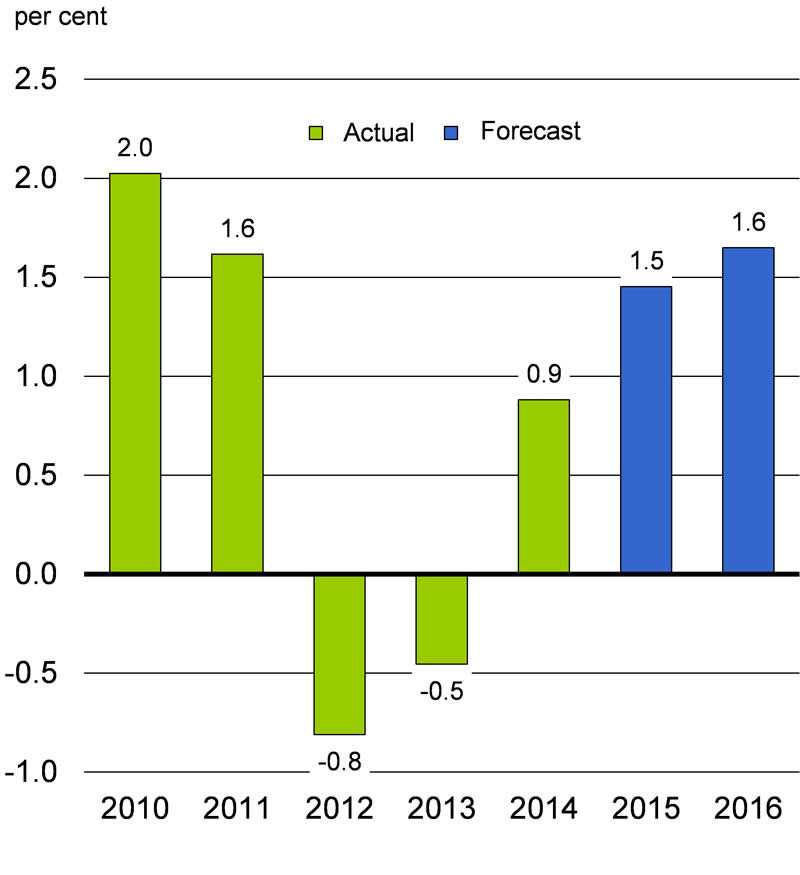
Despite an expected improvement in its near-term outlook, the euro area continues to face risks of stagnation and prolonged low inflation. Following a year-and-a-half-long recession that ended in mid-2013, economic growth turned positive but remained modest, at just 0.9 per cent in 2014 (Chart 2.2). Inflation continued to slow throughout last year and the most recent data showed a fourth consecutive monthly fall in consumer prices in March 2015. Further, while core inflation remains positive, it has also drifted well below 1 per cent, raising the risk of deflation.
Source: Haver Analytics.
In response to the weak economic recovery and low and declining inflation, the European Central Bank (ECB) has introduced several monetary easing measures in recent months. In particular, the ECB expanded the asset purchase program it introduced last September to include sovereign, agency and European institution securities in an effort to reduce longer-term interest rates, increase business and consumer confidence, and in turn encourage greater lending and investment. Expectations of lower long-term interest rates have also contributed to the depreciation of the euro in recent months, which should support European export competitiveness. Asset purchases by the ECB are being made at a rate of €;60 billion per month from March 2015 to at least September 2016 for a total of €;1.1 trillion (or about 10 per cent of GDP), comparable in size to the most recent asset purchase program by the U.S. Federal Reserve that ran from September 2012 to October 2014.
Overall, the IMF expects real GDP growth in the euro area to pick up to 1.5 per cent in 2015 and 1.6 per cent in 2016 as the impacts of recent monetary policy easing, lower oil prices and the recent depreciation of the euro feed through the economy.
In the United Kingdom, stronger private domestic demand contributed to a pickup in economic growth to 2.8 per cent in 2014 from 1.7 per cent in 2013. The IMF expects that growth will remain at around this pace this year before slowing somewhat to 2.3 per cent in 2016.
Japan
In Japan, economic growth exhibited large swings during 2014, in large part reflecting the impacts of recent policy changes. In particular, real GDP contracted in the second and third quarters of 2014 following the April 2014 consumption tax increase before rebounding to 1.5 per cent in the fourth quarter. Overall, the economy recorded no growth in 2014 following an increase of 1.6 per cent in 2013.
The IMF projects that Japanese economic growth will only improve modestly to 1.0 per cent in 2015 and 1.2 per cent in 2016, in spite of the expected positive impacts of recent monetary policy easing, lower oil prices and exchange rate depreciation.
Emerging Economies
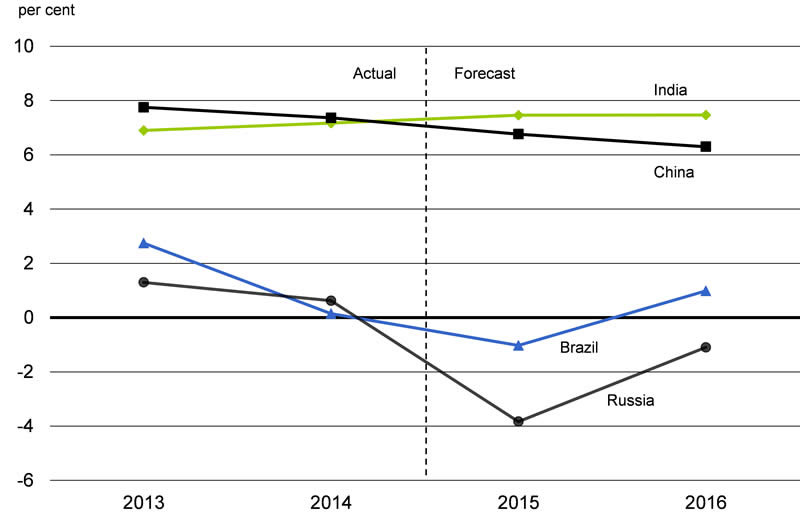
Growth in emerging economies eased in 2014, driven by negative developments in a number of large economies. In particular, growth in China slowed, Brazil's economy stagnated and the Russian economy is now likely in recession. This was partly offset by an acceleration of the pace of expansion in India (Chart 2.3). Looking ahead, the IMF expects overall growth in emerging economies to be 4.3 per cent this year, slightly lower than its 2014 pace, before picking up to 4.7 per cent in 2016.
Source: IMF, April 2015 World Economic Outlook.
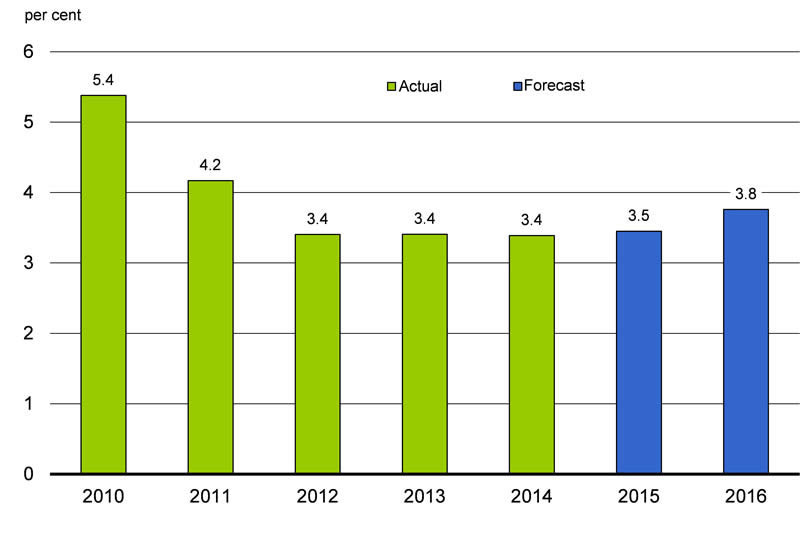
In China, real GDP growth eased to 7.4 per cent in 2014 from 7.8 per cent in 2013, compared with growth of about 9 per cent on average over the previous five years. In the first quarter of 2015, growth continued to slow to 5.3 per cent. In light of more modest growth, Chinese policy-makers undertook a number of recent stimulus measures, including an easing of mortgage policies, a reduction in monetary policy rates in November 2014 and then again in March of this year, and an increase in budgeted government spending this year including an acceleration of already-planned infrastructure projects.
Looking ahead, the IMF expects authorities to put a greater weight on reducing financial sector vulnerabilities, stemming in particular from the housing market and the shadow banking sector. As a result, growth is expected to be 6.8 per cent in 2015, in line with the revised official growth target of about 7 per cent for the year, and to slow further to 6.3 per cent in 2016. Nevertheless, there are significant risks associated with the challenge of shifting towards a more sustainable growth model in China with greater reliance on domestic consumption. As well, managing the ongoing adjustment of the housing market may prove to be more difficult than expected.
United States
In the face of global challenges, the U.S. economy continues to show a pickup in underlying growth. Despite a temporary setback at the start of 2014, the economic expansion has subsequently strengthened, averaging almost 4 per cent growth over the last three quarters of the year.
While growth was modest in the fourth quarter of 2014 and in early 2015, it is expected to strengthen going forward. U.S. labour market conditions have continued to improve, as monthly job gains have picked up from about 190,000 on average over the 2011-2013 period to 260,000 on average last year, the fastest annual pace since the late 1990s. As well, monetary policy is expected to remain highly accommodative. Financial markets expect the Federal Reserve to tighten only gradually, beginning in the second half of this year, because of still-elevated labour market slack and softening inflation.
Although the U.S. has become the largest producer of oil in the world, it also remains a net importer and the world's largest oil consumer. As a result, the decline in oil prices will boost U.S. economic activity, with lower gasoline prices translating into significant real income gains for households. However, this positive impact may be partly offset by the appreciation of the U.S. dollar in recent months, which could weigh on U.S. exports.
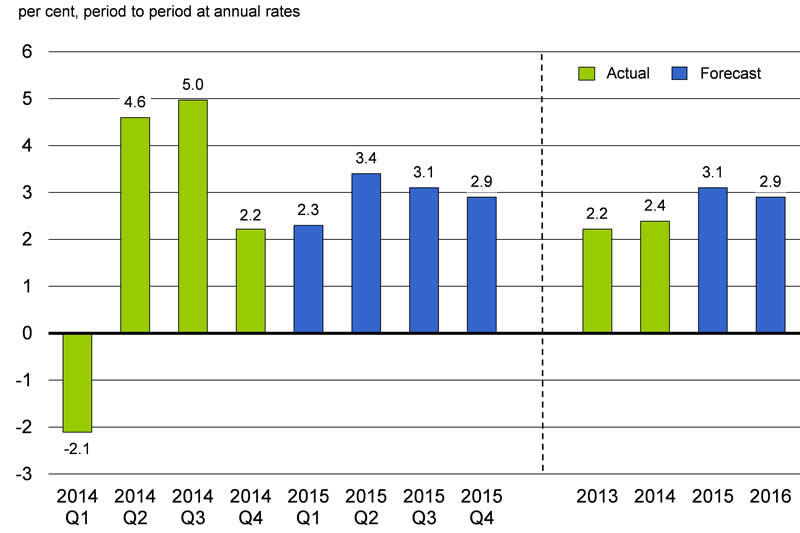
On balance, private sector economists in the March survey expect real GDP growth to be steady at 2.3 per cent in the first quarter of 2015 and then strengthen to around 3 per cent for the rest of the year (Chart 2.4). On an annual basis, growth is projected to be 3.1 per cent in 2015, up from 2.4 per cent in 2014, and to remain close to 3 per cent in 2016. Recent economic indicators suggest that growth in the first quarter of 2015 may be softer than expected, due in part to temporary factors such as severe winter weather.
Financial Market Developments
Ongoing global economic weakness, along with low expected inflation in most advanced economies, has led to a trend decline in long-term interest rates since early 2014 (Chart 2.5). In particular, 10-year government bond rates for Germany and other euro area economies are at record lows, with yields for German 5-year government bonds falling into negative territory for the first time in history.
While U.S. government bond rates also remain very low, expectations of eventual monetary policy rate increases have boosted government bond rates in that country modestly since the end of January 2015. In contrast, Canadian 10-year bond rates have remained broadly stable at about 1.5 per cent since the beginning of the year.
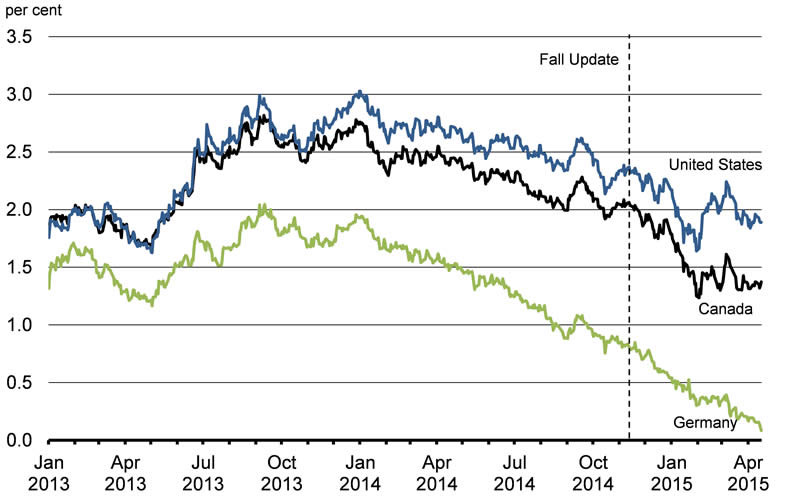
Source: Bloomberg.
Most major currencies have lost ground to the U.S. dollar since mid-2014. For the euro area and Japan, this reflected economic weakness relative to the U.S. and widening interest rate differentials due to expected divergence in monetary policies. While the Canadian dollar has also been affected by the latter factor, the decline in crude oil prices has also put significant downward pressure on the exchange rate (Chart 2.6).
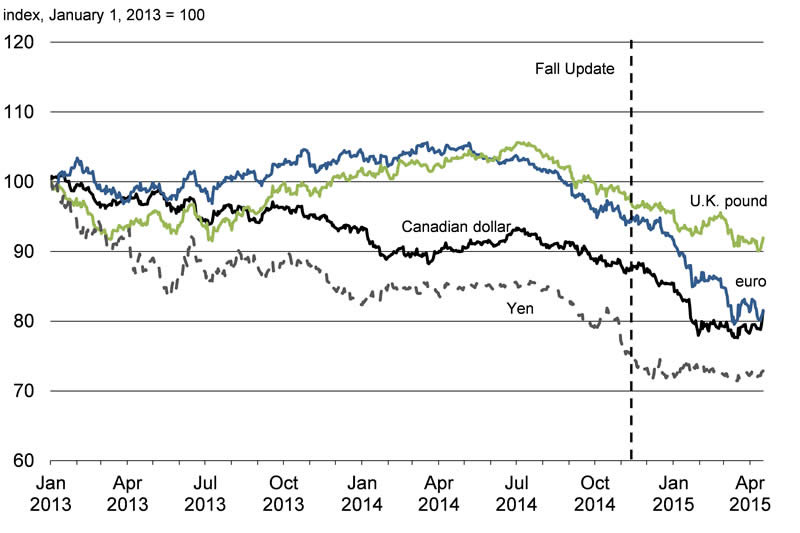
Source: Haver Analytics.
Commodity Prices
After trading broadly in the US$80 to US$110 per barrel range over much of the prior two years, West Texas Intermediate (WTI) crude oil prices have declined sharply since June 2014, with about half of the decline occurring since the 2014 Update of Economic and Fiscal Projections (Fall Update) in November (Chart 2.7). While prices have largely stabilized in the US$45 to US$55 range since the beginning of February, they are about 50 per cent below their recent peak in late June 2014. Although the decline has been cushioned to some extent for Canadian producers by a lower Canadian dollar and reduced spreads to the U.S. WTI benchmark, the Canadian effective price (CEP) price is still down sharply since last June.
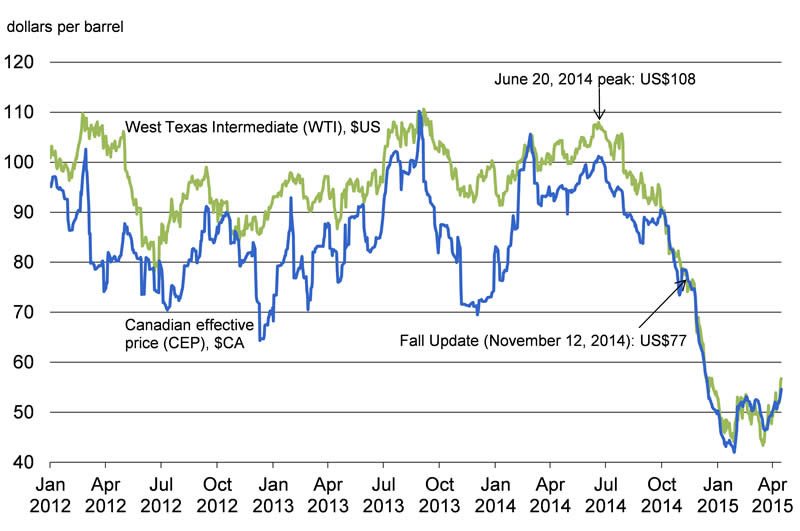
Sources: Commodity Research Bureau; Bloomberg; Flint Hills Resources; Department of Finance calculations.
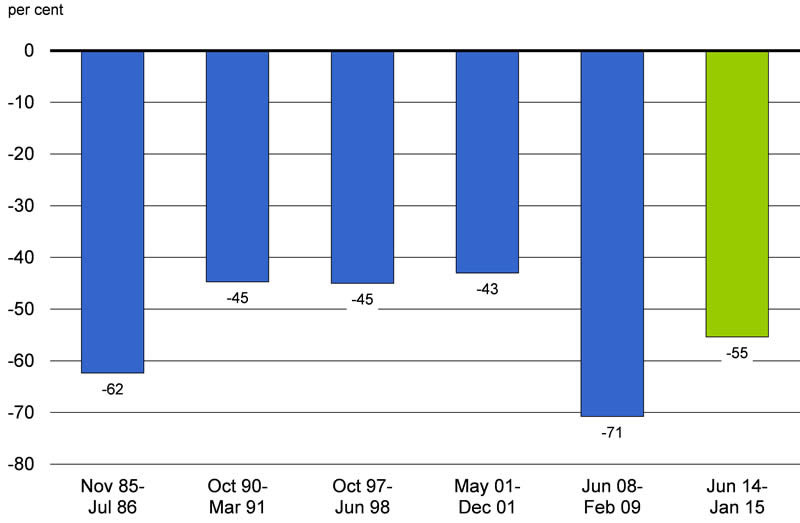
The drop in WTI oil prices—55 per cent between June 2014 and January 2015—is the third largest decline in the last three decades (Chart 2.8). In comparison, prices fell 62 per cent in 1986 (when Saudi Arabia suspended its role as the swing producer of the Organization of the Petroleum Exporting Countries (OPEC) and increased production) and remained at very low levels for close to a decade. During the 2008-2009 global recession, prices dropped by 71 per cent from a record high, but rebounded rapidly over the following year. Although there is considerable uncertainty over the path of crude oil prices going forward in the current episode, most private sector economists expect that prices will remain low over the first half of 2015 before recovering gradually to levels still below those seen in mid-2014.
Sources: Commodity Research Bureau; Department of Finance calculations.
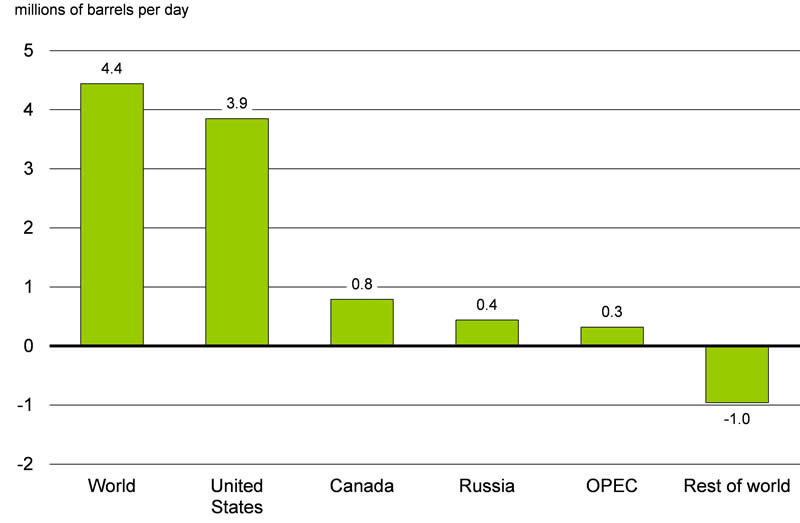
The decline in oil prices has occurred in the context of a relatively weak global economic environment, and hence only modest demand growth for oil. However, the primary driver of the drop in prices has been increased oil supply, with increased production in the United States representing over 85 per cent of the incremental rise in global production since 2011 (Chart 2.9).
Source: U.S. Energy Information Administration.
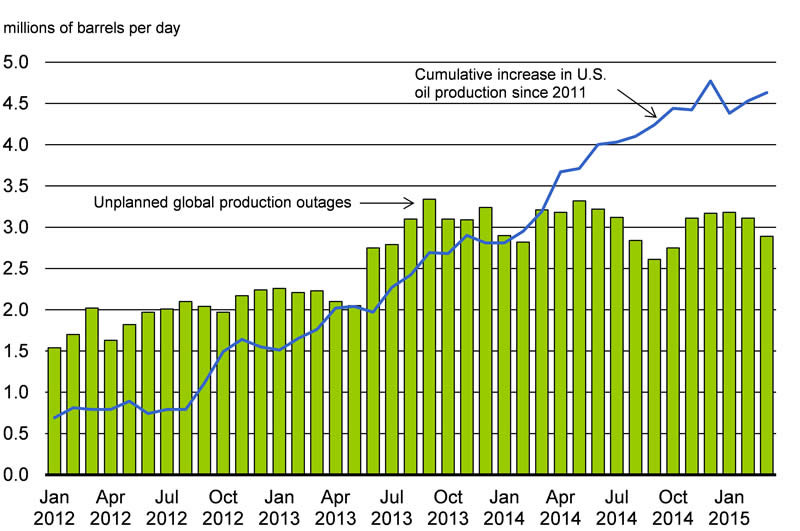
The increase in U.S. oil production began to accelerate rapidly after 2011 in particular (Chart 2.10), with additional production reaching more than 4 million barrels per day as of March 2015 (resulting in an increase of over 5 per cent in global oil supply). Virtually all of this production has been shale oil production from reserves made economically viable by new drilling technology and innovations.
Until the spring of 2014 this increase in U.S. production was more than offset by unplanned production outages elsewhere in the world (most notably in Libya and Iraq, due to geopolitical unrest). As a result, global prices remained broadly stable through the first half of 2014. However, by mid-2014, markets reached a tipping point. The net increase in U.S. production was exceeding decreases in production due to production outages elsewhere, inventory levels began to rise, and prices began to decline. Prices were further dampened by a downward revision to the global oil demand projection from the Organisation for Economic Co-operation and Development's International Energy Agency in early October, as well as in response to the IMF's release of its October World Economic Outlook, which showed a downgrade to global growth expectations. Finally, the price decline accelerated sharply following OPEC's November 27 decision to maintain its production targets to protect market share.
Source: U.S. Energy Information Administration.
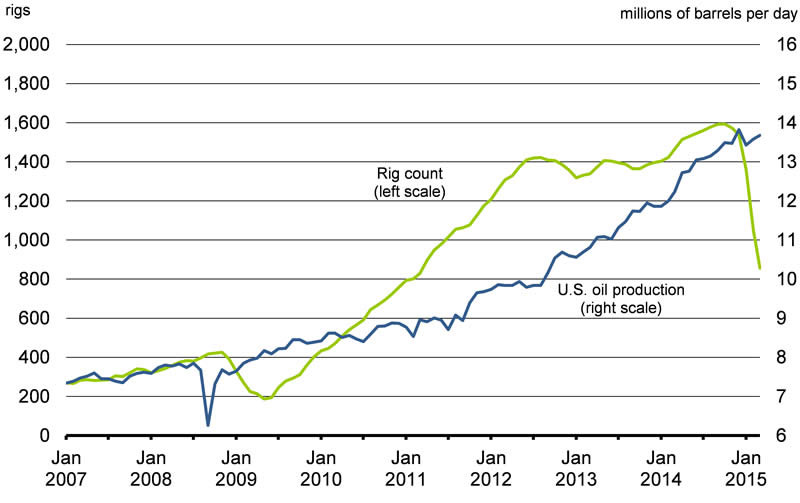
As U.S. shale oil production has been the main driver of the growth in global supply, most market analysts anticipate that crude oil prices will not begin to rebound until there is evidence of a meaningful decline in U.S. production. As shown in Chart 2.11, the number of active rigs dedicated to oil production in the U.S. has already started to decline. But this has not translated into actual production declines. This is because producers are shutting down their least productive rigs and refocusing efforts on fields with lower costs and higher productivity. As a result, production has broadly plateaued thus far in 2015 and is likely to gradually decline later this year. However, as the technology in this industry is relatively new, and underlying production costs continue to decline, there is considerable uncertainty over the actual timing and magnitude of the expected decline in production.
Sources: Baker Hughes; U.S. Energy Information Administration.
Since the Fall Update, prices for most other commodities have also declined, although, in general, by much less than crude oil prices. For most non-oil commodities much of these price declines have reflected supply factors. However, at least some of the recent declines, particularly for lumber and base metals, appear to be linked to soft demand (Chart 2.12).
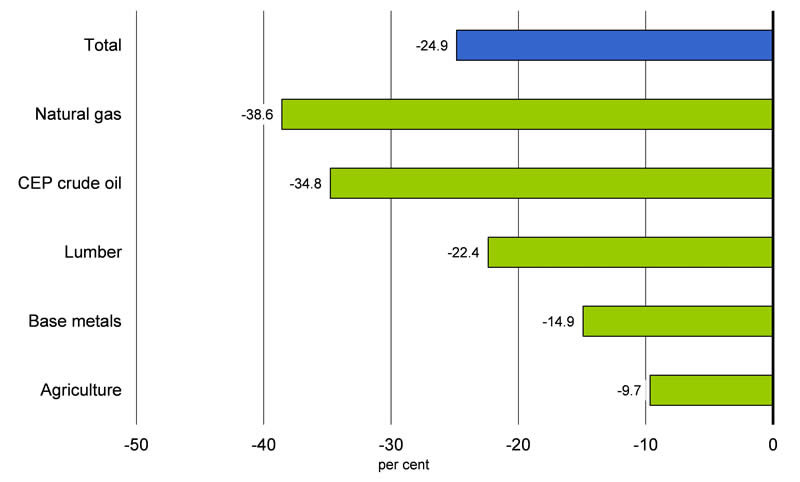
Sources: Commodity Research Bureau; Bloomberg; Flint Hills Resources; Department of Finance calculations.
Canada's Economic Performance
Despite a weak global economic environment, Canada continues to lead all other G-7 economies in real GDP growth over the recovery (Chart 2.13).
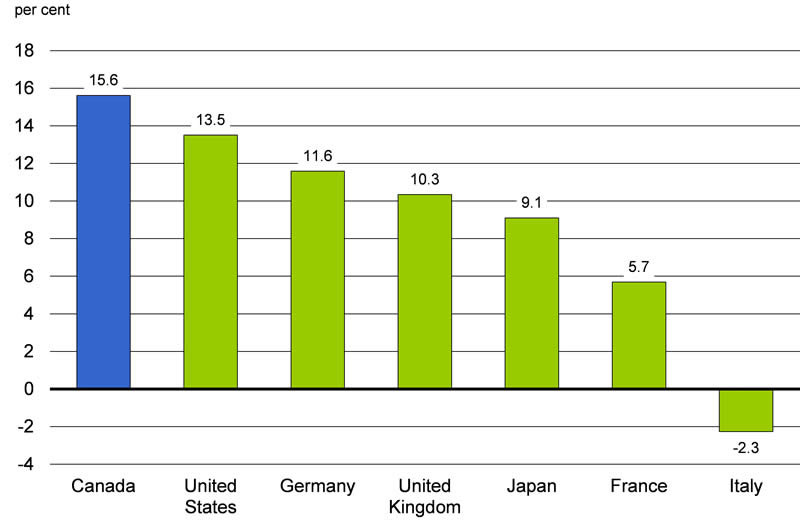
Sources: Haver Analytics; Department of Finance calculations.
Canada's strong economic performance has been driven by a solid domestic economy, with Canada enjoying ongoing growth in private domestic demand since the end of the recession. This sustained growth has been supported by the strongest growth in real business investment in the G-7 over the recovery (Chart 2.14).
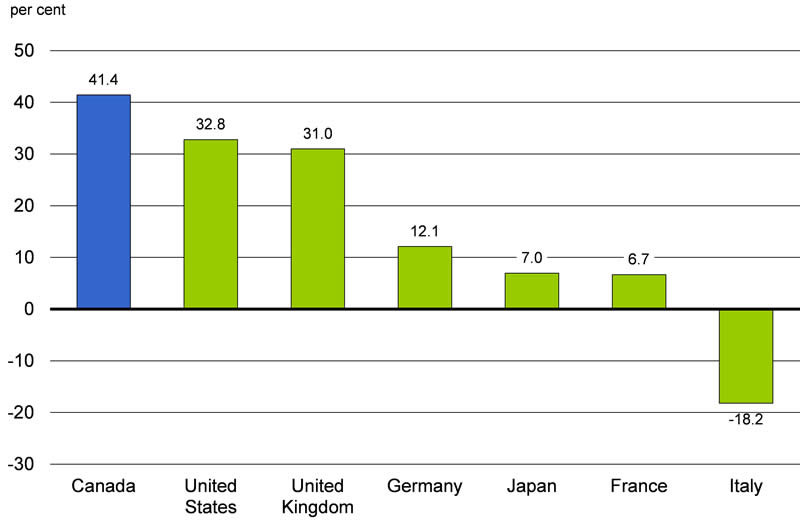
Sources: Statistics Canada; United Kingdom Office for National Statistics; German Federal Statistical Office; Haver Analytics; Department of Finance calculations.
Reflecting this solid domestic performance, over 1.2 million more Canadians are working now than at the end of the recession in June 2009—one of the strongest job creation records in the G-7 over this period (Chart 2.15). The majority of these net new jobs have been full-time positions in high-wage, private sector industries—an essential condition for a sustained recovery and expansion.
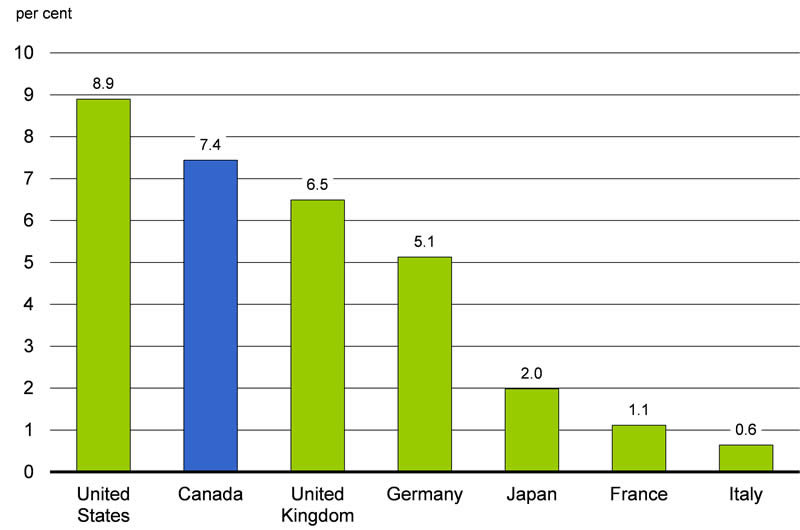
Sources: Haver Analytics; Department of Finance calculations.
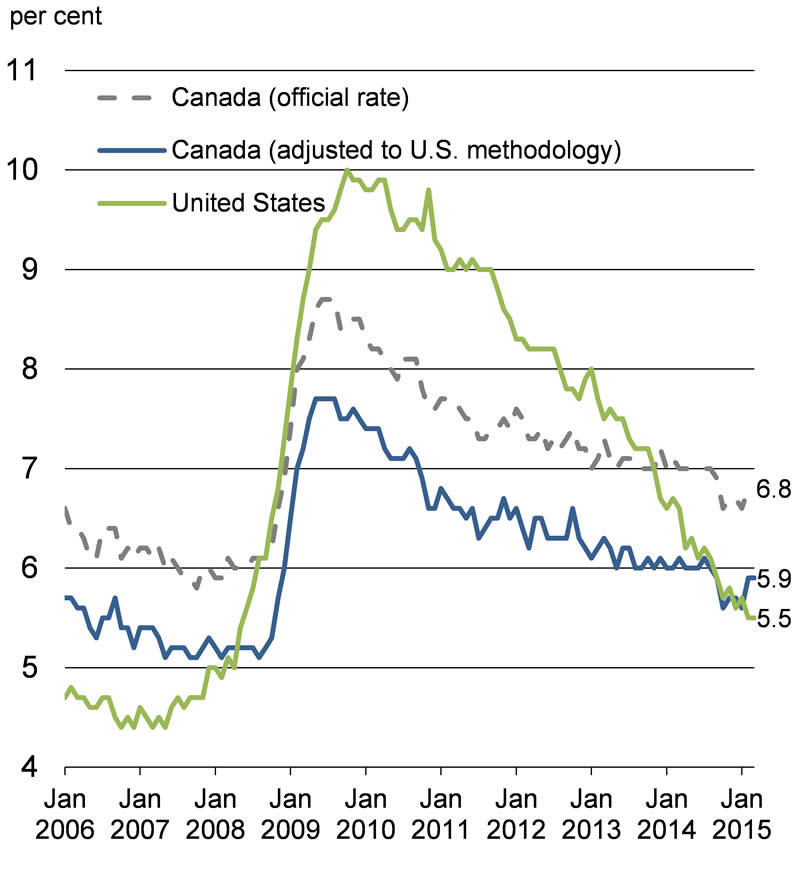
When measured on a comparable basis, Canada's unemployment rate is now slightly higher than that in the U.S.1 (Chart 2.16), despite the fact that job growth since pre-recession peaks has been twice as fast in Canada as in the United States. This is largely a result of the large difference in the evolution of labour force participation rates between the two countries over this period. The Canadian labour force participation rate stands at 65.9 per cent, 3.2 percentage points higher than in the U.S., where the participation rate has fallen sharply since mid-2009 and stands at a 37-year low.
Sources: Statistics Canada; U.S. Bureau of Labor Statistics.
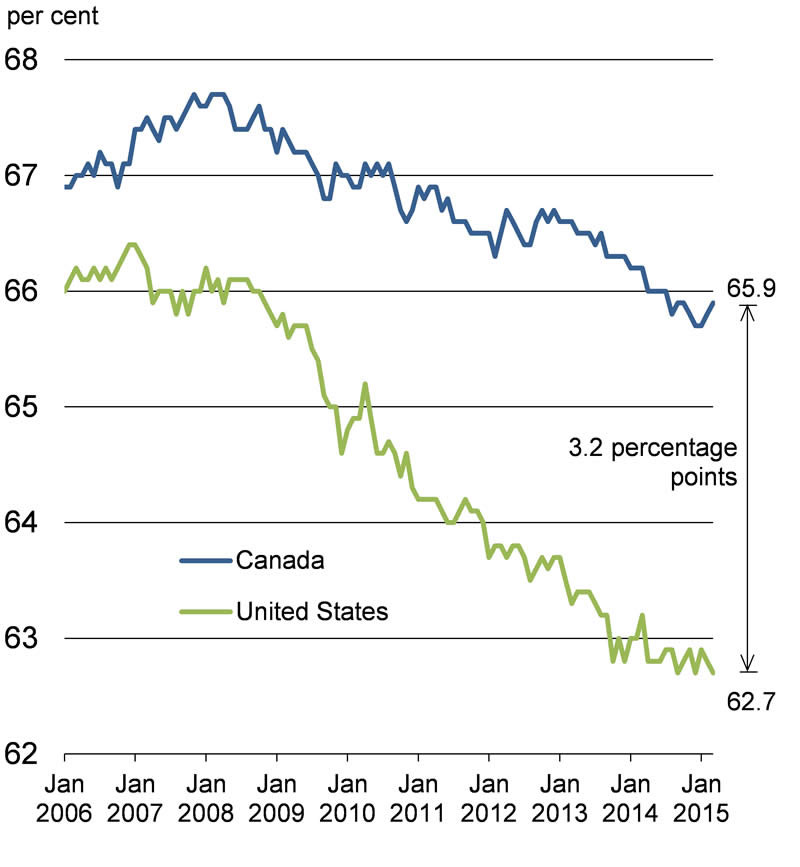
Population aging, reflected in a rapidly increasing number of individuals of retirement age, has led to declines in the participation rates of both the U.S. and Canada over the last several years. However, in the U.S. these underlying demographic forces have been aggravated by deeper and more protracted labour market weakness during the recession and recovery. This has resulted in many more middle-aged and older individuals retiring or withdrawing permanently from the labour market, due to a lack of employment opportunities. In contrast, Canada's better labour market performance over the recovery has served to mitigate the impacts of an aging population, and an increasing number of older individuals have chosen to remain actively engaged in the labour market.
While Canada's economic record over the recession and recovery has been strong, particularly relative to its peer countries in the G-7, Canada has not been immune to external developments, with weak external demand growth weighing on Canadian exports. Without solid growth in global demand for Canadian products, the incentive for businesses to take on additional capacity has waned. As a result, real business investment growth has slowed to an annual rate of less than 1 per cent since mid-2012—compared with almost 12 per cent on average earlier in the recovery.
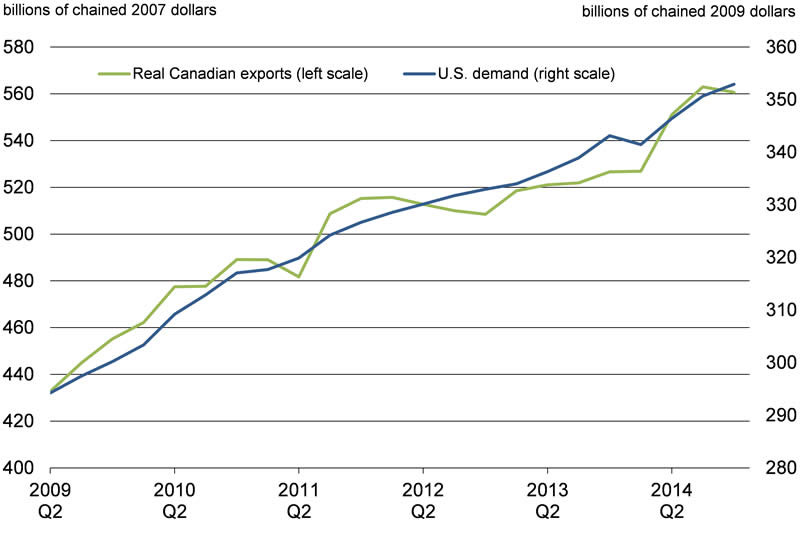
Encouragingly, exports have shown signs of firming more recently. After posting average growth of just 1.2 per cent per quarter over 2012 and 2013, real exports grew by 6.8 per cent on average during 2014, in line with stronger growth in U.S. demand (Chart 2.17). Further, the depreciation of the Canadian dollar has improved the international competitive position of Canadian firms. This, along with expected stronger U.S. economic growth, points to stronger production and exports in non-energy sectors going forward.
Sources: Statistics Canada; U.S. Bureau of Economic Analysis; Department of Finance calculations.
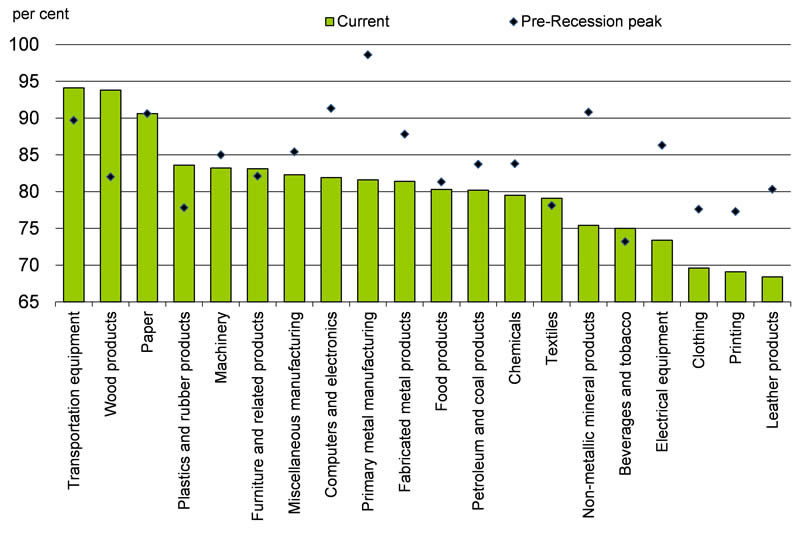
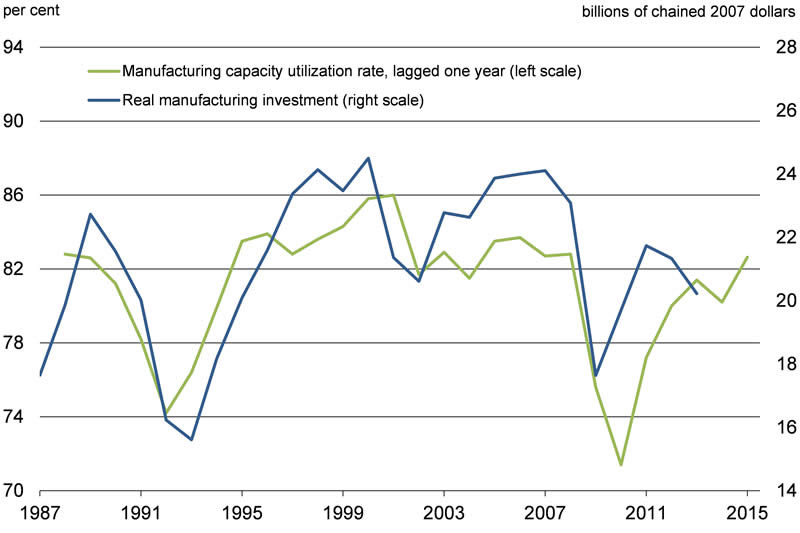
The degree to which Canadian manufacturing firms will be able to respond to expected stronger U.S. growth varies by sub-sector. Capacity utilization rates (the degree to which firms are employing their productive resources) in many sub-sectors are still below their pre-recession peaks. In addition, many sub-sectors remain well below historical highs. In other sub-sectors, notably transportation equipment and wood products, capacity utilization rates are either at or close to their historical peaks. In sub-sectors where current capacity is more limited, there will be a greater impetus to make capacity-increasing investments in the face of improving demand (Chart 2.18).
Pre-Recession Peaks
Source: Statistics Canada.
More generally, a durable increase in demand will provide greater incentives for increased investment in the manufacturing sector and elsewhere in the economy, which in turn will lead to higher productive capacity and higher real GDP growth (Chart 2.19).
Source: Statistics Canada.
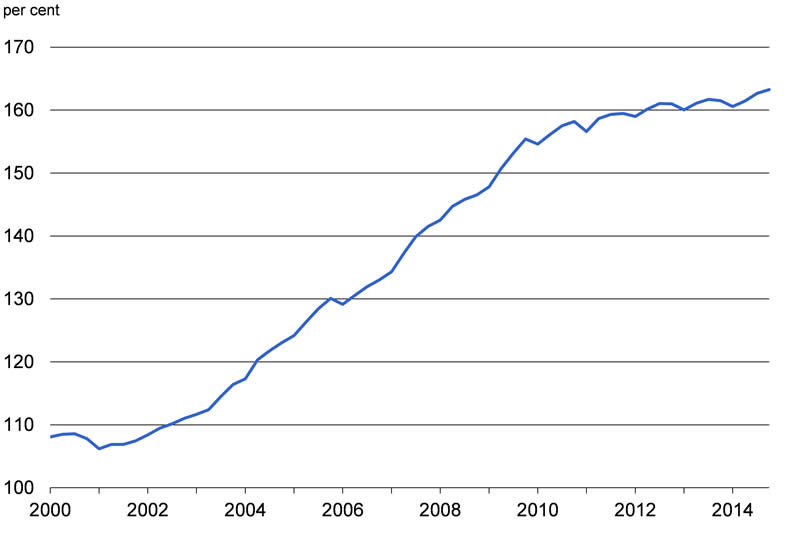
Residential investment has also been an important contributor to Canadian GDP growth both before the 2008-2009 global recession and over most of the recovery. This has been driven by Canadian households taking advantage of solid employment gains and low interest rates to invest in housing assets—whether they are purchasing their first homes, moving into larger homes or renovating existing homes. Reflecting this, the pace of household debt accumulation relative to disposable income increased between 2002 and the depths of the global recession in mid-2009, before slowing and then broadly stabilizing at an elevated level since 2012 (Chart 2.20).
Source: Statistics Canada.
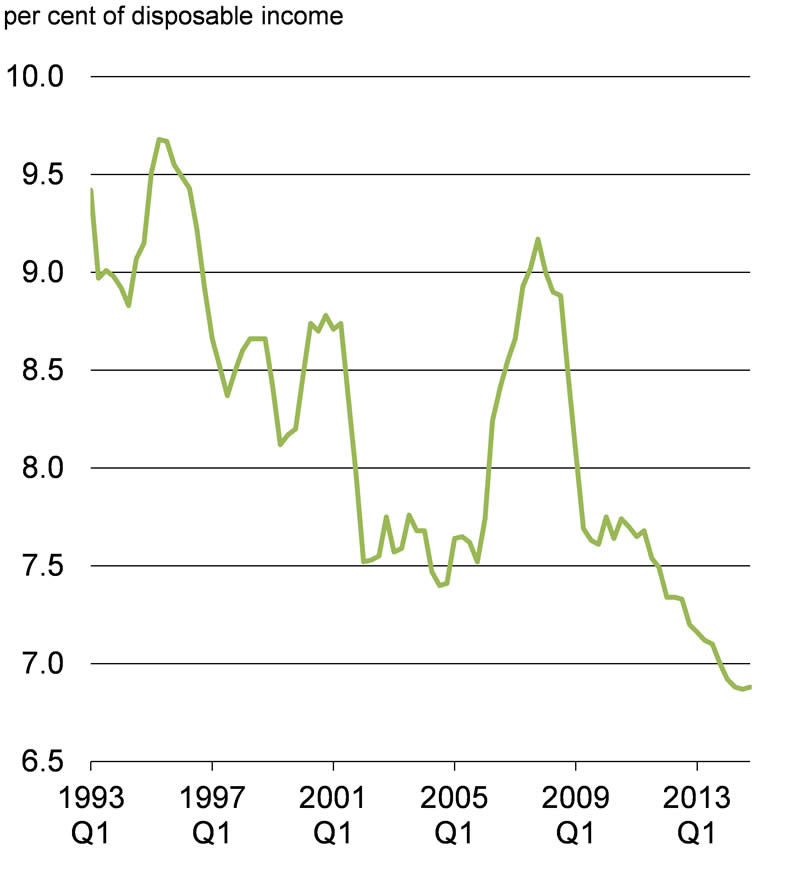
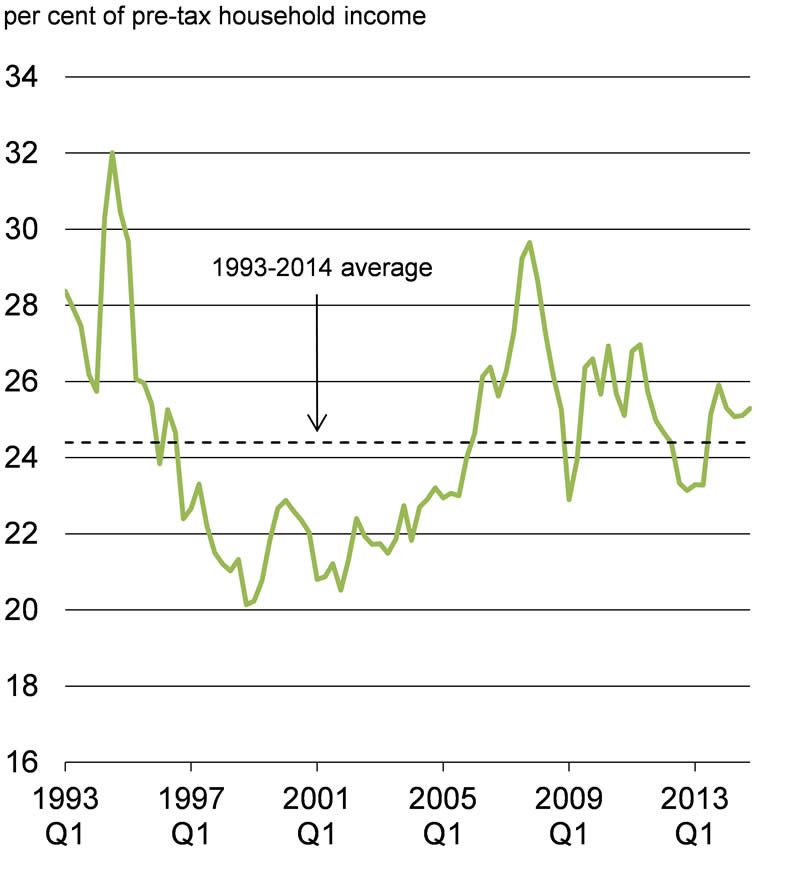
Higher debt loads leave the household sector more vulnerable to income shocks or a sudden and sharp increase in interest rates. However, as households have accumulated debt in a very low interest rate environment, the cost of servicing that debt is at a record low. As of the fourth quarter of 2014, household interest payments as a share of disposable income stood at 6.9 per cent, the lowest level since data are available starting in 1990 (Chart 2.21). Total debt payments, which include principal reimbursement, also remain manageable. For example, a measure of the mortgage debt-service ratio—the ratio of mortgage principal and interest payments on an average-priced property relative to average household pre-tax income assuming a 5 per cent down payment, which is typical for a first-time homebuyer—remains in line with its historical average.
Source: Statistics Canada.
Sources: Statistics Canada; Canadian Real Estate Association; Department of Finance calculations.
The Government tightened the rules governing government-backed insured mortgages four times since 2008. Following the implementation of these measures, there has been an appropriate and desirable moderation in housing market activity in most regional markets across Canada. Toronto and Vancouver, in contrast, have continued to experience periods of strong sales and price growth, with housing market strength in these cities supported by factors such as population growth and land scarcity. More recently, uncertainty about future economic conditions resulting from lower oil prices has led to a slowing of housing market activity and lower prices throughout Alberta and Saskatchewan.
Impacts of Lower Oil Prices on the Canadian Economy
The decline in global crude oil prices since mid-2014 will have impacts throughout the global economy, resulting in an income transfer from relatively few oil exporting countries to many oil importing countries. As a result, for the global economy the net impact is positive, as lower energy costs translate into real income gains and stronger economic activity for households and firms.
However, as Canada is a net oil exporter, lower oil prices will have a net negative impact on Canada's growth prospects, particularly through the price channel (GDP inflation) and to a lesser extent activity (real GDP).
The impact of lower crude oil prices on GDP inflation will be negative, largely reflecting lower crude oil export prices. In particular, the value of Canada's crude oil exports in the second quarter of 2014 (before the decline in oil prices) was $100 billion, or 5.1 per cent of nominal GDP. The decline in crude oil export prices reduced the value of exports, and hence nominal GDP, by almost $40 billion (2 per cent of GDP) between the second quarter of 2014 and February 2015 (export volumes have remained broadly unchanged).
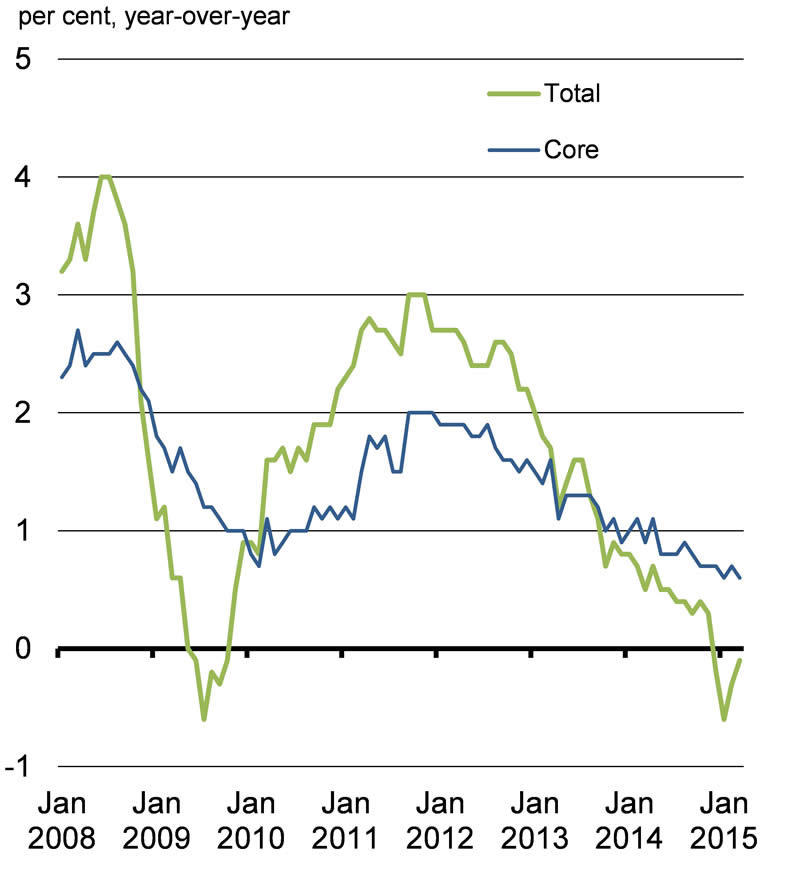
Consumer prices have also been affected by lower crude oil prices, with Consumer Price Index (CPI) inflation down dramatically from its peak of 2.4 per cent in October 2014 to 1.2 per cent as of March 2015. This entirely reflects lower gasoline prices, which have seen their largest declines since the 2008-2009 global recession (Chart 2.22). In contrast, core inflation, which excludes the impact of gasoline and other volatile items, has remained near 2 per cent.
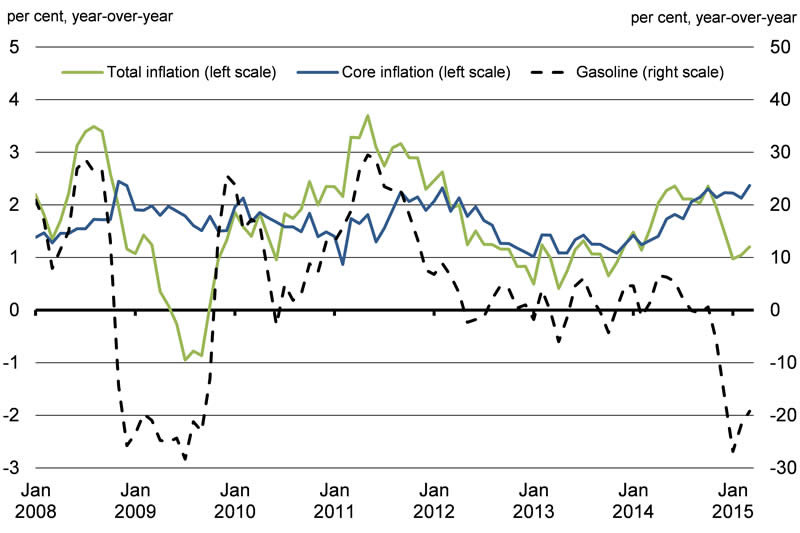
Source: Statistics Canada.
The impacts of sustained low oil prices on Canadian real GDP are mixed.
Lower crude oil prices result in a reduction in the incomes, or corporate profits, of firms in the energy sector. Lower corporate profits in the energy sector will first affect real GDP through weaker investment and hiring within the energy sector, which will eventually lead to reduced production in the sector. However, over time, these negative effects will be offset to some extent by the positive impacts of lower crude oil prices on the non-energy sectors of the Canadian economy—which are responsible for the large majority of goods and services produced in Canada and exported.
Lower crude oil prices will have a much different impact on the incomes of Canadian households. Lower employment in the energy sector will have some negative effects on household income. In addition, insofar as Canadians are shareholders of firms in the energy sector (through their direct investments, as well as through their holdings of mutual funds, private pension plans, etc.), lower equity prices in the energy sector will have an impact on household wealth, which could modestly reduce consumer spending if the decline in oil prices persists. However, these negative impacts will be more than offset by the immediate real income gains associated with lower gasoline and other energy-related prices. Households spent $48 billion on gasoline and motor oil in the second quarter of 2014. The decline in gasoline prices between mid-2014 and the first quarter of 2015 (approximately 25 per cent) freed up approximately $12 billion (over 1 per cent of total consumer spending) for households to spend on other goods and services. This real income gain will support consumer spending going forward.
There are also some important offsetting factors that are largely external to Canada. The global economy will benefit from lower crude oil prices, in particular the U.S. economy as it remains a significant net importer of crude oil. A stronger U.S. economy will benefit Canada as it is the destination for nearly 75 per cent of Canadian exports. In addition, the lower value of the dollar has both cushioned the decline in crude oil prices received by Canadian energy producers and boosted the international competitive position of Canadian manufacturers and exporters. This too will provide support to real GDP growth by making non-energy exports, which account for about 80 per cent of Canada's total goods exports, more attractive.
Further, the reduction in the target for the overnight rate by the Bank of Canada on January 21, 2015 has led to lower borrowing costs for households and businesses, which should also help support domestic economic activity going forward.
Government Actions Will Support Economic Growth and Job Creation
Actions taken by the Government over the past year will also help to further support economic growth and job creation in Canada. On a cash basis, these include:
- Support for Canadian families through the Family Tax Cut and Universal Child Care Benefit enhancements totalling $7.8 billion in 2015–16 and over $4.5 billion ongoing.
- Support for small businesses through the Small Business Job Credit and Employment Insurance (EI) premium freezes for three years, followed by a committed reduction in EI premiums to a seven-year break-even rate in 2017.
- $5.8 billion in new investments that will continue to build and renew federal infrastructure across the country, with the majority of this support being delivered within three years.
These measures, together with measures announced in Economic Action Plan 2015, total almost $10 billion in 2015–16, or 0.5 per cent of GDP, and average $8.5 billion per year thereafter, on a cash basis (Chart 2.23). This will provide significant support to the Canadian economy starting in the second quarter of 2015.
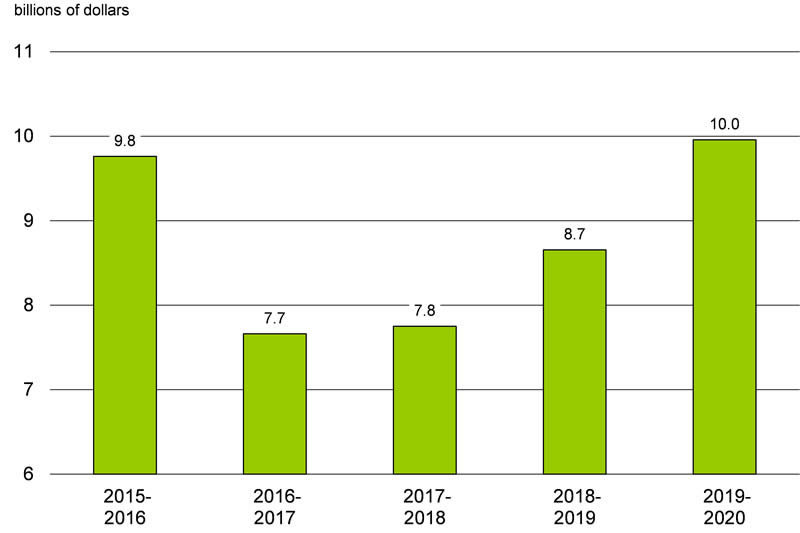
Source: Department of Finance.
Canadian Economic Outlook—Private Sector Forecasts
The average of private sector economic forecasts has been used as the basis for fiscal planning since 1994 and introduces an element of independence into the Government's fiscal forecast. This practice has been supported by international organizations such as the IMF.
The Department of Finance regularly surveys private sector economists on their views on the outlook for the Canadian economy. The economic forecast presented in this section is based on a survey conducted in March 2015, and includes the views of 15 private sector economists.
The March 2015 survey of private sector economists included:
- BMO Capital Markets,
- Caisse de dépôt et placement du Québec,
- Canadian Federation of Independent Business,
- CIBC World Markets,
- The Conference Board of Canada,
- Desjardins,
- Deutsche Bank of Canada,
- IHS Global Insight,
- Industrial Alliance Insurance and Financial Services Inc.,
- Laurentian Bank Securities,
- National Bank Financial Group,
- Royal Bank of Canada,
- Scotiabank,
- TD Bank Financial Group, and
- the University of Toronto (Policy and Economic Analysis Program).
Relative to the September 2014 survey presented in the Fall Update, private sector economists have revised down their near-term outlooks for both real GDP and, more significantly, GDP inflation, largely reflecting the economic impacts of lower crude oil prices. The economists now expect real GDP growth of 1.2 per cent in the first quarter of 2015, rising gradually to 2.3 per cent by the fourth quarter of the year. The expected impact on economy-wide prices is significantly larger, with the economists now expecting GDP prices to decline by 3.1 per cent in the first quarter of 2015, following a drop of 2.3 per cent in the fourth quarter of 2014. As a result, economists expect nominal GDP to decline by 2 per cent in the first quarter of 2015. Growth in nominal GDP is expected to resume and accelerate though the rest of 2015, closing the year at a healthy 5 per cent pace (Table 2.1).
| 2014Q41 | 2015Q1 | 2015Q2 | 2015Q3 | 2015Q4 | |
|---|---|---|---|---|---|
| Real GDP growth | |||||
| September 2014 survey | 2.4 | 2.6 | 2.6 | 2.6 | 2.5 |
| March 2015 survey | 2.4 | 1.2 | 1.5 | 2.0 | 2.3 |
| GDP inflation | |||||
| September 2014 survey | 1.3 | 2.1 | 1.9 | 1.8 | 2.0 |
| March 2015 survey | -2.3 | -3.1 | 1.0 | 2.5 | 2.7 |
| Nominal GDP growth | |||||
| September 2014 survey | 3.7 | 4.9 | 4.6 | 4.4 | 4.4 |
| March 2015 survey | 0.1 | -2.0 | 2.4 | 4.4 | 5.0 |
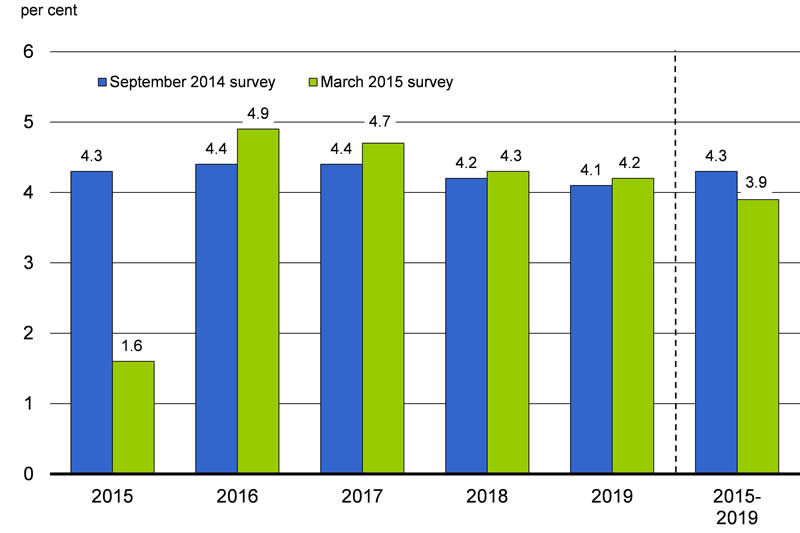
Reflecting the downward revision to the near-term outlook, the economists expect nominal GDP growth of 1.6 per cent in 2015, down from 4.3 per cent in the September survey (Chart 2.24). Nominal GDP growth over the remainder of the forecast horizon has been revised up modestly. As a result, the level of nominal GDP is expected to be $55 billion lower in 2015 relative to the September survey, with this gap narrowing to under $50 billion thereafter.
The economists expect the unemployment rate to continue to gradually decline over the forecast horizon and reach 6.1 per cent in 2019.
CPI inflation is projected to increase by just 0.9 per cent in 2015 as a result of declines in gasoline prices before firming to 2.2 per cent in 2016. The economists expect core inflation to remain stable around 2 per cent throughout 2015 and over the remainder of the forecast horizon.
The economists have revised down their outlooks for short- and long-term interest rates relative to the September survey. The economists now expect 3-month treasury bill rates to average 0.6 per cent in 2015 (down from 1.2 per cent in the September survey), gradually climbing to 3.0 per cent by 2019. Similarly, they expect 10-year Government of Canada bond rates to average 1.7 per cent in 2015 (down from 3.0 per cent in the September survey) and to rise to 3.9 per cent by 2019.
The economists have also significantly revised down their outlooks for crude oil prices. In the March survey, the economists expect WTI crude oil prices to average US$54 per barrel in 2015, down from expectations of US$96 in September. The economists expect prices to rise to US$67 in 2016 before gradually climbing to the US$80 range by 2019, well below the September outlook of US$100.
| 20141 | 2015 | 2016 | 2017 | 2018 | 2019 | 2015–2019 | |
|---|---|---|---|---|---|---|---|
| Real GDP growth | |||||||
| Economic Action Plan 20142 | 2.3 | 2.5 | 2.5 | 2.3 | 2.2 | - | - |
| September 2014 survey2 | 2.5 | 2.6 | 2.4 | 2.3 | 2.2 | 2.1 | 2.3 |
| March 2015 survey | 2.5 | 2.0 | 2.2 | 2.3 | 2.2 | 2.0 | 2.2 |
| GDP inflation | |||||||
| Economic Action Plan 20142 | 1.5 | 2.0 | 2.0 | 2.0 | 2.0 | - | - |
| September 2014 survey2 | 2.0 | 1.6 | 2.0 | 2.1 | 2.0 | 2.0 | 1.9 |
| March 2015 survey | 1.8 | -0.4 | 2.6 | 2.3 | 2.1 | 2.1 | 1.7 |
| Nominal GDP growth | |||||||
| Economic Action Plan 20142 | 3.9 | 4.5 | 4.5 | 4.4 | 4.2 | - | - |
| September 2014 survey2 | 4.5 | 4.3 | 4.4 | 4.4 | 4.2 | 4.1 | 4.3 |
| March 2015 survey | 4.4 | 1.6 | 4.9 | 4.7 | 4.3 | 4.2 | 3.9 |
| Nominal GDP level (billions of dollars) | |||||||
| Economic Action Plan 20142 | 1,968 | 2,056 | 2,150 | 2,244 | 2,339 | - | - |
| September 2014 survey2 | 1,978 | 2,063 | 2,155 | 2,251 | 2,347 | 2,444 | - |
| March 2015 survey | 1,976 | 2,008 | 2,106 | 2,204 | 2,299 | 2,396 | - |
| Difference between March 2015 survey and September 2014 survey2 | -2 | -55 | -49 | -47 | -47 | -48 | - |
| 3-month treasury bill rate | |||||||
| Economic Action Plan 2014 | 1.0 | 1.5 | 2.7 | 3.6 | 4.0 | - | - |
| September 2014 survey | 0.9 | 1.2 | 2.1 | 2.9 | 3.4 | 3.6 | 2.6 |
| March 2015 survey | 0.9 | 0.6 | 1.0 | 2.0 | 2.7 | 3.0 | 1.9 |
| 10-year government bond rate | |||||||
| Economic Action Plan 2014 | 3.0 | 3.5 | 4.1 | 4.6 | 4.8 | - | - |
| September 2014 survey | 2.3 | 3.0 | 3.6 | 4.1 | 4.3 | 4.4 | 3.9 |
| March 2015 survey | 2.2 | 1.7 | 2.5 | 3.2 | 3.7 | 3.9 | 3.0 |
| Exchange rate (US cents/C$) | |||||||
| Economic Action Plan 2014 | 93.7 | 95.3 | 95.9 | 96.2 | 96.3 | - | - |
| September 2014 survey | 91.3 | 89.6 | 90.8 | 90.6 | 90.8 | 91.1 | 90.6 |
| March 2015 survey | 90.5 | 79.2 | 80.8 | 83.6 | 85.5 | 86.5 | 83.1 |
| Unemployment rate | |||||||
| Economic Action Plan 2014 | 6.8 | 6.6 | 6.4 | 6.3 | 6.2 | - | - |
| September 2014 survey | 7.0 | 6.8 | 6.5 | 6.4 | 6.3 | 6.3 | 6.5 |
| March 2015 survey | 6.9 | 6.7 | 6.6 | 6.3 | 6.2 | 6.1 | 6.4 |
| Consumer Price Index inflation | |||||||
| Economic Action Plan 2014 | 1.5 | 1.9 | 2.0 | 2.0 | 2.0 | - | - |
| September 2014 survey | 2.0 | 1.9 | 2.0 | 2.0 | 2.0 | 2.0 | 2.0 |
| March 2015 survey | 1.9 | 0.9 | 2.2 | 2.0 | 2.0 | 2.0 | 1.8 |
| U.S. real GDP growth | |||||||
| Economic Action Plan 2014 | 2.7 | 3.1 | 3.0 | 2.9 | 2.6 | - | - |
| September 2014 survey | 2.1 | 3.1 | 2.9 | 2.8 | 2.5 | 2.5 | 2.7 |
| March 2015 survey | 2.4 | 3.1 | 2.9 | 2.6 | 2.4 | 2.4 | 2.7 |
| WTI crude oil price ($US per barrel) | |||||||
| Economic Action Plan 2014 | - | - | - | - | - | - | - |
| September 2014 survey | 99 | 96 | 95 | 99 | 100 | 101 | 98 |
| March 2015 survey | 93 | 54 | 67 | 75 | 78 | 78 | 70 |
The September private sector survey outlook for crude oil prices was not used for fiscal planning in the Fall Update, reflecting the decline in crude oil prices between the time of the September 2014 survey and the Fall Update in mid-November. In the Fall Update, WTI crude oil prices were assumed to remain at US$81 per barrel from late 2014 to 2019, consistent with a level of nominal GDP $3 billion below the September survey in 2014 and $16 billion below per year thereafter.
WTI crude oil prices are now expected to be almost US$30 per barrel below the Fall Update assumption in 2015, with prices expected to return to the US$80-range by 2019. For its part, the March 2015 private sector forecast for nominal GDP is $39 billion lower than the Fall Update outlook for 2015, with this gap narrowing to $32 billion lower by 2019 (Table 2.3).
| 20141 | 2015 | 2016 | 2017 | 2018 | 2019 | |
|---|---|---|---|---|---|---|
| WTI crude oil prices ($US per barrel) | ||||||
| Fall Update | 95 | 81 | 81 | 81 | 81 | 81 |
| March 2015 survey | 93 | 54 | 67 | 75 | 78 | 78 |
| Difference between March 2015 survey and Fall Update |
-2 | -27 | -14 | -6 | -3 | -3 |
| Nominal GDP level (billions of dollars) | ||||||
| Fall Update2 | 1,975 | 2,047 | 2,139 | 2,235 | 2,331 | 2,428 |
| March 2015 survey | 1,976 | 2,008 | 2,106 | 2,204 | 2,299 | 2,396 |
| Difference between March 2015 survey and Fall Update |
1 | -39 | -33 | -31 | -31 | -32 |
Risk Assessment
On April 9, 2015, the Minister of Finance met with the private sector economists to discuss the economic projections resulting from the March 2015 survey, as well as the risks surrounding the outlook. At that time, the economists agreed that the average forecast from the March survey was a reasonable basis for fiscal planning.
The risks to the economic outlook remain and are largely external to the Canadian economy, stemming from uncertainty surrounding both the future path of oil prices and global growth.
Crude oil prices have declined markedly since the time of the Fall Update. While private sector economists expect prices to reclaim some of their lost ground starting later this year, the risk of sustained low prices or even additional declines remains a possibility, in particular if there is no meaningful sustained decline in global supply.
Further, there is uncertainty over the magnitude of the impact of lower oil prices on the Canadian economy. In the March survey, private sector economists anticipate that real GDP growth will slow from 2.4 per cent in the fourth quarter of 2014 to 1.2 per cent in the first quarter of 2015. However, economic data to date for early 2015 suggest that real GDP growth in the first quarter is likely to be weaker than expected, or even flat. At the same time, however, price indicators, including terms of trade, suggest that the decline in GDP inflation in the first quarter could be smaller than expected in the March survey, which would leave nominal GDP growth in the quarter broadly in line with expectations in the March survey.
Beyond 2015, the Department of Finance considers that the average private sector forecast for GDP inflation in the March survey is prudent. Indeed, the projected modest pickup in GDP inflation over this period despite a robust recovery in oil prices is consistent with falling non-energy commodity prices which would offset some of the terms-of-trade gains (higher export prices relative to import prices) resulting from higher oil prices. Overall, this leads to prudent assumptions for the commodity price outlook in the March survey of private sector economists.
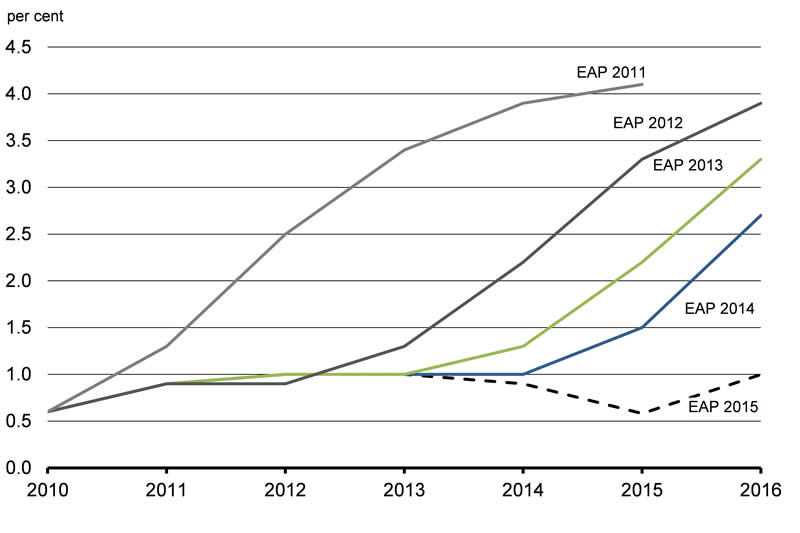
Persistently lacklustre global growth poses further risks to the forecast. Economic growth has remained weak and uneven in the euro area. While the risk of a sovereign debt crisis has receded with the recent temporary financing agreement for Greece, negotiations are ongoing and could result in renewed financial market uncertainty and volatility. There is also the possibility of a deeper slowdown in emerging economies. As a result, there is a risk that global growth could once again surprise on the downside (Chart 2.25).
revised down since 2011
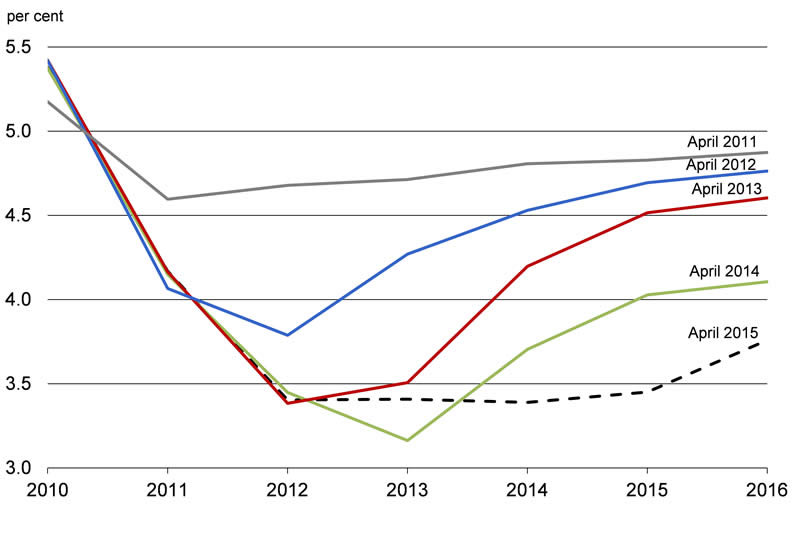
Sources: IMF, April 2011, April 2012, April 2013, April 2014 and April 2015 World Economic Outlook; Department of Finance calculations.
Reflecting the repeated downward revisions to global growth, the outlook for interest rates has also been revised down in recent years, with economists repeatedly pushing back the path of expected interest rate increases (Chart 2.26). Should global growth fail to pick up as expected, it is likely that interest rates could once again be lower than currently expected.
have also been repeatedly revised down
The U.S. economy, Canada's largest trading partner, could be stronger than anticipated, given the recent stronger-than-expected performance of U.S. labour markets and the anticipated boost to growth from lower crude oil prices. At the same time, recent economic indicators suggest that U.S. economic growth has not accelerated as expected in early 2015.
From a domestic perspective, elevated levels of household debt continue to pose a risk to the outlook. In particular, should the economy be significantly weaker than expected and unemployment increases substantially, households may reduce their spending more than they would if they had lower debt levels.
Planning Assumptions
In light of these risks, for fiscal planning purposes, the Government is adjusting downward the private sector forecast for nominal GDP by $7 billion for 2015 through 2017, $13 billion for 2018, and $20 billion in 2019 (Table 2.4). The Government will continue to evaluate economic developments and risks to determine whether or not it would be appropriate to maintain this adjustment for risk in the future. As discussed in Chapter 5.2, this translates to a set-aside for contingencies of $1.0 billion per year between 2015–16 and 2017–18, $2.0 billion in 2018–19 and $3.0 billion in 2019–20.
| 2015 | 2016 | 2017 | 2018 | 2019 | |
|---|---|---|---|---|---|
| March 2015 survey | 2,008 | 2,106 | 2,204 | 2,299 | 2,396 |
| Adjustment for risk | -7 | -7 | -7 | -13 | -20 |
| Economic Action Plan 2015 fiscal planning assumption | 2,001 | 2,099 | 2,197 | 2,286 | 2,376 |
| Addendum | |||||
| Adjustment for risk in 2014 Fall Update | -20 | -20 | -20 | -20 | -20 |
1 Conceptual differences raise the Canadian unemployment rate relative to the U.S. rate. In particular, Statistics Canada considers as unemployed those passively looking for work (e.g. reading want ads) as well as those who will begin work in the near future, while the U.S. Bureau of Labor Statistics does not include either group in the labour force. In addition, the Canadian methodology includes 15-year-olds (who have a higher-than-average unemployment rate), while the U.S. does not.