
Common menu bar links
archived - Chapter 4.2: Fiscal Planning Framework
Table of Contents - Previous - Next
Fiscal Outlook Before the Measures Proposed in Budget 2010
Table 4.2.1 provides a summary of the changes in the fiscal projections since the September 10, 2009 Update of Economic and Fiscal Projections. Although budget measures have been presented over two years, this section provides a five-year forecast as part of the Government's medium-term economic plan. In the Update, underlying budgetary deficits of $55.9 billion in 2009–10, $45.3 billion in 2010–11, $27.4 billion in 2011–12, $19.4 billion in 2012–13, $11.2 billion in 2013–14 and $5.2 billion in 2014–15 were projected.
| 2009– 2010 |
2010– 2011 |
2011– 2012 |
2012– 2013 |
2013– 2014 |
2014– 2015 |
|
|---|---|---|---|---|---|---|
| (billions of dollars) | ||||||
| September Update budgetary balance |
-55.9 | -45.3 | -27.4 | -19.4 | -11.2 | -5.2 |
| Decisions since the September Update |
-0.1 | -0.5 | -0.1 | -0.1 | -0.1 | -0.1 |
| Impact of economic and fiscal developments |
||||||
| Budgetary revenues | -2.7 | -2.0 | -2.3 | -2.5 | -2.5 | -2.1 |
| Budgetary expenses1 | 5.0 | -1.1 | 1.0 | 1.4 | 1.4 | 0.9 |
| Total economic and fiscal developments |
2.3 | -3.1 | -1.2 | -1.1 | -1.1 | -1.3 |
| Revised status quo budgetary balance |
-53.7 | -48.9 | -28.7 | -20.6 | -12.5 | -6.6 |
| Note: Totals may not add due to rounding. 1 A positive number implies a decrease in spending and an improvement in the budgetary balance. A negative number implies an increase in spending and a deterioration in the budgetary balance. |
||||||
The status quo budgetary balance (before actions in this budget) has been revised to deficits of $53.7 billion in 2009–10, $48.9 billion in 2010–11, $28.7 billion in 2011–12, $20.6 billion in 2012–13, $12.5 billion in 2013–14 and $6.6 billion in 2014–15.
The revision reflects both the cost of decisions taken by the Government since the September Update and the impact of economic changes.
The cost of decisions taken since the September Update amount to $500 million in 2010–11 and $100 million per year in 2009–10 as well as in 2011–12, 2012–13, 2013–14 and 2014–15. These costs include the Government's December 2009 commitment to provide one-time protection payments to Newfoundland and Labrador, Prince Edward Island, Nova Scotia, New Brunswick, Manitoba and Saskatchewan totalling $525 million. This measure ensures that no province experiences a decline in its combined entitlements under the Canada Health Transfer, Canada Social Transfer and Equalization in 2010–11. In addition, it reflects the fiscal impact of the extension of certain Employment Insurance benefits to the self-employed, funding for repairs to the Atomic Energy of Canada Limited's isotope facility, and an increase to the pension surplus threshold. Additional funds have also been provided for the ecoENERGY Retrofit – Homes program.
While the economic outlook has been revised up in the near term, revenues have been weaker than expected to date in 2009–10. As well, a lower than projected take-up in the Insured Mortgage Purchase Program (IMPP) has lowered projected interest earnings of the Government. This results in a corresponding reduction in debt charges. As a result, revenues are projected to be somewhat lower than projected in the September Update through 2014–15. Revenues are revised down by $2.7 billion in 2009–10, $2.0 billion in 2010–11, $2.3 billion in 2011–12, $2.5 billion in 2012–13, $2.5 billion in 2013–14 and $2.1 billion in 2014–15.
In 2009–10 budgetary expenses, which include program expenses and public debt charges, are projected to be $5.0 billion below the level estimated in the September Update. This results from a change in the profile of Economic Action Plan spending, as some spending initially planned for 2009–10 is now expected to take place in 2010–11. In addition, savings have been realized due to the upward valuation of the General Motors of Canada Inc. shares the Government acquired as part of its support to the auto industry. In 2010–11, budgetary expenses are projected to be higher than projected at the time of the September Update, largely reflecting the shift of some spending under the Economic Action Plan into 2010–11. Starting in 2011–12, budgetary expenses are projected to be lower than projected at the time of the September 2009 Update. This is due to significantly lower projected debt charges, which more than offset higher projected Employment Insurance (EI) benefits (reflecting higher average benefits and the extension of certain EI benefits to the self-employed). Lower projected public debt charges reflect both lower forecast interest rates and a lower projected take-up of the IMPP.
In total, economic and fiscal developments since the September Update have led to a decrease of $2.3 billion in the projected budgetary deficit for 2009–10, and to projected increases in the budgetary deficit of $3.1 billion in 2010–11, $1.2 billion in 2011–12, $1.1 billion in 2012–13, $1.1 billion in 2013–14 and $1.3 billion in 2014–15.
Fiscal Cost of Measures Proposed in Budget 2010
Table 4.2.2 sets out the impact of measures proposed in this budget. The reductions proposed in Budget 2010 result in cumulative savings of $17.6 billion over five years.
| 2009– 2010 |
2010– 2011 |
2011– 2012 |
2012– 2013 |
2013– 2014 |
2014– 2015 |
|
|---|---|---|---|---|---|---|
| (billions of dollars) | ||||||
| Status quo budgetary balance (before budget measures) |
-53.7 | -48.9 | -28.7 | -20.6 | -12.5 | -6.6 |
| Return to budget balance—savings measures | ||||||
| Restraining growth in National Defence spending |
0.0 | 0.0 | 0.0 | 0.5 | 1.0 | 1.0 |
| International Assistance Envelope | 0.0 | 0.0 | 0.4 | 0.9 | 1.3 | 1.8 |
| Containing the administrative cost of government |
0.0 | 0.3 | 0.9 | 1.8 | 1.8 | 2.0 |
| 2009 strategic reviews | 0.0 | 0.2 | 0.2 | 0.3 | 0.3 | 0.3 |
| Tax fairness—closing tax loopholes | 0.0 | 0.4 | 0.4 | 0.5 | 0.6 | 0.6 |
| Subtotal—savings measures | 0.0 | 0.8 | 2.0 | 4.0 | 5.0 | 5.8 |
| Measures proposed in this budget1 | ||||||
| Building on a strong economic foundation | -0.1 | -0.9 | -0.6 | -0.7 | -0.8 | -0.7 |
| Supporting Families and Communities and Standing Up for Those Who Helped Build Canada |
0.0 | -0.2 | -0.3 | -0.2 | -0.2 | -0.2 |
| Subtotal—policy measures | -0.1 | -1.1 | -0.9 | -0.9 | -1.0 | -0.9 |
| Total (net savings) | -0.1 | -0.3 | 1.1 | 3.1 | 4.0 | 4.8 |
| Budgetary balance (after Budget measures) | -53.8 | -49.2 | -27.6 | -17.5 | -8.5 | -1.8 |
| Note: Totals may not add due to rounding. | ||||||
1 A positive number implies a decrease in spending and an improvement in the budgetary balance. A negative number implies an increase in spending and a deterioration in the budgetary balance. |
||||||
Savings proposals are designed to build over the medium term as the economy recovers. The cost of proposed new policy measures totals $1.1 billion in 2010–11 and about $0.9 billion per year thereafter.
As a result of the expiration of the Economic Action Plan and the measures in this budget, the deficit is projected to decline by almost half over the next two years, to $27.6 billion in 2011–12, and by two-thirds to $17.5 billion in 2012–13. In 2014–15, the deficit is projected to be $1.8 billion.
Summary Statement of Transactions
Table 4.2.3 provides a summary of the Government's financial position, including the cost of measures and the savings proposed in Budget 2010.
Expressed as a share of the economy, budgetary revenues are projected to increase from a low of 14.0 per cent of GDP in 2009–10 to 15.2 per cent of GDP in 2014–15. This increase reflects the impact of the economic recovery. In contrast, savings measures proposed in this budget are expected to lower the ratio of program spending to GDP from 15.6 per cent in 2009–10 to 13.2 per cent in 2014–15. As a result, the federal deficit is projected to be 0.1 per cent of GDP in 2014–15.
The federal debt-to-GDP ratio (accumulated deficit) stood at 29.0 per cent in 2008–09, down significantly from its peak of 68.4 per cent in 1995–96. The debt ratio is expected to increase to 35.4 per cent in 2010–11, the second year of the Economic Action Plan, before declining steadily to 31.9 per cent in 2014–15.
| Projection | |||||||
|---|---|---|---|---|---|---|---|
| 2008– 2009 |
2009– 2010 |
2010– 2011 |
2011– 2012 |
2012– 2013 |
2013– 2014 |
2014– 2015 |
|
| (billions of dollars) | |||||||
| Budgetary revenues | 233.1 | 213.9 | 231.3 | 249.0 | 266.5 | 282.7 | 296.5 |
| Program expenses | 207.9 | 237.8 | 249.2 | 241.4 | 245.2 | 251.4 | 257.7 |
| Public debt charges | 31.0 | 29.9 | 31.3 | 35.3 | 38.9 | 39.8 | 40.6 |
| Total expenses | 238.8 | 267.7 | 280.5 | 276.7 | 284.0 | 291.2 | 298.3 |
| Budgetary balance | -5.8 | -53.8 | -49.2 | -27.6 | -17.5 | -8.5 | -1.8 |
| Federal debt | 463.7 | 517.5 | 566.7 | 594.3 | 611.9 | 620.3 | 622.1 |
| Per cent of GDP | |||||||
| Budgetary revenues | 14.6 | 14.0 | 14.4 | 14.8 | 15.0 | 15.2 | 15.2 |
| Program expenses | 13.0 | 15.6 | 15.6 | 14.3 | 13.8 | 13.5 | 13.2 |
| Public debt charges | 1.9 | 2.0 | 2.0 | 2.1 | 2.2 | 2.1 | 2.1 |
| Budgetary balance | -0.4 | -3.5 | -3.1 | -1.6 | -1.0 | -0.5 | -0.1 |
| Federal debt | 29.0 | 33.9 | 35.4 | 35.2 | 34.4 | 33.3 | 31.9 |
| Note: Totals may not add due to rounding. | |||||||
Outlook for Budgetary Revenues
| Projection | |||||||
|---|---|---|---|---|---|---|---|
| 2008– 2009 |
2009– 2010 |
2010– 2011 |
2011– 2012 |
2012– 2013 |
2013– 2014 |
2014– 2015 |
|
| (billions of dollars) | |||||||
| Income taxes | |||||||
| Personal income tax | 116.0 | 108.2 | 117.0 | 124.5 | 133.3 | 141.9 | 150.6 |
| Corporate income tax | 29.5 | 22.3 | 25.5 | 28.9 | 29.5 | 31.6 | 33.2 |
| Non-resident income tax | 6.3 | 4.9 | 5.5 | 5.9 | 6.4 | 6.9 | 7.0 |
| Total income tax | 151.8 | 135.4 | 148.0 | 159.4 | 169.3 | 180.3 | 190.8 |
| Excise taxes/duties | |||||||
| Goods and Services Tax | 25.7 | 25.8 | 27.3 | 28.8 | 30.5 | 32.1 | 33.7 |
| Customs import duties | 4.0 | 3.4 | 3.4 | 3.5 | 3.7 | 3.8 | 4.1 |
| Other excise taxes/duties | 10.0 | 10.1 | 10.3 | 10.3 | 10.3 | 10.3 | 10.4 |
| Total excise taxes/duties | 39.8 | 39.3 | 41.0 | 42.7 | 44.4 | 46.3 | 48.3 |
| Total tax revenues | 191.6 | 174.7 | 188.9 | 202.0 | 213.7 | 226.6 | 239.1 |
| Employment Insurance premium revenues | 16.9 | 16.6 | 17.6 | 20.0 | 22.6 | 25.2 | 26.6 |
| Other revenues | 24.6 | 22.6 | 24.8 | 27.0 | 30.3 | 30.8 | 30.8 |
| Total budgetary revenues | 233.1 | 213.9 | 231.3 | 249.0 | 266.5 | 282.7 | 296.5 |
| Per cent of GDP | |||||||
| Personal income tax | 7.3 | 7.1 | 7.3 | 7.4 | 7.5 | 7.6 | 7.7 |
| Corporate income tax | 1.8 | 1.5 | 1.6 | 1.7 | 1.7 | 1.7 | 1.7 |
| Goods and Services Tax | 1.6 | 1.7 | 1.7 | 1.7 | 1.7 | 1.7 | 1.7 |
| Total tax revenues | 12.0 | 11.4 | 11.8 | 12.0 | 12.0 | 12.2 | 12.2 |
| Employment Insurance premium revenues | 1.1 | 1.1 | 1.1 | 1.2 | 1.3 | 1.4 | 1.4 |
| Other revenues | 1.5 | 1.5 | 1.5 | 1.6 | 1.7 | 1.7 | 1.6 |
| Total | 14.6 | 14.0 | 14.4 | 14.8 | 15.0 | 15.2 | 15.2 |
| Note: Totals may not add due to rounding | |||||||
Personal income tax revenues—the largest component of budgetary revenues—are projected to decline by $7.8 billion, or 6.7 per cent, to $108.2 billion in 2009–10. This primarily reflects the impact of tax relief measures, notably the increases in the basic personal amount and personal income tax bracket thresholds, the enhancement of the Working Income Tax Benefit and the Home Renovation Tax Credit, as well as the impact of the weaker economy. Personal income tax revenues are projected to rise by 8.1 per cent in 2010–11, reflecting the resumption of growth in personal income, as well as the end of the Home Renovation Tax Credit. From 2011–12 onwards, personal income tax revenues are projected to grow on average by 6.5 per cent per year, reflecting the progressive nature of the income tax system combined with growth in the personal income tax base.
Corporate income tax revenues are expected to decline by $7.2 billion, or 24.3 per cent, to $22.3 billion in 2009–10, reflecting a projected decline in corporate profits, refunds of taxes paid in previous years and a 0.5-percentage-point reduction in the general corporate income tax rate in 2009. Corporate income tax revenues are projected to increase by 14.1 per cent in 2010–11 and 13.7 per cent in 2011–12, lifted by a recovery in profits, but partly offset by the carry-forward of losses recorded during the recession, as well as ongoing tax relief. Growth in corporate income tax revenues is projected to moderate to 2.0 per cent in 2012–13, largely due to the decline in the general corporate income tax rate to 15 per cent in 2012 and other tax relief measures, as well as a moderation in profit growth. Growth in corporate income tax revenues is projected to average 6.0 per cent in 2013–14 and 2014–15.
Non-resident income tax revenues are expected to decline by 22.3 per cent to $4.9 billion in 2009–10, reflecting the drop in corporate profits in 2009, as well as the impact of the phase-out of the withholding tax on non-arm's length payments of interest to the U.S. under the Fifth Protocol to the Canada-U.S. Tax Treaty. Non-resident income tax revenues are projected to rise by 13.3 per cent in 2010–11 as the economy recovers, and then to grow at an average rate of 6.2 per cent over the remainder of the forecast period.
Goods and Services Tax (GST) revenues are projected to be flat in 2009–10, reflecting weak growth in consumption. Consistent with a projected recovery in consumption in 2010–11, growth in GST revenues is projected to average 5.5 per cent over the remainder of the projection period.
Customs import duties are projected to decline by 15.4 per cent to $3.4 billion in 2009–10, reflecting a decline in imports combined with tariff relief for machinery and equipment announced in Budget 2009. Customs import duties are projected to decline a further 1.4 per cent in 2010–11, reflecting tariff relief on manufacturing inputs and machinery and equipment announced in this budget. Growth in customs import duties is projected to average 5.3 per cent through 2014–15.
Other excise taxes and duties are projected to rise by 0.6 per cent to $10.1 billion in 2009–10, and then rise to $10.3 billion in 2010–11.
Employment Insurance (EI) premium revenues are projected to decline by 1.6 per cent in 2009–10, reflecting a decline in employment. The EI premium rate was kept stable in 2009 and 2010 at $1.73 per $100 of insurable earnings. When the temporary freeze of EI premiums is lifted in 2011, premium rates will be set by an independent arm's length Crown corporation, the Canada Employment Insurance Financing Board (CEIFB). Under the EI financing regime passed into law in Budget 2008, the CEIFB will set EI premium rates in order to balance the EI program over time, subject to a 15-cent limit on annual changes. Based on current economic projections, it is expected that the deficits incurred by the EI program during the recession will be paid back by 2014. Consistent with the Government's commitment in Budget 2009, the CEIFB will not be mandated to recover any EI deficits resulting from the $2.9 billion in benefit enhancements announced in Budget 2009.
Other revenues include those of consolidated Crown corporations, net gains/losses from enterprise Crown corporations, foreign exchange revenues, returns on investments and revenues from the sales of goods and services. These revenues are volatile, owing partly to the impact of exchange rate movements on the Canadian-dollar value of foreign-denominated interest-bearing assets and to net gains/losses from enterprise Crown corporations. Other revenues are projected to decline by 8.1 per cent in 2009–10, due in part to a decline in revenues under the Atlantic Offshore Revenue Accounts, reflecting lower oil prices as well as a decline in offshore production. This decline in revenues is offset by a corresponding decline in projected transfers to Newfoundland and Labrador and Nova Scotia under the Atlantic Offshore Accords, such that there is no net impact on the budgetary balance. Other revenues are projected to rise by 9.6 per cent in 2010–11, by 9.0 per cent in 2011–12 and by 12.1 per cent in 2012–13, largely reflecting rising interest rates, along with measures introduced in this budget to reduce the interest rate paid by the Government on tax overpayments by corporations. Other revenue growth is then projected to slow to 1.8 per cent in 2013–14 and remain largely unchanged in 2014–15, reflecting the winding down of the Insured Mortgage Purchase Program.
The revenue projections include foregone revenues of $12 million over two years due to the extension by one year, to May 2011, of the current fee waiver for firearms licence renewals or upgrades.
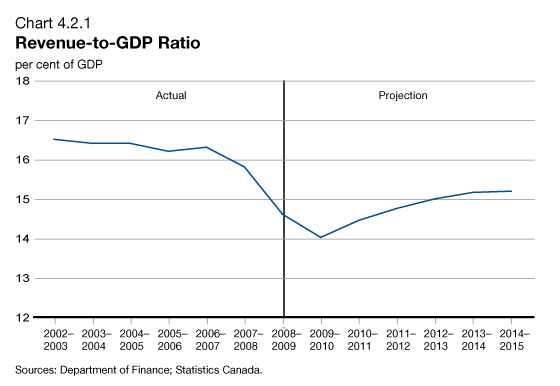
Chart 4.2.1 shows that revenues as a share of GDP are projected to fall to 14.0 per cent in 2009–10. The projected decline in the revenue ratio reflects tax relief measures announced in previous budgets, as well as the impact of automatic fiscal stabilizers, which lower collections when the economy slows in order to dampen the impact of the recession. The revenue ratio is expected to increase to 15.2 per cent in 2014–15 as the economy recovers.
Outlook for Program Expenses
| Projection | |||||||
|---|---|---|---|---|---|---|---|
| 2008– 2009 |
2009– 2010 |
2010– 2011 |
2011– 2012 |
2012– 2013 |
2013– 2014 |
2014– 2015 |
|
| (billions of dollars) | |||||||
| Major transfers to persons | |||||||
| Elderly benefits | 33.4 | 35.0 | 36.7 | 38.6 | 40.7 | 42.9 | 45.2 |
| Employment Insurance benefits1 | 16.3 | 22.4 | 22.6 | 19.6 | 18.8 | 18.4 | 18.4 |
| Children's benefits | 11.9 | 12.3 | 12.7 | 13.2 | 13.4 | 13.4 | 13.5 |
| Total | 61.6 | 69.7 | 72.0 | 71.4 | 72.9 | 74.8 | 77.1 |
| Major transfers to other levels of government |
|||||||
| Federal transfers in support of health and social programs |
33.3 | 35.7 | 37.1 | 38.7 | 40.7 | 42.7 | 44.7 |
| Fiscal arrangements2 | 15.2 | 16.1 | 16.4 | 16.8 | 17.7 | 18.6 | 19.5 |
| Alternative Payments for Standing Programs |
-3.0 | -2.7 | -2.9 | -3.1 | -3.3 | -3.5 | -3.7 |
| Canada's cities and communities | 1.0 | 2.0 | 2.0 | 2.0 | 2.0 | 2.0 | 2.0 |
| Other3 | 0.0 | 0.3 | 4.3 | 1.9 | 0.0 | 0.0 | 0.0 |
| Total | 46.5 | 51.4 | 56.8 | 56.3 | 57.1 | 59.8 | 62.4 |
| Direct program expenses | |||||||
| Transfer payments | 30.2 | 39.8 | 39.4 | 33.7 | 33.6 | 32.8 | 32.1 |
| Capital amortization | 4.1 | 4.4 | 4.6 | 4.9 | 5.1 | 5.3 | 5.4 |
| Other operating expenses | 20.6 | 20.8 | 21.5 | 22.9 | 24.2 | 25.2 | 25.8 |
| Operating expenses subject to freeze |
44.9 | 51.8 | 54.9 | 52.2 | 52.4 | 53.5 | 54.8 |
| Total | 99.8 | 116.8 | 120.4 | 113.7 | 115.2 | 116.7 | 118.2 |
| Total program expenses | 207.9 | 237.8 | 249.2 | 241.4 | 245.2 | 251.4 | 257.7 |
| Per cent of GDP | |||||||
| Major transfers to persons | 3.8 | 4.6 | 4.5 | 4.2 | 4.1 | 4.0 | 3.9 |
| Major transfers to other levels of government |
2.9 | 3.4 | 3.5 | 3.3 | 3.2 | 3.2 | 3.2 |
| Direct program expenses | 6.2 | 7.6 | 7.5 | 6.7 | 6.5 | 6.3 | 6.1 |
| Total program expenses | 13.0 | 15.6 | 15.6 | 14.3 | 13.8 | 13.5 | 13.2 |
| Note: Totals may not add due to rounding | |||||||
| 1 EI benefits include EI regular benefits, sickness, maternity, parental, compassionate care, fishing and work-sharing benefits, and employment benefits and support measures. These represent 90 per cent of total EI program expenses. The remaining EI costs relate mainly to administration costs. | |||||||
| 2 Fiscal arrangements include Equalization, Territorial Formula Financing, the Youth Allowances Recovery and statutory subsidies. | |||||||
| 3 Includes transfer protection and transitional payments. | |||||||
Table 4.2.5 provides an overview of the projections for program expenses by major component, including the cost of measures proposed in this budget. Program expenses consist of major transfers to persons, major transfers to other levels of government and direct program expenses.
Major transfers to persons consist of elderly, Employment Insurance (EI) and children's benefits.
Growth in elderly benefits, which include Old Age Security and the Guaranteed Income Supplement, is expected to average about 5 per cent annually over the planning period due to increases in the seniors' population and consumer price inflation, to which benefits are fully indexed. The Government makes ongoing efforts to ensure that all those who are eligible for these programs receive payments.
EI benefits are projected to increase by 37.2 per cent to $22.4 billion in 2009–10. This large increase is due to higher unemployment, growth in average weekly benefits, and significant measures to support Canadians affected by the recession. These measures include enhanced EI benefits, a significant increase in funding for training, and the temporary extension of benefits for long-tenured workers enacted on October 25, 2009. EI benefits are projected to remain high in 2010–11, at $22.6 billion, as a small decline in unemployment is largely offset by an increase in costs associated with the extension of benefits for long-tenured workers. EI benefits are projected to decline by 13.2 per cent in 2011–12, as the level of unemployment declines and as the temporary enhancements under the Economic Action Plan are phased out. EI benefits are projected to decline gradually over the remainder of the projection period.
Children's benefits, including the Canada Child Tax Benefit and the Universal Child Care Benefit, are projected to increase moderately over the forecast horizon, largely reflecting increases to the National Child Benefit supplement and Canada Child Tax Benefit related to Budget 2009 measures and projected temporary reductions in personal income.
Major transfers to other levels of government include transfers in support of health and social programs as well as Equalization. Transfers are projected to grow at current legislated rates over the forecast period. Also included in major transfers are amounts for transitional assistance for the provinces of Ontario and British Columbia, related to their respective decisions to adopt the Harmonized Sales Tax framework.
Direct program expenses include operating expenses for National Defence and other departments, transfers administered by departments for farm income support, natural resource royalties paid to provinces, student financial assistance and expenses of Crown corporations. The projected growth in direct program expenses reflects the impact of past budget measures, as well as initiatives announced in Budget 2010.
Within direct program expenses, transfers administered by departments are projected to decline over the projection period. This reflects the expiration of Economic Action Plan measures and changes to the International Assistance Envelope proposed in this budget.
Expenses for capital projects are not being constrained in this budget. Amounts for capital expenses are presented on an accrual basis. The Government will carefully manage capital expenses and capital assets. However, in general and as a matter of principle, the Government will not run down the stock of capital assets to eliminate the deficit, as this only results in deferring spending to future years.
Other direct program expenses include costs for employee pensions and other benefits, non-wage expenses of National Defence and accrual amounts for items such as the allowance for bad debt. Employee pension and other benefits are not subject to the general operating budget freeze. However, as noted above, the Government will continue to examine ways in which these costs can be better managed and will engage with public sector bargaining agents to ensure that total costs of compensation are reasonable. The National Defence budget is being adjusted as described above.
As described earlier in this chapter, operating budgets of departments and Crown corporations, as appropriated by Parliament, are being adjusted in 2010–11 and then frozen at 2010–11 levels for both 2011–12 and 2012–13. The budgetary impact of the operating budget freeze is shown in Table 4.1.1.
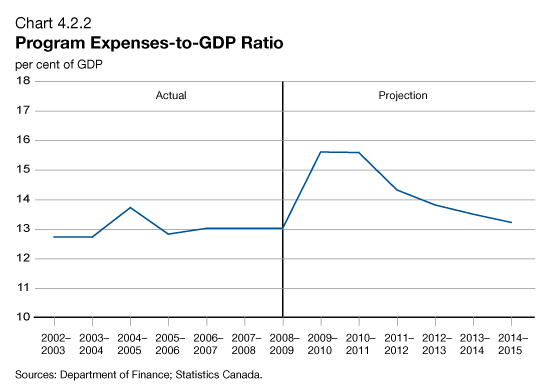
Chart 4.2.2 shows program expenses as a share of GDP. The Economic Action Plan will strengthen Canada's economy and support Canadians, and will result in a temporary increase in the program expenses-to-GDP ratio.
The Government remains committed to focused and disciplined spending, and will ensure that spending as a share of GDP, after 2010–11, declines over the medium term. As a result of the actions taken in this budget, average annual growth in direct program spending after the expiry of the Economic Action Plan will slow to 1.3 per cent.
In 2014–15, the program expenses-to-GDP ratio is projected to fall to about 13 per cent. This would bring the program spending ratio in line with spending ratios in the 2006–07 to 2008–09 period. Achieving this would also be consistent with the Government's commitment in Advantage Canada to keep the rate of growth in program spending, on average, below the rate of growth in the economy.
Financial Source/Requirement
The budgetary balance is presented on a full accrual basis of accounting, recording government liabilities and assets when they are incurred or acquired, regardless of when the cash is paid or received.
In contrast, the financial source/requirement measures the difference between cash coming in to the Government and cash going out. This measure is affected not only by the budgetary balance but also by the Government's non-budgetary transactions. These include changes in federal employee pension accounts; changes in non-financial assets; investing activities through loans, investments and advances; changes in other financial assets and liabilities; and foreign exchange activities.
| Projection | |||||||
|---|---|---|---|---|---|---|---|
| 2008– 2009 |
2009– 2010 |
2010– 2011 |
2011– 2012 |
2012– 2013 |
2013– 2014 |
2014– 2015 |
|
| (billions of dollars) | |||||||
| Budgetary balance | -5.8 | -53.8 | -49.2 | -27.6 | -17.5 | -8.5 | -1.8 |
| Non-budgetary transactions | |||||||
| Pensions and other accounts | 5.0 | 5.6 | 5.6 | 5.4 | 5.0 | 4.7 | 4.5 |
| Non-financial assets | -2.9 | -3.3 | -3.6 | -3.3 | -3.3 | -3.1 | -2.8 |
| Loans, investments and advances | |||||||
| Enterprise Crown corporations | -20.0 | -28.3 | -6.3 | -5.4 | -3.7 | -5.6 | -5.9 |
| Insured Mortgage Purchase Program | -54.2 | -9.0 | 4.5 | 3.3 | 2.4 | 40.2 | 12.8 |
| Other | -0.3 | 3.7 | -0.7 | -0.5 | -0.4 | -0.3 | -0.3 |
| Total | -74.5 | -33.6 | -2.6 | -2.7 | -1.7 | 34.3 | 6.6 |
| Other transactions | -11.9 | 14.0 | 5.2 | 5.2 | 3.9 | 6.7 | 3.2 |
| Total | -84.3 | -17.3 | 4.6 | 4.6 | 3.9 | 42.6 | 11.5 |
| Financial source/requirement | -90.1 | -71.1 | -44.6 | -23.0 | -13.6 | 34.1 | 9.7 |
| Note: Totals may not add due to rounding. | |||||||
As shown in Table 4.2.6, significant financial requirements are projected from 2009–10 to 2012–13 ($71.1 billion in 2009–10, $44.6 billion in 2010–11, $23.0 billion in 2011–12 and $13.6 billion in 2012–13), followed by financial sources of $34.1 billion in 2013–14 and $9.7 billion in 2014–15. The requirements mainly reflect the budgetary balance. Financial requirements also arise because of direct lending to certain Crown corporations and government initiatives to support access to financing under the Extraordinary Financing Framework.
The large increase in market debt associated with the Insured Mortgage Purchase Program does not affect federal debt or the federal government's net debt as the borrowings are offset by an increase in revenue-earning assets. Other borrowings undertaken to strengthen the financial system are also offset by interest-earning assets.
The financial source associated with pensions and other accounts is expected to be $5.6 billion in 2009–10. Pensions and other accounts include the activities of the Government of Canada's employee superannuation plans, as well as those of federally appointed judges and Members of Parliament. Since April 2000, the net amount of contributions less benefit payments related to post-March 2000 service has been invested in capital markets. Contributions and payments pertaining to pre-April 2000 service are recorded in the pension accounts. The Government also sponsors a variety of future benefit plans, such as health care and dental plans and disability and other benefits for war veterans and others.
Financial requirements for non-financial assets include the cash outlay for the acquisition of new tangible capital assets, proceeds from the net losses or gains of tangible capital assets, the amortization of existing tangible assets, losses on the disposal of tangible capital assets, the change in inventories, and prepaid expenses. In the calculation of the budgetary balance, the acquisition of new capital assets is not included; only the amortization of existing tangible assets is included. In the calculation of the financial source/requirement, this is reversed. A net cash requirement of $3.3 billion is estimated for 2009–10.
Loans, investments and advances include the Government's investments in enterprise Crown corporations, such as Canada Mortgage and Housing Corporation (CMHC), Canada Post Corporation, Export Development Canada and the Business Development Bank of Canada (BDC). They also include loans, investments and advances to national and provincial governments and international organizations, and for government programs. The requirements projected from 2009–10 to 2012–13 under this category are the result of the Government's decision to purchase mortgages under the Insured Mortgage Purchase Program of CMHC. The increase in loans also reflects the Government's commitment to meet all the borrowing needs of CMHC, BDC and Farm Credit Canada through direct lending in order to reduce overall borrowing costs and support a well-functioning Government of Canada securities market.
Risks to the Fiscal Projections
Risks associated with the fiscal projections primarily relate to risks to the Canadian economic outlook and volatility in the relationship between fiscal variables and the underlying economic activity to which they relate.
Tables illustrating the sensitivity of the budget balance to a number of economic shocks are provided later in this chapter. These tables are generalized rules of thumb that provide a guide to the impact of changes in economic assumptions on the fiscal projections. Even if the economic outlook were known with certainty, there would still be risks associated with the fiscal projections because of the uncertainty in the translation of economic developments into spending and tax revenues. The following are the key sources of uncertainty:
- The corporate income tax projections in this chapter assume a sharp rise in corporate losses. The income tax system allows corporations to use certain losses to reduce taxable income in the 3 preceding years or the 20 following years. As a result, there is considerable uncertainty around the timing of the application of these losses, in addition to uncertainty as to the size of the losses.
- There is considerable uncertainty around the timing of the recovery in markets following the sharp decline in the S&P/TSX Composite Index over the latter months of 2008 and early 2009. In addition, there is significant uncertainty as to how these fluctuations in the market will affect market-related income and, in turn, personal and corporate income tax revenues.
- On the expense side, the extent to which departments and agencies do not fully use all of the resources appropriated by Parliament varies from year to year and can materially affect the fiscal outcome. In addition, during the course of the fiscal year, departments and agencies often incur liabilities for which no payments are made. These liabilities are recognized throughout the year and are updated following the close of the fiscal year as part of the normal year-end accrual adjustments. Changes in estimates of liabilities can be significant.
Sensitivity of the Budget Balance to Economic Shocks
Changes in economic assumptions affect the projections for revenues and expenses. The following tables illustrate the sensitivity of the budgetary balance to a number of economic shocks:
- A one-year, 1-percentage-point decrease in real GDP growth driven equally by lower productivity and employment growth.
- A decrease in nominal GDP growth resulting solely from a one-year, 1-percentage-point decrease in the rate of GDP inflation.
- A sustained 100-basis-point increase in all interest rates.
These sensitivities are generalized rules of thumb that assume any decrease in economic activity is proportional across income and expenditure components.
| Year 1 | Year 2 | Year 5 | |
|---|---|---|---|
| (billions of dollars) | |||
| Federal revenues | |||
| Tax revenues | |||
| Personal income tax | -1.7 | -1.8 | -2.2 |
| Corporate income tax | -0.3 | -0.4 | -0.4 |
| Goods and Services Tax | -0.3 | -0.3 | -0.4 |
| Other | -0.2 | -0.2 | -0.3 |
| Total tax revenues | -2.5 | -2.7 | -3.3 |
| Employment Insurance premiums | -0.1 | -0.2 | -0.3 |
| Other revenues | 0.0 | 0.0 | 0.0 |
| Total budgetary revenues | -2.6 | -2.9 | -3.6 |
| Federal expenses | |||
| Major transfers to persons | |||
| Elderly benefits | 0.0 | 0.0 | 0.0 |
| Employment Insurance benefits | 0.6 | 0.6 | 0.7 |
| Children's benefits | 0.0 | 0.0 | 0.0 |
| Total | 0.6 | 0.6 | 0.7 |
| Other program expenses | -0.2 | -0.2 | -0.4 |
| Public debt charges | 0.0 | 0.1 | 0.5 |
| Total expenses | 0.5 | 0.5 | 0.8 |
| Budgetary balance | -3.1 | -3.4 | -4.4 |
| Note: Numbers may not add due to rounding. | |||
A 1-percentage-point decrease in real GDP growth reduces the budgetary balance by $3.1 billion in the first year, $3.4 billion in the second year and $4.4 billion in the fifth year.
- Tax revenues from all sources fall by a total of $2.5 billion in the first year, $2.7 billion in the second year and $3.3 billion in the fifth year. Personal income tax revenues decrease as employment and wages and salaries fall. Corporate income tax revenues fall as output and profits decrease. GST revenues decrease as a result of lower consumer spending associated with the fall in employment and personal income.
- EI premiums decrease as employment and wages and salaries fall.
- Expenses rise, mainly reflecting higher EI benefits (due to an increase in the number of unemployed) and higher public debt charges (reflecting a higher stock of debt due to the lower budgetary balance).
| Year 1 | Year 2 | Year 5 | |
|---|---|---|---|
| (billions of dollars) | |||
| Federal revenues | |||
| Tax revenues | |||
| Personal income tax | -1.7 | -1.4 | -1.5 |
| Corporate income tax | -0.3 | -0.4 | -0.4 |
| Goods and Services Tax | -0.3 | -0.3 | -0.4 |
| Other | -0.2 | -0.2 | -0.3 |
| Total tax revenues | -2.5 | -2.3 | -2.6 |
| Employment Insurance premiums | -0.1 | -0.2 | -0.3 |
| Other revenues | -0.1 | -0.1 | -0.1 |
| Total budgetary revenues | -2.6 | -2.5 | -2.9 |
| Federal expenses | |||
| Major transfers to persons | |||
| Elderly benefits | -0.2 | -0.4 | -0.5 |
| Employment Insurance benefits | -0.1 | -0.1 | -0.1 |
| Children's benefits | -0.1 | -0.1 | -0.1 |
| Total | -0.4 | -0.6 | -0.7 |
| Other program expenses | -0.4 | -0.4 | -0.8 |
| Public debt charges | -0.3 | 0.0 | 0.2 |
| Total expenses | -1.1 | -0.9 | -1.3 |
| Budgetary balance | -1.6 | -1.5 | -1.6 |
| Note: Numbers may not add due to rounding. | |||
A 1-percentage-point decrease in nominal GDP growth resulting solely from lower GDP inflation (assuming that the Consumer Price Index moves in line with GDP inflation) lowers the budgetary balance by $1.6 billion in the first year, $1.5 billion in the second year and $1.6 billion in the fifth year.
- Lower prices result in lower nominal income and, as a result, personal income tax, corporate income tax and GST revenues all decrease, reflecting declines in the underlying nominal tax bases. For the other sources of tax revenue, the negative impacts are similar under the real and nominal GDP shocks. EI premium revenues decrease marginally in the price shock in response to lower earnings. However, unlike the real GDP shock, EI benefits do not rise since unemployment is unaffected by price changes.
- Partly offsetting lower revenues are the declines in the cost of statutory programs that are indexed to inflation, such as elderly benefit payments and the Canada Child Tax Benefit, as well as federal wage and non-wage expenses. Payments under these programs are smaller if inflation is lower. Public debt charges decline in the first year due to lower costs associated with Real Return Bonds, then rise due to the higher stock of debt.
| Year 1 | Year 2 | Year 5 | |
|---|---|---|---|
| (billions of dollars) | |||
| Federal revenues | 0.9 | 1.1 | 1.4 |
| Federal expenses | 1.9 | 3.1 | 4.4 |
| Budgetary balance | -1.0 | -2.1 | -3.0 |
An increase in interest rates decreases the budgetary balance by $1.0 billion in the first year, $2.1 billion in the second year and $3.0 billion in the fifth year. The decline stems entirely from increased expenses associated with public debt charges. The impact on debt charges rises through time as longer-term debt matures and is refinanced at higher rates. The impact on debt charges also rises due to the higher stock of debt. Moderating the overall impact is an increase in revenues associated with the increase in the rate of return on the Government's interest-bearing assets, which are recorded as part of non-tax revenues. The lower sensitivity to interest rates of expenses and revenues relative to previous estimates reflects decreased borrowing and returns on investments related to the Government's Extraordinary Financing Framework initiatives, notably the Insured Mortgage Purchase Program. The greater sensitivity of the budgetary balance to interest rates reflects the larger budgetary deficit.