
Archived - Chapter 4
A Prudent Fiscal Plan
4.1 Overview
Canada entered this crisis in a strong fiscal position, allowing the government to take decisive action to put in place the support necessary for people and businesses to weather the storm. The investments the government continues to make are ensuring our public health systems are well-funded, securing a safe supply of personal protective equipment (PPE), procuring vaccines and therapeutics and helping Canada avoid an even deeper downturn that would come with widespread business and personal bankruptcies and negatively impact generations of Canadians. Federal investments are also supporting the provinces and territories and the services they deliver to Canadians.
4.1.1 Extraordinary Spending is Time-limited
The government will have Canadians’ backs through this crisis, doing whatever it takes. But this pandemic will not last forever and promising vaccine candidates are a bright light at the end of the tunnel. That means that the government’s fiscally expansive approach to fighting the COVID-19 pandemic need not and will not be infinite. It is limited and temporary. Canadians understand that the crisis demands targeted and time-limited support to keep people and business afloat.
While this extraordinary spending will cause significant deficits in the short term, on par with the scale of effort required to deal with this once-in-a-century kind of crisis, such deficits are distinct from the structural deficits of the 1990s. This is time-limited spending to prevent households from going broke and businesses from laying off workers and permanently shutting their doors. This time-limited spending is essential to ensure that once COVID-19 is under control the economy is able to quickly recover to pre-pandemic levels. The COVID-19 recession is unique in the sense that its origin cannot be traced to any fundamental weakness in the economy. It is the result of an entirely exogenous shock that has hurt Canadians and Canadian businesses through no fault of their own. The government understands that it must step in to support people and sustain that support until the pandemic is over in order to avoid even worse economic outcomes.
4.1.2 Governments Must Continue to Support People
The International Monetary Fund (IMF) has warned governments that premature withdrawal of support would harm livelihoods, increase bankruptcies and jeopardize the recovery. Canada knows that in order to keep permanent economic harm to a minimum and secure a rapid and robust recovery, it must continue to support Canadians throughout the pandemic, particularly as we fight a virulent second wave.
Over the coming months, the government will work to design an investment plan for recovery and growth that will build a stronger, more inclusive and more resilient economy, spending between 3 and 4 per cent of gross domestic product (GDP) over the next three years. Our focus will be supporting Canadians, bringing back the jobs lost to the pandemic and building a more inclusive, more competitive, more productive and greener economy for the 21st century.
Canada has and will continue to manage its finances prudently. The government’s strategy will continue to be tailored to Canada’s evolving economic needs – to support Canadians through the crisis and to provide significant investments for a robust recovery. This strategy will be implemented responsibly, with a sustainable approach for future generations.
4.2 The COVID-19 Recession: A Unique Economic Challenge
The economic shock of COVID-19 is unlike any previous economic crisis. It is the result of a public health emergency that changed our lives overnight. The pandemic has imposed great hardship on Canadians, and has laid bare and even exacerbated inequities that have made certain groups more vulnerable to economic challenges. It is incumbent upon governments to step in with significant support. That’s what the Government of Canada has done since the beginning.
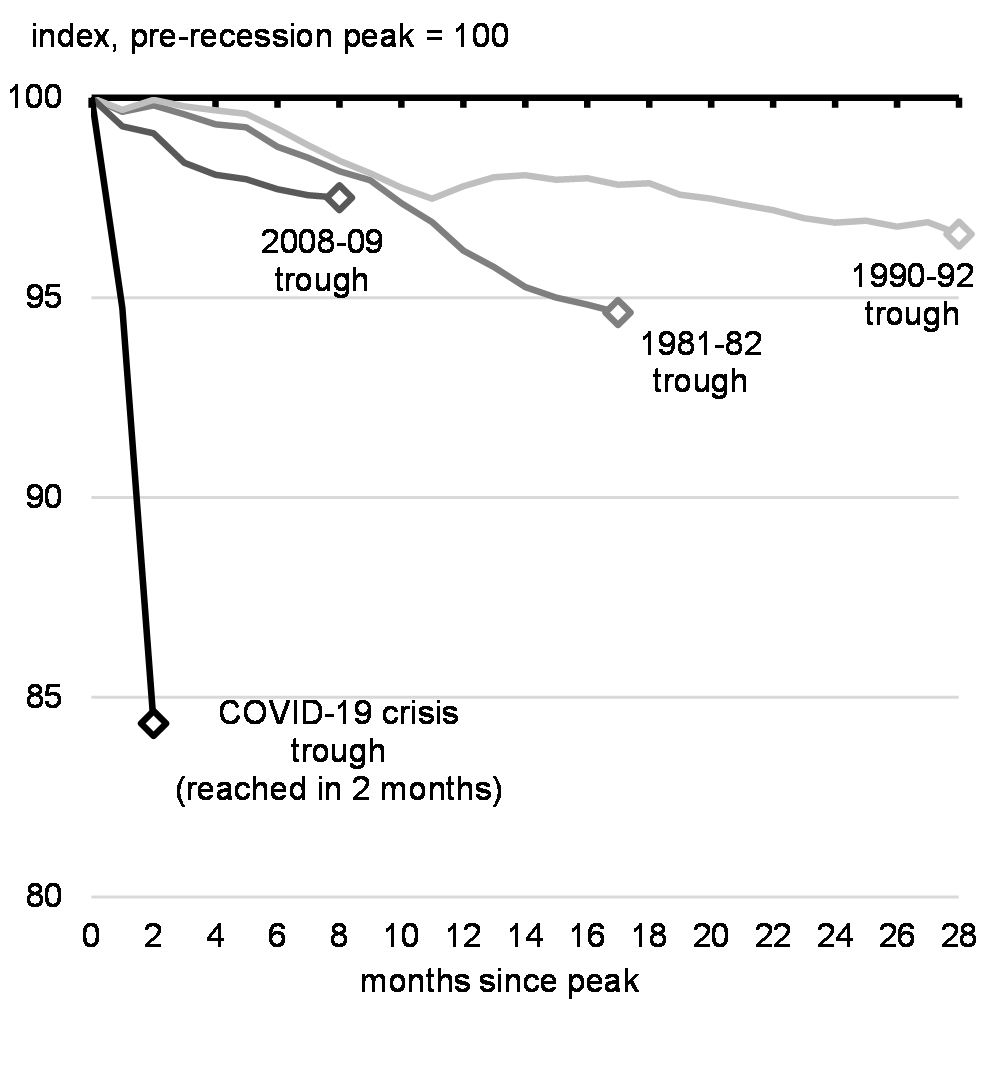
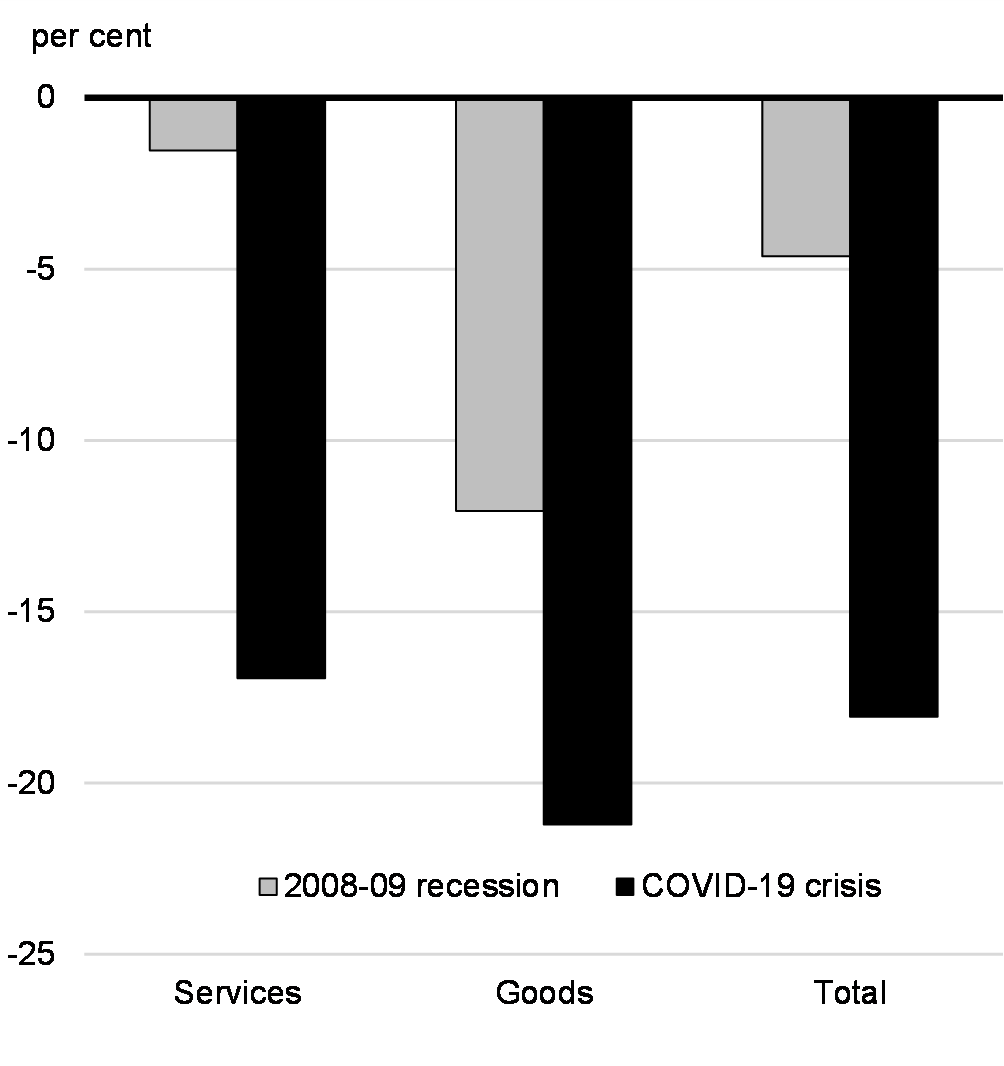
The speed, scale and breadth of the contraction in economic activity during the COVID-19 crisis are unmatched by anything we have seen since the Great Depression. Nearly all sectors of the Canadian economy saw historic declines pushing overall GDP to its deepest fall in 90 years. The economic shock has been both unusually deep and incredibly fast (Chart 4.1). More jobs were lost from mid-March to late April than were created since the end of the 2008 recession. While the crisis has affected nearly all aspects of life, unique to this recession is the large impact on customer-facing service sectors – restaurants, hotels, concert venues, gyms and so forth. In a typical recession, the manufacturing and other trade-oriented goods sector is hardest hit and the decline in demand is offset by the more stable service sector. By contrast, pandemic conditions have made it very difficult for customer-facing service sectors to operate (Chart 4.2). Small businesses have also been particularly affected. Employment losses were disproportionately felt in accommodation, food services and culture and recreation industries, which disproportionately employ women, young people, racialized Canadians and immigrants.
Time and Path to Employment Trough in Past Recessions
Real GDP Decline from Peak to Trough
4.2.1 Lessons Learned from the Great Recession
There are key lessons from past recessions that can be applied today. The experience of many countries following the 2008-09 global financial crisis, and during recoveries from earlier deep recessions, suggests that economies that withdrew fiscal support too quickly experienced slower growth afterwards. Premature withdrawal of fiscal support would risk allowing recessionary dynamics to become entrenched, holding back employment, increasing scarring from persistent unemployment – particularly for young people whose future career paths would be significantly affected. It also would have an impact on consumer spending and business investment and could lead to more businesses shuttering, ultimately harming productive capacity. The International Monetary Fund and the Organisation for Economic Co-operation and Development have urged governments to maintain substantial fiscal support through the crisis and over the recovery phase, where they have space to do so, including by directly stimulating demand through public investment as a complement to transfer programs aimed at supporting household income.
4.3 Canadian Economic Outlook
The average of private sector economic forecasts has been used as the basis for fiscal planning since 1994; this approach introduces an element of independence into the government’s fiscal forecast. The Department of Finance Canada surveyed a group of private sector economists at the beginning of September. To supplement this, and in recognition of the unique and evolving global economic situation, the department also analyzed alternative scenarios in the event of a more severe resurgence of the virus and its effect on the Canadian economy and public finances. This is described later in this chapter.
Overall, private sector economists revised their outlook in the September 2020 survey compared to the forecast underlying the July Economic and Fiscal Snapshot 2020 (EFS 2020). Private sector economists expected real GDP to decline by 5.8 per cent in 2020, up from the projected drop of 6.8 per cent in EFS 2020, reflecting slightly better-than-expected results in the second quarter and a stronger rebound in the third quarter (see Annex 1 for details). Based on their forecasts at the time, the Canadian economy was expected to continue to recover in 2021, rebounding by 4.8 per cent. The unemployment rate was expected to gradually decline over the forecast horizon from its recent peak of 13.7 per cent in May. In this outlook, and including the better-than-expected increase in job gains in September and October, employment was expected to fully recover by early 2022, about two years after the start of the crisis.
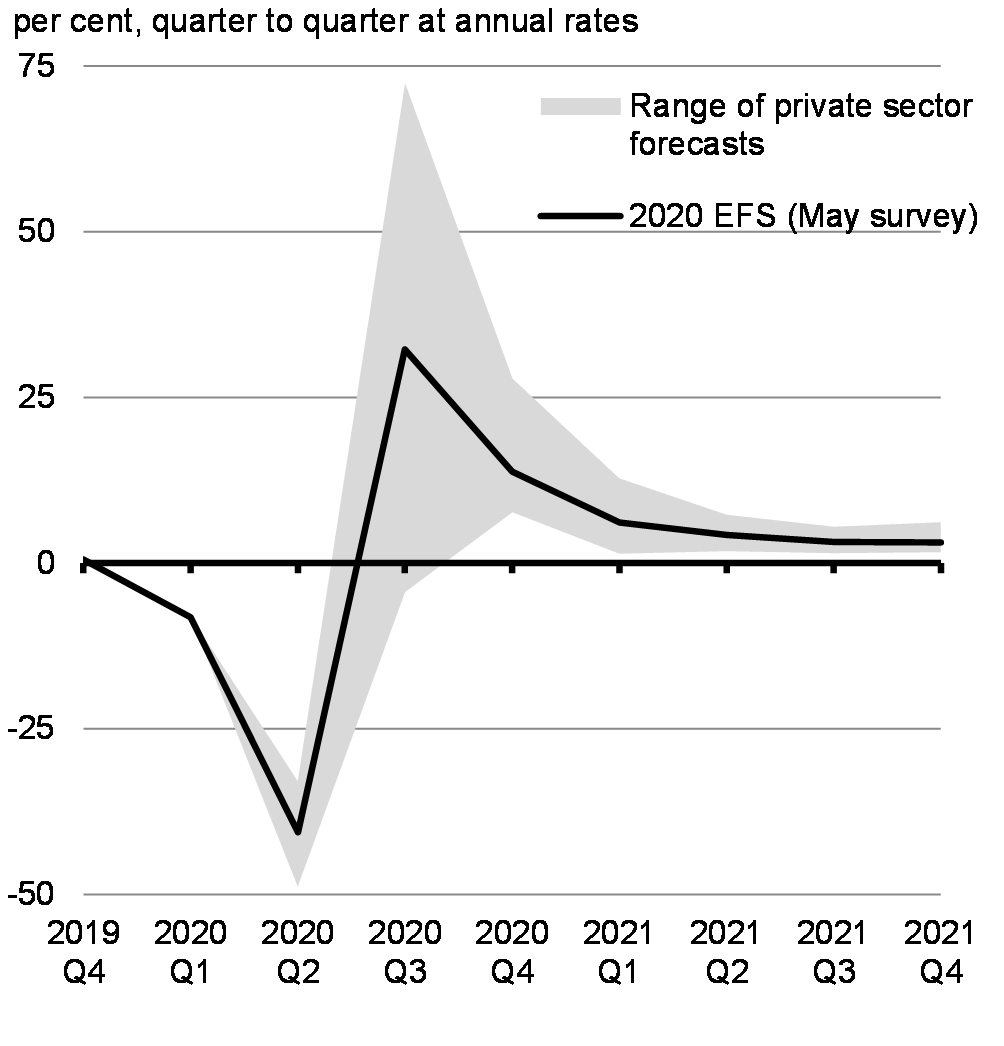
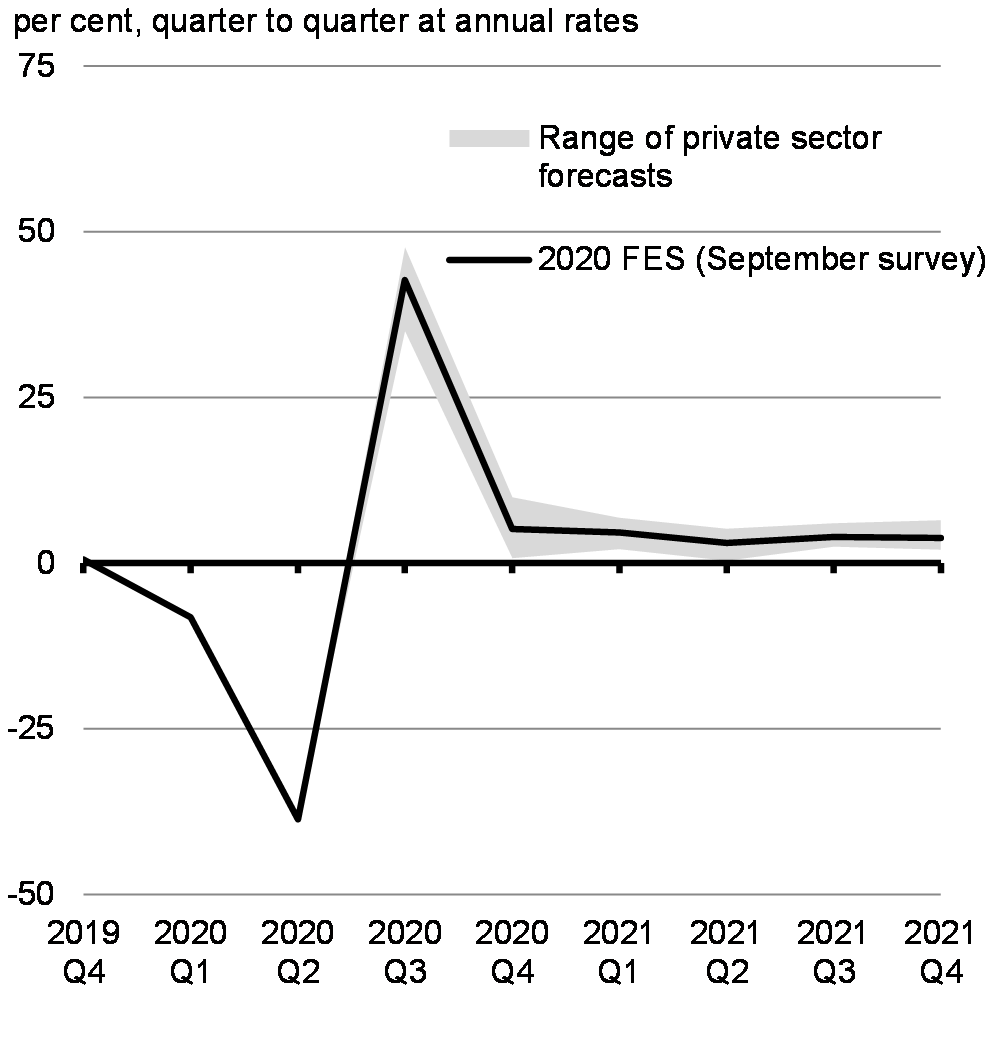
While private sector economists’ views on the magnitude of the rebound in the second half of 2020 diverged widely in EFS 2020 (Chart 4.3) – reflecting tremendous uncertainty around the pace of rehiring and rebound in consumer activity – views in the September 2020 survey were more in line (Chart 4.4).
Range of Private Sector Forecasts for Real GDP Growth: 2020 Economic and Fiscal Snapshot, May 2020 Survey
Range of Private Sector Forecasts for Real GDP Growth: 2020 Fall Economic Statement, September 2020 Survey
4.3.1 The Resurgence of the Virus Introduces New Downside Risks
Thanks to the diligent efforts of Canadians through the spring and summer to control the spread of the virus, and with the help of an unprecedented set of economic support measures, Canada has experienced a faster and stronger rebound than originally forecast in the Economic and Fiscal Snapshot in July. Further, the job recovery has been faster and stronger than that of the United States. But the virulent second wave of the virus this fall and the uncertainty of the path of the virus over the coming months have reduced expectations as we move into 2021.
While the results of the September private sector survey indicate a continuing recovery over the forecast horizon, this outlook is consistent with relatively low levels of ongoing community transmission of the virus. As the recent rise in new case trends in Canada and globally clearly demonstrates, since the September survey was taken we have entered a second wave more severe than forecast by most economists earlier in the year. In this context it is prudent for the government to consider alternative outcomes that take into account the worsening health situation. On the positive side, recent news about the effectiveness of potential COVID-19 vaccines is giving Canadians reason for optimism over the medium term.
The evolution of the pandemic and economic behaviour will continue to intersect and play a crucial role in determining the ultimate path of the recovery. Under a scenario of prolonged economic downturn, permanent damage to the economy could start to emerge. Job losses initially seen as temporary could become more long-lasting, and consumer and business bankruptcies could increase, making the economic recovery more challenging. To illustrate the consequences of different health outcomes and the associated responses of households and businesses, the Department of Finance has considered two alternative scenarios to the projections of the private sector economists: extended restrictions and escalated restrictions.
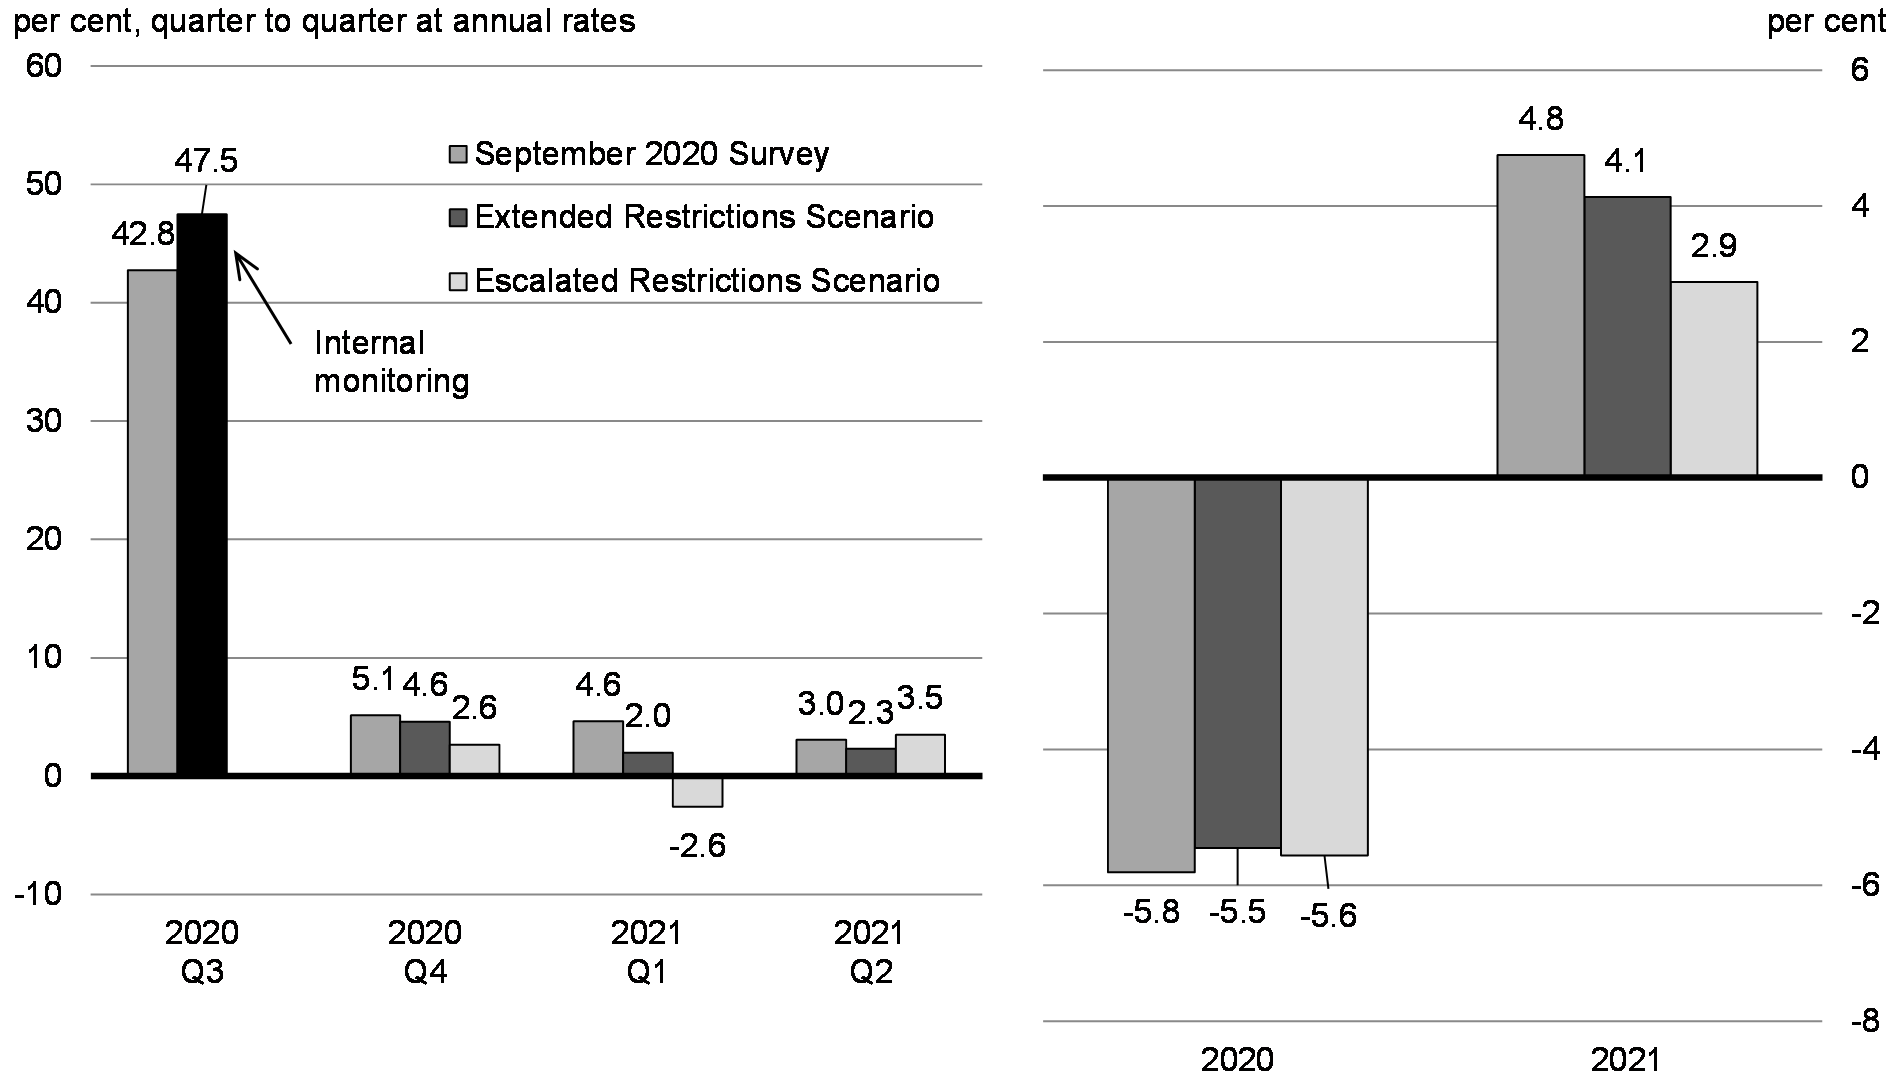
Overall, these scenarios suggest downside risks to the near-term outlook (the next few quarters), with the recovery slowing in the final quarter of 2020 and even possibly declining heading into 2021, reducing the rebound in 2021 to an increase of between 2.9 to 4.1 per cent compared to the 4.8 per cent increase expected in the September survey (Chart 4.5). These scenarios also incorporate better-than-expected data up to the end of the third quarter, but before the onset of the second wave, which was not reported at the time of the September survey. This slower rebound in activity would result in a longer path back to normal absent action to further support the economy.
Real GDP Growth Outlook
Potential Economic Impacts Should Public Health Conditions Decline
The recent surge in COVID-19 cases means that large, resurgent waves of the virus will remain a threat for some time. In the two scenarios considered, the bulk of the impact on the outlook occurs over the short term (the next few quarters). However, in neither case are renewed restrictions expected to produce the dramatic declines in overall economic activity seen in the spring. For most sectors of the economy, the disruption from a second round of restrictions would be less because investments in teleworking tools and equipment made during the initial spring outbreak allow more workers to work from home. Child care centres and schools have prepared to cope with outbreaks and developed a mix of in-person and remote learning options, meaning better outcomes for women, in particular, compared to the spring. Further, many businesses accelerated their shift to online sales, and social distancing and mask guidelines have helped many safely reopen. Moreover, households that experience job losses in the second wave will likely be able to maintain spending on essential items given substantial support from the federal government. This limits how much layoffs in impacted sectors have ripple effects across the broader economy. Likewise, the savings that households built up during the spring lockdowns, from government support and lower spending, can be drawn upon in any second wave scenario for those seeing renewed layoffs.
Virus Resurgence: Extended Restrictions
This scenario considers the economic impact of a series of regional outbreaks. Many of the currently in force regional and targeted restrictions are extended into 2021 but these are limited mainly to high-contact businesses in the food, accommodation, arts and entertainment sectors, and limits on private social gatherings. Schools and child care centres remain open throughout this scenario with only isolated classroom shutdowns in areas with the highest incidence of COVID-19, limiting broader effects on other sectors and especially on women with children.
As rising cases lead to increased hospitalizations and deaths, fear and uncertainty drive consumers to become more cautious, somewhat limiting trips outside the home, and further driving the slowdown in economic activity. Households, particularly those with lower incomes and other vulnerable groups, could see another round of layoffs or face unemployment and reduced hours for longer. This could raise the chance of long-lasting effects through changes in consumer and business behaviours and preferences, increasing the time needed for the Canadian economy to get back to its pre-pandemic activity level.
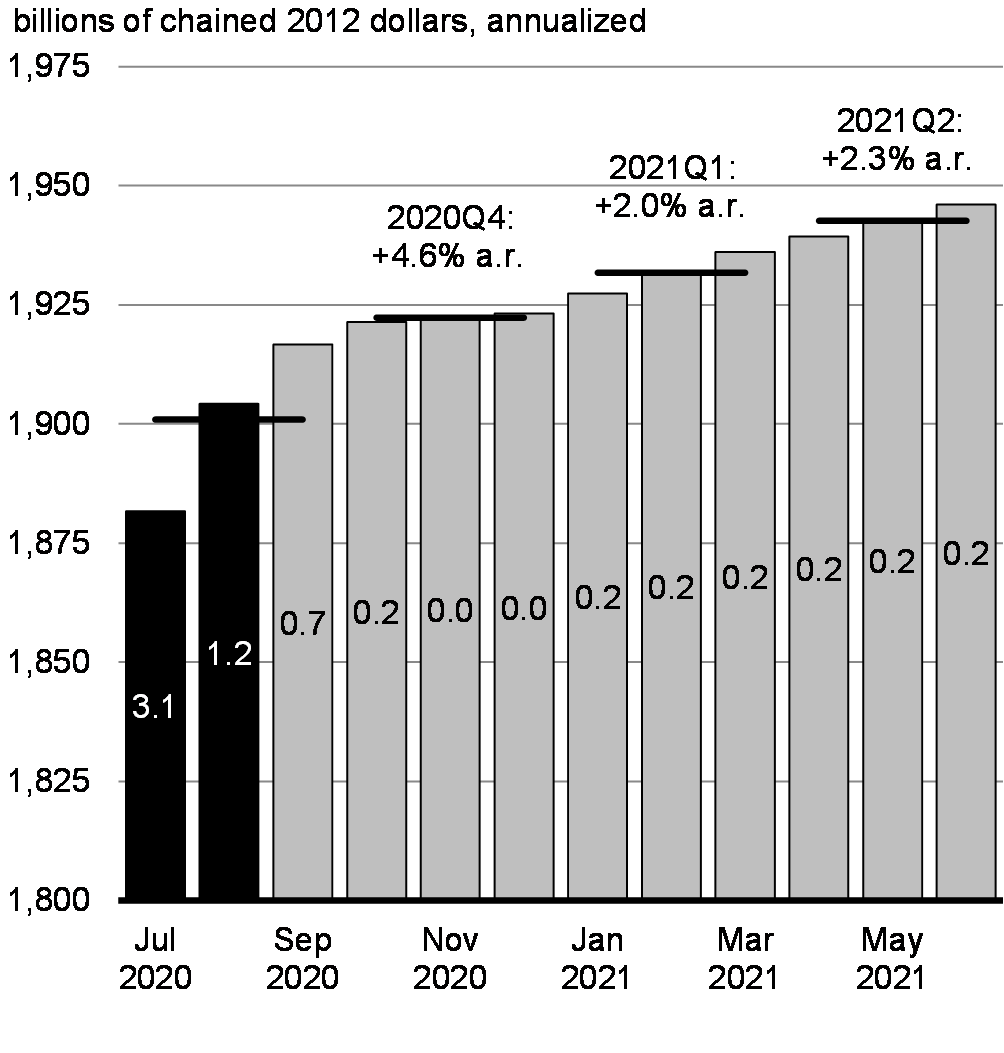
Overall, this would further slow the recovery in the final quarter of 2020 and heading into 2021 (Chart 4.6), reducing the rebound in 2021 to an increase of 4.1 per cent compared to the 4.8 per cent increase expected in the September survey. This would also likely delay the return of employment to pre-pandemic levels by almost a year and a half to early 2023. The slower recovery would negatively affect government revenues and automatic stabilizer programs such as Employment Insurance. Overall, a resurgent virus leading to an extension of current restrictions would be expected to increase the deficit by approximately $7.0 billion on average annually this year and next.
Virus Resurgence: Escalated Restrictions
The second scenario sees an intensification of all the elements of the first scenario and escalating public-health restrictions. In some areas, new cases, test positivity rates and other epidemiological indicators begin to cross thresholds provinces and communities have set for the most stringent lockdown-style restrictions. Closures of some non-essential businesses, time-limited closures for schools (such as extending winter holidays) and the delay of elective non-urgent medical procedures become necessary to slow the spread and maintain adequate health care capacity. Even higher levels of fear and uncertainty from this scenario drive people to limit outings to only those for essential goods, with a further shift to online sales. Many businesses that used their cash reserves to withstand the first wave will be in an even more precarious position, requiring government supports. Given these closures and greater behavioural changes, there is a broader impact on the overall economy with most sectors seeing declines in the final months of 2020 and into the beginning of 2021 (Chart 4.7).
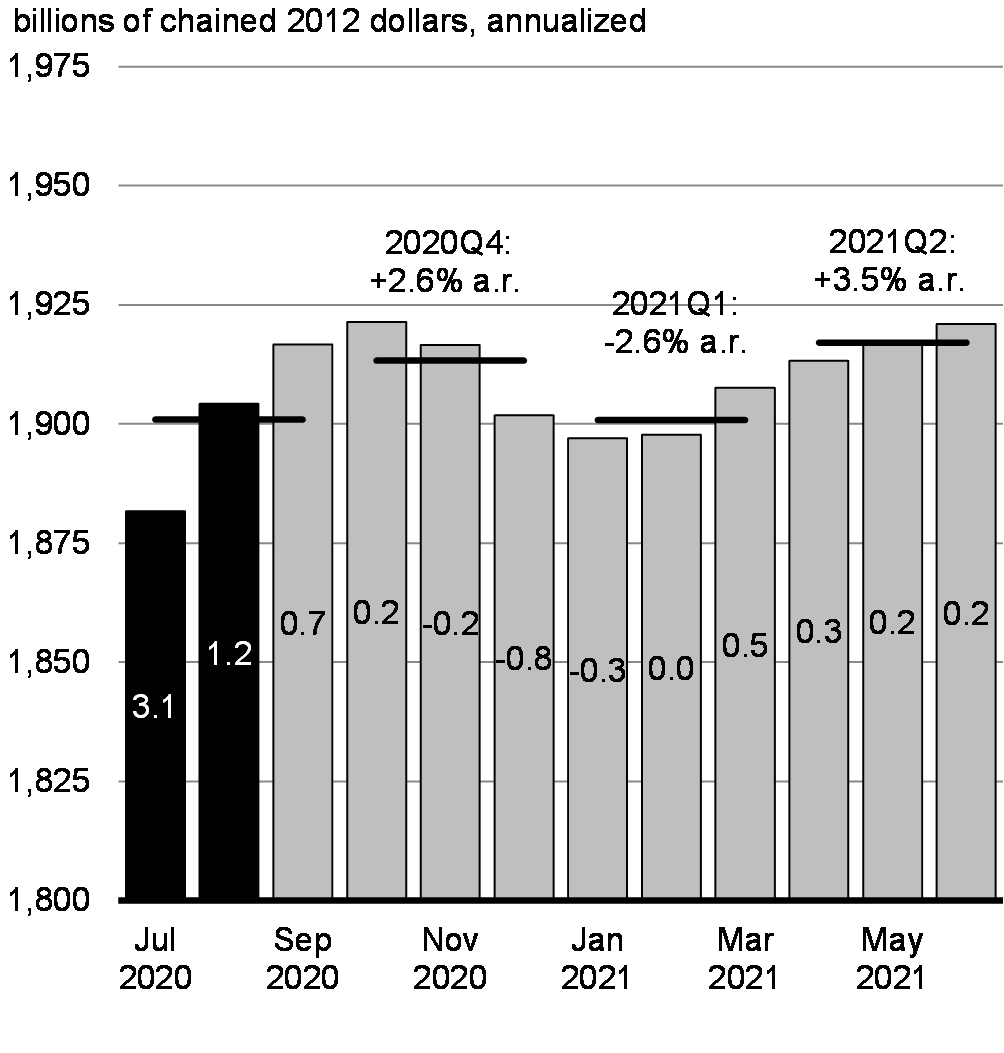
Overall, this would result in a decline in economic activity heading into the first quarter of 2021 as shutdowns come into force through December and stay in place for the coldest months of winter, reducing growth for 2021 to 2.9 per cent and resulting in an even longer delay before employment returns to pre-pandemic levels. The relative decline in economic activity would be expected to increase the deficit by about $16 billion on average annually this year and next as a result of increased costs of economic response and recovery programs and Employment Insurance benefits as well as reduced tax revenues.
Monthly Real GDP – Extended Restrictions
Monthly Real GDP – Escalated Restrictions
4.4 Fiscal Outlook
Table 4.1, below, shows fiscal developments since the publication of the July Economic and Fiscal Snapshot. A detailed description of the fiscal outlook, including economic and fiscal developments and costs of new measures approved since the July Snapshot, is provided in Annex 1.
Overall, better-than-expected economic outcomes and revisions to the estimated costs of some large economic response plan measures since EFS 2020 have had a positive impact on the 2020-21 budgetary balance. Including additional measures taken since EFS 2020 and announced in this statement, the deficit is projected to reach. $381.6 billion in 2020-21. The deficit is expected to fall significantly over the next two fiscal years, to $121.2 billion in 2021-22 and further to $50.7 billion in 2022-23, as the economy recovers and the need for temporary measures wanes (Table 4.1). In 2025-26, the deficit is expected to reach $24.9 billion or 0.9 per cent of GDP.
| 2019– 2020 |
2020– 2021 |
2021- 2022 |
2022- 2023 |
2023- 2024 |
2024- 2025 |
2025- 2026 |
|
|---|---|---|---|---|---|---|---|
| Budgetary balance – EFS 2020 | -34.4 | -343.2 | |||||
Economic and fiscal developments since EFU 2019 (Table A2.3) |
-5.9 | 14.2 | |||||
Re-estimates of COVID measures included in EFS 2020 |
0.9 | 27.0 | |||||
Budgetary balance before policy actions and investments |
-39.4 | -302.0 | |||||
| Policy Actions since EFS 2020 | |||||||
Fighting COVID-19 |
-17.5 | -6.5 | -0.3 | -0.2 | -0.1 | -0.1 | |
Supporting Canadians through the Pandemic |
-34.3 | -16.9 | -0.7 | -0.1 | 0.0 | 0.0 | |
Building Back Better |
-0.1 | -0.3 | -0.3 | -0.5 | -0.4 | ||
A Prudent Fiscal Plan |
- | - | - | - | - | - | |
Other Policy Actions since EFS 2020 |
-2.6 | -5.8 | -0.8 | -0.5 | 0.3 | 0.5 | |
Subtotal |
-54.5 | -29.5 | -2.2 | -1.2 | -0.3 | 0.0 | |
| Investments in the Fall Economic Statement 2020 | |||||||
Fighting COVID-19 |
-3.6 | -4.0 | -0.3 | -0.1 | 0.0 | 0.0 | |
Supporting Canadians through the Pandemic |
-18.9 | -17.9 | -0.9 | -0.4 | -0.3 | -0.2 | |
Building Back Better |
-2.3 | -5.4 | -1.3 | -1.8 | -1.8 | -1.0 | |
A Prudent Fiscal Plan |
-0.2 | 0.6 | 1.4 | 1.7 | 1.8 | 2.0 | |
Subtotal |
-25.1 | 26.6 | -1.1 | -0.6 | -0.3 | -0.9 | |
| Budgetary balance – FES 2020 | -39.4 | -381.6 | -121.2 | -50.7 | -43.3 | -30.9 | -24.9 |
Of which: COVID-19 economic response plan |
-7.2 | -275.2 | -50.6 | -3.8 | -1.2 | -0.1 | -0.4 |
Note: Planned stimulus spending |
-70 to -100 over 3 years - see scenarios below | ||||||
| Budgetary balance before planned stimulus (per cent of GDP) | -1.7 | -17.5 | -5.2 | -2.1 | -1.7 | -1.2 | -0.9 |
| Federal debt before planned stimulus (per cent of GDP) | 31.2 | 50.7 | 52.6 | 52.1 | 51.6 | 50.6 | 49.6 |
| Fiscal impact of virus resurgence scenarios | |||||||
| Extended Restrictions | |||||||
| Fiscal Impact | -7.1 | -6.5 | -4.2 | -4.0 | -4.0 | -3.7 | |
| Budgetary balance | -39.4 | -388.8 | -127.7 | -54.9 | -47.3 | -34.8 | -28.6 |
Escalated Restrictions |
|||||||
Fiscal Impact |
-17.0 | -15.5 | -8.9 | -8.4 | -8.6 | -8.5 | |
| Budgetary balance | -39.4 | -398.7 | -136.7 | -59.6 | -51.7 | -39.4 | -33.4 |
Further, as outlined in Chapter 3, the government intends to deploy additional fiscal support to accelerate the recovery once the virus is controlled. To achieve this goal, the government will begin planning now to help Canada build back better by setting aside between 3 to 4 per cent of GDP, up to $100 billion, over the next three fiscal years. This additional spending has not been formally included in the government’s fiscal framework yet, as the ultimate size and timing is highly dependent on the evolving health and economic situation. The government will establish more clarity around the size, timing and composition of the stimulus spending as virus risks abate, as we begin rolling out a vaccine and as we move toward Budget 2021.
In the interest of transparency, Table 4.2, below, illustrates how four different scenarios of the timing, size and profile of the stimulus spending could affect overall public finances in the coming years. These scenarios make the following assumptions:
- Scenario 1: $70 billion of stimulus, spent over the coming three years, including $20 billion in 2021-22, $40 billion in 2022-23 and $10 billion in 2023-24.
- Scenario 2: $70 billion of stimulus, spent over the coming three years, including $25 billion in 2021-22, $30 billion in 2022-23 and $15 billion in 2023-24.
- Scenario 3: $100 billion of stimulus, spent over the coming three years, including $20 billion in 2021-22, $50 billion in 2022-23 and $30 billion in 2023-24.
- Scenario 4: $100 billion of stimulus, spent over the coming three years, including $30 billion in 2021-22, $50 billion in 2022-23 and $20 billion in 2023-24.
The ultimate size of the stimulus will be based on need. For reasons of prudence, these scenarios are built on top of the more pessimistic outlook associated with the virus projections conducted by the Department of Finance.
| 2020– 2021 |
2021- 2022 |
2022- 2023 |
2023- 2024 |
2024- 2025 |
2025- 2026 |
|
|---|---|---|---|---|---|---|
| Budgetary balance including second wave impact | -398.7 | -136.7 | -59.6 | -51.7 | -39.4 | -33.4 |
| Scenario 1 | ||||||
| Stimulus | -20 | -40 | -10 | |||
| Budgetary Balance | -398.7 | -156.7 | -99.6 | -61.7 | -39.4 | -33.4 |
| Federal debt (% of GDP) | 51.4 | 56.0 | 57.3 | 57.3 | 56.5 | 55.5 |
| Scenario 2 | ||||||
| Stimulus | -25 | -30 | -15 | |||
| Budgetary Balance | -398.7 | -161.7 | -89.6 | -66.7 | -39.4 | -33.4 |
| Federal debt (% of GDP) | 51.4 | 56.2 | 57.1 | 57.3 | 56.5 | 55.5 |
| Scenario 3 | ||||||
| Stimulus | -20 | -50 | -30 | |||
| Budgetary Balance | -398.7 | -156.7 | -109.6 | -81.7 | -39.4 | -33.4 |
| Federal debt (% of GDP) | 51.4 | 56.0 | 57.7 | 58.5 | 57.6 | 56.6 |
| Scenario 4 | ||||||
| Stimulus | -30 | -50 | -20 | |||
| Budgetary Balance | -398.7 | -166.7 | -109.6 | -71.7 | -39.4 | -33.4 |
| Federal debt (% of GDP) | 51.4 | 56.4 | 58.1 | 58.5 | 57.6 | 56.6 |
While Canada’s overall economic and fiscal situation depends greatly on how the virus unfolds in the coming months, the level of spending anticipated to support the recovery is necessary and, as demonstrated by the examples above, manageable. In each scenario, the federal debt remains, over the coming years, well within what most economists regard to be a sustainable level.
As outlined in Chapter 3, the level of stimulus spending forecast is on par with most of Canada’s peer economies and proportional to the size of the output gap estimated by the Bank of Canada and the Department of Finance’s own analysis. Further detail as to longer-term fiscal goals and objectives will be outlined in a subsequent fiscal update once the virus is more fully under control and there is greater certainty in the long-term economic outlook.
4.5 Bridging Canadians through the Crisis
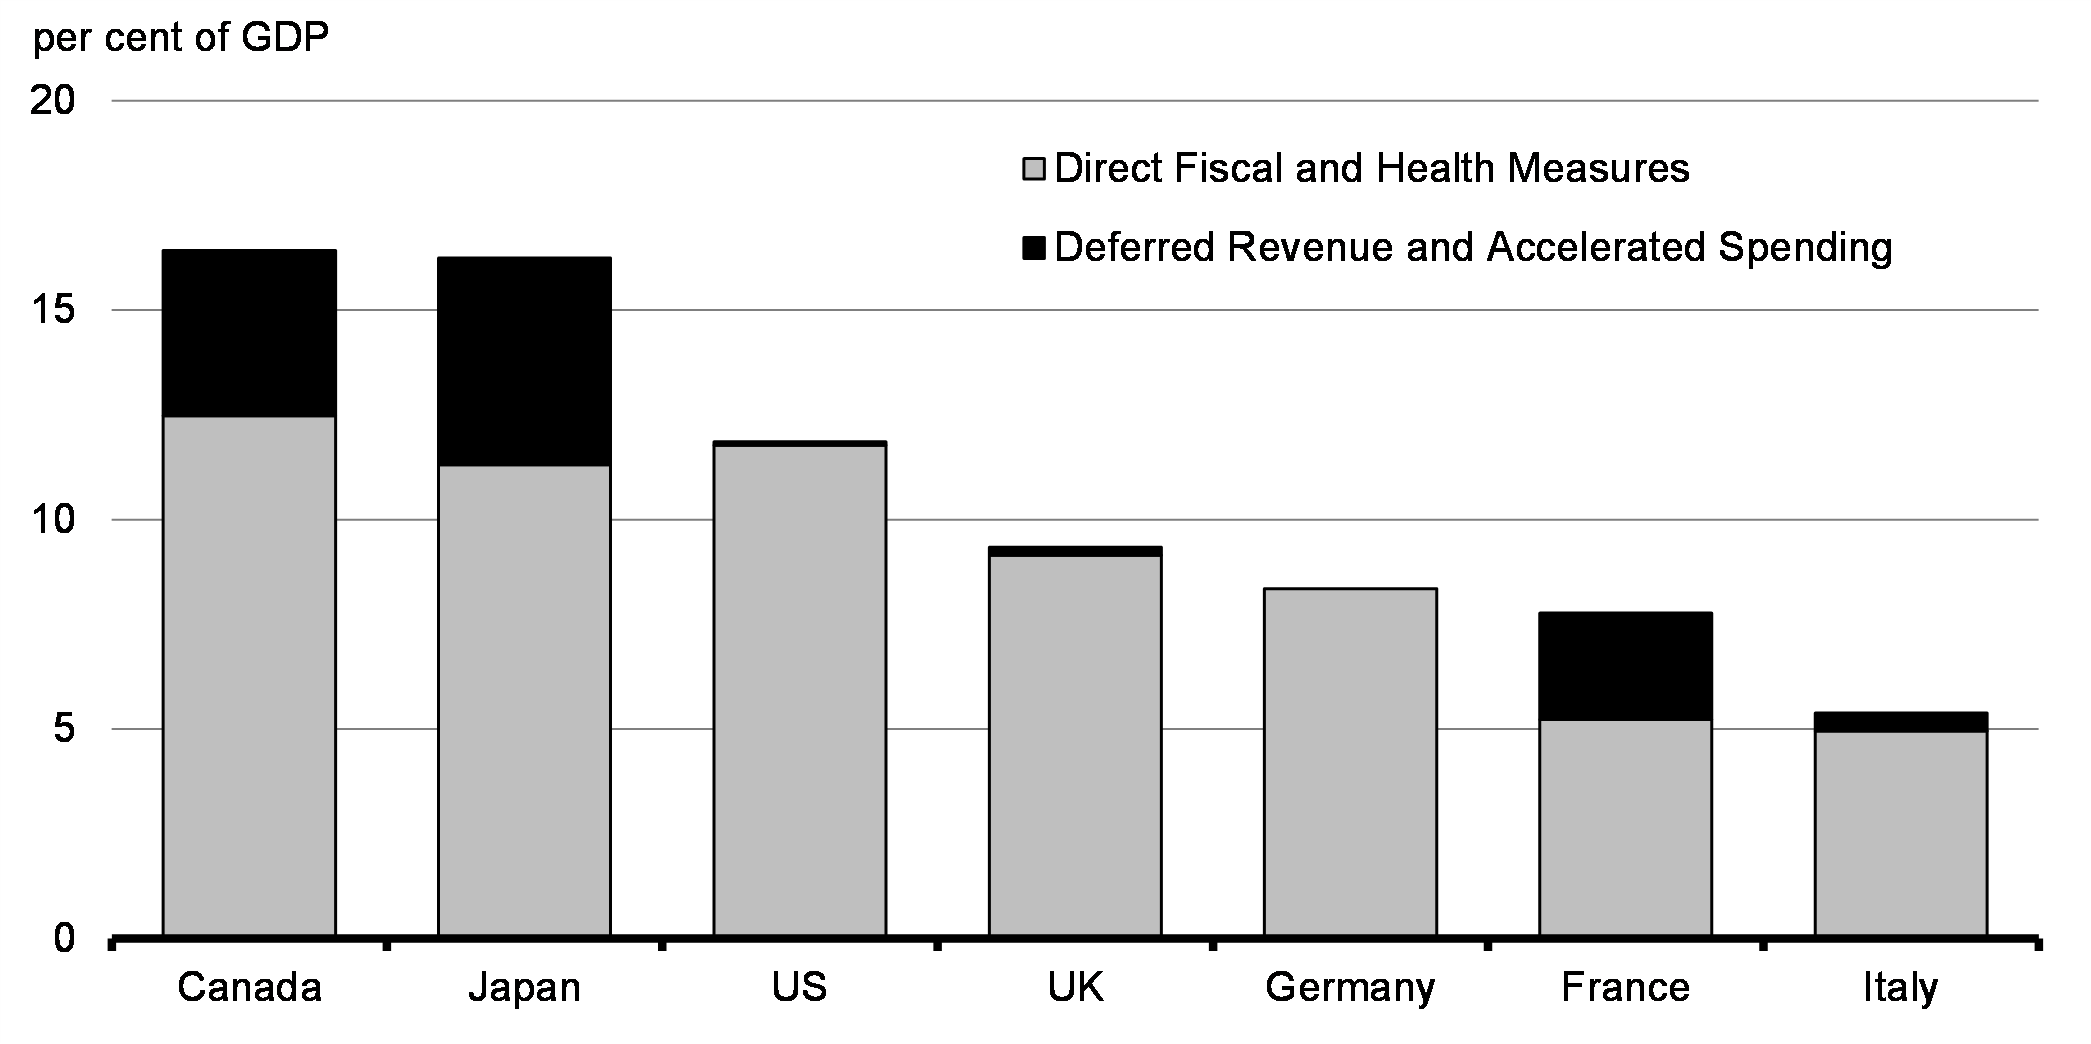
The federal government has provided more than 8 out of every 10 dollars spent in Canada to fight COVID-19 and support Canadians. Providing a bridge through this crisis continues to be a key pillar of the government’s economic response plan. With a fiscal impact of approximately $407 billion, or 19 per cent of GDP, one of the largest among G7 countries (Chart 4.8), combatting the pandemic has been the Government of Canada’s largest financial response since World War II. The government has provided Canadian businesses and families with a financial lifeline to pull them through the crisis, helping them avoid financial ruin – and the government remains well-positioned to keep supporting them.
Significant Fiscal Policy Support Announced across G7 Countries
The Government of Canada will continue to deploy all necessary fiscal firepower to fight the pandemic, in line with recommendations from the IMF and the Organisation for Economic Co-operation and Development. It will also continue to collaborate with provinces, territories and other governments to save lives and livelihoods and support Canadians and Canadian businesses for as long as this crisis lasts. Canadians should not have to take on debt that their government can better shoulder.
“We are of course keen to see that lifelines for businesses and for workers are sustained. This is our main message – don’t cut prematurely these lifelines.”
4.5.1 Maintaining our Low-debt Advantage
The federal government’s strong fiscal position means Canada has sufficient room to borrow as necessary to meet the challenges of COVID-19. Coming out of the crisis, Canada is expected to maintain its low-debt advantage. The government will continue to protect Canada’s debt advantage so borrowing costs remain low and ensuring future generations are not burdened with COVID-19-related debt.
4.5.2 COVID-19 Debt is Affordable
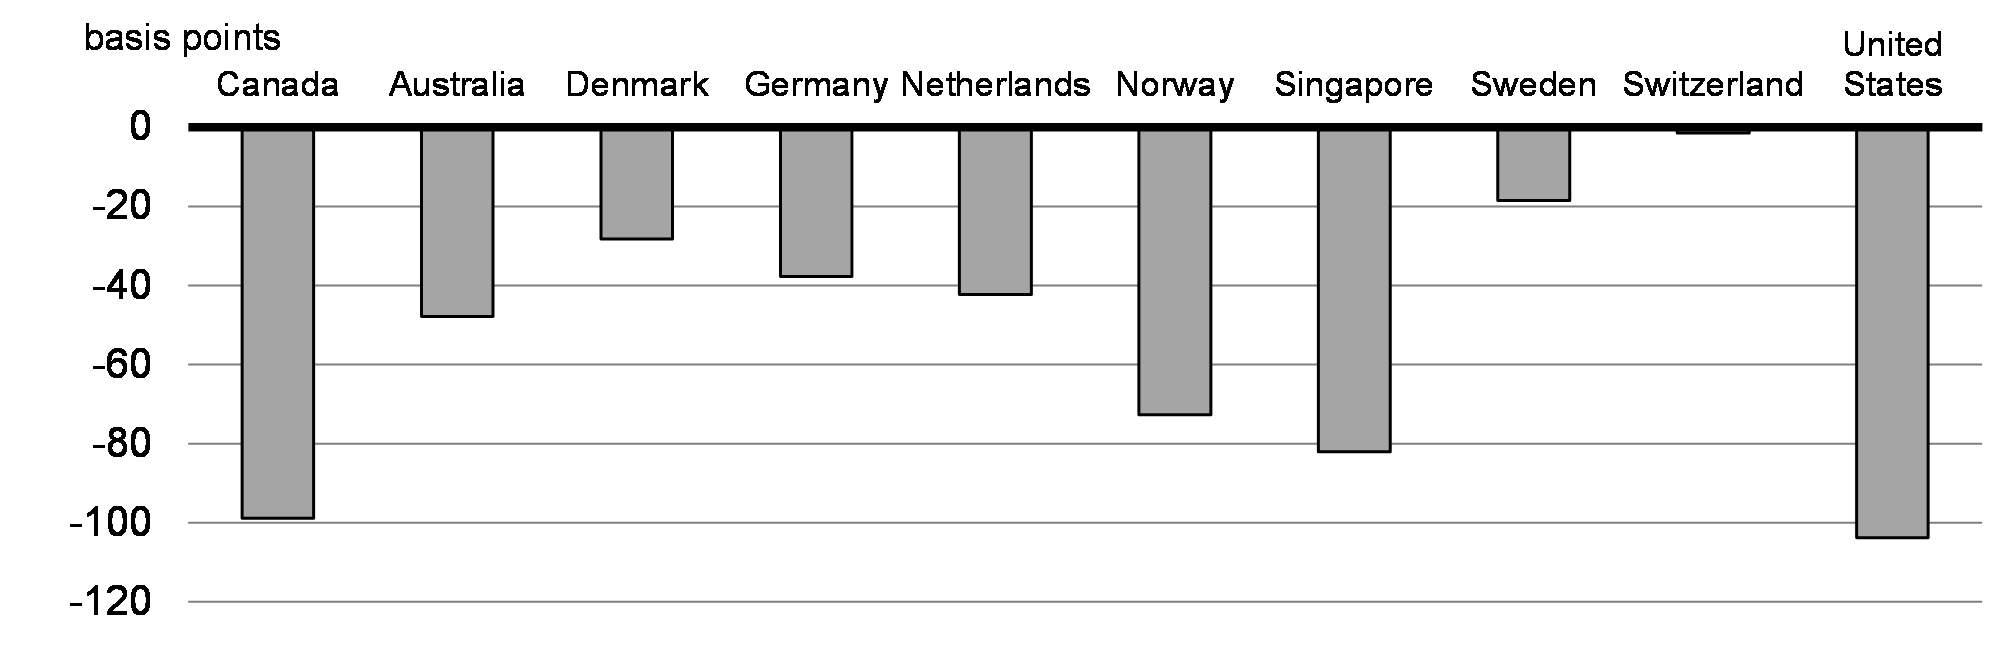
Alongside a major global decline in growth and prices, central banks around the world, including the Bank of Canada, have taken unprecedented measures to ease monetary policy for as long as necessary by cutting policy rates to their lower bounds and implementing government asset purchase programs. These two factors have led to a massive decline in interest rates for most countries (Chart 4.9), making new public debt issuances significantly more affordable. The federal government has been able to refinance existing debt and finance new debt at record-low market rates this year, marking the lowest costs of servicing our national debt, relative to our economy, in over a century (Chart 4.10).
Compared to some of our global debt peers, Canada has witnessed one of the most significant declines in borrowing costs since the beginning of the year. In response to these unprecedented developments, the government has calibrated its debt management strategy to lock in these low rates by issuing more long-term debt, which will help reduce exposure to interest rate increases in the future (see Annex 2).
Change in 10-Year Bond Yields Since January 1, 2020, AAA Countries
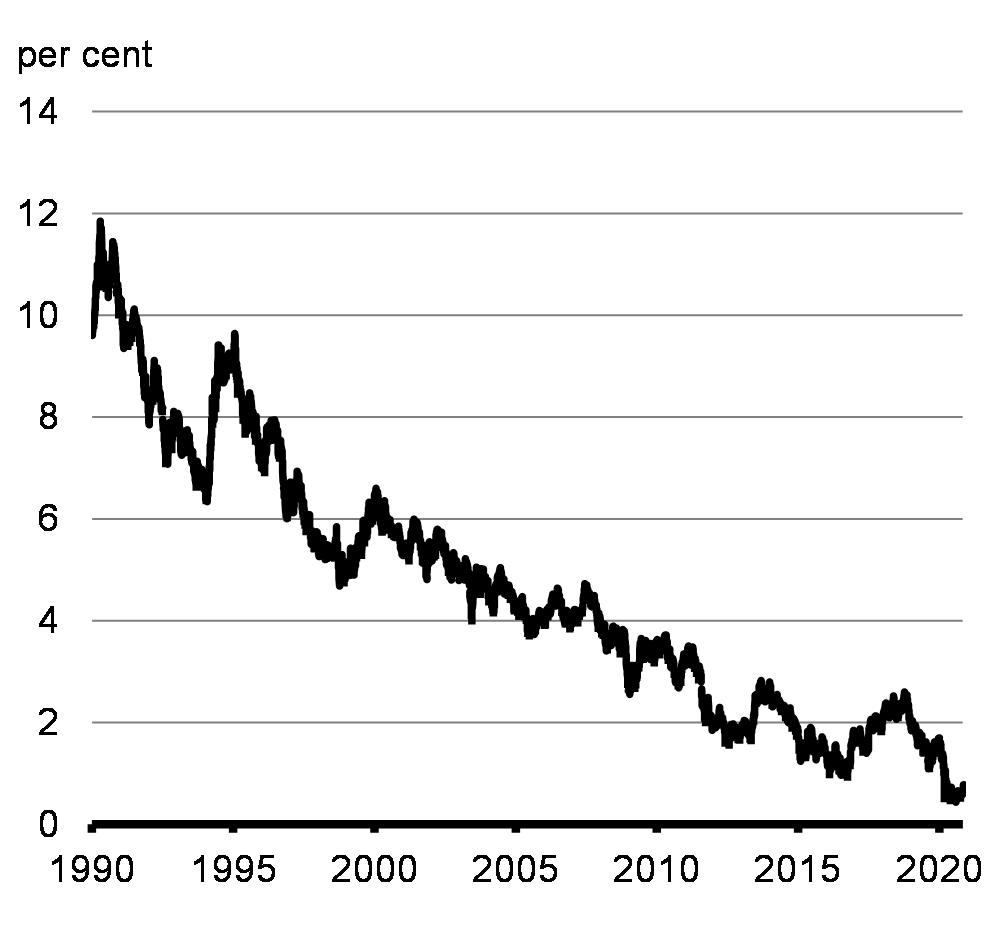
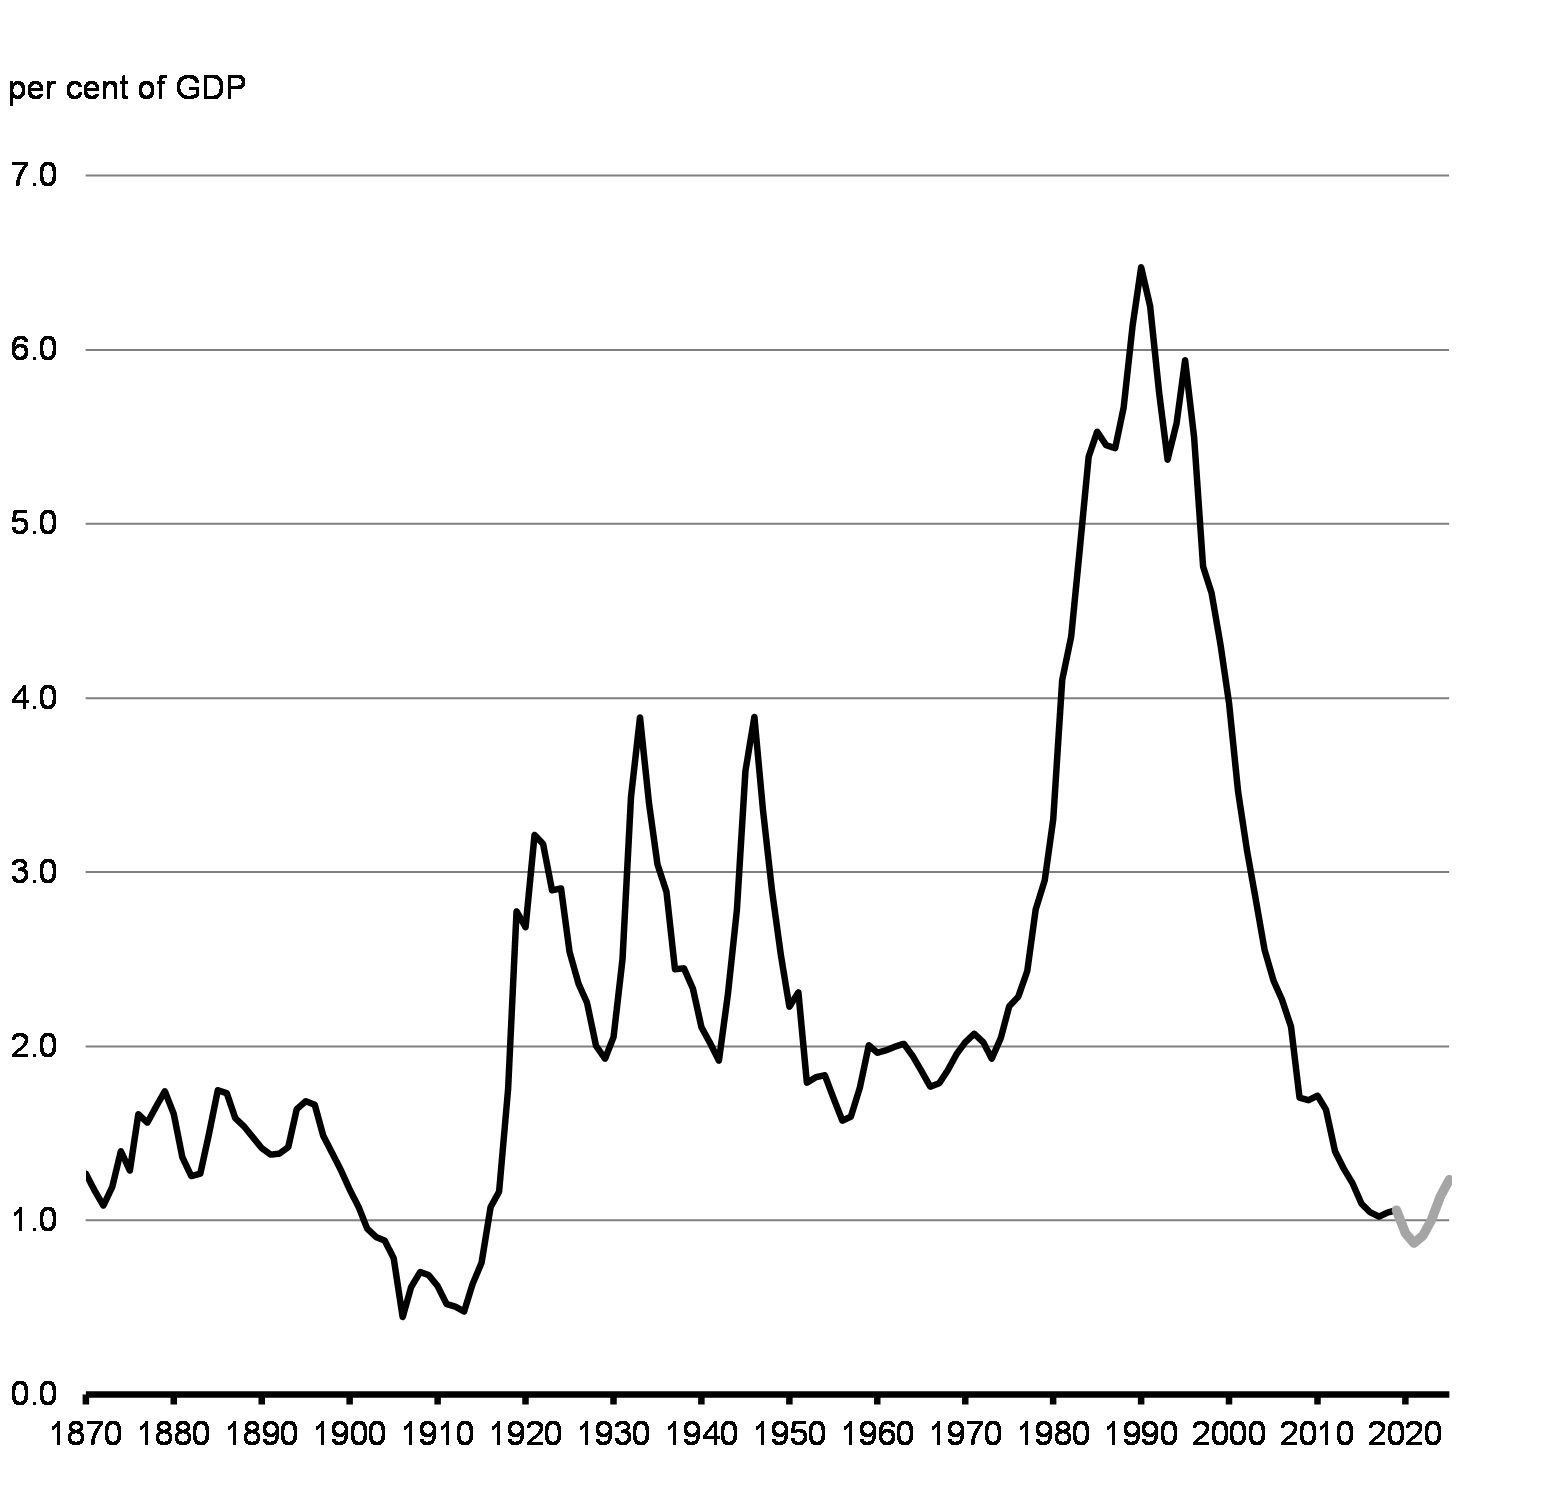
While it is true that federal debt will be significantly higher than what we have been accustomed to in recent years, this is not the 1990s – back then, the debt-to-GDP ratio was at a historical peak and debt-servicing costs exceeded 6.0 per cent of GDP. Recent developments outlined above show that notwithstanding the sharp increase in the federal debt-to-GDP ratio this year, federal debt charges are projected to fall below 1 per cent of GDP in 2020-21 and to only very modestly increase thereafter to 1.2 per cent by 2025-26, staying near their lowest level in over a century (Chart 4.11). As laid out in Annex 2, the government is taking advantage of these historically low rates to lock in debt at affordable rates for decades to come.
10-Year Yields on Government of Canada Bonds
Public Debt Charges, 1870-71 to 2025-26
4.5.3 Significant Support to Provinces and Territories
The government’s commitment includes making sure that provinces and territories are able to deliver the critical health and social services needed by Canadians. The government has already announced direct support for provinces and territories, with over $24 billion made available to date. This is on top of the funding regularly provided to provinces and territories through the major transfers and bilateral agreements, which totals over $85 billion in 2020-21.
Moreover, thanks as well to the unprecedented investment by the federal government to help stabilize the economy with broad measures to support businesses and individuals, provincial and territorial tax bases will benefit from the economic effects of the Canada Emergency Response Benefit, Canada Emergency Wage Subsidy, Canada Emergency Business Account and other programs. Provincial-territorial tax revenues were projected to be raised by approximately $17 billion in 2020-21 at the time of the Economic and Fiscal Snapshot. Enhancements to these programs implemented after the EFS 2020, in addition to new support measures, will increase this impact on provincial-territorial tax revenues.
In addition, the federal government will reform the Fiscal Stabilization program to provide a more effective backstop to provinces that face an extraordinary drop in revenues. This proposed set of measures is projected to result in billions in additional support to provinces for 2020-21, based on the current provincial outlook.
Modernizing the Fiscal Stabilization Program
The COVID-19 pandemic is having a negative impact on government revenues, including at the provincial level. The Fiscal Stabilization program was created to provide financial assistance to provinces that are facing significant declines in their revenues resulting from extraordinary economic downturns. The program provides financial help to any province faced with a year-over-year decrease of more than 5 per cent in its non-resource revenues or of more than 50 per cent in its resource revenues, with adjustments for interactions between the revenue sources. Payments are currently capped at $60 per person for a given fiscal year. The pandemic may cause some provinces to experience such sharp declines in revenues that they qualify for the federal Fiscal Stabilization program. The federal government has provided payments totaling nearly $2.6 billion through the program since its creation in 1967, with all provinces having benefitted at some point in time. Most recently, Fiscal Stabilization payments were provided to Alberta ($503 million for 2015–16 and 2016–17), Newfoundland and Labrador ($32 million for 2015–16), and Saskatchewan ($20 million for 2016–17). The Fiscal Stabilization program was last reviewed in 1995 and, following calls from provincial and territorial governments and academics for the program to be modernized, the federal government proposes to modernize the Fiscal Stabilization program as follows:
|
|
These changes will make the program more generous when provinces need help the most. The impact these changes will have on payments expected to be triggered as a result of COVID-19 will provide billions of additional support beyond the current parameters.
The government intends to introduce legislative and regulatory amendments to implement these changes.
4.6 The Plan for a Robust and Resilient Recovery
As Canada continues to fight COVID-19 and ensure Canadians have the support they need, the government is also focused on putting the right measures in place to ensure a strong economic recovery once the virus is defeated. Stimulus will focus on investments capable of both having a real, tangible impact on jobs and demand in the short term, while also strengthening Canada’s competitiveness and productivity in the longer term. The government is setting aside between 3 to 4 per cent of GDP, up to $100 billion, over the next three fiscal years to ensure we are well-prepared to build back better. The government will work with Canadians over the coming months to design a stimulus recovery plan that will build a stronger, more inclusive, more innovative and more resilient economy.
4.6.1 Timing of Recovery Spending is Critical to its Success
Canada knows that properly timed stimulus spending is critical. We must prioritize defeating COVID-19 so our economy is ready for recovery. At the same time, we must also be careful not to encourage some types of economic activity before they are safe. Our stimulus plan must be deployed at the right time so that it can stimulate a robust and competitive return to growth. We cannot simply mimic what was done in the past because of the unique circumstances of the COVID-19 recession – different jobs were lost, different sectors were impacted and different groups of people were affected.
Early actions announced in this statement are a down payment on the investments to come, laying a foundation for a strong and green economy that supports good jobs for all Canadians.
4.6.2 Stimulus Spending will be Time-limited
Any stimulus spending will be temporary. The deficits will be necessarily large to counter the severity of the COVID-19 recession, but as the economy recovers and the need for temporary response and recovery measures wanes, the deficit will decline.
4.7 Preserving Canada’s Fiscal Advantage
Public debt has sharply increased across the globe and, in many countries, this crisis has exposed pre-existing fiscal vulnerabilities. Canada entered the pandemic in a position of strength and our history of prudent fiscal management means that, despite the actions we took to fight the virus, Canada continues to have a favourable fiscal position relative to international peers.
The government’s near-term fiscal priority is to support and preserve Canada’s economy for current and future generations. The government will continue to provide fiscal support until the economy is firmly back on track. To guide this work, the government will track progress against several related indicators, recognizing that no one data point is a perfect representation of the health of the job market. These include the overall employment rate, level of unemployment and the total hours worked in the economy. An approach which is guided by economic data will help ensure the recovery is appropriately tailored to the needs of Canadians and the circumstances at hand. Fiscal guardrails will help establish when the stimulus will be wound down. These data-driven triggers will let us know when the job of building back from the COVID-19 recession is accomplished, and we can bring one-off stimulus spending to an end, returning to a prudent and responsible fiscal path, based on a long-term fiscal anchor we will outline when the economy is more stable. The government’s expansive approach to fighting the coronavirus and getting the economy back on track is not infinite. Canadians should rest assured that once the need for support in the economy has passed, it will be withdrawn.
As Canada fights to contain the virus and limit its consequences, the government’s economic and fiscal strategy will allow flexibility in response to changing health and economic conditions over the short-to-medium term while delivering stronger growth and helping ensure the sustainability of public finances over the longer term.
4.8 A Fair Tax System
4.8.1 A Fair Tax System for the Digital Economy
As more of our lives move online, our economy and our society are changing. The lockdowns brought on by the COVID-19 pandemic have accelerated the shift towards digitalization, globally and here at home, as both businesses and consumers do more business online. Retail e-commerce was up nearly 70 per cent in the first eight months of this year. Digitalization of the global economy has made it easier for businesses to sell goods and services to anywhere in the world, from anywhere in the world.
Under current rules, foreign-based digital businesses can sell their goods and services to Canadians without charging the Goods and Services Tax/Harmonized Sales Tax (GST/HST), which puts the burden on Canadian consumers to remit the sales tax. This gives foreign-based digital corporations an unfair advantage, and undercuts the competitiveness of Canadian companies. It also deprives the government of tax revenues that could be used to better the lives of everyone.
The government proposes a number of changes to level the playing field by ensuring that the GST/HST applies to all goods and services consumed in Canada, regardless of how they are supplied, or who supplies them. At the same time, the government will continue to work with the international community, provinces and stakeholders to ensure that the sales tax system is fair and provides a level playing field for Canadian and foreign-based businesses.
The government is also proposing action with respect to corporate-level tax to ensure that digital corporations pay their fair share of taxes in respect of their activity in Canada.
4.8.1.1 Fair Taxation of Cross-Border Digital Products and Services
Foreign-based vendors with no physical presence in Canada do not, currently, have to charge the GST/HST on sales of digital products or services – like mobile apps, online video gaming and video and music streaming. This has put Canadian vendors of digital products and services at a distinct competitive disadvantage.
-
To level the playing field, the government proposes that foreign-based vendors selling digital products or services to consumers in Canada be required to register for, collect and remit the GST/HST on their taxable sales to Canadian consumers.
Canadians also often purchase digital products or services through digital marketplace platforms (e.g., “app stores”). To ensure that the GST/HST applies equally to these sales, the government proposes that digital marketplace platforms be required to register for the GST/HST, and to collect and remit the tax on the sale of digital products or services of foreign-based vendors to Canadians that the platform facilitates. This will ensure greater fairness for Canadian retailers.
To help promote compliance, the government proposes that foreign-based vendors and digital marketplace platforms be able to register and account for the GST/HST under a special simplified regime.
This proposal is in line with recommendations of the Organisation for Economic Co‑operation and Development on the digital economy and is consistent with the actions of many other countries and jurisdictions.
These changes are proposed to be effective July 1, 2021, which will provide time for the government to consult stakeholders on the proposed changes and for stakeholders to comply with these proposals.
It is estimated that the proposed measure will increase federal revenues by $1.2 billion over 5 years, starting in 2021-22.
4.8.1.2 Fair Taxation of Goods Supplied through Fulfillment Warehouses
Canadians are increasingly going online to buy the things they need. Online vendors and the digital platforms that host them are often based outside Canada, but use fulfillment warehouses here to store goods and deliver them to Canadians in a timely way.
Under the current rules, there is generally no requirement for foreign-based vendors to collect the GST/HST on the final price paid when their goods are sold in Canada, including when the sales are facilitated by digital platforms. By comparison, Canadian vendors using digital platforms and fulfillment warehouses in Canada are required to collect the GST/HST on the final price paid for their goods. This is putting Canadian vendors at a disadvantage.
Gender Results Framework
Gender Equality and Diversity in Canada
-

Leadership and Democratic Participation
In 2017, 12 per cent of all small- and medium-sized enterprises (SMEs) were in retail trade. Men-owned businesses were less likely to be in this industry (10 per cent) than women-owned businesses (18 per cent). Indigenous-owned businesses and businesses owned by visible minorities were also more likely to be in retail trade (17 per cent and 14 per cent, respectively), while only 2 per cent of businesses owned by persons with a disability were in this industry. About 12 per cent of businesses owned by men and women equally were in retail trade, as were businesses owned by members of the same family.
- To level the playing field between Canadian and foreign-based vendors, the government proposes to apply the GST/HST on all sales to Canadians of goods that are located in Canadian fulfillment warehouses. Under this proposal, the GST/HST will be required to be collected and remitted by either the foreign-based vendor or the digital platform that facilitates the sale.
These changes are proposed to be effective July 1, 2021, which will provide time for the government to consult stakeholders on the proposed changes and for stakeholders to comply with these proposals.
It is estimated that the proposed measure will increase federal revenues by $1.6 billion over 5 years, starting in 2021-22.
4.8.1.3 Fair Taxation of Short-Term Accommodation through Digital Platforms
Increasingly, individual property owners are renting out their residences, or other residential property, through digital platforms for short-term periods. Property owners may not be aware of the relevant GST/HST requirements with respect to these rentals. Additionally, the platforms that facilitate these rentals are not responsible for accounting for the GST/HST on these rentals under current rules. These factors result in the GST/HST not being applied consistently and putting more traditional Canadian accommodation providers, such as hotels, at a comparative disadvantage.
The growing popularity of the sector has also led to an increasing number of homes and properties being re-purposed from long-term into short-term rental accommodation. While data on short-term accommodation is limited, a 2019 study estimated that more than 30,000 housing units in Canada were frequently being used for this purpose. For people living in Canada’s largest cities, the limited supply of long-term housing has made it more difficult to afford a home.
- To improve GST/HST compliance, and to ensure fairness across the accommodation sector, the government proposes to apply the GST/HST to all platform-based short-term rental accommodation supplied in Canada. Under this proposal, the GST/HST will be required to be collected and remitted – by either the property owner, or the digital accommodation platform – on short-term accommodation that is supplied in Canada through a digital accommodation platform.
These changes are proposed to be effective July 1, 2021, which will provide time for the government to consult stakeholders on the proposed changes and for stakeholders to comply with these proposals.
It is estimated that the proposed measure will increase federal revenues by $360 million over 5 years, starting in 2021-22. As referenced in Chapter 3, the government is also investing in affordable housing.
International Corporate Tax and Digitalization
The government is committed to ensuring that everyone pays their fair share, so that Canada continues to have the resources needed to invest in people and keep our economy strong. When it comes to corporate-level tax, this means ensuring that corporations in all sectors, including digital corporations, pay their fair share of taxes in respect of their activity in Canada. It is important that tax rules take account of new ways in which businesses carry out value-creating activities in a jurisdiction, including remote digital means such as the collection of user data and content contributions. It is also important that countries have tools to protect their tax bases against avoidance in the form of international profit shifting.
The government recognizes the mutual benefits of multilateral coordination in international taxation and therefore has a strong preference for a multilateral approach to address these issues. We need a modern tax system where all corporations pay their fair share. Canada has been working with our international partners in a process led by the Organisation for Economic Co-operation and Development with a view to developing a coordinated approach by mid-2021. The government remains committed to a multilateral solution, but is concerned about the delay in arriving at consensus. The government therefore proposes to implement a tax on corporations providing digital services, with effect from January 1, 2022, which would apply until such time as an acceptable common approach comes into effect. On a provisional basis, it is estimated that the new measure would increase federal revenues by $3.4 billion over 5 years, starting in 2021-22. Further details will be announced in Budget 2021.4.8.2 Improving Tax Fairness and Strengthening Compliance
Since 2015, the Government of Canada has promoted greater fairness in the tax system. The government has worked to close loopholes, eliminate measures that disproportionately benefit the wealthy and crack down on tax evasion.
With this Fall Economic Statement, the government is setting out next steps in its ongoing effort to improve the fairness of the tax system. These measures will give Canadians even more confidence that the system is fair for everyone.
To help build a fairer Canada, the government is also examining new ways to use the tax system to address the rise of extreme wealth inequality, as laid out in the Speech from the Throne.
4.8.2.1 Employee Stock Options
Employee stock options, which allow employees to purchase shares of their employer at a designated price, are an alternative form of compensation used by businesses to attract and engage employees. For instance, many smaller, growing companies that cannot yet afford competitive salaries use employee stock options as a tool for attracting and retaining talent.
The employee stock option deduction supports this objective by effectively taxing stock option benefits at a rate equal to one-half of the normal rate of personal taxation, the same rate as capital gains. However, evidence shows that the employee stock option deduction is regressive, with high-income individuals disproportionately benefitting from this preferential tax treatment.
Budget 2019 announced the government’s intention to move forward with changes to limit the benefit of the employee stock option deduction for high-income individuals employed at large, long-established, mature firms.
In June 2019, the government released draft legislative proposals and launched consultations seeking stakeholder input on the characteristics of companies that should be considered start-up, emerging and scale-up companies for the purpose of exempting such corporations from the new employee stock option tax rules.
- Based on the June 2019 announcement and the input received from stakeholders during the consultations, the government is proposing the following changes to the employee stock option tax rules:
- A $200,000 annual limit will apply on employee stock option grants that can qualify for the employee stock option deduction. This limit will be based on the fair market value of the shares underlying the options, at the time the options are granted.
- Employee stock options granted by Canadian-controlled private corporations (CCPCs) will not be subject to the new limit. This responds to the government’s previously stated objective that start-ups not be impacted by this change.
- In recognition of the fact that some non-CCPCs could be start-ups, emerging or scale-up companies, non-CCPC employers with annual gross revenues of $500 million or less will also not be subject to the new limit.
This approach will ensure that start-ups and emerging Canadian businesses that are creating jobs can continue to grow and expand and attract key talent, while limiting the benefit of the employee stock option deduction for high-income Canadians who work in mature companies. These new rules will make the employee stock option tax regime fairer and more equitable for Canadians and, once fully in effect, are expected to generate about $200 million in federal tax revenues each year.
The new rules will apply to employee stock options granted on or after July 1, 2021.
4.8.2.2 Taxing Unproductive Use of Canadian Housing by Foreign Non-resident Owners
Too often, the price of homes is out of reach for Canadians, in particular for those looking to buy their first home. Speculative demand from foreign, non-resident investors contributes to unaffordable housing prices for many Canadians. To help make the housing market more secure and affordable for Canadians, the government is committed to ensuring that foreign, non-resident owners, who simply use Canada as a place to passively store their wealth in housing, pay their fair share.
The government will take steps over the coming year to implement a national, tax-based measure targeting the unproductive use of domestic housing that is owned by non-resident, non-Canadians, which removes these assets from the domestic housing supply.
4.8.2.3 Strengthening Tax Compliance
Taxes help pay for the government services that benefit Canadians. They help pay for the medical care that keeps us healthy. They provide a social safety net so that in times of crisis, all Canadians have a lifeline. They create opportunities through investments in innovation and new infrastructure that can help the economy grow. They help ensure that Canada is a place where no one is left behind.
That is why, since Budget 2016, the government has committed $350 million per year on an ongoing basis for the Canada Revenue Agency (CRA) to crack down on tax evasion and combat aggressive tax avoidance. These investments target a range of complex tax schemes in areas such as offshore tax evasion and the underground economy. The government’s efforts have yielded positive results.
- Building on these investments, the government proposes an additional $606 million over 5 years, starting in 2021-22, to allow the CRA to fund new initiatives and extend existing programs targeting international tax evasion and aggressive tax avoidance. Specifically, the CRA will hire additional offshore-focused auditors to focus on individuals who avoid taxes by hiding income and assets offshore, enhance the audit function targeting higher-risk tax filings, including those of high-net worth individuals, and strengthen its ability to fight tax crimes such as money laundering and terrorist financing by upgrading tools and increasing international cooperation.
The government estimates that these measures to combat international tax evasion and aggressive tax avoidance will recover $1.4 billion in revenues over 5 years. These amounts do not reflect the gains that will be realized by provinces and territories, whose tax revenues will also increase as a result of these initiatives.
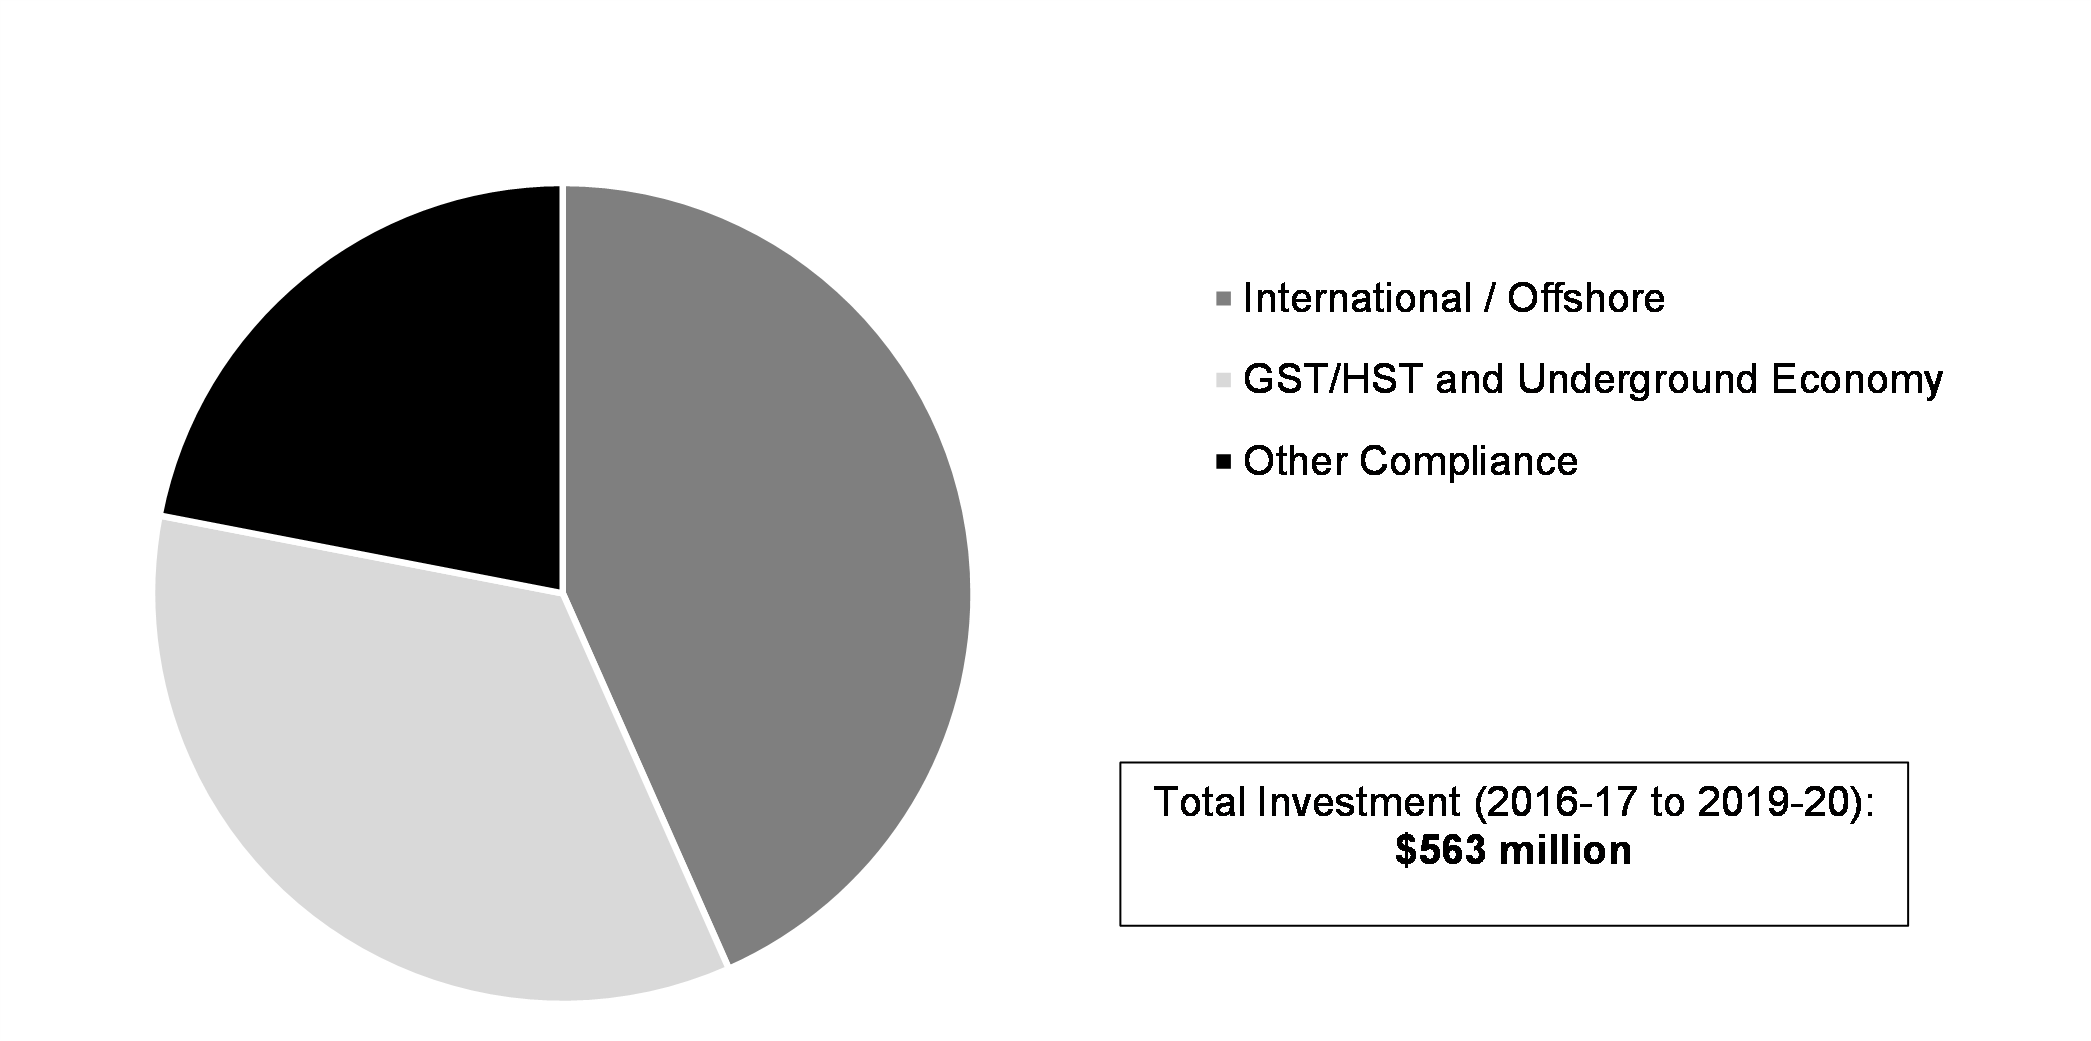
Recent Investments in CRA Compliance Actions
Since Budget 2016, the government has committed $350 million per year on an ongoing basis so the CRA is better able to crack down on tax evasion and combat aggressive tax avoidance. These investments target complex tax schemes in areas such as offshore tax evasion and the underground economy. It is estimated that these incremental investments have already delivered over $3 billion in additional federal tax revenues assessed.
Recent Investments in CRA Compliance Activities by Fiscal Year
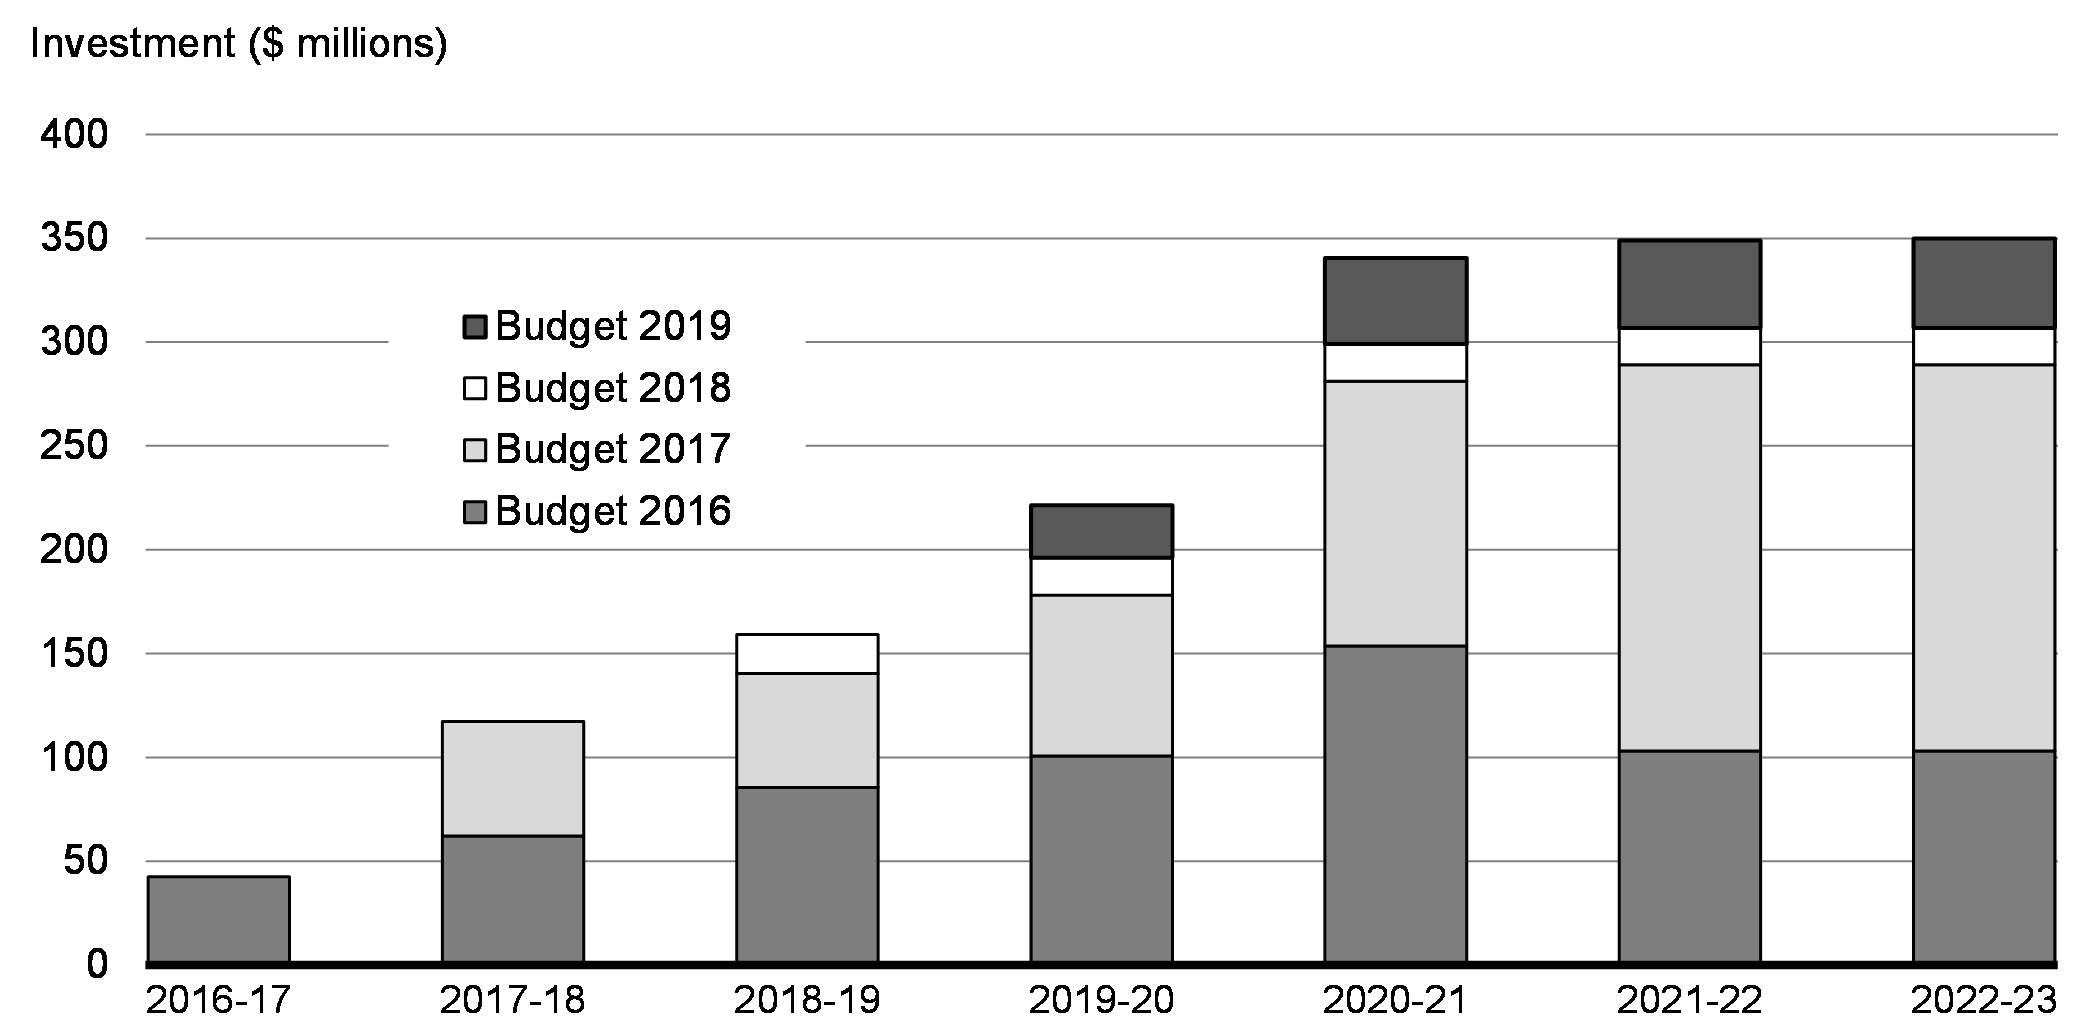
Investments in CRA Compliance Activities Since Budget 2016, by Type
4.8.2.4 Modernizing Anti-Avoidance Rules
For too long, certain individuals and businesses have been able to create increasingly complex structures in order to artificially lower their tax obligations in a manner that does not serve an economic purpose, including by shifting profits offshore and creating artificial tax deductions. To address this, the government will launch consultations in the coming months on the modernization of Canada’s anti-avoidance rules, in particular the General Anti-Avoidance Rule. It is essential to the integrity of the tax system that our anti-avoidance rules be updated so they are sufficiently robust for tax authorities and courts to address this sophisticated and aggressive tax planning.
4.8.3 Simplifying the Home Office Expense Deduction
Millions of Canadians are unexpectedly working from home because of COVID-19. They are turning their bedrooms, basements and kitchens into offices, and taking on increased household expenses to do their jobs. Canadians working from home can already deduct certain home office expenses for tax purposes, but first-time claimants may not be familiar with the rules and the claim process imposes an administrative burden on employers who are already dealing with the broader impacts of the pandemic and have to fill out additional information for their employees who qualify.
Gender Results Framework
Gender Equality and Diversity in Canada
-

Economic Participation and Prosperity
In 2019, Canada's telework capacity – the share of jobs that could plausibly be performed from home under normal circumstances – stood at 39 per cent. Men's telework capacity (32 per cent) was lower than women's (46 per cent). Part of this difference is explained by the fact that men and women often work in different jobs. For example, jobs in agriculture and construction – where men are over-represented – cannot be performed from home. Financially vulnerable workers, including youth, people with a high school diploma or less, and low-income families, had the lowest telework capacities.
- To simplify the process for both taxpayers and businesses, the CRA will allow employees working from home in 2020 due to COVID-19 with modest expenses to claim up to $400, based on the amount of time working from home, without the need to track detailed expenses, and will generally not request that people provide a signed form from their employers. This measure will help taxpayers access deductions they are entitled to receive and simplify the tax filing process. Further detail will be communicated by the CRA in the coming weeks.
| 2020– 2021 |
2021– 2022 |
2022– 2023 |
2023- 2024 |
2024- 2025 |
2025- 2026 |
Total | |
|---|---|---|---|---|---|---|---|
| 4.8.1 A Fair Tax System for the Digital Economy | 1 | -596 | -1,283 | -1,447 | -1,512 | -1,692 | -6,529 |
| Fair Taxation of Cross-Border Digital Products and Services | - | -166 | -243 | -257 | -267 | -282 | -1,215 |
| Fair Taxation of Goods Supplied through Fulfillment Warehouses | - | -190 | -275 | -315 | -360 | -415 | -1,555 |
| Fair Taxation of Short-Term Accommodation through Digital Platforms | - | -40 | -65 | -75 | -85 | -95 | -360 |
| International Corporate Tax and Digitalization | - | -200 | -700 | -800 | -800 | -900 | -3,400 |
| 4.8.2 Improving Tax Fairness and Strengthening Compliance | 210 | -20 | -92 | -205 | -240 | -336 | -684 |
| Employee Stock Options | - | - | - | - | - | -55 | -55 |
| Strengthening Tax Compliance | -20 | -92 | -205 | -240 | -281 | -839 | |
| 4.8.3 Simplifying the Home Office Expense Deduction | 210 | - | - | - | - | - | 210 |
| Simplifying the Home Office Expense Deduction | 210 | - | - | - | - | - | 210 |
| Chapter 4 – Net Fiscal Impact | 211 | -616 | -1,375 | -1,652 | -1,752 | -2,028 | -7,214 |
| Note: Totals may not add due to rounding. A “0” indicates a nil amount or small amount (less than $500,000). | |||||||
Report a problem on this page
- Date modified: