
Annex 1 - Details of Economic and Fiscal Projections
Economic Projections
The average of private sector forecasts has been used as the basis for fiscal planning since 1994 and introduces an element of independence into the Government’s fiscal forecast.
The Department of Finance Canada regularly surveys private sector economists on their views on the outlook for the Canadian economy. The economic forecast presented in this section is based on a survey conducted in September 2018.
The September 2018 survey includes the views of 14 private sector economists:
- BMO Capital Markets,
- Caisse de dépôt et placement du Québec,
- Canadian Federation of Independent Business,
- CIBC World Markets,
- The Conference Board of Canada,
- Desjardins,
- IHS Global Insight,
- Industrial Alliance Insurance and Financial Services Inc.,
- Laurentian Bank Securities,
- National Bank Financial Markets,
- Royal Bank of Canada,
- Scotiabank,
- TD Bank Financial Group, and
- The University of Toronto (Policy and Economic Analysis Program).
| 2018 | 2019 | 2020 | 2021 | 2022 | 2023 | 2018– 2022 |
|
|---|---|---|---|---|---|---|---|
| Real gross domestic product (GDP) growth1 | |||||||
| Budget 2017 | 2.0 | 1.7 | 1.7 | 1.8 | – | – | – |
| Budget 2018 | 2.1 | 1.6 | 1.7 | 1.6 | 1.8 | – | 1.8 |
| 2018 Fall Economic Statement | 2.0 | 2.0 | 1.6 | 1.6 | 1.9 | 1.9 | 1.8 |
| GDP inflation1 | |||||||
| Budget 2017 | 2.0 | 1.8 | 2.1 | 2.0 | – | – | – |
| Budget 2018 | 2.0 | 1.9 | 2.0 | 2.0 | 1.9 | – | 1.9 |
| 2018 Fall Economic Statement | 2.2 | 2.1 | 1.7 | 2.0 | 2.0 | 2.0 | 2.0 |
| Nominal GDP growth1 | |||||||
| Budget 2017 | 4.0 | 3.5 | 3.8 | 3.8 | – | – | – |
| Budget 2018 | 4.1 | 3.5 | 3.8 | 3.6 | 3.8 | – | 3.8 |
| 2018 Fall Economic Statement | 4.2 | 4.1 | 3.3 | 3.7 | 4.0 | 3.9 | 3.9 |
| Nominal GDP level (billions of dollars)1 | |||||||
| Budget 2017 | 2,194 | 2,271 | 2,357 | 2,447 | – | – | |
| Budget 2018 | 2,225 | 2,303 | 2,390 | 2,477 | 2,571 | – | |
| 2018 Fall Economic Statement | 2,228 | 2,318 | 2,395 | 2,484 | 2,583 | 2,684 | |
| Difference between Budget 2017 and 2018 Fall Economic Statement | 34 | 47 | 38 | 37 | – | – | – |
| Difference between Budget 2018 and 2018 Fall Economic Statement | 4 | 16 | 5 | 7 | 12 | – | 9 |
| 3-month treasury bill rate | |||||||
| Budget 2017 | 0.9 | 1.4 | 1.8 | 2.3 | – | – | – |
| Budget 2018 | 1.4 | 2.0 | 2.3 | 2.5 | 2.5 | – | 2.1 |
| 2018 Fall Economic Statement | 1.4 | 2.1 | 2.4 | 2.4 | 2.4 | 2.6 | 2.1 |
| 10-year government bond rate | |||||||
| Budget 2017 | 2.3 | 2.7 | 3.0 | 3.3 | – | – | – |
| Budget 2018 | 2.3 | 2.8 | 3.1 | 3.2 | 3.3 | – | 2.9 |
| 2018 Fall Economic Statement | 2.3 | 2.8 | 3.0 | 3.1 | 3.2 | 3.3 | 2.9 |
| Exchange rate (US cents/C$) | |||||||
| Budget 2017 | 76.1 | 77.4 | 79.3 | 81.3 | – | – | – |
| Budget 2018 | 79.0 | 79.6 | 80.3 | 80.6 | 81.2 | – | 80.1 |
| 2018 Fall Economic Statement | 77.6 | 78.4 | 78.7 | 79.5 | 80.2 | 81.1 | 78.9 |
| Unemployment rate | |||||||
| Budget 2017 | 6.7 | 6.7 | 6.6 | 6.4 | – | – | – |
| Budget 2018 | 6.0 | 6.0 | 6.1 | 6.0 | 6.0 | – | 6.1 |
| 2018 Fall Economic Statement | 5.9 | 5.8 | 6.0 | 6.1 | 6.0 | 6.0 | 6.0 |
| Consumer Price Index inflation | |||||||
| Budget 2017 | 2.0 | 1.9 | 1.9 | 2.0 | – | – | – |
| Budget 2018 | 1.9 | 2.0 | 1.9 | 1.9 | 2.0 | – | 1.9 |
| 2018 Fall Economic Statement | 2.4 | 2.1 | 1.9 | 1.9 | 2.0 | 2.0 | 2.0 |
| U.S. real GDP growth | |||||||
| Budget 2017 | 2.3 | 1.8 | 1.9 | 2.0 | – | – | – |
| Budget 2018 | 2.4 | 1.9 | 1.9 | 1.8 | 1.9 | – | 2.0 |
| 2018 Fall Economic Statement | 2.8 | 2.5 | 1.8 | 1.8 | 2.0 | 1.9 | 2.2 |
| West Texas Intermediate crude oil price ($US per barrel) |
|||||||
| Budget 2017 | 59 | 56 | 59 | 64 | – | – | – |
| Budget 2018 | 56 | 57 | 57 | 59 | 62 | – | 58 |
| 2018 Fall Economic Statement | 67 | 68 | 65 | 65 | 68 | 71 | 67 |
Fiscal Projections
Changes to the Fiscal Outlook Since Budget 2018
| Projection | |||||||
|---|---|---|---|---|---|---|---|
| 2017– 2018 |
2018– 2019 |
2019– 2020 |
2020– 2021 |
2021– 2022 |
2022– 2023 |
2023– 2024 |
|
| Budget 2018 budgetary balance1, 2 | -19.9 | -18.8 | -17.8 | -16.5 | -13.2 | -12.0 | n/a |
| Adjustment for risk from Budget 2018 | 3.0 | 3.0 | 3.0 | 3.0 | 3.0 | ||
| Budget 2018 budgetary balance (without risk adjustment) |
-19.9 | -15.8 | -14.8 | -13.5 | -10.2 | -9.0 | |
| Economic and fiscal developments since Budget 2018 | 0.9 | 4.6 | 5.3 | 4.5 | 3.8 | 4.1 | |
| Revised budgetary balance before policy actions and investments | -19.0 | -11.2 | -9.5 | -9.0 | -6.4 | -4.9 | -3.2 |
| Policy actions since Budget 20183 | -3.5 | -1.7 | -1.5 | -3.0 | -2.4 | -3.3 | |
| Investments in 2018 Fall Economic Statement | |||||||
| Continued Progress for the Middle Class | -0.0 | -0.1 | -0.2 | -0.2 | -0.2 | -0.3 | |
| Confidence In Canada's Economic Future | -0.5 | -5.3 | -4.4 | -2.5 | -2.1 | -1.7 | |
| Total investments in 2018 Fall Economic Statement | -0.5 | -5.5 | -4.7 | -2.7 | -2.3 | -1.9 | |
| Total policy actions and investments since Budget 2018 | -4.0 | -7.1 | -6.2 | -5.7 | -4.7 | -5.2 | |
| Budgetary balance | -19.0 | -15.1 | -16.6 | -15.1 | -12.1 | -9.6 | -8.4 |
| Adjustment for risk | -3.0 | -3.0 | -3.0 | -3.0 | -3.0 | -3.0 | |
| Final budgetary balance (with risk adjustment) | -19.0 | -18.1 | -19.6 | -18.1 | -15.1 | -12.6 | -11.4 |
Economic and Fiscal Developments Since Budget 2018
| Projection | ||||||
|---|---|---|---|---|---|---|
| 2017– 2018 |
2018– 2019 |
2019– 2020 |
2020– 2021 |
2021– 2022 |
2022– 2023 |
|
| Economic and fiscal developments by compontent1 | ||||||
| Change in Budgetary Revenues | ||||||
| (1.1) Income taxes | 0.7 | 3.7 | 4.9 | 3.1 | 2.2 | 2.5 |
| (1.2) Excise taxes/duties | 0.2 | 1.6 | 1.1 | 0.9 | 0.9 | 1.2 |
| (1.3) Employment Insurance premiums | 0.6 | 0.3 | -0.2 | -0.1 | -0.1 | -0.1 |
| (1.4) Other revenues | 2.6 | 0.5 | 0.7 | 0.7 | 0.4 | 0.7 |
| (1) Total budgetary revenues | 4.0 | 6.0 | 6.5 | 4.6 | 3.4 | 4.3 |
| Change in program expenses | ||||||
| (2.1) Major transfers to persons | 0.6 | 0.6 | 0.3 | -0.1 | -0.4 | -0.6 |
| (2.2) Major transfers to other levels of government | 0.0 | -0.2 | -0.2 | -0.3 | -0.4 | -0.4 |
| (2.3) Direct program expenses | -3.9 | -2.7 | -1.6 | 0.3 | 0.9 | 0.2 |
| (2) Total program expenses | -3.3 | -2.3 | -1.4 | -0.2 | 0.1 | -0.8 |
| (3) Public debt charges | 0.2 | 0.9 | 0.3 | 0.1 | 0.4 | 0.5 |
| (4) Total economic and fiscal developments since Budget 2018 | 0.9 | 4.6 | 5.3 | 4.5 | 3.8 | 4.1 |
Relative to Budget 2018, budgetary revenues are projected to be higher over the forecast horizon. This increase is fairly broad-based across revenue streams and reflects an overall improvement in the economic outlook, particularly in the corporate sector, as well as strong 2018–19 year-to-date results.
Income tax revenues are expected to be higher relative to Budget 2018 due primarily to the outlook for corporate income tax, as year-to-date developments indicate stronger-than-expected corporate profits. Personal income tax revenues are also higher across the forecast horizon due to better-than-expected 2017–18 results as well as strong 2018–19 year-to-date results that are expected to carry forward.
Upward revisions to revenue from excise taxes and duties reflect both the improvement in the economic outlook and growth in taxable consumption. Of note, the upward revision to customs import duties in 2018–19 is larger than in other years due to the temporary imposition of steel and aluminum retaliatory tariffs. The description below provides further details on these revenues as well as sector support measures announced by the Government.
Steel and Aluminum Tariffs
On July 1, Canada imposed countermeasures against $16.6 billion in imports of steel, aluminum and other products from the United States (U.S.) as a direct, measured and proportional response to U.S. Section 232 tariffs on Canadian steel and aluminum exports. As of November 1, 2018, surtax revenues from the application of Canadian countermeasures totalled $597 million. This amount has been reflected in the 2018–19 revenue forecast.
The Government announced on June 29, 2018, that it will make available up to $2 billion through a comprehensive set of measures to defend and protect the interests of Canadian workers and businesses in the steel, aluminum and manufacturing industries. In addition, as mentioned in Chapter 3, the Government is proposing to provide a further $800 million to the Strategic Innovation Fund, of which $250 million will be sourced from revenues collected through the Canadian countermeasures. The Government has also taken steps to provide relief to support Canadian manufacturers facing increased tariff costs. Over the same period, relief provided through the remission of surtaxes for certain products, announced on October 11, 2018, as well as existing duty deferral mechanisms, could amount to up to $112 million in additional support to manufacturers.
The Government continues to engage with the U.S. to resolve this issue and restore trade that has been mutually beneficial to our two countries. The Government has been clear that Canada’s countermeasures would remain in place until the U.S. eliminates its trade restrictive measures against Canadian steel and aluminum. Should an agreement be reached to resolve this dispute, Canadian surtax revenues and relief/programming expenditures would be significantly reduced or eliminated.
| Surtax Revenues From Canadian Countermeasures Since July 1, 2018 | |
| Total revenues collected as of November 1, 20181 | 597 |
| Available Support for Canadian Steel, Aluminum and Manufacturing Workers and Industry | |
| Remissions and relief of surtaxes2 | 112 |
| Business Development Bank of Canada and Export Development Canada commercial financing and insurance |
1,700 |
| Helping Businesses Explore New Markets | 50 |
| Extended Work-Sharing and Labour Market Development Agreements | 75 |
| Strategic Innovation Fund: measures announced June 29, 2018 | 250 |
| Strategic Innovation Fund: measures proposed in 2018 Fall Economic Statement3 | 250 |
| Total support | 2,437 |
Employment Insurance (EI) premium revenues are projected to improve due to growth in employment earnings, which leads to an upward revision in 2018–19 but is more than offset over the remainder of the forecast horizon by the reduction in the EI premium rate from $1.66 per $100 of insurable earnings to $1.62 in 2019.
Other revenues, such as those resulting from sales of goods and services, investments and loans, interest and penalties, and Crown corporations’ revenues, are higher in all years of the forecast horizon largely as a result of the better-than-expected financial performance of enterprise Crown corporations.
With respect to expenses, major transfers to persons have been revised downwards for 2018–19 and 2019–20 as the improved labour market outlook leads to lower projected EI benefit expenses, and lower-than-expected 2017–18 results for elderly benefit expenses are expected to carry forward. The forecast has been revised upwards for subsequent years due to a projected increase in children’s benefits, which largely reflects an increase in the projected number of children eligible for the benefit.
Major transfers to other levels of government are higher than Budget 2018 projections. The increase is primarily due to higher forecasted nominal GDP, to which the Canada Health Transfer and Equalization payments are pegged.
Compared to Budget 2018, direct program expenses are higher in 2018–19 and 2019–20. This increase primarily reflects higher pension and benefits expenses due to lower projected long-tem interest rates in those years relative to Budget 2018, which results in actuarial losses. The impact is eliminated in later years due to projected increases in interest rates that result in actuarial gains later in the forecast period.
Public debt charges are lower across the forecast horizon, largely reflecting a reduction in long-term interest rates, which leads to lower pension interest expenses.
Details of the Trans Mountain Acquisition
On August 31, 2018, the Government of Canada purchased the entities that control the existing Trans Mountain Pipeline, its Expansion Project and related assets for $4.5 billion. This purchase price is subject to closing adjustments that are finalized up to 90 days after the closing of the transaction (August 31, 2018).
The Trans Mountain entities are controlled by the Trans Mountain Corporation, which is a subsidiary of Canada Development Investment Corporation (CDEV), an enterprise Crown corporation reporting to Parliament through the Minister of Finance. The purchase was financed through a loan to CDEV from the Canada Account, which is managed by Export Development Canada. The Government will incur debt charges associated with this loan.
At the same time, it will recognize revenues from existing Trans Mountain operations.
Consistent with generally accepted accounting standards, the Government will record the Trans Mountain entities as an asset valued at the final purchase price. Should construction of the Expansion Project be permitted to recommence prior to a sale of the Trans Mountain entities, the Government will record construction and other associated expenditures as adding to the book value of the asset.
The cash requirement for the August purchase of the Trans Mountain entities has been reflected in the Government’s projections. However, given uncertainty surrounding the timing of the construction and the eventual sale of the Trans Mountain entities, adjustments have not been made to the Government’s budgetary projections or cash requirements to account for construction costs, revenues from existing operational assets, or the eventual sale.
The Trans Mountain entities have significant commercial value and generate returns from existing operational assets. Since acquisition, the Trans Mountain entities have earned $70 million in Earnings before Interest, Taxes, Depreciation and Amortization (EBITDA). This represents EBITDA of over $200 million on an annualized basis. The Government’s purchase represents a sound investment opportunity. It is not, however, the intention of the Government of Canada to be a long-term owner of the Trans Mountain entities.Summary Statement of Transactions
Table A1.4 summarizes the Government’s projected financial position over the forecast horizon. These projections are based on the average private sector forecast for the economy discussed above.
This outlook includes new policy actions taken since Budget 2018 (Table A1.7) and new measures announced in this Fall Economic Statement.
| Projection | |||||||
|---|---|---|---|---|---|---|---|
| 2017– 2018 |
2018– 2019 |
2019– 2020 |
2020– 2021 |
2021– 2022 |
2022– 2023 |
2023– 2024 |
|
| Budgetary revenues | 313.6 | 328.9 | 339.2 | 352.1 | 367.9 | 382.1 | 396.7 |
| Program expenses | 310.7 | 320.2 | 328.3 | 337.3 | 348.2 | 359.0 | 370.8 |
| Public debt charges | 21.9 | 23.8 | 27.5 | 29.9 | 31.8 | 32.7 | 34.3 |
| Total expenses | 332.6 | 344.1 | 355.8 | 367.2 | 380.0 | 391.7 | 405.1 |
| Adjustment for risk | -3.0 | -3.0 | -3.0 | -3.0 | -3.0 | -3.0 | |
| Final budgetary balance | -19.0 | -18.1 | -19.6 | -18.1 | -15.1 | -12.6 | -11.4 |
| Federal debt1 | 671.3 | 687.7 | 707.3 | 725.5 | 740.6 | 753.2 | 764.7 |
| Per cent of GDP | |||||||
| Budgetary revenues | 14.7 | 14.8 | 14.6 | 14.7 | 14.8 | 14.8 | 14.8 |
| Program expenses | 14.5 | 14.4 | 14.2 | 14.1 | 14.0 | 13.9 | 13.8 |
| Public debt charges | 1.0 | 1.1 | 1.2 | 1.2 | 1.3 | 1.3 | 1.3 |
| Budgetary balance | -0.9 | -0.8 | -0.8 | -0.8 | -0.6 | -0.5 | -0.4 |
| Federal debt | 31.4 | 30.9 | 30.5 | 30.3 | 29.8 | 29.2 | 28.5 |
Outlook for Budgetary Revenues
| Projection | |||||||
|---|---|---|---|---|---|---|---|
| 2017– 2018 |
2018– 2019 |
2019– 2020 |
2020– 2021 |
2021– 2022 |
2022– 2023 |
2023– 2024 |
|
| Income taxes | |||||||
| Personal income tax | 153.6 | 161.9 | 170.2 | 176.4 | 184.1 | 191.7 | 200.2 |
| Corporate income tax | 47.8 | 49.5 | 45.7 | 47.1 | 50.0 | 51.1 | 53.2 |
| Non-resident income tax | 7.8 | 8.7 | 8.8 | 8.9 | 8.9 | 9.1 | 9.1 |
| Total income tax | 209.3 | 220.1 | 224.8 | 232.3 | 243.0 | 251.8 | 262.5 |
| Excise taxes/duties | |||||||
| Goods and Services Tax | 36.8 | 38.5 | 40.0 | 41.3 | 42.8 | 44.5 | 46.2 |
| Customs import duties | 5.4 | 6.0 | 5.2 | 5.3 | 5.4 | 5.6 | 5.5 |
| Other excise taxes/duties | 11.7 | 12.4 | 12.7 | 12.8 | 13.0 | 13.1 | 13.1 |
| Total excise taxes/duties | 53.8 | 57.0 | 57.8 | 59.3 | 61.1 | 63.2 | 64.8 |
| Total tax revenues | 263.1 | 277.1 | 282.6 | 291.6 | 304.1 | 315.0 | 327.3 |
| Fuel charge proceeds1 | 0.0 | 0.0 | 2.3 | 3.5 | 4.6 | 5.7 | 5.7 |
| Employment Insurance premium revenues | 21.1 | 22.0 | 22.4 | 23.2 | 24.0 | 24.9 | 25.9 |
| Other revenues | |||||||
| Enterprise Crown corporations | 7.7 | 6.8 | 7.5 | 8.1 | 8.8 | 9.3 | 10.0 |
| Other programs | 20.2 | 20.9 | 21.8 | 22.8 | 23.6 | 24.3 | 24.7 |
| Net foreign exchange | 1.5 | 2.1 | 2.5 | 2.8 | 2.8 | 2.9 | 3.2 |
| Total other revenues | 29.4 | 29.8 | 31.9 | 33.8 | 35.2 | 36.5 | 37.9 |
| Total budgetary revenues | 313.6 | 328.9 | 339.2 | 352.1 | 367.9 | 382.1 | 396.7 |
| Per cent of GDP | |||||||
| Personal income tax | 7.2 | 7.3 | 7.3 | 7.4 | 7.4 | 7.4 | 7.5 |
| Corporate income tax | 2.2 | 2.2 | 2.0 | 2.0 | 2.0 | 2.0 | 2.0 |
| Goods and Services Tax | 1.7 | 1.7 | 1.7 | 1.7 | 1.7 | 1.7 | 1.7 |
| Total tax revenues | 12.3 | 12.4 | 12.2 | 12.2 | 12.2 | 12.2 | 12.2 |
| Fuel charge proceeds | 0.0 | 0.0 | 0.1 | 0.1 | 0.2 | 0.2 | 0.2 |
| Employment Insurance premium revenues | 1.0 | 1.0 | 1.0 | 1.0 | 1.0 | 1.0 | 1.0 |
| Other revenues | 1.4 | 1.3 | 1.4 | 1.4 | 1.4 | 1.4 | 1.4 |
| Total budgetary revenues | 14.7 | 14.8 | 14.6 | 14.7 | 14.8 | 14.8 | 14.8 |
Table A1.5 sets out the Government’s projection for budgetary revenues. Overall, budgetary revenues are expected to increase by 4.9 per cent in 2018–19, reflecting strong economic growth and year-to-date results. Over the remainder of the forecast horizon, revenues are projected to grow at an average annual rate of 3.8 per cent, in line with projected growth in nominal GDP.
Personal income tax (PIT) revenues—the largest component of budgetary revenues—are projected to increase by $8.3 billion, or 5.4 per cent, to $161.9 billion in 2018–19. The strong growth in 2018–19 reflects an improved economic outlook, better-than-expected 2017–18 results that are expected to carry forward, and 2018–19 year-to-date developments. Over the remainder of the projection period, PIT revenues are forecast to increase faster than growth in nominal GDP, averaging 4.3 per cent annually, reflecting the progressive nature of the income tax system combined with projected real income gains.
Corporate income tax (CIT) revenues are projected to increase by $1.7 billion, or 3.5 per cent, to $49.5 billion in 2018–19, reflecting growth in corporate profits and correspondingly strong recent financial results. CIT revenues are then projected to decline in 2019–20 by 7.6 per cent largely due to the proposals in this Fall Economic Statement to promote business investment, namely the two immediate expensing measures and the Accelerated Investment Incentive. Over the remainder of the projection period, CIT revenues are expected to grow at an average annual rate of 3.9 per cent.
Non-resident income tax revenues are income taxes paid by non-residents on Canadian-sourced income, notably dividends and interest payments. For 2018–19, non-resident income tax revenues are projected to increase by $0.9 billion, or 11.0 per cent, based on strong year-to-date results and an expected increase in dividend, investment and interest income resulting from strong corporate profits growth. Over the remainder of the forecast horizon, these revenues are projected to grow at an average annual rate of 1.0 per cent.
Goods and Services Tax (GST) revenues are forecast to grow by 4.8 per cent in 2018–19 based on recent financial results and strong projected growth in taxable consumption over the rest of the year. Over the remainder of the projection period, GST revenues are forecast to grow by 3.7 per cent per year, on average, based on the outlook for taxable consumption.
Customs import duties are projected to grow 11.2 per cent in 2018–19, partially due to temporary retaliatory surtaxes on steel, aluminum and other products. Over the remainder of the projection horizon, annual customs import duties are projected to decline by an average of 1.9 per cent, largely due to the phase-out of tariffs under the Comprehensive Economic and Trade Agreement and the Comprehensive and Progressive Agreement for Trans-Pacific Partnership.
Other excise taxes and duties (OETD) are projected to increase by $0.8 billion, or 6.7 per cent, to $12.4 billion in 2018–19, due to additional excise duty revenues from cannabis legalization and the higher excise duty on tobacco products announced in Budget 2018. Over the remainder of the projection horizon, OETD revenues are expected to grow at an average annual rate of 1.0 per cent based on historical consumption trends.
The revenue outlook includes an estimate for direct fuel charge proceeds from the federal carbon pollution pricing system. In provinces that do not meet the Canada-wide federal standard for reducing carbon pollution—Ontario, New Brunswick, Manitoba and Saskatchewan—the majority of the proceeds will be returned through Climate Action Incentive payments to individuals and families residing in those jurisdictions. The remainder of the direct proceeds will be used to support particularly affected sectors in these jurisdictions. In Yukon and Nunavut, direct proceeds will be returned directly to those governments as they have chosen to adopt the federal carbon pollution pricing system. All direct proceeds from the federal carbon pollution pricing system will be returned to the jurisdiction of origin in which they were raised.
EI premium revenues are projected to rise by 4.1 per cent in 2018–19 based on growth in employment earnings and the increase in the EI premium rate from $1.63 per $100 of insurable earnings in 2017 to $1.66 in 2018. Growth is expected to slow to 1.8 per cent in 2019–20 due to a lower premium rate of $1.62 in 2019, as recently announced by the Canada Employment Insurance Commission. Over the remainder of the forecast horizon EI premium revenues are projected to grow at an average of 3.6 per cent annually, driven by continued growth in insurable earnings.
Other revenues are made up of three broad components: net income from enterprise Crown corporations; other program revenues from returns on investments, proceeds from the sales of goods and services, and other miscellaneous revenues; and revenues in the Exchange Fund Account.
Enterprise Crown corporation revenues are projected to decrease by 11.7 per cent in 2018–19, and grow thereafter at an average annual rate of 7.9 per cent over the remainder of the forecast horizon, reflecting outlooks presented in the corporate plans of respective enterprise Crown corporations. The projected decrease in 2018–19 largely reflects one-time positive equity adjustments (from the implementation of revised financial reporting standards) that boosted revenue growth in 2017–18.
Other program revenues are affected by consolidated Crown corporation revenues, interest rates, inflation, exchange rate movements (which affect the Canadian-dollar value of foreign-denominated assets) and flow-through items that give rise to an offsetting expense and therefore do not impact the budgetary balance. These revenues are projected to increase by 3.8 per cent in 2018–19 and grow at an average annual rate of 3.4 per cent over the remainder of the forecast horizon, reflecting the outlook for interest rates, which affects the return the Government receives on its investments, as well as projections from consolidated Crown corporation corporate plans.
Net foreign exchange revenues, which consist mainly of returns on investments held in the Exchange Fund Account, are volatile and sensitive to fluctuations in foreign exchange rates and foreign interest rates. Between 2018–19 and 2023–24, net foreign exchange revenues are projected to grow at an average annual rate of 8.8 per cent, reflecting a projected increase in interest rates and the anticipated appreciation of the Canadian dollar by private sector forecasters.
Employment Insurance Operating Account
| 2017– 2018 |
2018– 2019 |
2019– 2020 |
2020– 2021 |
2021– 2022 |
2022– 2023 |
2023– 2024 |
|||
|---|---|---|---|---|---|---|---|---|---|
| EI premium revenues | 21.1 | 22.0 | 22.4 | 23.2 | 24.0 | 24.9 | 25.9 | ||
| EI benefits1 | 19.7 | 20.1 | 21.3 | 22.6 | 23.4 | 24.2 | 24.8 | ||
| EI administration and other expenses2 | 1.9 | 1.8 | 1.8 | 1.7 | 1.7 | 1.7 | 1.7 | ||
| 20173 | 2018 | 2019 | 2020 | 2021 | 2022 | 2023 | (…) | 2026 | |
| EI Operating Account annual balance | -0.9 | 0.8 | 0.0 | -0.5 | -0.7 | -0.6 | -0.2 | -0.1 | |
| EI Operating Account cumulative balance | 1.6 | 2.4 | 2.4 | 1.9 | 1.3 | 0.7 | 0.5 | 0.34 | |
| Projected premium rate (per $100 of insurable earnings) | 1.63 | 1.66 | 1.62 | 1.62 | 1.62 | 1.62 | 1.62 | 1.62 |
The Employment Insurance Operating Account operates within the Consolidated Revenue Fund. As such, EI-related revenues and expenses that are credited and charged to the Account, respectively, in accordance with the Employment Insurance Act, are consolidated with those of the Government, and impact the budgetary balance. For consistency with the EI premium rate, which is set on a calendar-year basis with the objective of having the Account break even over time, the annual and cumulative balances of the Account are also presented on a calendar-year basis.
The EI Operating Account is expected to record an annual surplus of $0.8 billion in 2018 and to break even in 2019, before recording annual deficits for the remainder of the horizon. For fiscal planning purposes, an EI premium rate of $1.62 (unchanged from the recently announced 2019 premium rate) has been applied from 2020 onwards such that the EI Operating Account achieves cumulative balance by 2026.Outlook for Program Expenses
| Projection | |||||||
|---|---|---|---|---|---|---|---|
| 2017– 2018 |
2018– 2019 |
2019– 2020 |
2020– 2021 |
2021– 2022 |
2022– 2023 |
2023– 2024 |
|
| Major transfers to persons | |||||||
| Elderly benefits | 50.6 | 53.4 | 56.5 | 59.8 | 63.2 | 66.8 | 70.6 |
| Employment Insurance benefits1 | 19.7 | 20.1 | 21.3 | 22.6 | 23.4 | 24.2 | 24.8 |
| Children’s benefits | 23.4 | 23.9 | 24.2 | 24.7 | 25.2 | 25.7 | 26.1 |
| Total | 93.8 | 97.5 | 102.0 | 107.1 | 111.8 | 116.7 | 121.5 |
| Major transfers to other levels of government | |||||||
| Canada Health Transfer | 37.1 | 38.6 | 40.4 | 41.9 | 43.5 | 45.1 | 46.8 |
| Canada Social Transfer | 13.7 | 14.2 | 14.6 | 15.0 | 15.5 | 15.9 | 16.4 |
| Equalization | 18.3 | 19.0 | 19.8 | 20.6 | 21.4 | 22.1 | 23.0 |
| Territorial Formula Financing | 3.7 | 3.8 | 4.0 | 4.1 | 4.3 | 4.4 | 4.6 |
| Gas Tax Fund2 | 2.1 | 2.2 | 2.2 | 2.2 | 2.3 | 2.3 | 2.4 |
| Home care and mental health | 0.3 | 0.9 | 1.1 | 1.3 | 1.5 | 1.2 | 1.2 |
| Other fiscal arrangements3 | -4.7 | -4.7 | -5.4 | -5.4 | -5.7 | -6.0 | -6.3 |
| Total | 70.5 | 73.8 | 76.7 | 79.7 | 82.7 | 85.1 | 88.1 |
| Direct program expenses | |||||||
| Fuel charge proceeds returned4 | 0.0 | 0.6 | 2.6 | 3.8 | 4.9 | 5.7 | 5.7 |
| Other transfer payments | 47.1 | 48.0 | 51.0 | 51.8 | 51.9 | 53.0 | 54.1 |
| Operating expenses5 | 99.2 | 100.3 | 96.0 | 95.0 | 96.9 | 98.6 | 101.4 |
| Total | 146.4 | 149.0 | 149.6 | 150.6 | 153.7 | 157.2 | 161.1 |
| Total program expenses | 310.7 | 320.2 | 328.3 | 337.3 | 348.2 | 359.0 | 370.8 |
| Per cent of GDP | |||||||
| Major transfers to persons | 4.4 | 4.4 | 4.4 | 4.5 | 4.5 | 4.5 | 4.5 |
| Major transfers to other levels of government | 3.3 | 3.3 | 3.3 | 3.3 | 3.3 | 3.3 | 3.3 |
| Direct program expenses | 6.8 | 6.7 | 6.5 | 6.3 | 6.2 | 6.1 | 6.0 |
| Total program expenses | 14.5 | 14.4 | 14.2 | 14.1 | 14.0 | 13.9 | 13.8 |
Table A1.6 provides an overview of the projections for program expenses, on an accrual basis, by major component. A more detailed outlook for 2018–19 can be found in Tables A1.10 and A1.11, which also provide a full reconciliation between the 2018–19 Estimates and the budgetary balance presented in this Fall Economic Statement.
Major transfers to persons are projected to increase from $97.5 billion in 2018–19 to $121.5 billion in 2023–24. Major transfers to persons consist of elderly, EI and children’s benefits.
Elderly benefits, which are comprised of Old Age Security, Guaranteed Income Supplement and Allowance payments to qualifying seniors, are projected to grow from $53.4 billion in 2018–19 to $70.6 billion in 2023–24, or approximately 5.7 per cent per year. The expected increase in elderly benefits is due to projected consumer price inflation, to which benefits are fully indexed, and a projected increase in the population of seniors.
EI benefits are projected to be $20.1 billion in 2018–19. Over the remainder of the projection period, EI benefits are projected to grow at an average of 4.3 per cent annually, reflecting growth in both the number of beneficiaries and average weekly benefits.
Children’s benefits are projected to rise from $23.9 billion in 2018–19 to $26.1 billion in 2023–24, or approximately 1.8 per cent annually, reflecting an increase in the projected number of children eligible for the Canada Child Benefit as well as the full indexation of the benefit to consumer price inflation.
Major transfers to other levels of government, which include the Canada Health Transfer (CHT), the Canada Social Transfer (CST), Equalization, Territorial Formula Financing and the Gas Tax Fund, among others, are expected to increase over the forecast horizon, from $73.8 billion in 2018–19 to $88.1 billion in 2023–24.
The CHT is projected to grow from $38.6 billion in 2018–19 to $46.8 billion in 2023–24. The CHT grows in line with a three-year moving average of nominal GDP growth, with funding guaranteed to increase by at least 3.0 per cent per year. The CST is legislated to grow at 3.0 per cent per year. Gas Tax Fund payments are indexed at 2.0 per cent per year, with increases applied in $100 million increments. Home care and mental health transfers are projected to grow from $0.9 billion in 2018–19 to $1.2 billion in 2023–24.
Direct program expenses are projected to rise to $149.0 billion in 2018–19 and further to $161.1 billion in 2023–24. Direct program expenses include other transfer payments administered by departments and operating expenses.
The projected increase in direct program expenses is driven, in large part, by the introduction of carbon pollution pricing and the associated return of direct fuel charge proceeds, which are expected to increase from $0.6 billion in 2018–19 to $5.7 billion in 2023–24. There is also a projected increase in other transfer payments administered by departments over the forecast horizon, including transfers to provincial, municipal and Indigenous governments and post-secondary institutions for investment in infrastructure. Other transfer payments are projected to increase from $48.0 billion in 2018–19 to $54.1 billion in 2023–24.
Operating expenses reflect the cost of doing business for more than 100 government departments, agencies and Crown corporations, and are projected to reach $100.3 billion in 2018–19. Operating expenses are projected to decrease to $95.0 billion in 2020–21, and then grow to $101.4 billion in 2023–24. The growth in operating expenses is composed of growth in departmental expenses, which is largely offset by falling expenses related to pensions and employee future benefits, reflecting the projected rise in long-term interest rates.
Pricing Carbon Pollution While Delivering Climate Action Incentive Payments
The federal carbon pollution pricing system is not about raising revenues. It is about recognizing that pollution has a cost, empowering Canadians, and encouraging cleaner growth and a more sustainable future. The Government of Canada will not keep any direct proceeds from the federal carbon pollution pricing system.
- For jurisdictions that have chosen to adopt the federal system, the Government will return the direct proceeds from the federal carbon pollution pricing system to the governments of those jurisdictions.
- For provinces that do not meet the Canada-wide federal standard for reducing carbon pollution (Ontario, New Brunswick, Manitoba and Saskatchewan), the Government will return the majority of direct proceeds from the regulatory charge on fossil fuels (the “fuel charge”), in the form of Climate Action Incentive payments, to individuals and families in the province of origin. The balance will be used to support particularly affected sectors in these provinces. Direct proceeds from the second component of the federal carbon pollution pricing system, the output-based pricing system (OBPS) for emissions-intensive industrial facilities, will also be returned to the province of origin. Given that these proceeds would only be realized in 2020 and the uncertainty associated with estimating proceeds at this stage, no amount from the OBPS has been provisioned.
The table below shows the estimated total direct proceeds from the federal fuel charge for each of the pollution prices planned to be in effect from 2019 to at least 2022 (at which point the system, as a whole, will be reviewed). All direct proceeds from the federal fuel charge will be returned to the province of origin. For any 12-month period at the same pollution price, the total amounts being returned to a jurisdiction are equal to the direct proceeds being collected in that province: there are no proceeds left over, and no federal funds are being distributed. Because a number of individuals will claim their Climate Action Incentive payment before the fuel charge comes into effect—by filing their personal income tax returns before the end of the fiscal year (March 31st)—the accounting treatment of these payments for the purposes of the fiscal projections in this document shows some costs being brought forward in time. If direct proceeds from the federal fuel charge are greater than or less than estimated, adjustments will be made to future Climate Action Incentive payments.
| Federal pollution price (/tonne, CO2 equivalent emissions) |
$20 | $30 | $40 | $50 | |
|---|---|---|---|---|---|
| Expected first month of application (provinces) | April 2019 | April 2020 | April 2021 | April 2022 | |
| 2018–19 | 2019–20 | 2020–21 | 2021–22 | 2022–23 | |
| Projected net fuel charge proceeds | 2,325 | 3,450 | 4,550 | 5,620 | |
| Less: projected Climate Action Incentive payments (claimed by March 31st) | -630 | -935 | -1,230 | -1,515 | -1,515 |
| Less: projected Climate Action Incentive payments (others) | -1,465 | -2,175 | -2,870 | -3,540 | |
| Less: support for particularly affected sectors | -230 | -340 | -450 | -565 | |
| Net fiscal cost | -630 | -305 | -295 | -285 | 0 |
| Projected fuel charge proceeds less total proceeds returned for year starting April of the specified year2 |
2019 | 2020 | 2021 | 2022 | |
| 0 | 0 | 0 | 0 |
Impact of Alternative Economic Scenarios
The fiscal projections presented in this Fall Economic Statement are based on an average of the September 2018 private sector economic outlook survey. However, economists surveyed offered a wide range of views regarding future economic growth and, therefore, the path of nominal GDP (the broadest measure of the tax base). Changes in economic growth assumptions can also have large impacts on the budgetary balance and debt-to-GDP profile over an extended projection horizon.
For example, if economic growth was stronger than expected, equalling the average of the top four individual forecasts for nominal GDP growth—which is equivalent to nominal GDP growth being 0.4 percentage points per year higher, on average, than in the full September survey—the budgetary balance would improve by $5.0 billion per year on average and potentially reach balance by 2023–24 (Chart A1.1). Further, this would result in a federal debt-to-GDP ratio of 26.1 per cent, which would be its lowest level since 1978.
Continued economic strength would accelerate deficit reduction
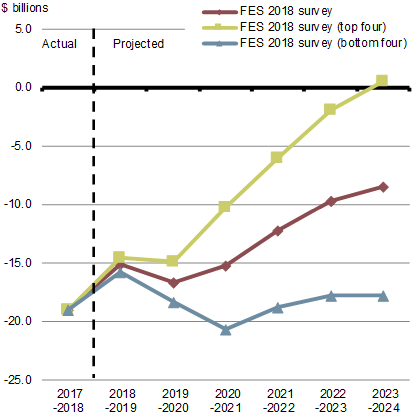
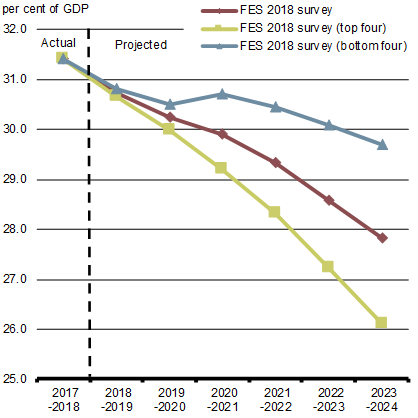
Notes: Based on the average private sector economists’ projection for nominal GDP, excluding the adjustment for risk. The top (bottom) four scenarios are based on the average of the most optimistic (pessimistic) projections for nominal GDP among the economists surveyed.
Sources: Department of Finance Canada September 2018 survey of private sector economists; Department of Finance Canada calculations.
Conversely, basing fiscal projections on the average of the bottom four individual forecasts for nominal GDP growth—which is equivalent to nominal GDP growth being 0.4 percentage points per year lower, on average, than in the full September survey—the budgetary balance would worsen by $5.3 billion per year on average, and the federal debt-to-GDP ratio would still decline, but would be 29.7 per cent in 2023–24.
Policy Actions Taken Since Budget 2018
| 2018– 2019 |
2019– 2020 |
2020– 2021 |
2021– 2022 |
2022– 2023 |
2023– 2024 |
Total | |
|---|---|---|---|---|---|---|---|
| Growth, Innovation and Infrastructure and the Environment | 934 | 717 | 466 | 476 | 85 | 87 | 2,765 |
| Transportation Safety Board | 3 | 3 | 3 | 3 | 3 | 3 | 20 |
| Funding provided to the Transportation Safety Board to alleviate a series of funding pressures. | |||||||
| Increased Funding for the Regional Development Agencies | 8 | 12 | 0 | 0 | 0 | 0 | 21 |
| Reinvestment of receipts from repayable contributions to increase economic development activities. | |||||||
| Indemnification of NAV Canada | - | - | - | - | - | - | - |
| Indemnification of NAV Canada from any liabilities arising from air navigation services provided to the Department of National Defence. | |||||||
| Steel and Aluminum Response Plan | 155 | 157 | 7 | 6 | 0 | 0 | 325 |
| Less: Projected EI Revenues | -3 | -10 | -10 | -10 | -11 | -11 | -55 |
| Funding was provided to the Department of Innovation, Science and Economic Development and Employment and Social Development Canada to provide support for the steel and aluminum industries, along with reliant workers and communities, impacted by the ongoing trade dispute with the United States. As discussed in the text box entitled “Steel and Aluminum Tariffs”, on a cash basis, this funding more than offsets the projected tariff revenue from Canadian countermeasures in effect since July 1, 2018. Projected revenues refers to the estimated offset from higher EI premiums resulting from the EI elements of this measure. | |||||||
| Establishing Better Rules to Protect the Environment and Grow the Economy | -11 | 3 | 1 | 2 | 3 | 0 | -2 |
| In February 2018, the Government announced that it would invest up to $1.01 billion over five years to support the proposed new impact assessment regime and Canadian Energy Regulator; increase science capacity in federal departments and agencies; implement the changes required to protect water, fish and navigation; and increase Indigenous and public participation. The funding profile has since been adjusted to better reflect Departmental requirements. | |||||||
| Acquisition of Icebreaking Capabilities | 0 | 9 | 36 | 53 | 53 | 53 | 203 |
| Interim Icebreaking Solutions - Operating | 2 | 30 | 10 | 15 | 28 | 24 | 109 |
| Funding to support the acquisition and operation of commercial icebreaking vessels by the Canadian Coast Guard. These vessels will provide interim capability for the Canadian Coast Guard while existing ships undergo maintenance and vessel life extensions, and replacement vessels are built under the National Shipbuilding Strategy. | |||||||
| LNG Canada Support Measures | 90 | 90 | 45 | 45 | 5 | 0 | 275 |
| Funding support for LNG Canada for a $40 billion investment to support a liquefied natural gas (LNG) investment in Kitimat, British Columbia. | |||||||
| Protection of Southern Resident Killer Whale | 0 | 21 | 17 | 16 | 15 | 13 | 82 |
| Less: Funds Sourced from Existing Departmental Resources | 0 | -5 | -5 | -4 | -3 | -2 | -20 |
| Funding to implement protection measures for the Southern Resident Killer Whale to address key threats to their survival and recovery including reduced prey availability, physical and acoustic disturbances, and environmental contaminants. | |||||||
| Destination Canada – Outreach Funding | 3 | 0 | 0 | 0 | 0 | 0 | 3 |
| Funding for Destination Canada to increase its promotion of business events and meetings and increase its tourism marketing initiative in the U.S. | |||||||
| Restoring Rail Service to Churchill, Manitoba | 52 | 30 | 4 | 4 | 4 | 4 | 100 |
| Less: Funds Sourced from Existing Departmental Resources | -7 | -6 | 0 | 0 | -20 | 0 | -33 |
| Funding provided for acquisition, repairs, and an annual operating subsidy required by the Hudson Bay Railway Company, the Hudson Bay Port Company, and the Churchill Marine Tank Farm. | |||||||
| International Oceans Leadership | 6 | 37 | 43 | 42 | 37 | 0 | 166 |
| Less: Funds previously provisioned in the International Assistance Envelope | 0 | -18 | -36 | -36 | -30 | 0 | -120 |
| Less: Funds Sourced from Existing Departmental Resources | -6 | -2 | 0 | 0 | 0 | 0 | -9 |
| Funding for G7 commitments to support resilient coasts and coastal communities, sustainable oceans and fisheries, and efforts to address plastic waste in the ocean and other marine litter. | |||||||
| Pricing Carbon Pollution and Supporting Clean Growth | |||||||
| Climate Action Incentive Payments Net Fiscal Impact | 630 | 305 | 295 | 285 | 0 | 0 | 1,515 |
| Funding for the Canada Revenue Agency | 10 | 58 | 54 | 53 | 0 | 0 | 175 |
| Funding for the Department of Finance | 1 | 2 | 2 | 2 | 2 | 2 | 11 |
Funding for the Canada Revenue Agency to administer Climate Action Incentive payments and the application of the federal carbon pollution pricing backstop system. Actual funding for the Canada Revenue Agency is expected to be lower, given that Climate Action Incentive payments will be made in four provinces. Remaining amounts that are not required to implement Climate Action Incentive payments or cannot be fully substantiated by the Treasury Board are to be returned to the fiscal framework. Further, funding to the Department of Finance for administration, monitoring, and reporting in respect of the carbon pollution pricing system. Finally, as previously noted in the text box entitled “Pricing Carbon Pollution While Delivering Climate Action Incentive Payments,” the accounting treatment of Climate Action Incentive payments for the purposes of the fiscal projections in this document requires some of the costs to be borne in the fiscal year prior to the fuel charge being collected, because they are delivered through the personal income tax system through returns for the previous tax year. In practice, however, the Government of Canada is simply taking the direct proceeds from the fuel charge and returning all the proceeds to the province of origin. |
|||||||
| Labour Markets, Health, Safety and Economic Prosperity of Canadians | 659 | 172 | 245 | 215 | 246 | 271 | 1,807 |
| Accessible Canada | 9 | 45 | 55 | 61 | 64 | 64 | 298 |
| Less: Funds Sourced from Existing Departmental Resources | -1 | -1 | -1 | -1 | -1 | -1 | -7 |
| Funding to further the objectives of the new Accessible Canada Act, which will enable the Government to take a proactive approach to end systemic discrimination of persons with disabilities. The act would establish a model to eliminate accessibility barriers and lead to more consistent accessibility in areas of federal jurisdiction across Canada. | |||||||
| Northern Housing | 10 | 10 | 10 | 10 | 10 | 10 | 60 |
| Less: Funds Sourced from Existing Departmental Resources | -10 | -10 | -10 | -10 | -10 | -10 | -60 |
| As part of the National Housing Strategy, the Government is dedicating funding from within the National Housing Co-Investment Fund to support housing needs in the Northwest Territories and Yukon. | |||||||
| Strengthening Federal Corrections and Keeping Communities Safe | 13 | 44 | 59 | 85 | 115 | 132 | 448 |
| Funding to support amendments to transform federal corrections, including the introduction of a new correctional interventions model to eliminate segregation. | |||||||
| Extension of the Missing and Murdered Indigenous Women and Girls Inquiry | 32 | 7 | 0 | 0 | 0 | 0 | 38 |
| Funding provided to the Privy Council Office to support the extension of the Inquiry into Missing and Murdered Indigenous Women and Girls. | |||||||
| Jordan’s Principle | 297 | 0 | 0 | 0 | 0 | 0 | 297 |
| Funding provided to Indigenous Services Canada to address increased demand for health, social and education services for First Nations children under Jordan’s Principle and Inuit children under the Child First Initiative. | |||||||
| Response to the Interim Report of the Inquiry into Missing and Murdered Indigenous Women and Girls | 18 | 22 | 4 | 2 | 2 | 2 | 50 |
| Funding provided to Indigenous Services Canada, Justice Canada, Public Safety Canada, Royal Canadian Mounted Police and Status of Women Canada in response to the November 2017 interim report of the Inquiry into Missing and Murdered Indigenous Women and Girls. | |||||||
| Broadening Eligibility for the Softwood Lumber Action Plan's Workforce Adjustment Measures | 29 | 0 | 0 | 0 | 0 | 0 | 29 |
| Less: Funds previously provisioned in the Fiscal Framework | -25 | 0 | 0 | 0 | 0 | 0 | -25 |
| Less: Funds Sourced from Existing Departmental Resources | -4 | 0 | 0 | 0 | 0 | 0 | -4 |
| Repurposing of funds to broaden eligibility for the Softwood Lumber Action Plan's workforce adjustment measures to all workers across Canada directly or indirectly affected by any forest sector trade disputes. | |||||||
| Irregular Migration - Support to Provinces and Territories | 50 | 0 | 0 | 0 | 0 | 0 | 50 |
| Compensation for Québec, Ontario and Manitoba to address requirements for temporary housing for irregular migrants. | |||||||
| 2019 to 2021 Immigration Levels Plan | 0 | 3 | 16 | 30 | 38 | 46 | 133 |
| Funding for Immigration, Refugees and Citizenship Canada and partners to implement the 2019 to 2021 Immigration Levels Plan, which will set permanent resident admissions targets for 2019 at 330,800, 2020 at 341,000, and 2021 at 350,000. | |||||||
| Ex Gratia Payment to Quebec (in support of the province's health system) | 0 | 0 | 0 | 0 | 0 | 0 | 0 |
| In March 2018, on the basis of amounts of extra-billing and user charges reported by the Quebec Auditor General with respect to 2015-16, the Minister of Health estimated a deduction amount of $9,907,229. In light of corrective action the provincial government had already taken to eliminate accessory fees in January 2017, that amount was subsequently returned to Quebec by the Government of Canada. | |||||||
| Bid Support for the Calgary 2026 Olympics | 14 | 1 | 0 | 0 | 0 | 0 | 14 |
| Funding provided to Canadian Heritage to support a potential bid to host the 2026 Winter Olympic and Paralympic Games in Calgary. This included funding to advance Calgary's exploration of a formal bid, as well as federal coordination for a bid. | |||||||
| FIFA World Cup - Bid Support | 3 | 2 | 0 | 0 | 0 | 0 | 5 |
| Funding to support the Canadian Soccer Association in its submission of a joint bid to co-host the 2026 FIFA Men’s World Cup with the United States and Mexico (United 2026). | |||||||
| Earlier Implementation of EI Parental Sharing Benefit | 35 | 54 | -1 | 0 | 0 | 0 | 87 |
| Less: Projected Revenues | 0 | -4 | -11 | -12 | -12 | -12 | -51 |
| Incremental funding to implement the EI Parental Sharing Benefit in March 2019, instead of June 2019 as announced in Budget 2018. | |||||||
| Supporting Workers in Seasonal Industries | 35 | 107 | 83 | 6 | 0 | 0 | 230 |
| Less: Funds previously provisioned in the Fiscal Framework | -80 | -150 | 0 | 0 | 0 | 0 | -230 |
| Repurposing and reprofiling of funds announced in Budget 2018 to introduce a new targeted EI Part I pilot project to provide additional weeks of income support to seasonal claimants, and to offer incremental funding through Labour Market Development Agreements to support workers in seasonal industries. | |||||||
| Correctional Service of Canada Quasi-Statutory Adjustment | 0 | 16 | 16 | 16 | 16 | 16 | 80 |
| Funding provided to the Correctional Service of Canada to account for fluctuations in everyday costs associated with correctional operations. | |||||||
| Implementing changes to Working While on Claim | 3 | 2 | 2 | 2 | 2 | 2 | 14 |
| Less: Projected Revenues | 0 | -1 | -2 | -2 | -2 | -3 | -10 |
| Incremental funding for administration costs associated with extending Employment Insurance Working While on Claim rules to sickness and maternity claims. | |||||||
| Modernizing Federal Labour Standards and amendments to the WEPP | 70 | 27 | 25 | 27 | 24 | 25 | 199 |
| Less: Funds Sourced from Existing Departmental Resources | -2 | 0 | 0 | 0 | 0 | 0 | -2 |
| Funding provided to support modernization of federal labour standards and to enhance Wage Earner Protection Program (WEPP) to increase the financial security for workers who are owed wages when their employer files for bankruptcy or enters receivership. | |||||||
| Disability Pension Adjustment Correction | 165 | 0 | 0 | 0 | 0 | 0 | 165 |
| Funding provided to Veterans Affairs Canada to issue payments addressing an error in the calculation of Disability Pension benefits that occurred between 2003 and 2010 and ensure affected veterans and their families receive the benefits they were owed over the period. | |||||||
| Government Operations, Fairness and Openness | 44 | 99 | 39 | 36 | 36 | 28 | 282 |
| Department of Finance Support for Government Priorities | 1 | 1 | 2 | 2 | 2 | 2 | 9 |
| Funding to address pressures stemming from an increasing workload that the Department has undertaken in meeting Government priorities primarily related to: management of major Government assets (e.g., the Trans Mountain pipeline); anti‑money laundering fees; and, other legal and regulatory drafting costs. | |||||||
| Central Fund for Government of Canada Advertising | 5 | 5 | 5 | 5 | 5 | 5 | 28 |
| Funding provided to increase the central fund for Government of Canada advertising. | |||||||
| Modernization of the Canada Elections Act | 17 | 47 | 8 | 8 | 8 | 0 | 87 |
| Funding to support amendments to the Canada Elections Act, which change spending limits for political parties and third parties, increase equity and accessibility, and improve the administration of elections. | |||||||
| Supporting Privy Council Office Ministers | 8 | 12 | 12 | 12 | 12 | 12 | 66 |
| Funding provided to the Privy Council Office (PCO) to increase operational capacity to support PCO Ministers (the Leader of the Government in the House of Commons, the Minister of Democratic Institutions and the Minister of Intergovernmental and Northern Affairs and Internal Trade). | |||||||
| Government Response to Bill C‑316 Regarding Increasing Organ Donations | 0 | 4 | 0 | 0 | 0 | 0 | 4 |
| Funding for the Canada Revenue Agency to collect individual consents to share personal information with provinces and territories for the purpose of receiving further information on becoming an organ donor. | |||||||
| Addressing Corporate Integrity | 4 | 8 | 8 | 8 | 8 | 8 | 43 |
| Funding provided to Public Services and Procurement Canada and the Public Prosecutions Service of Canada in support of enhancements to the Integrity Regime and the introduction of a Remediation Agreements regime, as committed to in Budget 2018. | |||||||
| Governor In Council Appointment Process | 5 | 6 | 5 | 2 | 2 | 2 | 24 |
| Funding to the Privy Council Office to support the administration of the new transparent Governor in Council (GIC) Appointment Process announced in Budget 2016. | |||||||
| Support for the Public Prosecution Service of Canada | 4 | 17 | 0 | 0 | 0 | 0 | 21 |
| Funding provided to the Public Prosecution Service of Canada to support continued operations concerning the prosecution of criminal offences under federal jurisdiction. | |||||||
| Tax and Financial Sector Policy | 56 | 56 | 77 | 97 | 107 | 108 | 501 |
| Taxation of Communal Organizations | 45 | 15 | 15 | 15 | 15 | 15 | 120 |
| The 2018 Fall Economic Statement proposes to amend the Income Tax Act to ensure that the business income of communal organizations retains its character when it is allocated to members of the communal organization for income tax purposes, effective for the 2014 and subsequent taxation years. | |||||||
| Extend the Tax Deduction for Canadian Armed Forces Personnel and Police Officers | 1 | 1 | 2 | 2 | 2 | 3 | 11 |
| Allow the Minister of Public Safety to determine international operational missions on which police and Canadian Forces members would be eligible for tax relief, in the same manner as the Minister of National Defence. | |||||||
| Response to Consultation Panel on Political Activities by Charities | 10 | 40 | 60 | 80 | 90 | 90 | 370 |
| The Government has proposed, in Bill C-86, changes to the Income Tax Act to remove the current limits on non-partisan political activities to allow charities to engage fully in public policy dialogue and development in furtherance of their charitable purposes. This cost reflects the expected increase in claims of the Charitable Donation Tax Credit and other tax incentives for charities. | |||||||
| Trade, International Relations and Security | 15 | 109 | 130 | 88 | 79 | 17 | 438 |
| Renewal of Operation REASSURANCE | 0 | 130 | 129 | 128 | 127 | 0 | 514 |
| Less: Funds Sourced from Existing Departmental Resources | 0 | -39 | -15 | -56 | -65 | 0 | -175 |
| Funding for the renewal of Operation REASSURANCE, Canada's contribution to North Atlantic Treaty Organization (NATO) assurance and deterrence measures in Central and Eastern Europe. | |||||||
| Secure Communication for National Leadership | 12 | 7 | 5 | 5 | 5 | 5 | 39 |
| Less: Funds Sourced from Existing Departmental Resources | -5 | 0 | 0 | 0 | 0 | 0 | -5 |
| Funding provided to the Privy Council Office, the Communications Security Establishment and Shared Services Canada to expand access to secure communication technologies for senior leaders in the Government of Canada. | |||||||
| Education for Women and Girls in Crisis and Conflict Situations | 100 | 150 | 150 | 0 | 0 | 0 | 400 |
| Less: Funds previously provisioned in the International Assistance Envelope | -100 | -150 | -150 | 0 | 0 | 0 | -400 |
| Funding to improve access and reduce barriers to quality education for women and girls around the world in crisis and conflict situations. | |||||||
| Steel Trade Enforcement | 4 | 6 | 7 | 7 | 7 | 7 | 38 |
| Trade Dispute Resources | 4 | 5 | 5 | 5 | 5 | 5 | 28 |
| Funding for the administration of Canada's policy responses in respect of the U.S. steel and aluminum tariffs. These resources will support the Canada Border Services Agency, Global Affairs Canada, the Canadian International Trade Tribunal, Administrative Tribunals Support Service of Canada and Finance Canada in administering a number of related policy actions, including Canada's tariff countermeasures, duties relief programming, duty remission, trade remedy investigations and enforcement, and steel import monitoring and safeguards. | |||||||
| Technical Assistance to support the International Assistance Innovation Program and Sovereign Loans Program | 0 | 29 | 21 | 21 | 23 | 23 | 116 |
| Less: Funds previously provisioned in the International Assistance Envelope | 0 | -29 | -21 | -21 | -23 | -23 | -116 |
| Funding to provide technical assistance and capacity building in developing countries as part of the new International Assistance Innovation Program and the Sovereign Loans Program announced in Budget 2018. | |||||||
| Knowledge Sharing Platform for Tax Administrations | 3 | 3 | 4 | 4 | 4 | 0 | 17 |
| Less: Funds previously provisioned in the International Assistance Envelope | -3 | -3 | -4 | -4 | -4 | 0 | -17 |
| Funding to create an end-state global Knowledge Sharing Platform for Tax Administrations, a digital tool designed to promote and share knowledge and expertise among tax officials globally. The platform supports tax capacity building in developing countries and better equips countries to deal with the global challenge of international tax evasion and aggressive tax avoidance. | |||||||
| Global Infrastructure Hub and the Global Centre for Infrastructure Excellence | 20 | 0 | 0 | 0 | 0 | 0 | 20 |
| Less: Funds previously provisioned in the International Assistance Envelope | -20 | 0 | 0 | 0 | 0 | 0 | -20 |
| Funding to support the Global Infrastructure Hub's second four-year term, including the establishment of an office in Toronto as the centre for its North American operations. Includes $5 million in funding to launch the Global Centre for Infrastructure Excellence which will focus on making sure private investments are effectively mobilized for resilient, sustainable infrastructure that benefits everyone. | |||||||
| Net Fiscal Impact – Policy Actions Since Budget 2018 | 1,707 | 1,153 | 957 | 911 | 553 | 511 | 5,792 |
| (Net) Fiscal Impact of Non-Announced Measures | 1,754 | 527 | 541 | 2,090 | 1,849 | 2,777 | 9,538 |
| Net Fiscal Impact – Total Policy Actions Since Budget 2018 | 3,460 | 1,680 | 1,498 | 3,001 | 2,402 | 3,288 | 15,330 |
Policy Actions and Fall Economic Statement Investments by Department (Cash Basis)
| 2018-2019 | 2019-2020 | 2020-2021 | 2021-2022 | 2022-2023 | 2023-2024 | Total (Cash) | |
|---|---|---|---|---|---|---|---|
| Administrative Tribunals Support Service of Canada | 2 | 0 | 1 | 1 | 1 | 1 | 7 |
| Accessible Canada | 0 | 0 | 1 | 1 | 1 | 1 | 5 |
| Trade Dispute Resources | 2 | 0 | 0 | 0 | 0 | 0 | 2 |
| Atlantic Canada Opportunities Agency | 26 | 0 | 0 | 0 | 0 | 0 | 26 |
| Increased Funding for the Regional Development Agencies | 26 | 0 | 0 | 0 | 0 | 0 | 26 |
| Canada Border Services Agency | 5 | 10 | 12 | 12 | 12 | 12 | 64 |
| 2019 to 2021 Immigration Levels Plan | 0 | 1 | 2 | 2 | 2 | 2 | 7 |
| Steel Trade Enforcement | 4 | 6 | 7 | 6 | 6 | 6 | 36 |
| Trade Dispute Resources | 1 | 4 | 4 | 4 | 4 | 4 | 21 |
| Canada Revenue Agency | 19 | 73 | 61 | 55 | 4 | 0 | 211 |
| Fuel Charge Administration | 6 | 22 | 22 | 22 | 0 | 0 | 72 |
| Knowledge Sharing Platform for Tax Administrations | 3 | 3 | 4 | 4 | 4 | 0 | 17 |
| Implementation of Government Response to Bill C-316 Regarding Increasing Organ Donation | 0 | 4 | 0 | 0 | 0 | 0 | 4 |
| Returning Carbon Pollution Proceeds | 10 | 44 | 35 | 29 | 0 | 0 | 119 |
| Canadian Heritage | 17 | 3 | 0 | 0 | 0 | 0 | 19 |
| FIFA World Cup - Bid Support | 3 | 2 | 0 | 0 | 0 | 0 | 5 |
| Bid Support for the Calgary 2026 Olympics | 14 | 1 | 0 | 0 | 0 | 0 | 14 |
| Canadian Human Rights Commission | 0 | 3 | 4 | 6 | 8 | 8 | 30 |
| Accessible Canada | 0 | 3 | 4 | 6 | 8 | 8 | 30 |
| Canadian Human Rights Tribunal | 0 | 0.01 | 0.02 | 0.03 | 0.04 | 0.04 | 0.14 |
| Accessible Canada | 0 | 0.01 | 0.02 | 0.03 | 0.04 | 0.04 | 0.14 |
| Canadian Transportation Agency | 0 | 0 | 1 | 1 | 0 | 0 | 3 |
| Accessible Canada | 0 | 0 | 1 | 1 | 0 | 0 | 3 |
| Communications Security Establishment Canada | 3 | 3 | 0 | 0 | 0 | 0 | 5 |
| Secure Communication for National Leadership | 3 | 3 | 0 | 0 | 0 | 0 | 5 |
| Correctional Service of Canada | 13 | 60 | 75 | 101 | 131 | 148 | 528 |
| Strengthening Federal Corrections and Keeping Communities Safe | 13 | 44 | 59 | 85 | 115 | 132 | 448 |
| Correctional Service of Canada Quasi-Statutory Adjustment | 0 | 16 | 16 | 16 | 16 | 16 | 80 |
| Department of Finance Canada | 2 | 4 | 5 | 5 | 5 | 5 | 24 |
| Trade Dispute Resources | 0 | 1 | 1 | 1 | 1 | 1 | 5 |
| Returning Carbon Pollution Proceeds | 1 | 2 | 2 | 2 | 2 | 2 | 11 |
| Department of Finance Support for Government Priorities | 1 | 1 | 2 | 2 | 2 | 2 | 9 |
| Economic Development Agency of Canada for the Regions of Québec | 0 | 47 | 0 | 0 | 0 | 0 | 47 |
| Increased Funding for the Regional Development Agencies | 0 | 47 | 0 | 0 | 0 | 0 | 47 |
| Elections Canada | 17 | 47 | 8 | 8 | 8 | 0 | 87 |
| Modernization of the Canada Elections Act | 17 | 47 | 8 | 8 | 8 | 0 | 87 |
| Employment and Social Development Canada | 100 | 72 | 65 | 73 | 70 | 71 | 451 |
| Accessible Canada | 7 | 28 | 36 | 42 | 44 | 44 | 200 |
| Earlier Implementation of EI Parental Sharing Benefit | 13 | 9 | -1 | 0 | 0 | 0 | 21 |
| Implementing changes to Working While on Claim | 3 | 2 | 2 | 2 | 2 | 2 | 14 |
| Steel and Aluminum Response Plan | 1 | 1 | 1 | 1 | 0 | 0 | 4 |
| Supporting Workers in Seasonal Industries | 9 | 5 | 3 | 1 | 0 | 0 | 17 |
| Modernizing Federal Labour Standards and amendments to the WEPP | 68 | 27 | 25 | 27 | 24 | 25 | 196 |
| Fisheries and Oceans Canada | 828 | 56 | 24 | 28 | 40 | 30 | 1,007 |
| Acquisition of Icebreaking Capabilities – Canadian Coast Guard | 828 | 30 | 10 | 15 | 28 | 24 | 935 |
| International Oceans Leadership | 0 | 18 | 8 | 7 | 7 | 0 | 39 |
| Protection of Southern Resident Killer Whale | 0 | 8 | 6 | 6 | 6 | 6 | 33 |
| Global Affairs Canada | -2 | 26 | 18 | 17 | 20 | 23 | 102 |
| Knowledge Sharing Platform for Tax Administrations | -3 | -3 | -4 | -4 | -4 | 0 | -17 |
| Steel Trade Enforcement | 0.3 | 0.3 | 0.3 | 0.3 | 0.3 | 0.3 | 1.9 |
| Technical Assistance to support the International Assistance Innovation Program and Sovereign Loans Program | 0 | 29 | 21 | 21 | 23 | 23 | 116 |
| Trade Dispute Resources | 1 | 0 | 0 | 0 | 0 | 0 | 1 |
| Immigration, Refugees and Citizenship Canada | 50 | 2 | 15 | 28 | 36 | 44 | 175 |
| Irregular Migration - Support to Provinces and Territories | 50 | 0 | 0 | 0 | 0 | 0 | 50 |
| 2019 to 2021 Immigration Levels Plan | 0 | 2 | 15 | 28 | 36 | 44 | 125 |
| Indigenous Services Canada | 308 | 9 | 2 | 0 | 0 | 0 | 319 |
| Jordan’s Principle | 297 | 0 | 0 | 0 | 0 | 0 | 297 |
| Response to the Interim Report of the Inquiry into Missing and Murdered Indigenous Women and Girls | 11 | 9 | 2 | 0 | 0 | 0 | 21 |
| Innovation, Science and Economic Development Canada | 218 | 215 | 45 | 45 | 5 | 0 | 528 |
| LNG Canada Support Measures | 90 | 90 | 45 | 45 | 5 | 0 | 275 |
| Steel and Aluminum Response Plan | 125 | 125 | 0 | 0 | 0 | 0 | 250 |
| Destination Canada – Outreach Funding | 3 | 0 | 0 | 0 | 0 | 0 | 3 |
| Justice Canada | 0 | 5 | 0 | 0 | 0 | 0 | 5 |
| Response to the Interim Report of the Inquiry into Missing and Murdered Indigenous Women and Girls | 0 | 5 | 0 | 0 | 0 | 0 | 5 |
| National Defence | 0 | 96 | 116 | 68 | 59 | 0 | 339 |
| Renewal of Operation REASSURANCE | 0 | 96 | 116 | 68 | 59 | 0 | 339 |
| Parks Canada | 0 | 7 | 3 | 3 | 3 | 3 | 18 |
| Protection of Southern Resident Killer Whale | 0 | 7 | 3 | 3 | 3 | 3 | 18 |
| Privy Council Office | 48 | 28 | 19 | 16 | 16 | 16 | 142 |
| Secure Communication for National Leadership | 4 | 3 | 2 | 2 | 2 | 2 | 13 |
| Extension of the Missing and Murdered Indigenous Women and Girls Inquiry | 32 | 7 | 0 | 0 | 0 | 0 | 38 |
| Supporting Privy Council Office Ministers | 8 | 12 | 12 | 12 | 12 | 12 | 66 |
| Governor In Council Appointment Process | 5 | 6 | 5 | 2 | 2 | 2 | 24 |
| Public Prosecution Service of Canada | 4 | 18 | 1 | 1 | 1 | 1 | 26 |
| Addressing Corporate Integrity | 0 | 1 | 1 | 1 | 1 | 1 | 5 |
| Support for the Public Prosecution Service of Canada | 4 | 17 | 0 | 0 | 0 | 0 | 21 |
| Public Safety and Emergency Preparedness | 1 | 1 | 0 | 0 | 0 | 0 | 1 |
| Response to the Interim Report of the Inquiry into Missing and Murdered Indigenous Women and Girls | 1 | 1 | 0 | 0 | 0 | 0 | 1 |
| Public Service Commission | 0 | 3 | 3 | 3 | 3 | 3 | 14 |
| Accessible Canada | 0 | 3 | 3 | 3 | 3 | 3 | 14 |
| Public Services and Procurement Canada | 4 | 12 | 12 | 12 | 12 | 12 | 65 |
| Accessible Canada | 0 | 5 | 5 | 5 | 5 | 5 | 26 |
| Addressing Corporate Integrity | 4 | 7 | 7 | 7 | 7 | 7 | 38 |
| Royal Canadian Mounted Police | 1 | 8 | 2 | 2 | 2 | 2 | 18 |
| Response to the Interim Report of the Inquiry into Missing and Murdered Indigenous Women and Girls | 1 | 2 | 2 | 2 | 2 | 2 | 12 |
| Disability Pension Adjustment Correction | 0 | 6 | 0 | 0 | 0 | 0 | 6 |
| Shared Services Canada | 1 | 1 | 3 | 3 | 3 | 3 | 16 |
| Secure Communication for National Leadership | 1 | 1 | 3 | 3 | 3 | 3 | 16 |
| Status of Women Canada | 5 | 5 | 0 | 0 | 0 | 0 | 10 |
| Response to the Interim Report of the Inquiry into Missing and Murdered Indigenous Women and Girls | 5 | 5 | 0 | 0 | 0 | 0 | 10 |
| Transport Canada | 0 | 2 | 2 | 2 | -18 | 2 | -9 |
| Restoring Rail Service to Churchill, Manitoba | 0 | 0 | 0 | 0 | -20 | 0 | -20 |
| Protection of Southern Resident Killer Whale | 0 | 2 | 2 | 2 | 2 | 2 | 11 |
| Transportation Safety Board | 3 | 3 | 3 | 3 | 3 | 3 | 20 |
| Transportation Safety Board | 3 | 3 | 3 | 3 | 3 | 3 | 20 |
| Treasury Board of Canada Secretariat | 5 | 9 | 9 | 6 | 6 | 6 | 41 |
| Accessible Canada | 0 | 4 | 5 | 1 | 1 | 1 | 13 |
| Central Fund for Government of Canada Advertising | 5 | 5 | 5 | 5 | 5 | 5 | 28 |
| Veterans Affairs Canada | 0 | 65 | 94 | 0 | 0 | 0 | 159 |
| Disability Pension Adjustment Correction | 0 | 65 | 94 | 0 | 0 | 0 | 159 |
| Western Economic Diversification Canada | 49 | 24 | 4 | 4 | 4 | 4 | 90 |
| Increased Funding for the Regional Development Agencies | 3 | 0 | 0 | 0 | 0 | 0 | 3 |
| Restoring Rail Service to Churchill, Manitoba | 45 | 24 | 4 | 4 | 4 | 4 | 87 |
| Total - Policy Actions Since Budget 2018 | 1,726 | 916 | 606 | 504 | 435 | 399 | 4,587 |
| Net adjustments to be on a 2018-19 voted budgetary Estimates basis | -35 | - | - | - | - | - | - |
| Total 2018-19 voted budgetary Estimates basis | 1,691 | - | - | - | - | - | - |
| 2018- 2019 |
2019- 2020 |
2020- 2021 |
2021- 2022 |
2022- 2023 |
2023- 2024 |
Total (Cash) | |
|---|---|---|---|---|---|---|---|
| Administrative Tribunals Support Service of Canada | 0 | 0 | 2 | 2 | 2 | 2 | 8 |
| Implementing Proactive Pay Equity Legislation | 0 | 0 | 2 | 2 | 2 | 2 | 8 |
| Agriculture and Agri-Food Canada | 0 | 2 | 2 | 2 | 2 | 2 | 12 |
| Accessing New Markets for Canadian Exports | 0 | 2 | 2 | 2 | 2 | 2 | 12 |
| Canada Revenue Agency | 0 | 1 | 1 | 1 | 1 | 1 | 4 |
| Consultation Panel on Political Activities by Charities | 0 | 1 | 1 | 1 | 1 | 1 | 4 |
| Canadian Food Inspection Agency | 0 | 2 | 2 | 2 | 2 | 2 | 11 |
| Accessing New Markets for Canadian Exports | 0 | 2 | 2 | 2 | 2 | 2 | 11 |
| Canadian Heritage | 0 | 6 | 2 | 2 | 2 | 2 | 15 |
| TV5 Monde - French Digital Platform | 0 | 6 | 2 | 2 | 2 | 2 | 15 |
| Canadian Human Rights Commission | 0 | 2 | 3 | 4 | 3 | 3 | 15 |
| Implementing Proactive Pay Equity Legislation | 0 | 2 | 3 | 4 | 3 | 3 | 15 |
| Crown-Indigenous Relationship and Northern Affairs | 0 | 13 | 13 | 13 | 13 | 13 | 63 |
| Nutrition North Canada Program | 0 | 13 | 13 | 13 | 13 | 13 | 63 |
| Department of Finance Canada | 1 | 2 | 2 | 2 | 2 | 2 | 12 |
| Consultation Panel on Political Activities by Charities | 0.1 | 0.2 | 0.2 | 0.2 | 0.2 | 0.2 | 1 |
| Supporting Tax Policy Analysis and Development | 1 | 2 | 2 | 2 | 2 | 2 | 11 |
| Economic Development Agency of Canada for the Regions of Québec |
0 | -6 | -6 | -6 | -6 | -6 | -30 |
| Sustaining Canada's Wild Fish Stocks | 0 | -6 | -6 | -6 | -6 | -6 | -30 |
| Employment and Social Development Canada | 1 | 18 | 121 | 86 | 86 | 86 | 397 |
| Social Finance Fund | 0 | 17 | 120 | 85 | 85 | 85 | 394 |
| Implementing Proactive Pay Equity Legislation | 1 | 1 | 0 | 0 | 0 | 0 | 3 |
| Fisheries and Oceans Canada | 10 | 41 | 44 | 49 | 49 | 49 | 242 |
| Sustaining Canada's Wild Fish Stocks | 10 | 41 | 44 | 49 | 49 | 49 | 242 |
| Global Affairs Canada | 10 | 45 | 71 | 71 | 71 | 71 | 340 |
| Accessing New Markets for Canadian Exports | 0 | 35 | 61 | 61 | 61 | 71 | 290 |
| Helping Businesses Explore New Markets | 10 | 10 | 10 | 10 | 10 | 0 | 50 |
| Health Canada | 0 | 1 | 1 | 1 | 1 | 1 | 3 |
| Accessing New Markets for Canadian Exports | 0 | 1 | 1 | 1 | 1 | 1 | 3 |
| Innovation, Science and Economic Development Canada | 0 | 173 | 203 | 228 | 162 | 102 | 867 |
| Strategic Innovation Fund | 0 | 160 | 180 | 200 | 160 | 100 | 800 |
| Accessing New Markets for Canadian Exports | 0 | 3 | 5 | 6 | 2 | 2 | 17 |
| Clean Technology Venture Capital – Business Development Bank of Canada | 0 | 10 | 18 | 23 | 0 | 0 | 50 |
| National Research Council Canada | 0 | 14 | 14 | 14 | 14 | 14 | 68 |
| Increasing Access to National Building Codes | 0 | 14 | 14 | 14 | 14 | 14 | 68 |
| Public Safety and Emergency Preparedness | 25 | 0 | 0 | 0 | 0 | 0 | 25 |
| Avalanche Canada | 25 | 0 | 0 | 0 | 0 | 0 | 25 |
| Transport Canada | -40 | 138 | 301 | 208 | 155 | 26 | 788 |
| Accessing New Markets for Canadian Exports | -40 | 138 | 301 | 208 | 155 | 26 | 788 |
| Treasury Board of Canada Secretariat | 2 | 5 | 13 | 17 | 13 | 8 | 59 |
| Enhancing Government capacity to develop and implement effective regulations | 0 | 2 | 4 | 4 | 0 | 0 | 10 |
| Implementing Proactive Pay Equity Legislation | 2 | 3 | 9 | 13 | 13 | 8 | 49 |
| Allocation to be determined | 0 | 1 | 2 | 2 | 3 | 3 | 11 |
| Launch a Centre for Regulatory Experimentation | 0 | 1 | 2 | 2 | 3 | 3 | 11 |
| Total - 2018 Fall Economic Statement Measures | 9 | 457 | 789 | 697 | 575 | 381 | 2,908 |
| Net adjustment to be on a 2018-19 voted budgetary Estimates basis |
40 | - | - | - | - | - | - |
| Total 2018-19 voted budgetary Estimates basis | 49 | - | - | - | - | - | - |
Reconciliation of 2018 Fall Economic Statement Expenses with 2018–19 Main Estimates
Under this reconciliation, the accrual expense forecast is decomposed into nine building blocks beginning with the Main Estimates authorities, Budget Implementation Vote (BIV) allocations-to-date, Policy Actions since Budget 2018 as well as 2018Fall Economic Statement measures that could be included in Supplementary Estimates, additional Estimates authorities for which Parliamentary approval may be sought later in the fiscal year, amounts forecasted to remain unspent or carried forward from total authorities, further spending financed by departmental revenues, spending-like programs delivered through the tax system, and remaining accrual and consolidation adjustments required to put the forecast on the same accounting basis as the Public Accounts of Canada, Volume I. These building blocks are consistent with concepts and definitions used in the Public Accounts of Canada, Volume II.
| (1) Main estimates | 276.0 | |
| (2) Budget Implementation Vote allocations | ||
| Allocations to Departments | 2.9 | |
| Drawdowns of Vote | (2.9) | 0.0 |
| (3) Measures | 1.7 | |
| (4) Other anticipated authorities | 19.0 | |
| (5) Unspent/carried forward | (12.7) | |
| (6) Net expenditures | 284.0 | |
| (7) Netted revenues | 11.2 | |
| (8) Tax credits & repayments | 27.9 | |
| (9) Accrual & consolidation adjustments | 21.0 | |
| (10) FES expense forecast | 344.1 |
Budget and Estimates Alignment: Greater Clarity on Government Spending
To better align the Budget and Estimates processes and strengthen oversight of government spending, the 2018 Budget Plan included detail on new spending measures by organization, and for the first time in recent years the 2018-19 Main Estimates were tabled after the federal Budget. The Government’s work on Estimates reform is guided by the belief that Canadians have a right to know where public funds are going and how they will be spent.
In order to support this initiative, the Government introduced a new Treasury Board managed central vote, TB vote 40, which effectively aligned financial totals presented in the Budget and the Estimates. By establishing this clear link between the two documents, the Government is improving the alignment of the Budget and the Main Estimates and making the planning, spending, tracking and reporting of tax dollars more transparent.
| (1) | (2) | (3) | (4) | (5) | (6) | |
|---|---|---|---|---|---|---|
| Main Estimates | BIV allocations-to-date | Measures | Other anticipated authorities | Unspent/ carried forward |
Net expenditures | |
| Direct program expenses of large departments | ||||||
| National Defence | 20.4 | 0.0 | 0.0 | 1.2 | (1.1) | 20.4 |
| Indigenous Services Canada | 9.3 | 0.3 | 0.3 | 1.3 | (0.3) | 11.0 |
| Employment and Social Development Canada | 7.2 | 0.0 | 0.0 | 0.5 | (0.1) | 7.6 |
| Treasury Board of Canada Secretariat1 | 13.6 | (2.3) | 0.0 | (1.9) | (2.7) | 6.7 |
| Global Affairs Canada | 6.5 | 0.1 | 0.0 | 0.9 | (0.3) | 7.2 |
| Canada Revenue Agency | 4.2 | 0.0 | 0.0 | 0.4 | (0.2) | 4.4 |
| Infrastructure Canada | 4.0 | 0.0 | 0.0 | 0.7 | (0.5) | 4.2 |
| Royal Canadian Mounted Police | 3.5 | 0.0 | 0.0 | 0.6 | (0.2) | 3.9 |
| Public Services and Procurement Canada | 3.2 | 0.1 | 0.0 | 1.2 | (0.6) | 4.0 |
| Crown-Indigenous Relations and Northern Affairs Canada | 3.1 | 0.0 | 0.0 | 2.0 | (0.4) | 4.8 |
| Innovation, Science and Economic Development Canada | 2.9 | 0.1 | 0.2 | 0.2 | (0.6) | 2.8 |
| Agriculture and Agri-Food Canada | 2.5 | 0.0 | 0.0 | 0.0 | (0.1) | 2.3 |
| Fisheries and Oceans Canada | 2.4 | 0.1 | 0.8 | 1.5 | (0.3) | 4.6 |
| Correctional Service Canada | 2.4 | 0.0 | 0.0 | 0.2 | (0.1) | 2.6 |
| Immigration, Refugees and Citizenship Canada | 2.4 | 0.0 | 0.1 | 1.5 | (1.3) | 2.6 |
| Canada Border Services Agency | 1.8 | 0.1 | 0.0 | 0.6 | (0.3) | 2.3 |
| Transport Canada | 1.5 | 0.0 | 0.0 | 0.1 | (0.3) | 1.4 |
| Environment and Climate Change Canada | 1.5 | 0.1 | 0.0 | 0.1 | (0.1) | 1.6 |
| Natural Resources Canada | 1.5 | 0.0 | 0.0 | 0.0 | (0.1) | 1.3 |
| Health Canada | 1.3 | 0.1 | 0.0 | 0.3 | (0.1) | 1.7 |
| Canadian Heritage | 1.3 | 0.0 | 0.0 | 0.1 | (0.0) | 1.4 |
| Public Safety Canada | 1.2 | 0.0 | 0.0 | 0.0 | (0.1) | 1.1 |
| Department of Finance Canada | 0.7 | 0.0 | 0.0 | 0.1 | (0.1) | 0.8 |
| Subtotal | 98.6 | (1.2) | 1.5 | 11.7 | (10.1) | 100.5 |
| Consolidated Crown corporations | 5.0 | 0.3 | 0.0 | 0.9 | (0.6) | 5.5 |
| Other direct program expenses | 22.5 | 0.9 | 0.2 | 6.8 | (2.0) | 28.3 |
| Total direct program expenses | 126.0 | 0.0 | 1.7 | 19.4 | (12.7) | 134.4 |
| Major transfers | 127.1 | 0.0 | 0.0 | (0.4) | 0.0 | 126.8 |
| Public debt charges | 22.8 | 0.0 | 0.0 | 0.0 | 0.0 | 22.8 |
| Total expenses | 276.0 | 0.0 | 1.7 | 19.0 | (12.7) | 284.0 |
| (6) | (7) | (8) | (9) | (10) | |
|---|---|---|---|---|---|
| Net expenditures | Netted revenues | Tax credits & repayments | Accrual & consolidation adjustments | Fall Economic Statement expense forecast | |
| Direct program expenses of large departments | |||||
| National Defence | 20.4 | 0.3 | 0.0 | 6.8 | 27.5 |
| Indigenous Services Canada | 11.0 | 0.0 | 0.0 | 0.1 | 11.1 |
| Employment and Social Development Canada | 7.6 | 2.2 | 0.0 | (0.0) | 9.7 |
| Treasury Board of Canada Secretariat1 | 6.7 | 0.7 | 0.0 | (0.8) | 6.6 |
| Global Affairs Canada | 7.2 | 0.0 | 0.0 | (0.3) | 6.9 |
| Canada Revenue Agency | 4.4 | 0.3 | 4.0 | 3.9 | 12.6 |
| Infrastructure Canada | 4.2 | 0.0 | 0.0 | (0.9) | 3.2 |
| Royal Canadian Mounted Police | 3.9 | 1.7 | 0.0 | 1.0 | 6.6 |
| Public Services and Procurement Canada | 4.0 | 3.4 | 0.0 | (3.7) | 3.7 |
| Crown-Indigenous Relations and Northern Affairs Canada | 4.8 | 0.0 | 0.0 | (1.9) | 2.9 |
| Innovation, Science and Economic Development Canada | 2.8 | 0.3 | 0.0 | (0.1) | 2.9 |
| Agriculture and Agri-Food Canada | 2.3 | 0.1 | 0.0 | (0.0) | 2.4 |
| Fisheries and Oceans Canada | 4.6 | 0.0 | 0.0 | (2.4) | 2.2 |
| Correctional Service Canada | 2.6 | 0.1 | 0.0 | (0.2) | 2.5 |
| Immigration, Refugees and Citizenship Canada | 2.6 | 0.4 | 0.0 | (0.1) | 3.0 |
| Canada Border Services Agency | 2.3 | 0.0 | 0.0 | (0.1) | 2.2 |
| Transport Canada | 1.4 | 0.1 | 0.0 | (0.0) | 1.4 |
| Environment and Climate Change Canada | 1.6 | 0.1 | 0.0 | (0.0) | 1.6 |
| Natural Resources Canada | 1.3 | 0.0 | 0.0 | (0.0) | 1.3 |
| Health Canada | 1.7 | 0.1 | 0.0 | (0.1) | 1.7 |
| Canadian Heritage | 1.4 | 0.0 | 0.0 | (0.0) | 1.4 |
| Public Safety Canada | 1.1 | 0.0 | 0.0 | 0.1 | 1.2 |
| Department of Finance Canada | 0.8 | 0.0 | 0.0 | (0.1) | 0.7 |
| Subtotal | 100.5 | 10.0 | 4.0 | 1.0 | 115.5 |
| Consolidated Crown corporations | 5.5 | 0.0 | 0.0 | 3.4 | 8.9 |
| Other direct program expenses | 28.3 | 1.3 | 0.0 | (5.1) | 24.5 |
| Total direct program expenses | 134.4 | 11.2 | 4.0 | (0.7) | 149.0 |
| Major transfers | 126.8 | 0.0 | 23.9 | 20.6 | 171.3 |
| Public debt charges | 22.8 | 0.0 | 0.0 | 1.0 | 23.8 |
| Total expenses | 284.0 | 11.2 | 27.9 | 21.0 | 344.1 |
1. Main Estimates
The Estimates reflect authorities approved in previous budgets and confirmed by Treasury Board for all organizations that receive a voted appropriation from Parliament. The Estimates also include, for information, forecasts of spending under most statutory authorities previously provided by Parliament.
The Estimates are presented on a modified cash basis of accounting. Figures are net of certain revenues collected by departments, which departments can re-spend to reduce the level of appropriations sought from Parliament.
The Estimates are designed primarily to support Parliament’s scrutiny of the portion of government spending that requires annual approval through the appropriation acts. As such, they exclude several programs where authorities and reporting to Parliament are established under separate regimes, most notably the Employment Insurance Operating Account and programs delivered through the tax system.
Estimates include both budgetary authorities (for expenditures which impact the income statement) and non-budgetary authorities (for balance sheet transactions). As the objective in this reconciliation table is to identify transactions and adjustments that affect accrual expenses, the Main Estimates column includes only budgetary authorities.
2. Budget Implementation Vote allocations-to-date
The Budget Implementation Vote (BIV) was introduced in the Main Estimates 2018–19. The BIV was included in the Main Estimates of the Treasury Board of Canada Secretariat (TBS), and is being allocated to departments throughout the fiscal year as measures included in the vote are confirmed by Treasury Board.
This column shows amounts which have been allocated to departments by Treasury Board as of the latest available monthly update published by TBS on October 31, 2018, which reflects Treasury Board approvals through the end of October 2018.
BIV amounts which are remaining to be allocated later in 2018–19 are included within the column Other anticipated authorities.
3. Measures
This column is based on policy actions taken since Budget 2018 by department in Table A1.8, as well as investments announced in this Fall Economic Statement by department in Table A1.9, adjusted to follow the same modified cash basis of accounting and presentational conventions as the Estimates (for example, amounts related to the Employment Insurance Operating Account do not flow through the Estimates). In order to focus on measures where voted appropriations are expected to be sought from parliament and which are expected to have a fiscal impact, measures which are statutory or non-budgetary are omitted from this column.
Measures affecting departments other than the 23 identified in the table are grouped in the “Other direct program expenses” row. Measures which are solely statutory (and budgetary) are included in the column Other anticipated authorities.
4. Other anticipated authorities
This category captures a range of forecasted authorities for measures and mechanisms that have been approved previously, or that have already been authorized under existing legislation, and that are expected to appear in a Supplementary Estimates or the Public Accounts.
For example, a revolving fund or a department with multi-year appropriations may have authority to carry forward unspent authorities from 2017–18 into 2018–19, but that amount cannot be confirmed until the audited financial results for 2017–18 become available, which means that the amounts are not included in the Main Estimates.
Similarly, the Treasury Board manages several central votes for carry-forwards, certain eligible personnel expenditures and other contingencies that are initially presented under Treasury Board of Canada Secretariat and subsequently allocated to departments throughout the year as departments meet eligibility requirements. This includes amounts remaining to be allocated from the Budget Implementation Vote for Budget 2018 measures.
Another common reason authorities are not sought until a Supplementary Estimates is that a previous budget or off-cycle measure has not yet received the supporting policy or program approval.
There are also certain statutory authorities, often small, which may not be included for information in the Estimates but which are reported in the Public Accounts.
Note that the sum of the values in the first four columns represent a forecast of total budgetary authorities available by department, consistent with the concepts and definitions applied in the Public Accounts of Canada, Volume II, Section 1, Table 5.
5. Unspent/carried forward
This column is the forecasted difference between the forecast of potential spending authorities for 2018–19 (authorities from the first four columns) and anticipated spending over that period (net expenditures in the sixth column).
Specifically, the Estimates show the maximum amount of appropriated funding that can be spent at a point in time, while the Fall Economic Statement projects the amount of spending that will likely be spent over the entire course of the fiscal year.
The Fall Economic Statement forecast recognizes that some amount of authorities included in the Estimates will remain unspent at the end of the fiscal year. These unspent amounts are either carried forward automatically into subsequent years or they “lapse”. Amounts that technically lapse in one year are often spent in a subsequent year as they are reprofiled and included in a future Estimates.
Lapses are influenced by many factors, such as contract and project delays, uncommitted authorities in Treasury Board managed central votes, as well as departmental funds management practices to ensure that spending does not exceed the authorities approved by Parliament.
In terms of the Public Accounts of Canada, Volume II, Section 1, Table 5, this column aligns with the sum of “Available for use in subsequent years” and “Lapsed”.
6. Net expenditures
Expenditures are largely funded through voted appropriations and statutory authorities, and to a limited extent through departmental revenues. In the Estimates, authorities and expenditures are presented on a “net” basis, i.e. excluding expenditures expected to be funded by departmental revenues, in order to reflect the expected impact on the Consolidated Revenue Fund.
Figures in this column are presented on the same modified cash basis of accounting as the Estimates, and represent a forecast of the corresponding amount in the Public Accounts of Canada, Volume II, Section 1, Table 5.
7. Netted revenues
Certain expenditures are funded through departmental revenues. Accrual expenses in the Fall Economic Statement and the Public Accounts are on a “gross” basis, so revenues that are netted against expenditures in the Estimates are added back in order to arrive at forecasted accrual expenses. Summing the figures in the Net expenditures column with the Netted revenues column would yield “Total gross expenditures” on a modified cash basis of accounting. Net expenditures, Netted revenues and Total gross expenditures are reported by department in the Public Accounts of Canada, Volume II, Section 1, Table 3.
8. Tax credits & repayments
This column captures expenditures forecasted to be delivered through the tax system, but not shown in the Estimates. Costs related to the Canada Child Benefit are the largest component in this column (shown in the Major transfers row). Tax credits and repayments that are considered direct program expenses are shown in the Canada Revenue Agency row, and include incentives for research and development, the Canada Workers Benefit as well as refundable tax credits.
Parliament does not authorize annual spending for such tax expenditures and refundable tax credits, which are instead legislated through the Income Tax Act. These expenditures are reported in the Public Accounts of Canada, Volume II, Section 1, Table 3a. In addition, the Department of Finance Canada’s annual Report on Federal Tax Expenditures includes both historical and forecasted values by program.
9. Accrual & consolidation adjustments
This column captures other differences in accounting basis and scope between the Estimates and the Fall Economic Statement/Public Accounts of Canada.
The budget and the Fall Economic Statement are presented on an accrual basis whereas the Estimates are presented on a modified cash basis. As a result, certain items such as acquisitions of tangible capital assets will be reported differently. Under accrual accounting, the cost to acquire an asset is amortized over the expected life of the asset, whereas under modified cash accounting, the cost is recognized as disbursements are made. For example, if a building is acquired that has a useful life of 30 years, then accrual accounting will see the cost amortized over the 30-year life of the asset, while cash accounting will portray the cost only in the first few years when the payments are made.
Other examples of accrual adjustments include bad debt expenses, operating expenses and public debt charges related to pensions and benefits for which cash disbursements are expected to be made in subsequent years but for which expenses are accrued in the current year.
All costs related to consolidated specified purpose accounts, and certain costs related to consolidated Crown corporations, are also included here, including some amounts announced in the 2018 Fall Economic Statement. The most important is Employment Insurance (EI) benefits. Most EI costs are paid directly out of the Employment Insurance Operating Account, rather than a departmental appropriation, and are therefore not specifically included in Estimates, although they are included in the Fall Economic Statement. Similarly, expenses of consolidated Crown corporations that are funded from their own revenues are also captured here.
A final consolidation adjustment included is the reversal of expenses that are internal to government, such as when one department pays another to provide it with a service.
This column represents a forecast consistent with a group of adjustments reported in the Public Accounts of Canada, Volume II, Section 1, Table 3a.
10. Fall Economic Statement expense forecast
This column represents final external expenses on an accrual basis, inclusive of all Fall Economic Statement and off-cycle measures outlined in the Fall Economic Statement.
- Date modified: