Chapter 1 - Economic and Fiscal Update
Introduction
The Government’s plan to invest in the economy and strengthen the middle class is working. The recent resurgence in gross domestic product (GDP) makes Canada the fastest growing economy in the Group of Seven (G7) (Chart 1.1). The economy has created over 450,000 jobs since late 2015, and the unemployment rate has dropped to its lowest level since 2008. Consumer confidence is up, thanks in part to the Canada Child Benefit (CCB), and growth is forecast to be 3.1 per cent in 2017—significantly above expectations at the beginning of the year.
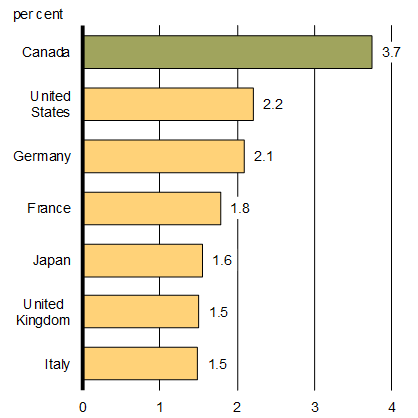
Sources: Haver Analytics; Department of Finance Canada calculations.
Growth Outlook
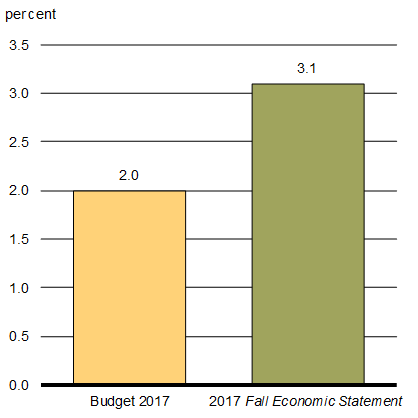
Sources: Department of Finance Canada December 2016 and September 2017 surveys of private sector economists; Department of Finance Canada calculations.
Reflecting this recent economic strength, the fiscal outlook is improving, with projected budgetary balances and debt-to-GDP levels improving across the forecast horizon. The Government remains committed to sound fiscal management—balancing the need to make targeted investments to support economic growth while preserving Canada’s low-debt advantage for current and future generations.
This chapter provides an overview of recent major economic developments and presents the current fiscal situation and outlook.
Notes: This section incorporates data available up to and including October 20, 2017, unless otherwise indicated. All rates are reported at annual rates unless otherwise noted.
Recent developments in the Canadian economy
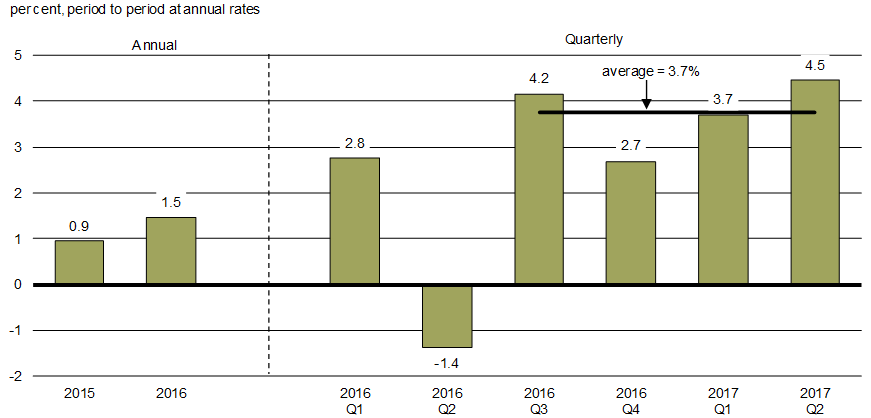
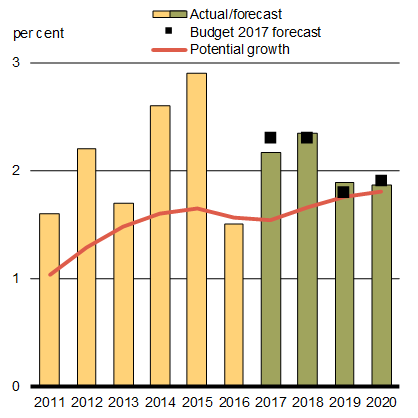
Canadian economic growth has accelerated sharply since the second half of 2016 (Chart 1.2). Over the last four quarters, the Canadian economy has had its fastest rate of growth since the beginning of 2006, and growth is becoming more balanced across sectors and regions.
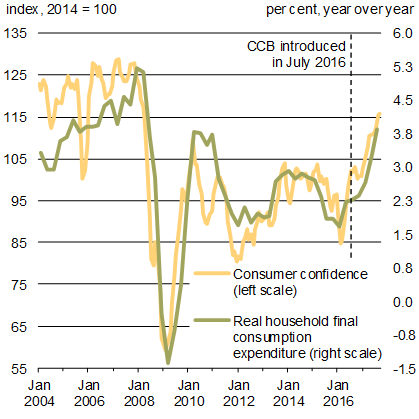
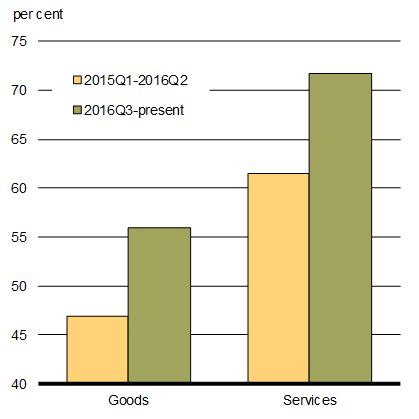
Household consumption has been the main contributor to economic growth over the past year, increasing at or above 3.0 per cent in each quarter since mid-2016, significantly above its post-recession average. Household consumption growth has been fairly broad-based across consumption categories and regions. It has been underpinned by solid employment gains, low interest rates, improving consumer confidence and, since July 2016, by the ongoing support of the CCB to families (Chart 1.3).
Recent strength in economic activity will likely translate into jobs and income gains, which should support continued consumption growth in the near term.
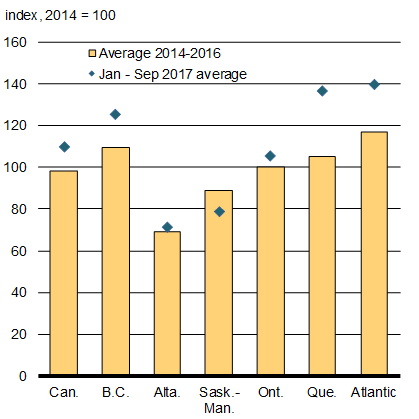
Sources: The Conference Board of Canada; Department of Finance Canada calculations.
Sources: Statistics Canada and The Conference Board of Canada; Department of Finance Canada calculations.
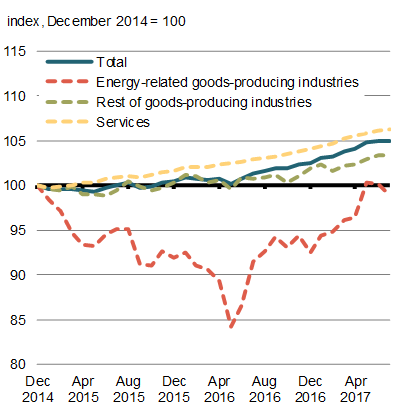
Growth in economic output has been observed across a larger number of both goods and services industries over the past year compared to what was observed in the aftermath of the oil price shock (Chart 1.4).
After being hit by the fall in oil prices, activity in energy-related goods-producing industries stabilized and started to gradually pick up in mid-2016 following the Fort McMurray wildfires in May. Along with this, activity in other related industries (e.g. machinery manufacturing) has also improved, contributing to broader overall growth among goods-producing industries.
Meanwhile, the services sector has continued to grow at a steady pace.
Sources: Statistics Canada; Department of Finance Canada calculations.
Sources: Statistics Canada; Department of Finance Canada calculations.
As global crude oil prices have stabilized, so has the economic situation in energy-producing provinces.
Since mid-2016, half of Alberta’s total job losses1 have been recouped, all in full-time positions. However, paid employment2 in the province—which recorded a larger decline as many laid off workers returned to their home province, where they are now accounted for—has recovered less quickly. The rebound in Alberta has boosted national GDP growth directly, as Alberta accounts for about 16 per cent of total Canadian output, and indirectly, as stronger demand from Alberta has boosted growth in other provinces via trade channels.
Similarly, stabilization in energy prices has been reflected in stronger economic activity in Saskatchewan, with the provincial economy expected to post a strong rebound in real GDP growth in 2017 following two consecutive years of decline.
Growth has also been robust outside of these energy-producing regions, across the country. For example:
- Growth in the Maritime provinces in 2017 is expected to be at its strongest pace since 2010;
- The unemployment rate in Quebec is near its lowest level since at least 1976;
- Ontario has posted its longest back-to-back stretch of real GDP growth of above 2 per cent in over 15 years; and
- The British Columbia economy has created over 140,000 net new jobs since the beginning of last year—an increase of almost 6 per cent.
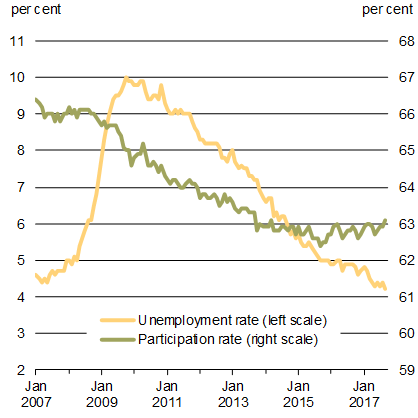
The recent acceleration and broadening of growth has coincided with robust job gains for Canada as a whole, as 472,300 net jobs have been created since November 2015. The pace of job creation so far in 2017—25,000 jobs per month—has been among the fastest in the past decade (Chart 1.5).
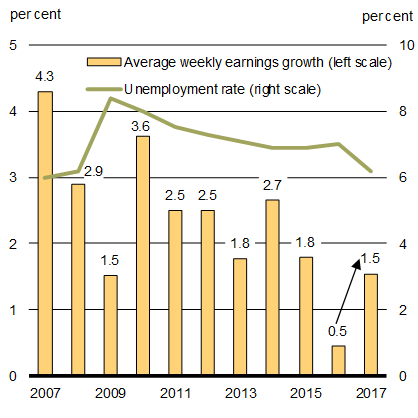
These recent gains in the labour market have contributed to lowering the unemployment rate from 7.2 per cent at the beginning of 2016 to 6.2 per cent in September 2017, its lowest level since October 2008. Moreover, according to the Bank of Canada’s Business Outlook Survey, hiring intentions have increased compared to 2015 and mid-2016. The net balance of firms facing greater labour market pressures compared to a year ago—although not yet limiting their ability to meet demand—reached its highest level in over a decade as of the latest survey. Meanwhile, wage growth is picking up, following softness in 2016. Average weekly earnings have increased by $15, or from $954 to $969, in the first seven months of 2017 compared to the same period last year.
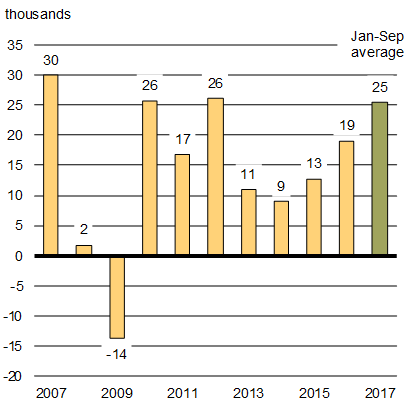
Source: Statistics Canada (LFS).
Sources: Statistics Canada (LFS and SEPH); Department of Finance Canada calculations.
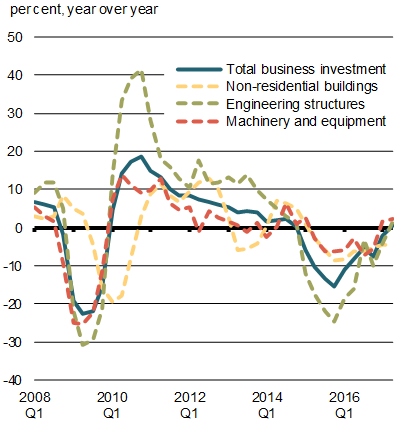
After rebounding rapidly during the recovery from the global recession, real business investment shrank over 2015 and 2016. This fall was driven by dramatic declines in engineering structures in the response to the global oil price shock and resulting pull-back in investment in oil-producing regions (Chart 1.6).
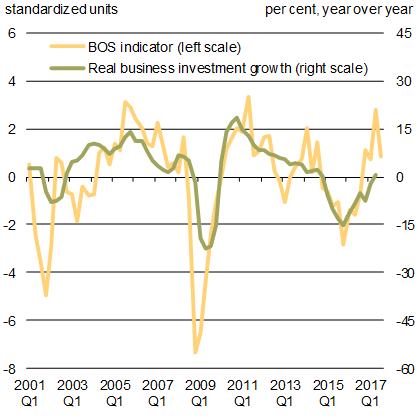
However, business investment is now growing, underpinned by stronger economic activity in both the resource and non-resource sectors and much improved business sentiment. The Bank of Canada’s Business Outlook Survey shows a strong improvement in business investment intentions over the last year. Despite a slight pull-back in the most recent Survey, intentions remain in solid positive territory, pointing to a further recovery in investments going ahead. With capacity utilization rates of several industries currently close to their pre-recession peaks, this suggests that the recent pick-up in business investment may prove to be more enduring.
Sources: Statistics Canada; Department of Finance Canada calculations.
Sources: Statistics Canada; Bank of Canada; Department of Finance Canada calculations.
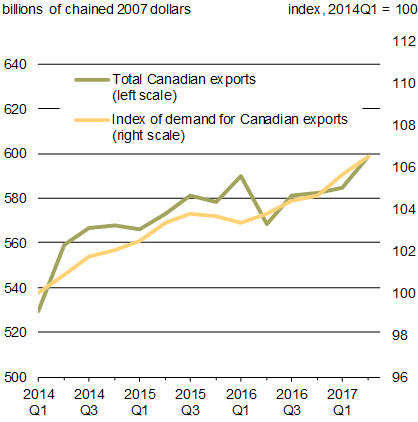
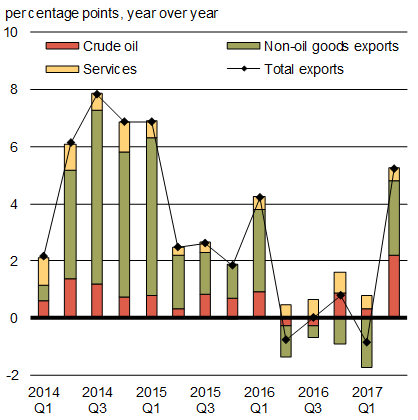
Total Canadian exports have continued to rise in recent years. Growth in non-oil goods exports was the main driver of overall export growth in 2014, largely explained by higher foreign demand (Chart 1.7).
Starting in early 2015, growth in exports of non-oil goods slowed in line with weaker U.S. demand, in spite of the lower Canadian dollar. Looking ahead, non-oil exports should continue to expand in line with a positive U.S. growth outlook.
Sources: Statistics Canada; U.S. Bureau of Economic Analysis; Department of Finance Canada calculations.
Sources: Statistics Canada; Department of Finance Canada calculations.
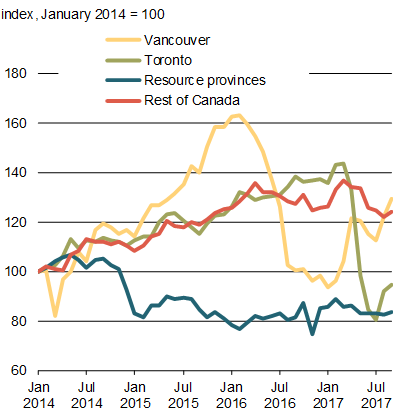
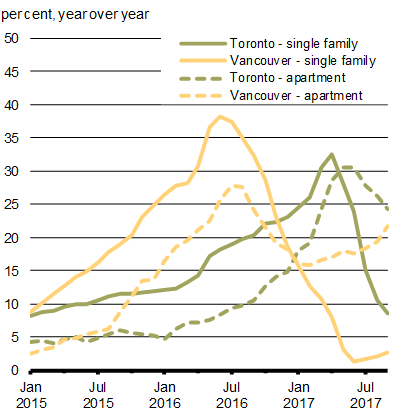
In the Canadian housing market, following rapid price growth in 2016 and early 2017, Toronto and surrounding regions have seen a shift to more balanced market conditions (Chart 1.8). In the Vancouver area, activity has rebounded modestly following a slowdown in the second half of 2016. Nonetheless, affordability remains a pressing concern in these markets, particularly for middle class families and lower-income Canadians. While prices for single-family homes have stagnated or declined, prices for other dwelling types, particularly apartment condominiums, continue to rise. This fall, the Government intends to release details of its National Housing Strategy, first announced in Budget 2017, which is estimated to help up to 500,000 Canadians find a safe and secure place to call home.
Looking ahead, ongoing solid economic conditions will provide support for housing demand across the country. However, rising interest rates, combined with recent federal and provincial housing measures, should temper housing demand going forward.
Sources: Canadian Real Estate Association; Department of Finance Canada calculations.
Sources: Canadian Real Estate Association; Department of Finance Canada calculations.
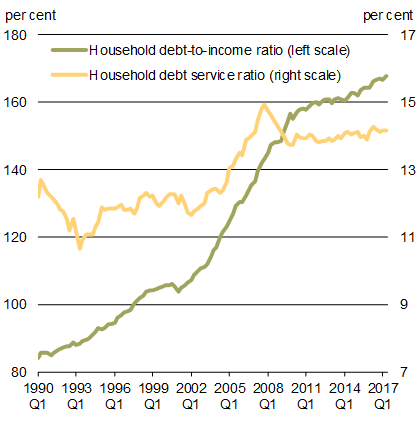
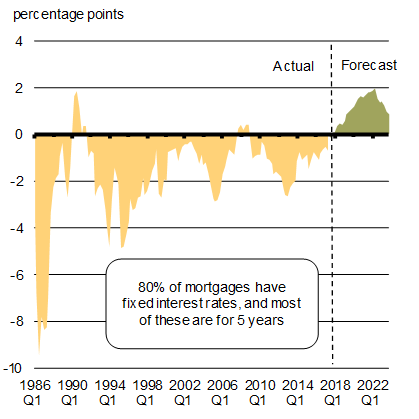
Household debt relative to income is at historic highs and continues to rise gradually, led by growth in mortgage debt (Chart 1.9). However, low interest rates have kept the household debt-service ratio stable, while rising asset values (for both housing and non-housing assets) have kept the debt-to-asset ratio (a measure of household leverage) low.
Rising interest rates are likely to increase debt-service ratios, which will in turn constrain future household spending growth. However, since most borrowers have fixed-rate mortgages that do not need to be renewed over the near term, the economic impacts of higher rates will be felt gradually over time. Nonetheless, households need to be prudent and manage their debt levels in the context of rising interest rates.
Sources: Statistics Canada; Department of Finance Canada calculations
Sources: Bank of Canada; Department of Finance Canada calculations
The federal government has introduced several measures since 2015 to help ensure the stability of housing and financial markets, protecting what is for many Canadians the most important investment of their lives. These include stricter down payment requirements for higher-priced homes, measures to improve tax fairness by ensuring that the principal residence exemption is available only in appropriate cases, and a mortgage rate stress test for insured mortgages, helping borrowers better afford their mortgages in a rising interest rate environment. The Office of the Superintendent of Financial Institutions also recently announced changes to its mortgage underwriting Guideline B-20 for federally regulated lenders, including a mortgage rate stress test for uninsured mortgages. These new measures will come into effect on January 1, 2018.
The federal government will continue to closely monitor the housing market, working collaboratively with provinces and municipalities.
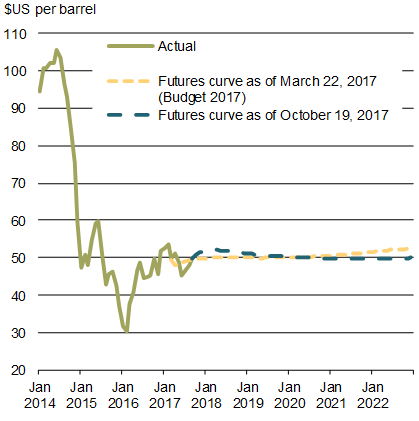
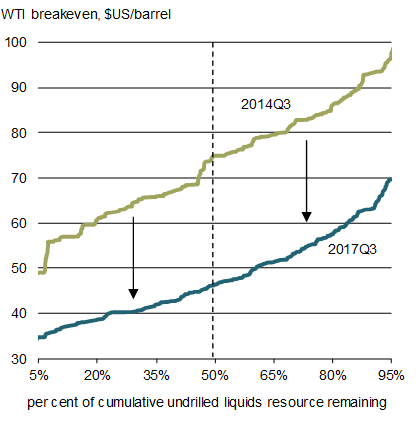
Oil prices have increased modestly from lows reached in early 2016, but are expected to remain largely flat over the medium term (Chart 1.10). This reflects increased output from U.S. shale oil producers, persistently high U.S. crude oil inventories, and concerns over the durability of the Organization of the Petroleum Exporting Countries production cuts.
The U.S. has emerged as the new global swing producer, as productivity enhancements in the industry have lowered costs over the last several years such that over half of undrilled oil reserves in the U.S. are now economical at sub-US$50 market prices.
Source: Commodity Research Bureau.
Global Economic Developments and Outlook
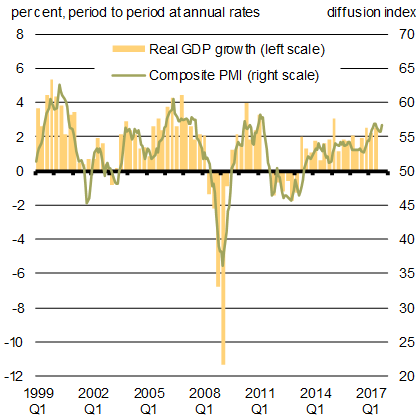
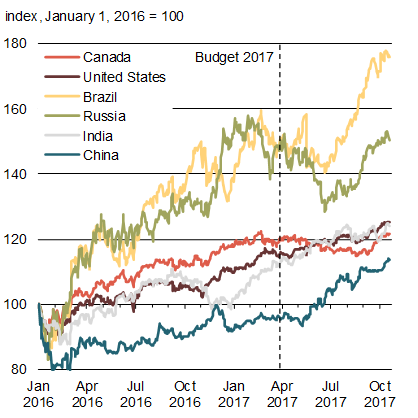
The strong recent economic performance in Canada is taking place in tandem with a firming global economic expansion. Global growth is showing signs of a durable pick-up after two consecutive years of deceleration (Chart 1.11).
All G7 countries are currently expanding faster than their estimated trend growth rates, economic activity in China remains robust, and growth is returning in Russia and Brazil, which faced deep recessions over the last three years.
Co-operation and Development (OECD) Outlook for Growth in Real GDP Versus Potential Output, 2017
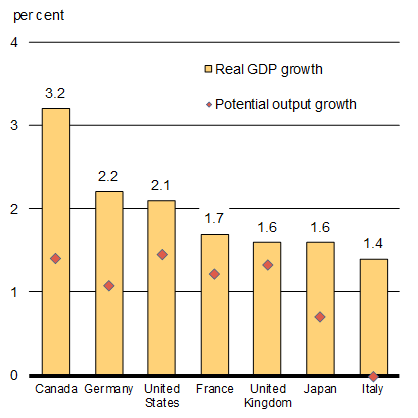
In the United States, the current economic expansion is the third-longest since World War II. Economic activity is growing at a healthy pace of roughly 2 per cent, which is slightly higher than its estimated potential growth rate (Chart 1.12). At the same time, expectations for a policy-driven acceleration in growth this year have been reduced, as prospects for significant fiscal stimulus in 2017 have dimmed. Reflecting this, both the IMF and OECD have unwound a previously assumed near-term boost to growth from their respective U.S. outlooks.
The U.S. labour market has continued to tighten, with the unemployment rate reaching a 16-year low of 4.2 per cent in September 2017. Moreover, the labour force participation rate has been rising modestly in spite of downward pressure from population aging, mainly due to an increase in the participation of women in the workforce. In light of the continued underlying strength of the U.S. economy, the Federal Reserve has increased interest rates twice so far in 2017 and started to very gradually reduce the size of its balance sheet.
Source: U.S. Bureau of Labor Statistics.
The recent natural disasters in Texas and Florida weighed on third-quarter growth as a result of disruptions to economic activity. However, similar to past experience, the macroeconomic impacts are expected to be transitory, as production recovers and reconstruction proceeds.
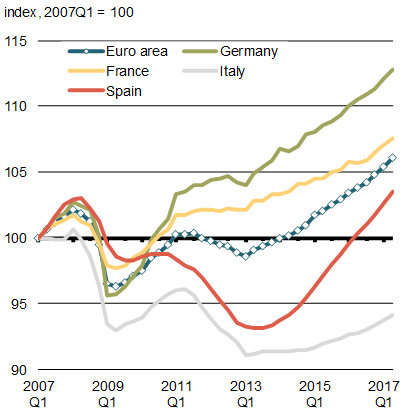
The pace of economic activity has also accelerated this year in Europe, and high-frequency indicators suggest a continuation of above-trend growth into late 2017 (Chart 1.13). With significant excess capacity remaining in many countries, as illustrated by still-elevated unemployment rates and below-target inflation, the European economic recovery has scope to maintain momentum in the coming year. Against this positive backdrop, ongoing vulnerabilities in the banking sector in some countries and uncertainties related to conditions of the United Kingdom’s upcoming exit from the European Union continue to be potential headwinds.
Sources: IHS Markit; Haver Analytics.
Source: Haver Analytics.
Among emerging economies, forecasts for China’s economy—the single largest contributor to global growth—have been revised up (Chart 1.14). Growth is being significantly aided by stimulative fiscal policy, and increased private and public borrowing. While this approach has supported growth in the short term, medium-term risks, notably related to corporate leverage and a buoyant housing market, remain unaddressed.
China Growth Outlook
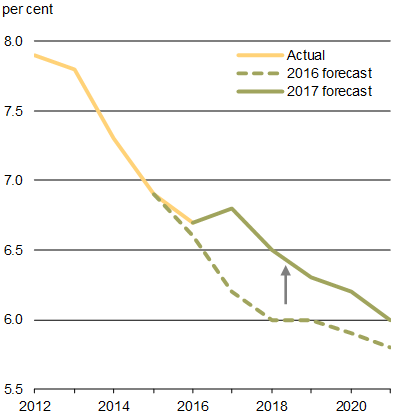
Sources: IMF October 2016 and October 2017 WEOs.
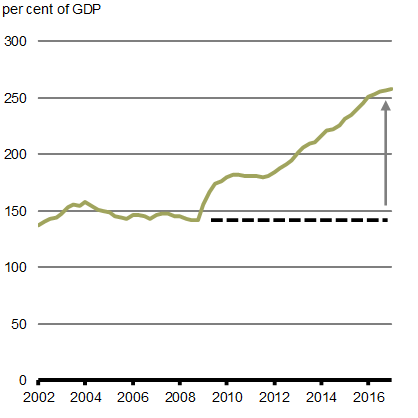
Source: Bank for International Settlements.
Among other large emerging economies, Brazil and Russia have returned to growth following their recent recessions, reflecting a firming in global commodity prices and more favourable financial conditions. In addition, the Indian economy continues to expand at a brisk pace. However, sustained strong growth in emerging economies hinges on domestic economic reforms to foster investment, boost productivity, as well as strengthen fiscal, monetary and exchange rate frameworks.
Global financial conditions remain supportive of economic activity (Chart 1.15). Interest rates remain at historically low levels, with short-term interest rates in a number of countries still in negative territory, and some central banks continuing to deploy extraordinary monetary policy measures to close domestic output gaps and stoke inflation. Globally, there remains more than US$8 trillion in negative-yielding sovereign debt, the bulk of which is from Europe and Japan.
In addition, equity markets have continued to rise, supported by the improving global economic backdrop, still highly accommodative monetary policy, increased confidence and investors’ continued search for yield.
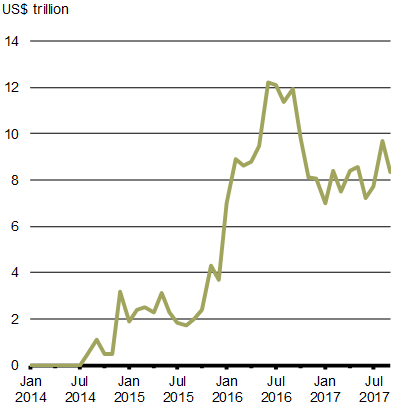
Sources: Bloomberg Barclays Global Aggregate Negative Yielding Debt Index.
Source: Haver Analytics.
Measures of volatility remain muted despite elevated policy, and more recently geopolitical, uncertainty. This situation heightens the risk of complacency among market participants, which could exacerbate any potential financial market turbulence if financial conditions tighten faster than expected as monetary policy normalization proceeds globally. In addition, some emerging economies are more vulnerable to a global repricing of risk, which could trigger sharp movements in capital flows, especially in those countries with large holdings of U.S.-dollar-denominated debt.
Despite strengthening global economic activity, declining unemployment rates and favourable financial conditions, the global economy continues to face a number of challenges. For example, the current strong economic performance, especially among advanced economies, is likely to moderate as many economies are expected to return to their respective trend growth rates in the short to medium term. In particular, pressures from changing demographics and productivity challenges, as well as risks from rising protectionism, continue to weigh on the outlook (Chart 1.16).
To 15-64 Population
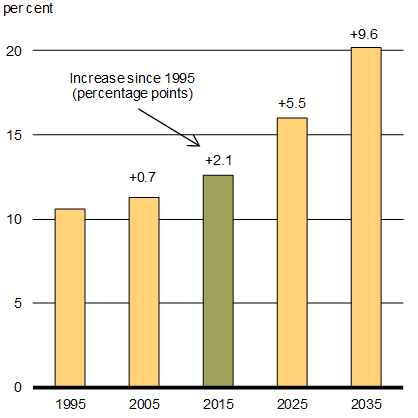
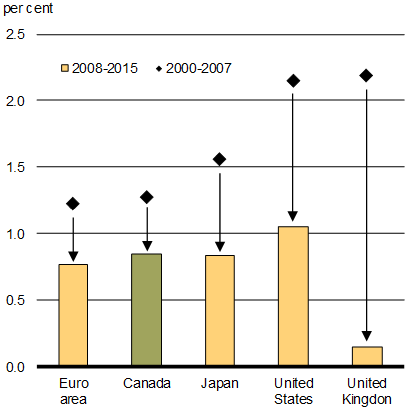
Source: OECD.
Private sector outlook
The fiscal projections contained in this Fall Economic Statement are based on the September 2017 survey of private sector economists. Details of the full private sector economic outlook are presented in Annex 1.
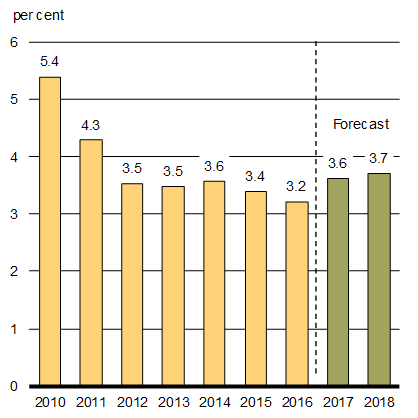
In summary, the economists expect real GDP growth to rise from 1.5 per cent in 2016 to 3.1 per cent in 2017, significantly higher than the 2.0 per cent expected in Budget 2017 and the 2.2 per cent originally projected in Budget 2016. The outlook for real GDP growth is little changed thereafter compared to Budget 2017. Similarly, expectations for growth in nominal GDP—the broadest measure of the tax base—have been revised up for 2017 (from 4.2 per cent to 5.5 per cent), but are largely unchanged thereafter. As a result, the level of nominal GDP over the projection horizon is $30 billion higher per year, on average, than was anticipated in Budget 2017 (Table 1.1).
| 2016 | 2017 | 2018 | 2019 | 2020 | 2021 | 2022 | 2017–2021 | |
|---|---|---|---|---|---|---|---|---|
| Real GDP growth | ||||||||
| Budget 20161 | 1.4 | 2.2 | 2.2 | 2.0 | 1.9 | – | – | – |
| Budget 20171 | 1.4 | 2.0 | 2.0 | 1.7 | 1.7 | 1.8 | – | 1.8 |
| 2017 Fall Economic Statement | 1.5 | 3.1 | 2.1 | 1.6 | 1.7 | 1.7 | 1.8 | 2.0 |
| GDP inflation | ||||||||
| Budget 20161 | 0.9 | 2.4 | 2.1 | 2.1 | 2.1 | – | – | – |
| Budget 20171 | 0.5 | 2.1 | 2.0 | 1.8 | 2.1 | 2.0 | – | 2.0 |
| 2017 Fall Economic Statement | 0.6 | 2.4 | 1.8 | 1.8 | 2.0 | 1.9 | 1.9 | 2.0 |
| Nominal GDP growth | ||||||||
| Budget 20161 | 2.3 | 4.6 | 4.3 | 4.2 | 4.1 | – | – | – |
| Budget 20171 | 1.9 | 4.2 | 4.0 | 3.5 | 3.8 | 3.8 | – | 3.9 |
| 2017 Fall Economic Statement | 2.1 | 5.5 | 4.0 | 3.4 | 3.7 | 3.6 | 3.8 | 4.1 |
| Nominal GDP level ($ billions) | ||||||||
| Budget 20161 | 2,033 | 2,126 | 2,218 | 2,310 | 2,404 | – | – | |
| Budget 20171 | 2,024 | 2,109 | 2,194 | 2,271 | 2,357 | 2,447 | – | |
| 2017 Fall Economic Statement | 2,028 | 2,140 | 2,226 | 2,302 | 2,388 | 2,473 | 2,568 | |
| Difference between Budget 2016 and 2017 Fall Economic Statement |
-5 | 13 | 8 | -8 | -16 | – | – | – |
| Difference between Budget 2017 and 2017 Fall Economic Statement |
3 | 30 | 31 | 31 | 31 | 26 | – | 30 |
Risk Assessment
Global and Canadian growth have strengthened in recent quarters and upside risks to the outlook are present. Stronger growth in the world economy, particularly in the euro area and more recently in the U.S., could be more durable and self-sustaining than anticipated, which would reinforce Canadian growth. As a result, investment growth could surprise on the upside, boosting Canada’s long-term productive capacity.
There are still downside risks to the outlook. In China, elevated corporate debt levels and the slow pace of economic reforms could lead to a greater-than-expected slowdown in growth. Uncertainty over U.S. economic policies could affect Canadian business confidence. Additionally, global financial markets could experience periods of turbulence as advanced-economy central banks begin or continue the significant task of gradually normalizing monetary policy. This is especially true in the context of muted market volatility and rising market valuations.
On the domestic front, Canada’s household debt-to-income ratio remains elevated historically. This could limit the contribution to growth of both housing and consumer spending in the coming years, particularly in a rising interest rate environment.
Overall, the risks to the September 2017 economic outlook appear broadly balanced. For prudent planning purposes, the adjustment for risk is $1.5 billion in 2017–18 and $3.0 billion in future fiscal years, to account for risks and uncertainty in the economic and fiscal forecast.
Changes to the Fiscal Outlook
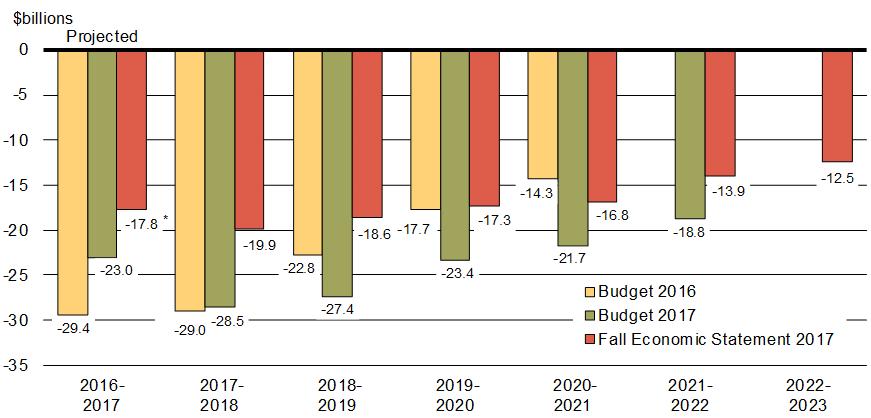
The improvement in the economic outlook of private sector forecasters, combined with the better-than-expected fiscal outcome in 2016–17, has resulted in a significant upward revision to the fiscal outlook (Chart 1.17).
In total, economic and fiscal developments since Budget 2017, including the measures announced in this Fall Economic Statement, have resulted in an improvement in the outlook for the budgetary balance of $8.6 billion in 2017–18, $8.8 billion in 2018–19, $6.1 billion in 2019–20 and $4.9 billion in each of the following two years. Correspondingly, recent strength in the economy and the improved fiscal outlook have reduced the debt-to-GDP ratio throughout the forecast horizon.
Sources: Public Accounts of Canada; Department of Finance Canada.
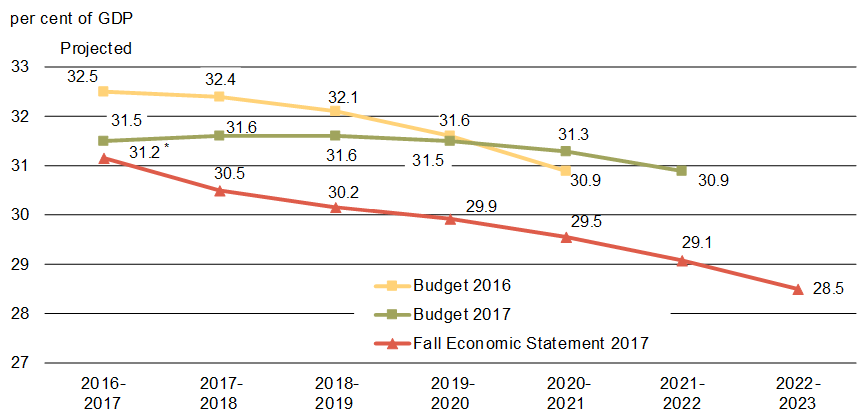
Sources: Public Accounts of Canada; Department of Finance Canada.
The Government has adopted a responsible approach to fiscal management that is appropriate to the current economic cycle and focused on long-term economic growth and fiscal sustainability.
During the economic weakness of late 2015 and early 2016, the Government made targeted fiscal investments, including tax cuts for the middle class, the Canada Child Benefit and infrastructure investments, that re-established economic momentum in Canada—protecting and creating Canadian jobs and supporting the long-term growth potential of the Canadian economy. These measures put money directly in the pockets of middle class Canadians, empowering them to support local small businesses, pay off their debts and save for the future. In just two years, the Government’s investments have helped to increase consumer confidence and brought hope for the future for millions of Canadian families.
The Government’s fiscal actions provided needed support for the economy—by leveraging the federal balance sheet to support growth at a time when household balance sheets were more leveraged. In this context, monetary and fiscal policies have become more complementary.
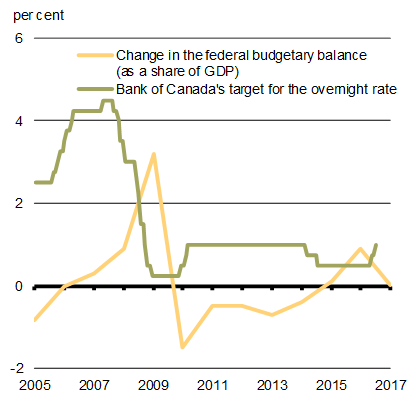
Sources: Statistics Canada; Bank of Canada; Department of Finance Canada.
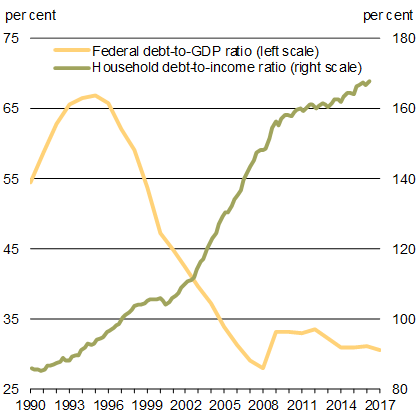
Sources: Statistics Canada; Department of Finance Canada.
Source: OECD.
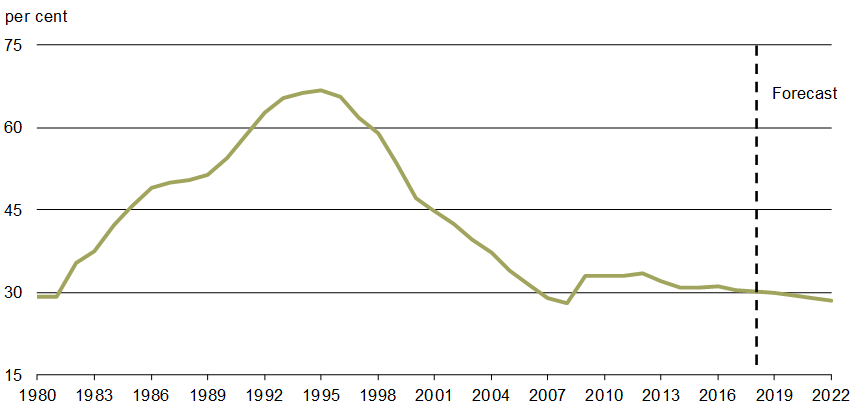
This approach has been effective, and the economy is now outperforming expectations. As the economy strengthens, the Government is adjusting its fiscal strategy to adapt to the better-than-expected economic outlook. The current fiscal track shows steady improvements in the Government’s budgetary position along with a commensurate decline in the federal debt-to-GDP ratio.
The Government will maintain this downward deficit and debt ratio track—preserving Canada’s low-debt advantage for current and future generations. Low debt levels support economic growth and intergenerational equity by keeping interest costs low and preserving flexibility to face future economic shocks and challenges.
Impact of Alternative Economic Scenarios
The fiscal projections presented in this Fall Economic Statement are based on an average of the September 2017 private sector economic outlook survey. However, economists surveyed offered a wide range of views regarding future economic growth and, therefore, the path of nominal GDP (the broadest measure of the tax base). Changes in economic growth assumptions can also have large impacts on the budgetary balance and debt-to-GDP profile over an extended projection horizon.
For example, if the Government based current fiscal projections on the average of the top four individual forecasts for nominal GDP growth—which is equivalent to nominal GDP growth being 0.3 percentage points per year higher, on average, than in the full September survey—the budgetary balance would improve by $3.7 billion per year on average (Chart 1.20). Further, this would result in a federal debt-to-GDP ratio of 26.5 per cent, its lowest level since 1977.
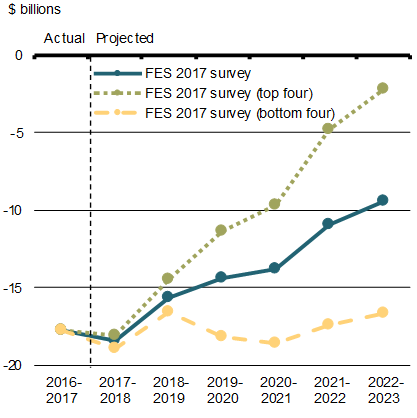
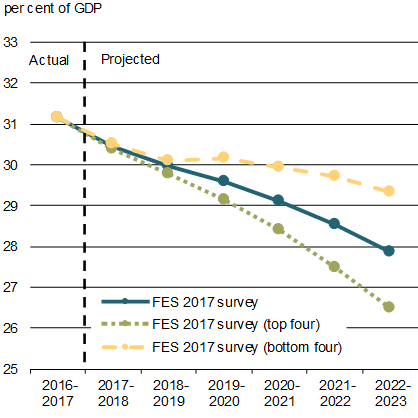
Conversely, basing fiscal projections on the average of the bottom four individual forecasts for nominal GDP growth—which is equivalent to nominal GDP growth being 0.3 percentage points per year lower, on average, than in the full September survey—the budgetary balance would worsen by $3.9 billion per year on average, and the federal debt-to-GDP ratio would still decline, but be 1.5 percentage points of GDP higher in 2022–23.
1 Employment as measured in Statistics Canada’s Labour Force Survey (LFS).
2 Paid employment (for example, excluding the self-employed) as measured in Statistics Canada’s Survey of Employment, Payroll and Hours (SEPH).
- Date modified: