Chapter 3 - Economic and Fiscal Overview
Introduction
The global economy is undergoing a fundamental structural shift. Populations in advanced economies are aging, thereby reducing workforce growth. Some emerging economies, notably China, are undergoing transitions away from investment- and trade-intensive industrialization toward more moderate consumption-based growth. At the same time, the decision of the United Kingdom (U.K.) to leave the European Union (EU) and growing numbers of anti-trade measures among major economies point to an increasing trend toward protectionism globally. Finally, the global economy continues to be affected by the 2008–2009 financial crisis and its aftermath—namely the build-up of debt in some countries and the need for financial system repair in others. These factors are being increasingly reflected in slower growth in global trade and investment, persistently low commodity prices and slower global growth.
In this low global growth environment, middle class Canadians are concerned about getting ahead. In this context, there is an increasing role for meaningful and targeted investments through fiscal policy, both to provide support to Canadians in the short run and to expand the productive and competitive capacity of the economy over the longer run.
This is why the government introduced policies beginning in late 2015 and in its first budget last March to support growth and create opportunities for middle class Canadians. This Fall Economic Statement further advances this plan through new investments in infrastructure and measures to attract global investment.
"What is happening in Canada should be used as a standard for what needs to be done in the fiscal space."
"Too many friends of globalisation are retreating, mumbling about 'responsible nationalism'. Only a handful of politicians—Justin Trudeau in Canada, Emmanuel Macron in France—are brave enough to stand up for openness."
This chapter provides an overview of recent major economic developments and presents the current fiscal situation and outlook.
Notes: This section incorporates data available up to and including October 25, 2016, unless otherwise indicated. All rates are reported at annual rates unless otherwise noted.
Global Economic Developments and Outlook
Global economic growth remains subdued. The global economy appears to have settled into a sustained lower growth track. Meanwhile, concerns about population aging, elevated levels of public and private debt, and political risks such as the ramifications of the vote by the U.K. to leave the EU continue to weigh on economic confidence, global trade and investment.
Slow Global Growth Continues
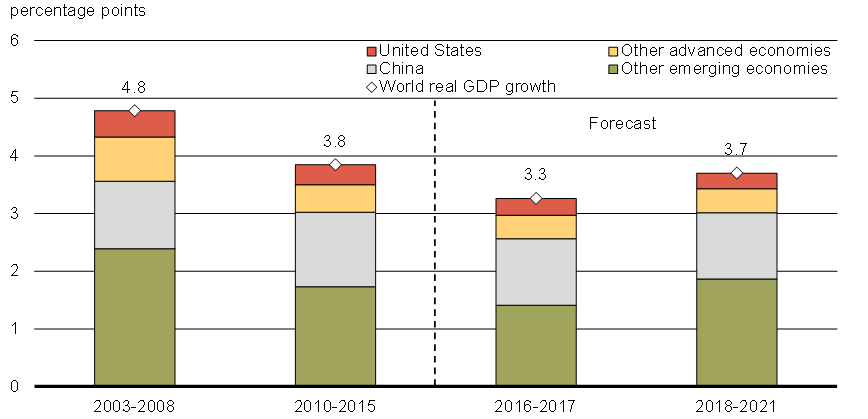
The International Monetary Fund (IMF) has yet again downgraded its near-term growth forecast, and now projects that the global economy will expand by 3.1 per cent in 2016, down from 3.2 per cent in 2015. A modest increase in economic activity in emerging economies is expected to be more than offset by a slowdown in advanced economies. In 2017, growth is projected to pick up, rising to 3.4 per cent, but to remain below the average rate of 5.1 per cent realized in the five years prior to the Great Recession (Chart 3.1).
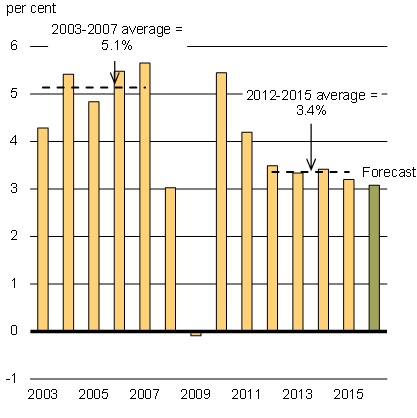
Notes: Data for the 2011 through 2014 WEOs have been restated by the Department of Finance Canada to incorporate benchmark revisions to country weights released by the IMF in July 2014 and updated in October 2016.
Sources: IMF, April 2011, April 2012, April 2013, April 2014, April 2015, April 2016 and October 2016 WEOs; Department of Finance Canada calculations.
The slow pace of global growth is accompanied by unusually low growth rates of investment and world trade. Both investment and trade were key drivers of economic activity prior to the global financial crisis (Chart 3.2). However, over the past three years, growth in world trade has lagged that of global gross domestic product (GDP), reversing a 30-year trend. The World Trade Organization projects that the volume of world trade is expected to expand by only 1.6 per cent in 2016, the slowest rate since 2009.
Note: Last data point is August 2016.
Sources: CPB Netherlands Bureau for Economic Policy Analysis, World Trade Monitor, August 2016; Department of Finance Canada calculations.
Note: Last data point is 2015.
Sources: IMF, October 2016 WEO; Department of Finance Canada calculations.
Slow economic and investment growth in part reflects legacy issues from the global financial crisis and recession. High levels of public debt have led many countries to restrain public investment in order to reduce budget deficits, while elevated levels of corporate and household debt associated with unsustainably strong business and housing investment in some countries continue to weigh on lending. Low commodity prices since 2014 have also led to declines in oil and gas investment globally and to painful adjustments for commodity-exporting countries more generally.
Behind these recent developments, long-term forces are also at play. Population aging is constraining labour force growth, which, combined with a marked slowdown in productivity across many advanced economies, is weighing on the potential growth of the world economy.
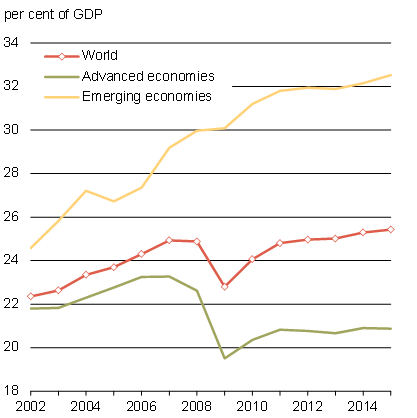
Emerging economies remain the main drivers of global growth, despite having slowed over the past five years (Chart 3.3). Between 2010 and 2015, growth in emerging economies slowed from 7.5 per cent to 4.0 per cent. In 2016, growth in economic activity in emerging countries is expected to edge up to 4.2 per cent as the contraction of economic activity in Russia and Brazil eases. At the same time, growth remains modest in most advanced economies, and is expected to fall to just 1.6 per cent in 2016 from 2.1 per cent last year. The slowdown in advanced economies in 2016 mainly reflects subdued growth in the first half of the year in the United States and an anticipated slowdown in Europe in the second half of the year. From 2018 onward, growth is expected to strengthen in emerging economies, lifting global growth.
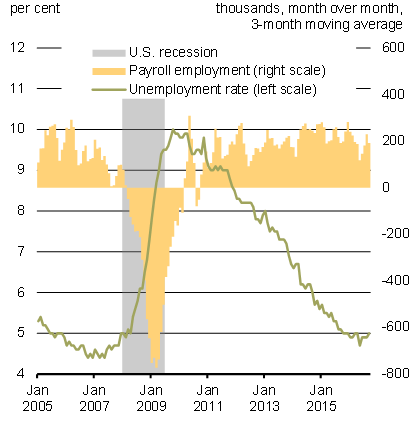
The United States is currently in one of its longest expansions since the Great Depression. Real GDP grew by a relatively healthy 2.6 per cent in 2015, up from 2.4 per cent in 2014. Household consumption remains solid, supported by a strong labour market, although exports and investment have been impacted by the higher U.S. dollar, low oil prices and weaker global demand (Chart 3.4).
Indeed, there was a loss of momentum in the first half of 2016 due to the ongoing drag from investment and a relatively high level of business inventories throughout the economy which, in the place of new production, have been drawn down to furnish demand. As a result, the U.S. growth outlook in the survey of private sector economists conducted by the Department of Finance Canada in September 2016 has been reduced to 1.6 per cent for 2016 as a whole, compared to 2.3 per cent expected at the time of Budget 2016 in March. As the drag from the drawdown of inventories fades and business investment picks up, growth is expected to improve to 2.2 per cent in 2017.
At its September 2016 meeting, the Federal Reserve noted the ongoing strengthening in the U.S. labour market and indicated that the case for an increase in the federal funds rate, while remaining data-dependent, has increased. Most private sector economists expect the Federal Reserve to raise interest rates at its December 2016 meeting. As this increase reflects the strengthening of the U.S. economy, this bodes well for its major trading partners, and Canada in particular.
Note: Last data point is September 2016.
Source: Haver Analytics.
Private sector economists have downgraded their growth forecasts for the U.S. economy, following the weak first half of 2016. Nevertheless, the U.S. economy is estimated to be operating close to its potential, as evidenced by the strong state of the U.S. labour market. This suggests there is limited room for the U.S. economy to grow significantly faster than its trend growth of around 2 per cent per year. Structural factors such as an aging population and low productivity growth are expected to continue to weigh on potential U.S. growth over the coming years.
Real GDP in the euro area increased by 2.0 per cent in 2015, up from 1.1 per cent in 2014, and has now expanded for 13 consecutive quarters. However, growth continues to be uneven among member countries, and overall is expected to remain modest. Growth in the euro area is being hampered by high unemployment and elevated levels of public and private debt. The IMF expects euro area economic growth to ease from 2.0 per cent in 2015 to 1.7 per cent in 2016 and 1.5 per cent in 2017. In spite of ongoing growth, risks remain elevated for the region. Fragile banking sectors in certain countries, burdened by high levels of non-performing loans, are vulnerable to economic and financial shocks. At the same time, there is greater uncertainty related to potential spillovers from the U.K. vote to exit the EU (i.e., Brexit) as well as the rise of populist and anti-globalization sentiment in EU countries.
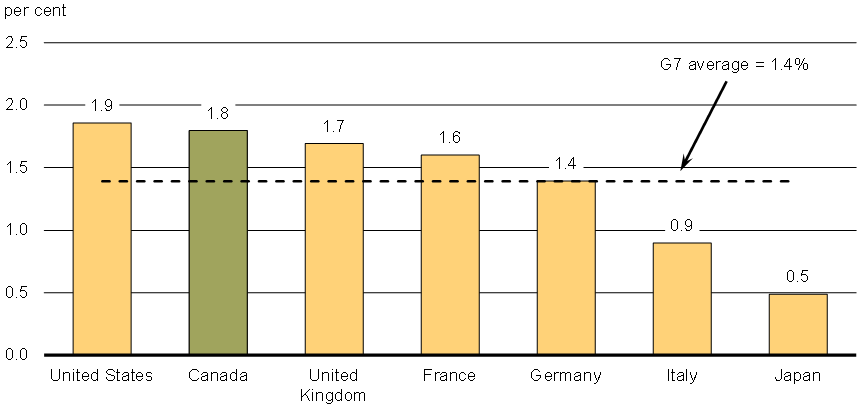
Overall, looking forward, the IMF projects that real GDP growth in G7 countries will average 1.4 per cent per year over the next five years. Canada is expected to be among the fastest growing economies (Chart 3.5), driven in part by the measures put forward by the government since late 2015, including the middle class tax cut, the introduction of the Canada Child Benefit and investment in infrastructure.
Markets Are Adapting to Lower Growth Expectations and Unprecedented Monetary Policy
In the context of slow global growth, financial markets remain volatile as investors search for yield. Some investor appetite for risk has returned following the elevated global market turbulence earlier this year that was associated with declines in China's equity markets. As well, after initially responding negatively to the Brexit vote of June 23, financial markets rebounded and have since generally been more stable. This has left most major stock market indices at higher levels than at the time of both the March budget and the June Brexit referendum (Chart 3.6).
Combined with expectations of a longer period of accommodative monetary policy conditions, particularly in the euro area and Japan, interest rates have been pushed down further since Budget 2016. Indeed, the Organisation for Economic Co-operation and Development (OECD) estimates that more than 35 per cent of OECD-wide government debt is trading at negative yields. As a result, the average real 10-year government bond rate in major advanced economies is now negative, while equity markets have realized all-time highs.
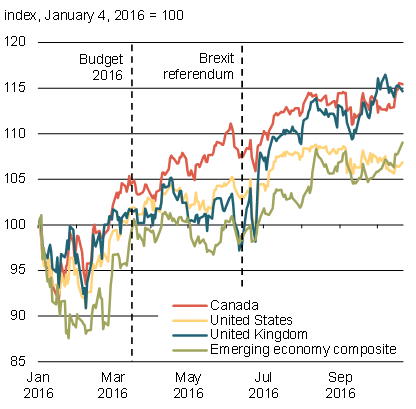
Notes: For Canada, the S&P/TSX; for the U.S., the S&P500; for the U.K., the London Financial Times 100; the emerging economy composite is a GDP-weighted average of the Brazil Bovespa, Russia RTS, India Bombay Sensex and China Dow Jones China 88. Daily data up to and including October 24, 2016.
Source: Haver Analytics.
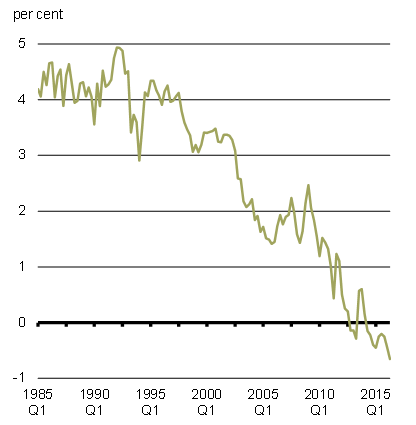
Notes: Excludes Italy. Last data point is 2016Q2.
Sources: The Economist; "Measuring the 'World' Real Interest Rate", Mervyn King and David Low, National Bureau of Economic Research working paper, February 2014; Department of Finance Canada calculations.
Commodity Prices Are Expected to Remain Low
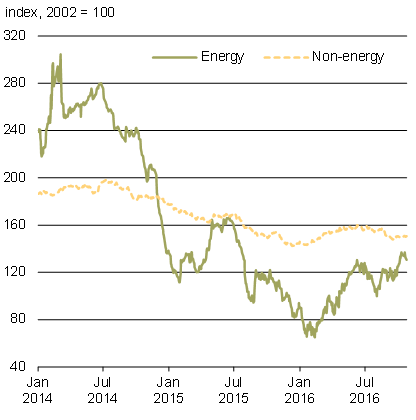
After declining to exceptionally low levels earlier this year, crude oil prices have since regained some ground, but remain at less than half the levels prevailing in mid-2014. The modest increase in prices since early 2016 largely reflected supply disruptions in some regions, including shutdowns due to the Fort McMurray wildfire.
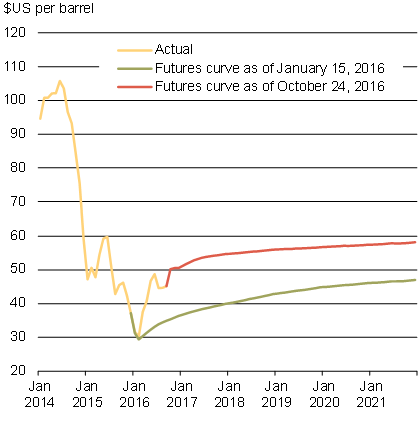
These factors, however, were largely temporary and underlying concerns over excess supply remain, reflecting elevated production from the Organization of the Petroleum Exporting Countries (OPEC), in spite of a recent agreement to curtail output modestly. Further, the number of U.S. oil rigs has recently edged up, despite a still-elevated level of production and inventories at historically high levels. Price expectations are further dampened by weak global demand conditions, particularly in emerging economies, which are expected to be the major driver behind future oil demand growth. Current futures prices suggest West Texas Intermediate (WTI) crude oil prices will remain below US$60 per barrel over the medium term (Chart 3.7).
Weak global demand has also weighed on some non-energy commodities. Base metal prices, although up modestly from early this year, remain far below levels seen several years ago. This largely reflects slowing demand from China which has accompanied that country's transition away from commodity-intensive non-residential business investment. Other non-energy commodity prices have remained relatively flat since early this year, with modest gains in forestry product prices, reflecting improving U.S. housing market conditions, largely offset by declines in agricultural prices, mainly due to increased supply.
Sources: Commodity Research Bureau; Bloomberg; Department of Finance Canada calculations.
Note: Last data point is December 2021.
Source: Commodity Research Bureau.
Canada's Economic Situation
The Canadian economy continues to adjust to lower oil prices and a soft global economic backdrop.
Non-oil related sectors of the economy have been broadly resilient and household consumption has held steady. Meanwhile, investment and exports have yet to gain traction, reflecting in part the fragile and uncertain global economic environment and recent weaker U.S. demand.
Looking forward, several factors are supporting growth in Canada. Crude oil prices have risen modestly from their lows of early this year, and further support for prices will emerge as global oil markets move closer to being balanced. The global economy, while still uncertain, has stabilized to some extent with sustained growth in the euro area and indications that U.S. economic growth will pick up following a recent soft patch in the first half of 2016. Further, monetary policy remains highly accommodative, both in Canada and elsewhere, which will continue to support growth.
However, although broad aggregate indicators point to firming growth ahead, it is clear that uncertainty over the global economic situation is weighing on many Canadians.
In this context, this government is committed to providing support to middle class Canadians and expanding the productive and competitive capacity of the economy to improve Canada's long-term growth prospects. Important investments to strengthen Canada's economy are just starting to take hold. In particular, Canadians have been benefiting from the middle class tax cut since January 2016 and from the Canada Child Benefit since July 2016. These measures are now supporting growth. Further, the implementation of the first phase of the government's transformational infrastructure program is underway, which will provide a boost to economic activity in the short term. More importantly, this long-term infrastructure plan will provide historic, unprecedented levels of funding in support of projects across the country to support durable and inclusive economic growth.
The Canadian Economy Remains Resilient
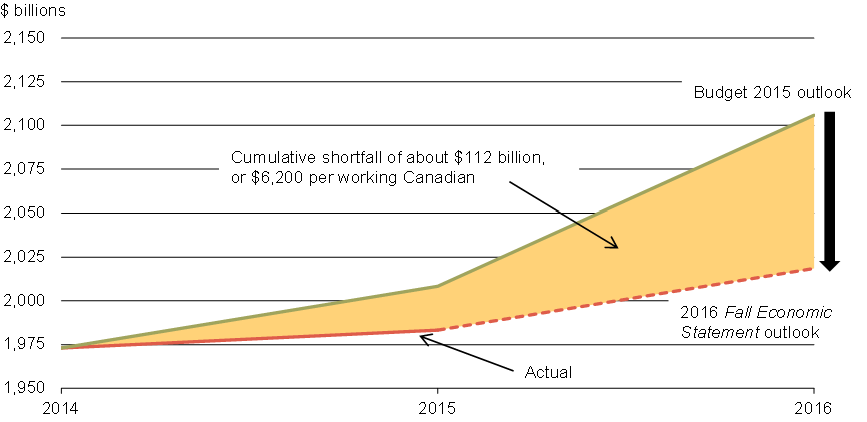
The decline in crude oil and other commodity prices over the past two years has had a profound effect on the Canadian economy. Relative to expectations at the time of the 2015 budget, the level of nominal GDP—which represents the sum of all incomes economy-wide—is now $87 billion lower. This represents a cumulative loss of $112 billion in national income over the last two years, or $6,200 for every working Canadian (Chart 3.8).
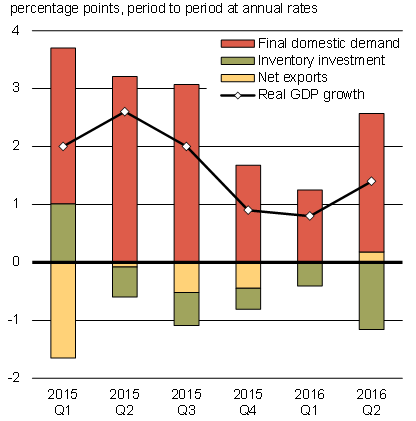
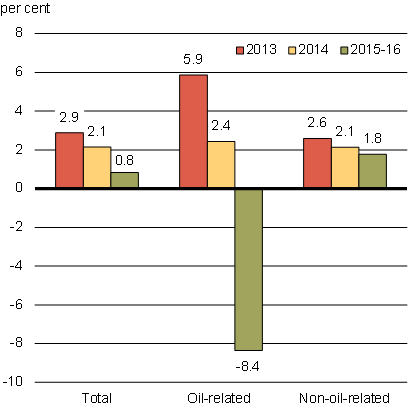
Real GDP growth has been modest, on average, since early 2015 (Chart 3.9). This stems mainly from lower oil-related activity, which has contracted by an average annual pace of 8.4 per cent per quarter over the period. The decline in oil-related output has largely been due to lower business investment in the sector, which has fallen by nearly 50 per cent since mid-2014. Outside the oil sector, the Canadian economy has remained resilient, growing at an average pace of 1.8 per cent per quarter since early 2015.
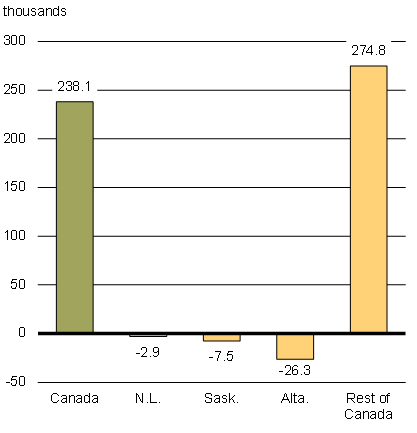
The labour market has also remained relatively firm, as total employment in Canada has risen by almost 240,000 since October 2014. This reflects gains outside the oil-producing regions, where employment has increased by nearly 275,000 over this period. Employment in the oil-producing regions has fallen by more than 35,000 since October 2014, with over 70 per cent of this decline occurring in Alberta.
Note: Real GDP is at basic prices, 2007 constant dollars. Oil-related goods-producing industries include oil and gas extraction, support activities for mining and oil and gas extraction, and engineering and other construction activities. Last data point is 2016Q2.
Sources: Statistics Canada; Department of Finance Canada calculations.
Note: Last data point is September 2016.
Sources: Statistics Canada; Department of Finance Canada calculations
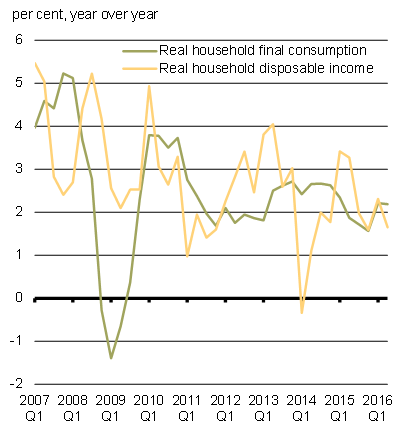
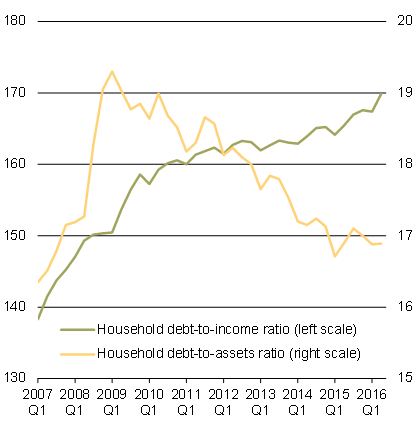
Gains in the Canadian labour market have underpinned average growth in real household consumption of about 2 per cent per quarter since mid-2014, broadly in line with household income growth. While household debt has continued to climb relative to income, this largely reflects households borrowing to acquire long-term assets—particularly housing—which represent roughly 40 per cent of total household assets, on average. As a result, household leverage, as measured by the ratio of household debt to assets, has remained stable at around 17 per cent since the end of 2014 (Chart 3.10).
Note: Last data point is 2016Q2.
Sources: Statistics Canada; Department of Finance Canada calculations.
Sources: Statistics Canada; Department of Finance Canada calculations.
While low interest rates have allowed Canadians to pay down their mortgages and make other purchases, there is a risk that elevated household debt may constrain future household spending on goods and services, particularly if interest rates rise as expected.
Business investment declined only modestly in the second quarter of 2016, compared to the double-digit declines in 2015, and is likely to return to positive growth going forward (Chart 3.11). This is primarily due to oil and gas investment, where the pace of contraction has slowed in recent quarters and the decline is expected to have run its course by 2017.
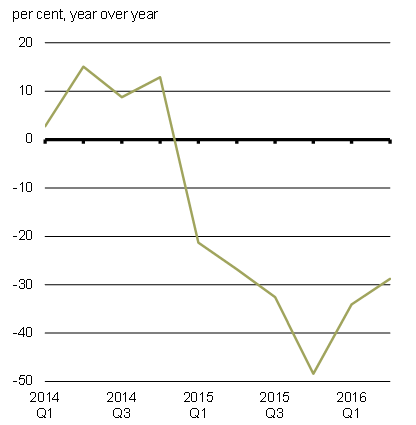
Notes: Investment data are not seasonally adjusted. Last data point is 2016Q2.
Source: Statistics Canada.
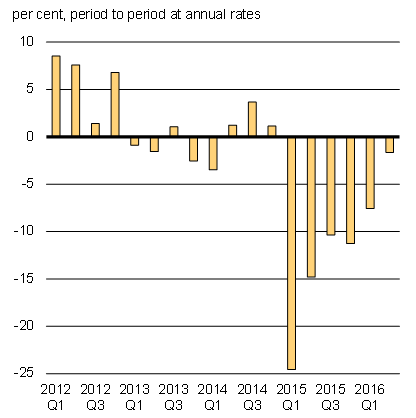
Notes: Business investment includes non-residential structures, machinery and equipment, and intellectual property products. Last data point is 2016Q2.
Sources: Statistics Canada; Department of Finance Canada calculations.
The sizeable depreciation of the Canadian dollar over the past two years is providing a boost to Canadian exporters. Indeed, non-energy subsectors whose exports are more sensitive to the exchange rate have been doing better, with the volume of goods exports in these subsectors increasing by over 6 per cent since mid-2014 (Chart 3.12). However, overall, Canadian non-energy goods export growth has been disappointing, slowing from 5.3 per cent in 2014 to 3.4 per cent in 2015, and contracting by 0.1 per cent so far in 2016.
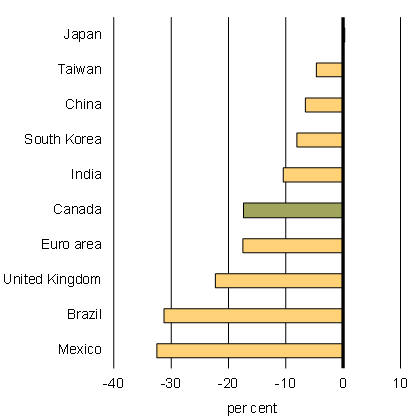
Part of the reason for the under-performance of Canadian exports is that the lower value of the bilateral Canada-U.S. exchange rate overstates the true level of competitiveness gains realized by Canadian exporters. This is because the currencies of many of our competitors have also depreciated against the U.S. dollar. For example, the Mexican peso has fallen by 32 per cent and the euro by 17 per cent since mid-2014, compared to 17 per cent for the Canadian dollar. As a result, Canadian exporters have not made any significant gains in market share, particularly in the U.S., where competition for market share remains very strong.
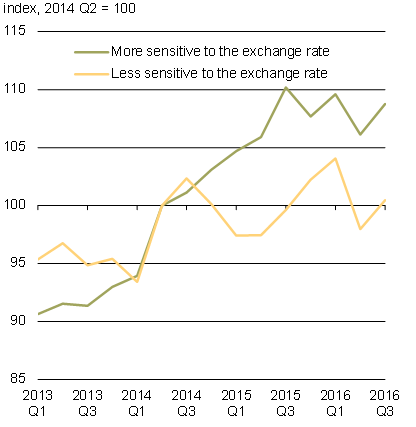
Notes: By 2016Q2, the shares were 47.7 per cent for non-energy exports more sensitive to the exchange rate and 52.3 per cent for the less sensitive ones. Last data point is 2016Q3 based on July and August data and assuming no change in September.
Sources: Statistics Canada; Bank of Canada; Department of Finance Canada calculations.
Note: Change between June 2014 and September 2016.
Source: Haver Analytics.
The recent weak performance of Canada's exports also reflects softer U.S. demand over the last few quarters, following more solid U.S. demand growth over 2014 and 2015. Moreover, global demand for U.S. exports has also fallen off, reflecting the stronger U.S. dollar. Because of the high level of integration of the U.S. and Canadian economies, this has reduced the demand for Canadian exports used as intermediate inputs in the production of U.S. exports. That being said, U.S. demand is expected to pick up going forward and continue to grow at a solid pace for several years, which will support Canadian exporters.
Canadian Economic Outlook—Private Sector Forecasts
Budget 2016 identified a number of risks to the Canadian economic outlook. Several of these risks have materialized. These include: ongoing disappointing growth in the U.S. and the associated negative impacts on Canadian exports; lags in the response of Canadian exports to the lower level of the dollar, related to the ongoing challenges of the adjustments to lower oil prices; and the dampening effects of these developments on domestic business investment. Other risks have also emerged, including those related to the U.K. vote to leave the EU.
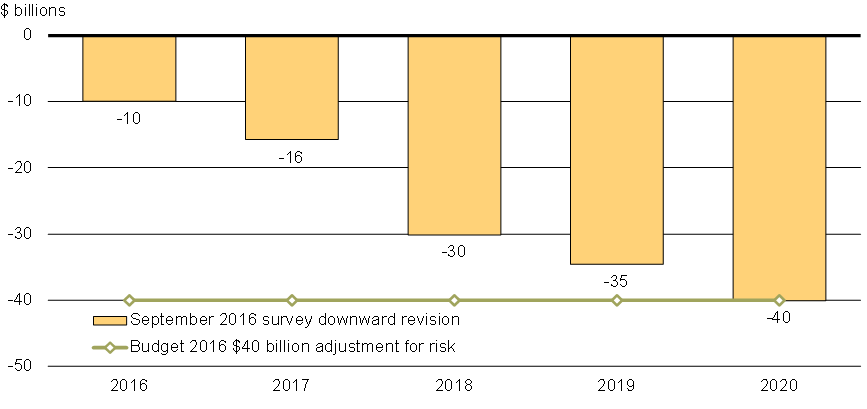
Reflecting these developments, private sector forecasters have again, on average, revised down their outlook for real GDP growth in Canada in this Fall Economic Statement (details of the full private sector economic outlook are presented in Annex 1). The downgrade in the September 2016 survey of private sector economists reflects the realization in the baseline economic outlook of low and variable growth as being the new norm. The result is that relative to the Budget 2016 projections, the level of nominal GDP (the broadest measure of the tax base) has been revised down by $10 billion in 2016, with this gap rising to $40 billion by 2020 (Chart 3.13).
In other words, if the economic situation does not improve, by the end of the projection period, the $40 billion adjustment for risk introduced in the last budget will be absorbed by the lower economic outlook. In that context, the government's decision to include a $40 billion forecast adjustment in Budget 2016 was prudent and appropriate.
Impact of Economic Developments on the Fiscal Outlook
The downward revision to the economic outlook by private sector forecasters has resulted in a corresponding downward revision to the government's fiscal outlook (Table 3.1). In total, the impact of economic and fiscal developments since Budget 2016 has lowered the outlook for the budgetary balance by $1.3 billion in 2016–17, $3.9 billion in 2017–18 and over $6.4 billion in each of the following three years. As a result, the value of the Budget 2016 forecast adjustment (of $6.0 billion per year) has been fully absorbed over the projection horizon.
A more detailed summary of changes to the fiscal outlook since Budget 2016 is provided in Annex 1.
| Projection | |||||||
|---|---|---|---|---|---|---|---|
| 2015– 2016 | 2016– 2017 | 2017– 2018 | 2018– 2019 | 2019– 2020 | 2020– 2021 | 2021– 2022 | |
| Budget 2016 budgetary balance | -5.4 | -29.4 | -29.0 | -22.8 | -17.7 | -14.3 | n/a |
| Economic and fiscal developments since Budget 2016 |
4.5 | -1.3 | -3.9 | -6.7 | -6.4 | -6.6 | |
| Forecast adjustment from Budget 2016 | 6.0 | 6.0 | 6.0 | 6.0 | 6.0 | ||
| Total economic and fiscal developments | 4.5 | 4.7 | 2.1 | -0.7 | -0.4 | -0.6 | |
| Revised budgetary balance (without forecast adjustment) before policy actions and fiscal investments | -1.0 | -24.7 | -26.9 | -23.5 | -18.2 | -14.9 | -11.7 |
New Investments to Grow the Middle Class
Building on actions taken in late 2015 and in Budget 2016, the government has implemented a number of additional actions to grow the middle class and strengthen the economy.
Actions since Budget 2016 have included an historic agreement to strengthen the Canada Pension Plan to help Canadians achieve their goal of a safe, secure and dignified retirement; the indexation of the Canada Child Benefit, starting in 2020, which will help to ensure that Canadian families continue to receive the help they need to deal with the high cost of raising children; and an expansion of the number of immigrants coming into Canada with high human capital that would create jobs in Canada's knowledge economy.
The direct cost of these and other actions taken since Budget 2016 are shown in Table 3.2. A more detailed summary of policy actions since Budget 2016 is provided in Annex 1.
| Projection | |||||||
|---|---|---|---|---|---|---|---|
| 2015– 2016 | 2016– 2017 | 2017– 2018 | 2018– 2019 | 2019– 2020 | 2020– 2021 | 2021– 2022 | |
| Revised budgetary balance (without forecast adjustment) before policy actions and fiscal investments | -1.0 | -24.7 | -26.9 | -23.5 | -18.2 | -14.9 | -11.7 |
| Policy actions since Budget 20161 | |||||||
| Canada Pension Plan enhancement | -0.1 | -0.5 | -0.7 | -1.0 | |||
| Indexation of the Canada Child Benefit | -0.5 | -1.2 | |||||
| Immigration Levels Plan | 0.0 | -0.2 | -0.2 | -0.2 | -0.2 | -0.3 | |
| Other2 | -0.6 | -0.6 | -0.6 | -0.2 | -0.3 | -0.3 | |
| Total | -0.6 | -0.8 | -0.9 | -0.9 | -1.7 | -2.7 | |
| Fiscal investments included in this Fall Economic Statement1 | |||||||
| Investing in Canada Infrastructure Plan | 0.0 | -0.7 | -4.0 | -4.2 | -5.3 | -6.7 | |
| Less funds existing in the fiscal framework/ sourced from departmental resources | 0.2 | 0.6 | 2.5 | 4.0 | 5.2 | 6.6 | |
| Net fiscal impact | 0.2 | -0.1 | -1.5 | -0.2 | -0.1 | -0.1 | |
| Attracting Investment and Global Skills Strategy | 0.0 | 0.0 | 0.0 | -0.1 | -0.1 | -0.1 | |
| Total | 0.2 | -0.1 | -1.5 | -0.2 | -0.2 | -0.2 | |
| Final budgetary balance | -1.0 | -25.1 | -27.8 | -25.9 | -19.3 | -16.8 | -14.6 |
| Budgetary balance (per cent of GDP) | 0.0 | -1.2 | -1.3 | -1.2 | -0.8 | -0.7 | -0.6 |
| Federal debt (per cent of GDP) | 31.1 | 31.8 | 31.8 | 31.9 | 31.5 | 31.0 | 30.4 |
In addition, as outlined in Chapter 2, the government is announcing planned investments of almost $2.0 billion over six years in this Fall Economic Statement to improve the quality of life for middle class Canadians and strengthen the economy. These investments include:
- An additional $1.7 billion investment in the government's long-term infrastructure plan beyond provisions made in anticipation of government decisions on that plan; and
- A $271.3 million investment to attract global investment into Canada and to expand the talent-friendly immigration system.
The total value of new measures announced in Budget 2016, along with the middle class tax cut announced in December 2015, was projected to be $11.6 billion in 2016–17. These measures were expected to boost real economic activity by 0.5 per cent in the first year of implementation, compared to what would have been the case without these measures.
The government is on track in its implementation of Budget 2016 measures. Indeed, all major measures for modest- and low-income households, totaling $5.6 billion in value in 2016–17, have already been implemented. In particular, in July:
- The first payments under the new Canada Child Benefit were mailed out;
- Seniors began receiving their Guaranteed Income Supplement top-up benefit; and
- Employment Insurance (EI) recipients began accessing additional EI benefits.
In addition, the middle class tax cut, which is estimated to cost $1.3 billion in 2016–17, has been in effect since January 1, 2016, along with many other Budget 2016 proposals that provide tax relief (such as restoring the Labour-Sponsored Venture Capital Corporations Tax Credit and introducing the Teacher and Early Childhood Educator School Supply Tax Credit).
Finally, the government's significant investments in housing and infrastructure, as well as to support Indigenous persons, veterans, youth, science and research, and business growth and innovation, continue to roll out as expected.
Overall, while some program implementation delays can naturally be expected, the anticipated boost to real economic activity in the first year of Budget 2016 implementation remains broadly in line with expectations at the time of the budget.
Upside and Downside Risks to the Economic and Fiscal Outlook
On October 13, 2016, the Minister of Finance met with private sector economists to discuss the economic situation and outlook. As detailed above, some of the risks identified at the time of Budget 2016 have materialized. The average outlook in the September 2016 survey has been revised downward accordingly. In this context, the economists noted that risks to the September 2016 average private sector outlook are now more balanced than at the time of Budget 2016.
Nonetheless, there are still a number of downside risks and uncertainties surrounding the global and Canadian economic outlook. These include the uneven path of economic rebalancing in China, the poor condition of many credit institutions in Europe, and future negotiations over the relationship between the U.K. and the EU. However, on other issues there will be more clarity over the coming weeks, including the outcome of the November 8 U.S. election and further information on any U.S. Federal Reserve move on U.S. interest rates (markets are currently pricing in a 72 per cent chance of a rate hike at the December 13-14 Federal Open Market Committee meeting) and the global financial market reaction to this.
Moreover, there are some upside risks to the economic outlook. Global oil prices could be higher than currently projected, as global markets move closer to balancing and the impacts of the significant worldwide cuts to oil-related investment continue to affect production. The U.S. economy may also surprise on the upside, given the Federal Reserve's still highly accommodative monetary policy stance, a more supportive fiscal policy stance at both the state and federal levels, and solid job gains, which may be inducing discouraged workers back into the labour force, thus boosting growth potential.
Taking these factors into account, and based on upcoming economic data releases (including GDP data for the third quarter of 2016), the government will continue to evaluate risks between now and the time of Budget 2017 to determine the appropriate level of the adjustment for risk to be used in the Budget 2017 planning assumptions.
Impact of Alternative Growth Scenarios
The fiscal projections presented in this Fall Economic Statement are based on an average of the September private sector economic outlook survey. Based on the current consensus view, the federal debt-to-GDP ratio will fall to 31.0 per cent by 2020–21. However, economists surveyed offered a wide range of views regarding future economic growth and, therefore, the path of nominal GDP (the broadest measure of the tax base). Changes in economic growth assumptions can also have large impacts on the budgetary balance and debt-to-GDP profile over an extended projection horizon (Charts 3.14 and 3.15).
For example, if the government based current fiscal projections on the average of the upper four individual forecasts (or top four) for nominal GDP growth—which is equivalent to nominal GDP growth being 0.5 percentage points per year higher, on average, than in the full September survey—the budgetary balance would improve by $6.1 billion per year on average (Chart 3.14), and result in a federal debt-to-GDP ratio that would be well below its 2015–16 level (Chart 3.15). Conversely, basing fiscal projections on the average of the lower four individual forecasts (or bottom four) for nominal GDP growth—which is equivalent to nominal GDP growth being 0.5 percentage points per year lower, on average, than in the full September survey—the budgetary balance would worsen by $6.2 billion per year on average, and the federal debt-to-GDP ratio would be 2 percentage points of GDP higher.
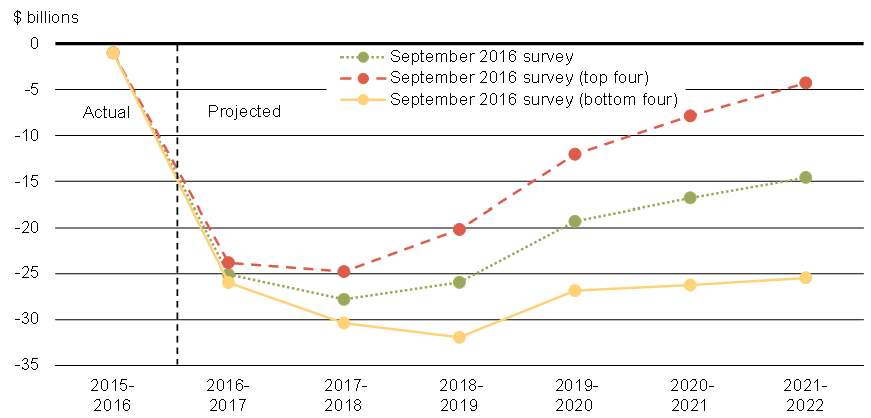
Notes: The September 2016 survey scenario is based on the average private sector economists' projection for nominal GDP without any forecast adjustment. The top (bottom) four scenarios are based on the average of the most optimistic (pessimistic) projections for nominal GDP growth among the economists surveyed.
Sources: Department of Finance Canada survey of private sector economists; Department of Finance Canada calculations.
Federal Debt-to-GDP Ratio Under Various Economic Growth Scenarios
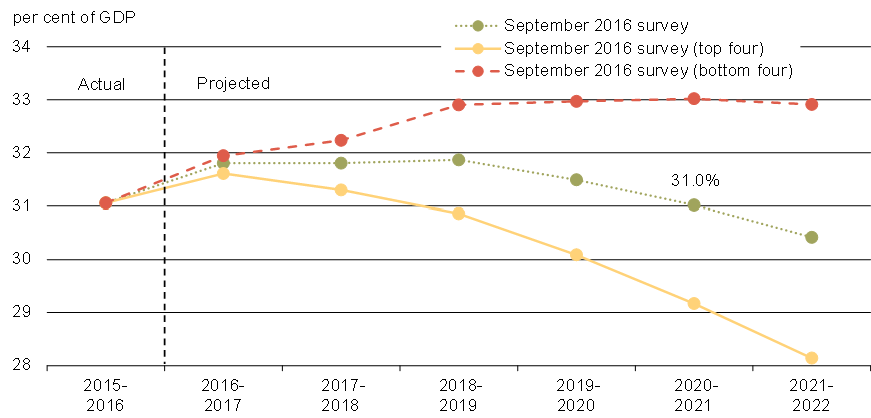
Sources: Department of Finance Canada survey of private sector economists; Department of Finance Canada calculations.
Revitalizing the Economy With Investments to Grow the Middle Class
The government understands that smart investments in the economy are necessary to create the conditions required for a good standard of living, a secure retirement and better prospects for future generations. The government's plan fosters an economy that works for the middle class and those working hard to join it by investing in Canada and its people, increasing our competitiveness, improving tax fairness and remaining committed to fiscal sustainability.
Building on previously announced investments to strengthen the economy and grow the middle class, the government is taking further steps on a course for fairer, more inclusive growth in this Fall Economic Statement. The investments in this Fall Economic Statement reflect the need to invest to spur long-term growth.
In this regard, the government will consider future investments in Budget 2017 in the things Canada's economy needs to prosper over the long term, as well as investments to set the stage for stronger economic growth that will well position Canada in the new economy. These areas include:
- Jobs: The government will put into action a plan to create opportunities and develop skills for people in Canada who currently are not able to fully participate in the labour market, including Indigenous peoples, new immigrants and low-income workers.
- Innovation: To create good, middle class jobs and improve the quality of life of Canadians, the government commits to investments that will help businesses and entrepreneurs become more innovative, competitive and successful.
- Environment: The government remains committed to working with its partners to invest in a cleaner energy future for all Canadians, without the need to choose between a strong economy and a healthy environment.
Looking to Canada's future, the government will continue to act proactively to implement policies and make the much-needed investments required to position Canada for strong, inclusive and sustainable growth, while remaining fiscally responsible and maintaining Canada's low debt advantage.
- Date modified: