
Archived - Chapter 3
Fiscal Update: A Responsible Fiscal Plan
On this page:
3.1 Fiscal Outlook
Finishing the fight against COVID-19 remains the single best way to secure a strong economic recovery, for everyone. The government is prudently managing federal finances to help preserve fiscal firepower for future challenges and crises, and ensure that future generations are not burdened with COVID-19-related debt.
Canada entered this crisis in a strong fiscal position, enabling the government to quickly put in place one of the most effective response plans in the world. The government’s COVID-19 economic response plan has helped Canadians and Canadian businesses get through the crisis and has laid the foundations for strong economic growth and job creation. Provincial and territorial pandemic responses have relied on strong and consistent support from the federal government.
After over 21 months of unprecedented economic upheaval, 8 out of every 10 dollars to fight COVID-19 and support Canadians has come from the federal government. This unprecedented support, including income and business support programs, has had a significant, positive effect on provincial and territorial revenues and overall balance sheets.
“We will continue to support our economies for as long as is necessary, shifting the focus of our support from crisis response to promoting growth into the future, with plans that create jobs, invest in infrastructure, drive innovation, support people, and level up so that no place or person, irrespective of age, ethnicity or gender is left behind. This has not been the case with past global crises, and we are determined that this time it will be different.”
Unwinding COVID-related Deficits and Creating Jobs and Growth
With Canada’s economic recovery advancing, over 106 per cent of jobs recovered, and many businesses reopened, this phase of the pandemic requires more targeted federal support measures for those particularly affected by the pandemic. Table 3.1 below outlines the impact of recent economic and fiscal developments on the fiscal outlook, including the impact of policy actions taken since Budget 2021.
Notably, the fiscal outlook includes two provisions in 2021-22 for expected short-term cost pressures in relation to unfolding events:
- the estimated cost of responding to the Omicron variant, including possible increased use of the government’s support programs, particularly the lockdown support measures, additional border testing and health measures; and,
- an early estimate of the federal government’s share of recovery costs under the Disaster Financial Assistance Arrangements as well as other costs related to the recent natural disasters in British Columbia.
The government has committed to full and fair compensation to those First Nation children and their families who experienced harms — including those children removed from their homes since 1991 — and to address discrimination related to First Nation child welfare. Although negotiations are still ongoing, the government has provisioned $40 billion to respond to the order of the Canadian Human Rights Tribunal, compensate for harms by the First Nations Child and Family Services program and for delays or denials in needed children’s services, and support long-term program reforms to make sure communities have the support they need to keep families together.
| Projection | |||||||
|---|---|---|---|---|---|---|---|
| 2020-2021 | 2021-2022 | 2022-2023 | 2023-2024 | 2024-2025 | 2025-2026 | 2026-2027 | |
| Budgetary balance – Budget 2021 | -354.2 | -154.7 | -59.7 | -51.0 | -35.8 | -30.7 | |
| Economic and fiscal developments (Annex 1, Table A1.3) | 36.0 | 38.5 | 14.1 | 14.5 | 11.2 | 12.6 | |
| Budgetary balance before policy actions and investments | -318.1 | -116.2 | -45.6 | -36.6 | -24.6 | -18.1 | -9.3 |
| Policy Actions since Budget 2021, and in this Economic and Fiscal Update | |||||||
| Protecting Our Recovery by Finishing the Fight Against COVID-19 | -13.0 | -7.8 | -3.3 | -0.8 | -0.7 | -0.7 | |
| Other Policy Actions (Annex 1, Table A1.12) | -1.8 | -3.0 | -2.0 | -1.6 | -1.7 | -0.8 | |
| Provisions for potential costs of: | |||||||
Omicron variant response |
-4.5 | ||||||
Recovering from natural disasters in British Columbia |
-5.0 | ||||||
| Addressing past harms and discrimination related to First Nation child welfare | -16.0 | -4.0 | -3.7 | -3.9 | -4.0 | -4.1 | -4.2 |
Less: Funds previously provisioned in the fiscal framework |
6.4 | 0.0 | 1.8 | 1.8 | 1.9 | 1.9 | 1.9 |
Net fiscal impact |
-9.6 | -4.0 | -1.9 | -2.1 | -2.1 | -2.2 | -2.3 |
| Total – Actions since Budget 2021 | -9.6 | -28.4 | -12.8 | -7.4 | -4.6 | -4.6 | -3.8 |
| Budgetary balance | -327.7 | -144.5 | -58.4 | -43.9 | -29.1 | -22.7 | -13.1 |
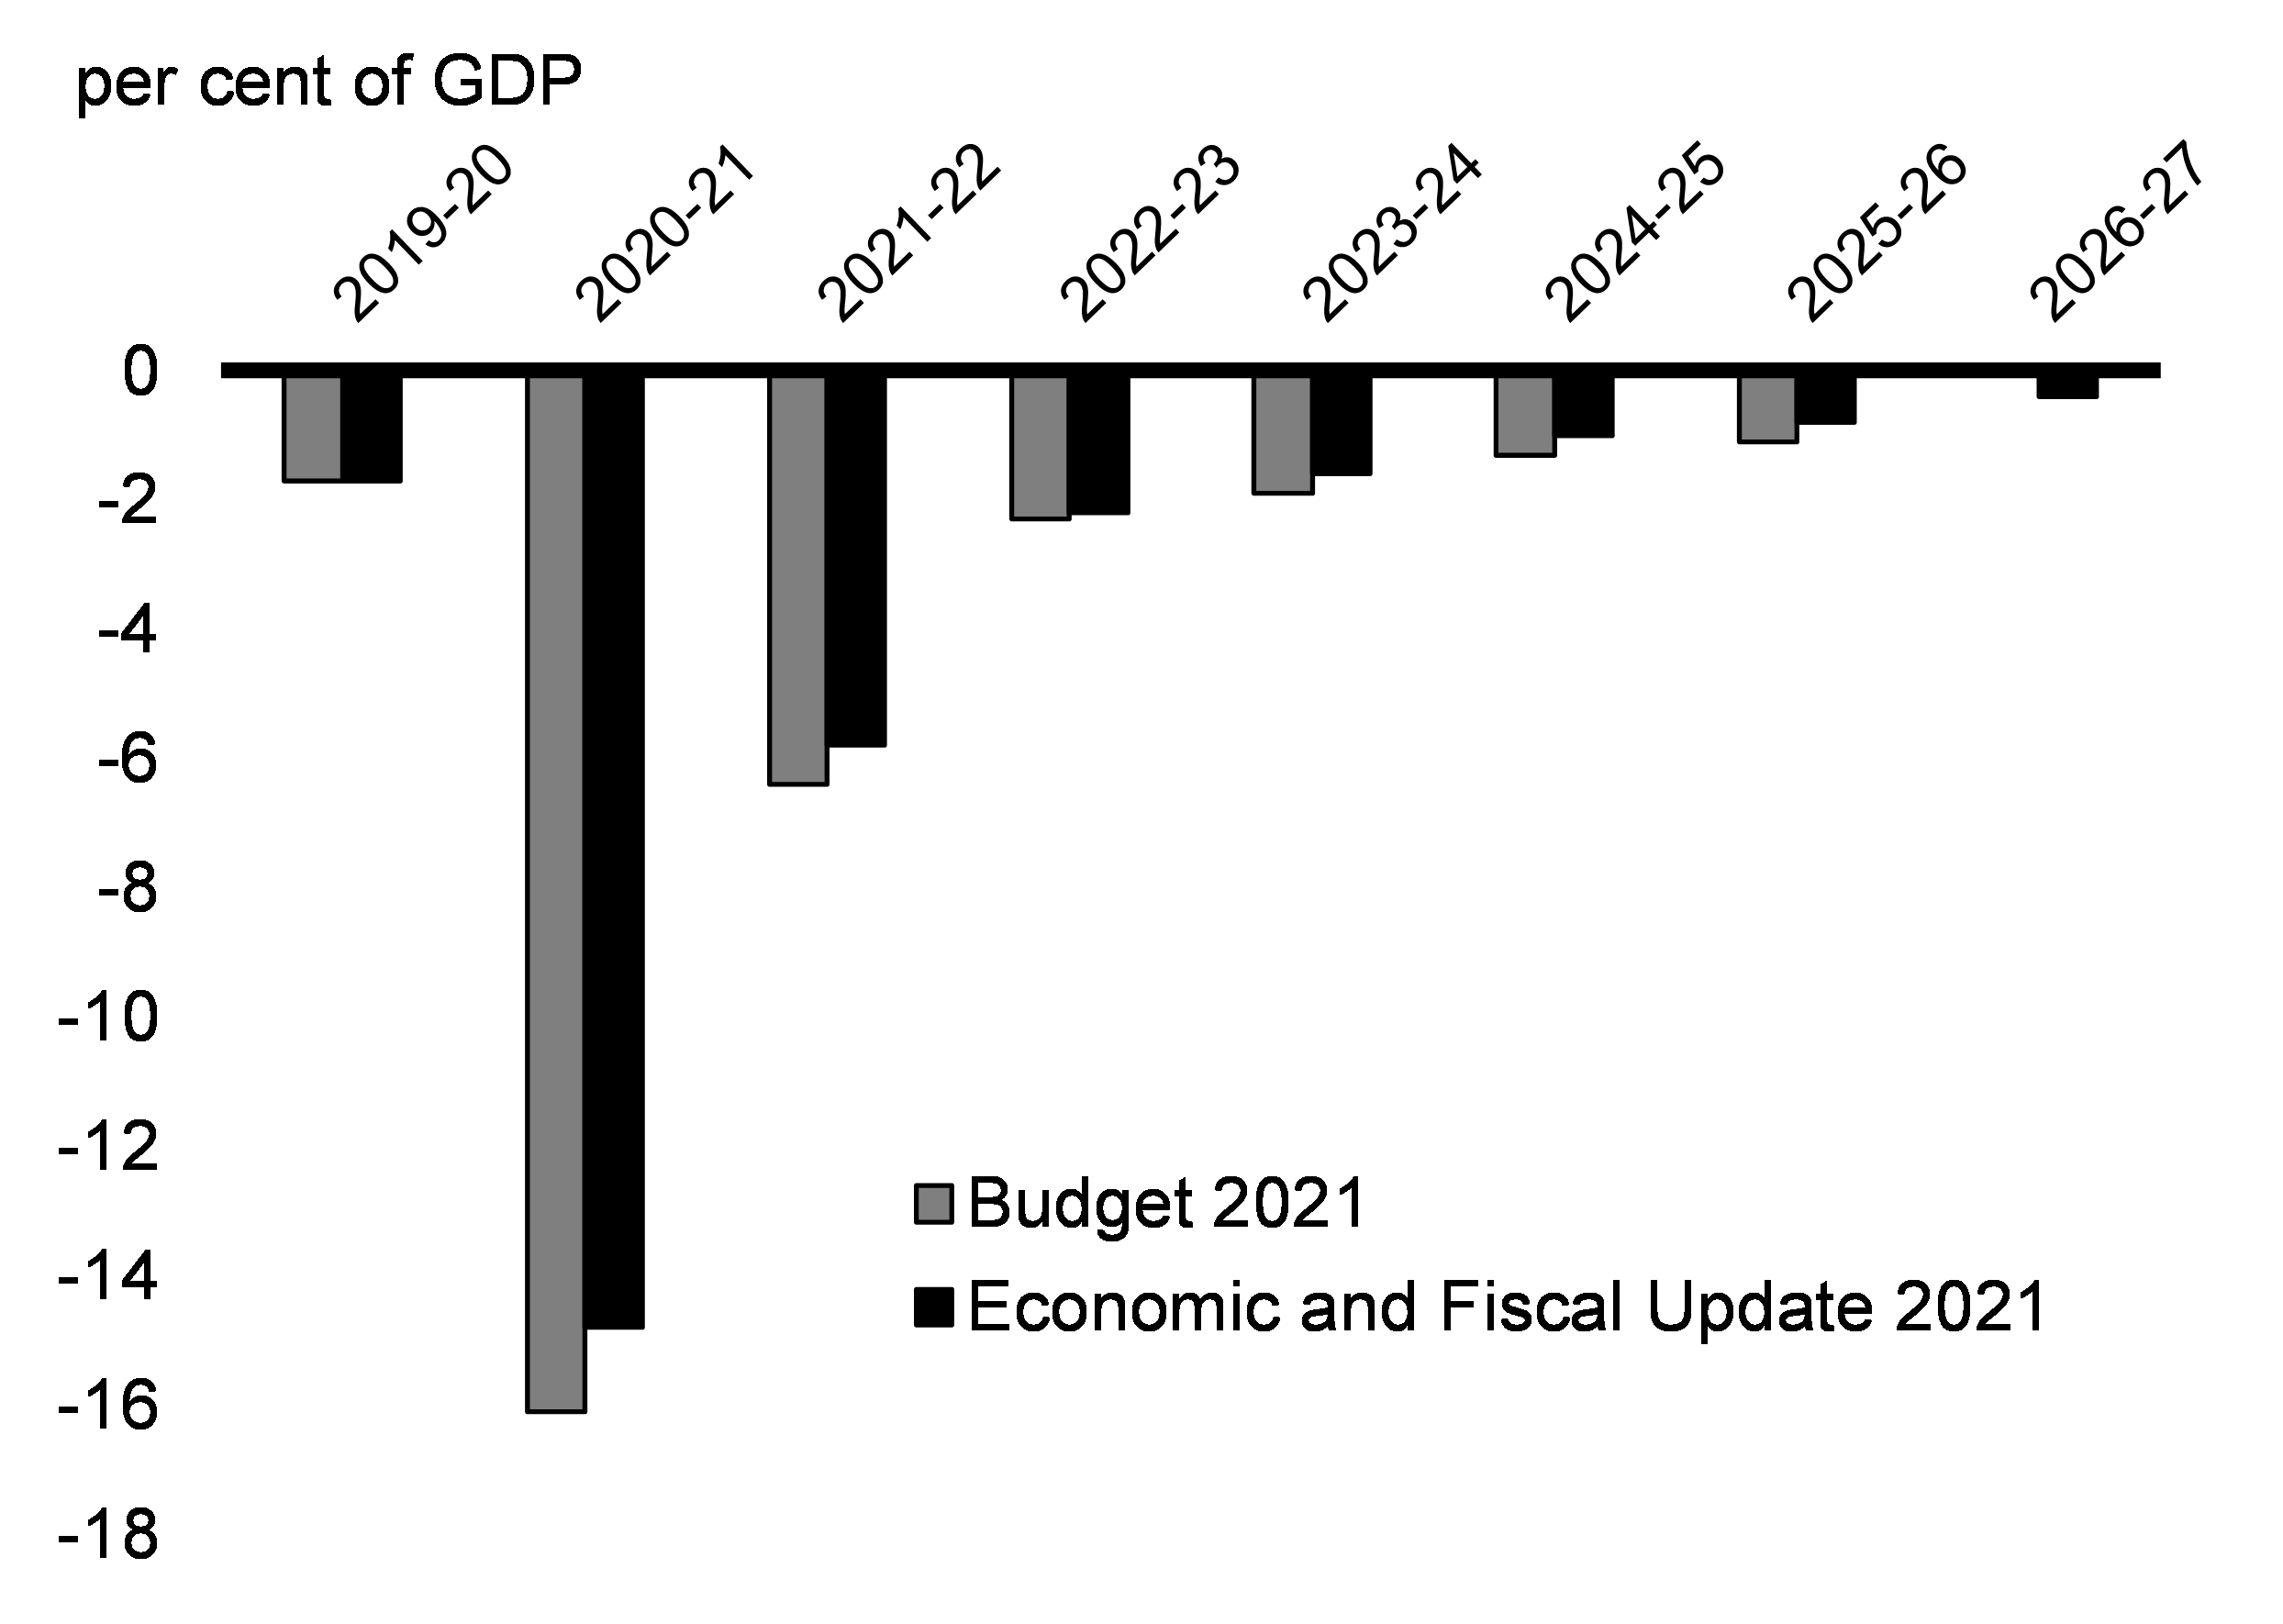
| Budgetary balance (per cent of GDP) | -14.8 | -5.8 | -2.2 | -1.6 | -1.0 | -0.8 | -0.4 |
| Federal debt (per cent of GDP) | 47.5 | 48.0 | 47.3 | 46.9 | 46.2 | 45.3 | 44.0 |
| Notes: | |||||||
| Faster Recovery Scenario | |||||||
| Budgetary balance | -327.7 | -142.0 | -52.3 | -35.1 | -22.0 | -15.9 | -6.9 |
| Federal debt (per cent of GDP) | 47.5 | 47.9 | 46.5 | 45.3 | 44.5 | 43.5 | 42.1 |
| Slower Recovery Scenario | |||||||
| Budgetary balance | -327.7 | -147.9 | -65.9 | -51.1 | -34.1 | -27.9 | -19.3 |
| Federal debt (per cent of GDP) | 47.5 | 48.2 | 48.5 | 48.5 | 47.6 | 46.9 | 45.9 |
| Budget 2021 Projections | |||||||
| Federal debt (per cent of GDP) | 49.0 | 51.2 | 50.7 | 50.6 | 50.0 | 49.2 | |
Changes in the fiscal outlook since Budget 2021 are due, in large part, to the improvement in nominal gross domestic product (GDP) described in Chapter 2 and somewhat lower-than-expected spending on pandemic-related programs. Details on changes to the fiscal outlook are outlined in Annex 1.
The fiscal outlook presented in this Economic and Fiscal Update highlights a number of important fiscal sustainability indicators, including:
- The deficit-to-GDP ratio, which measures the size of the deficit in relation to the economy, is on a path to fall to less than 1 per cent over the planning horizon (Chart 3.1), a necessary condition for maintaining fiscal sustainability.
- The federal debt-to-GDP ratio is projected to return to a downward track beginning next year (Chart 3.2).
These indicators demonstrate the government’s commitment to its fiscal anchors, outlined in Budget 2021, to reducing the federal debt as a share of the economy over the medium-term and unwinding COVID-19-related deficits.
Budgetary Balance
Federal Debt
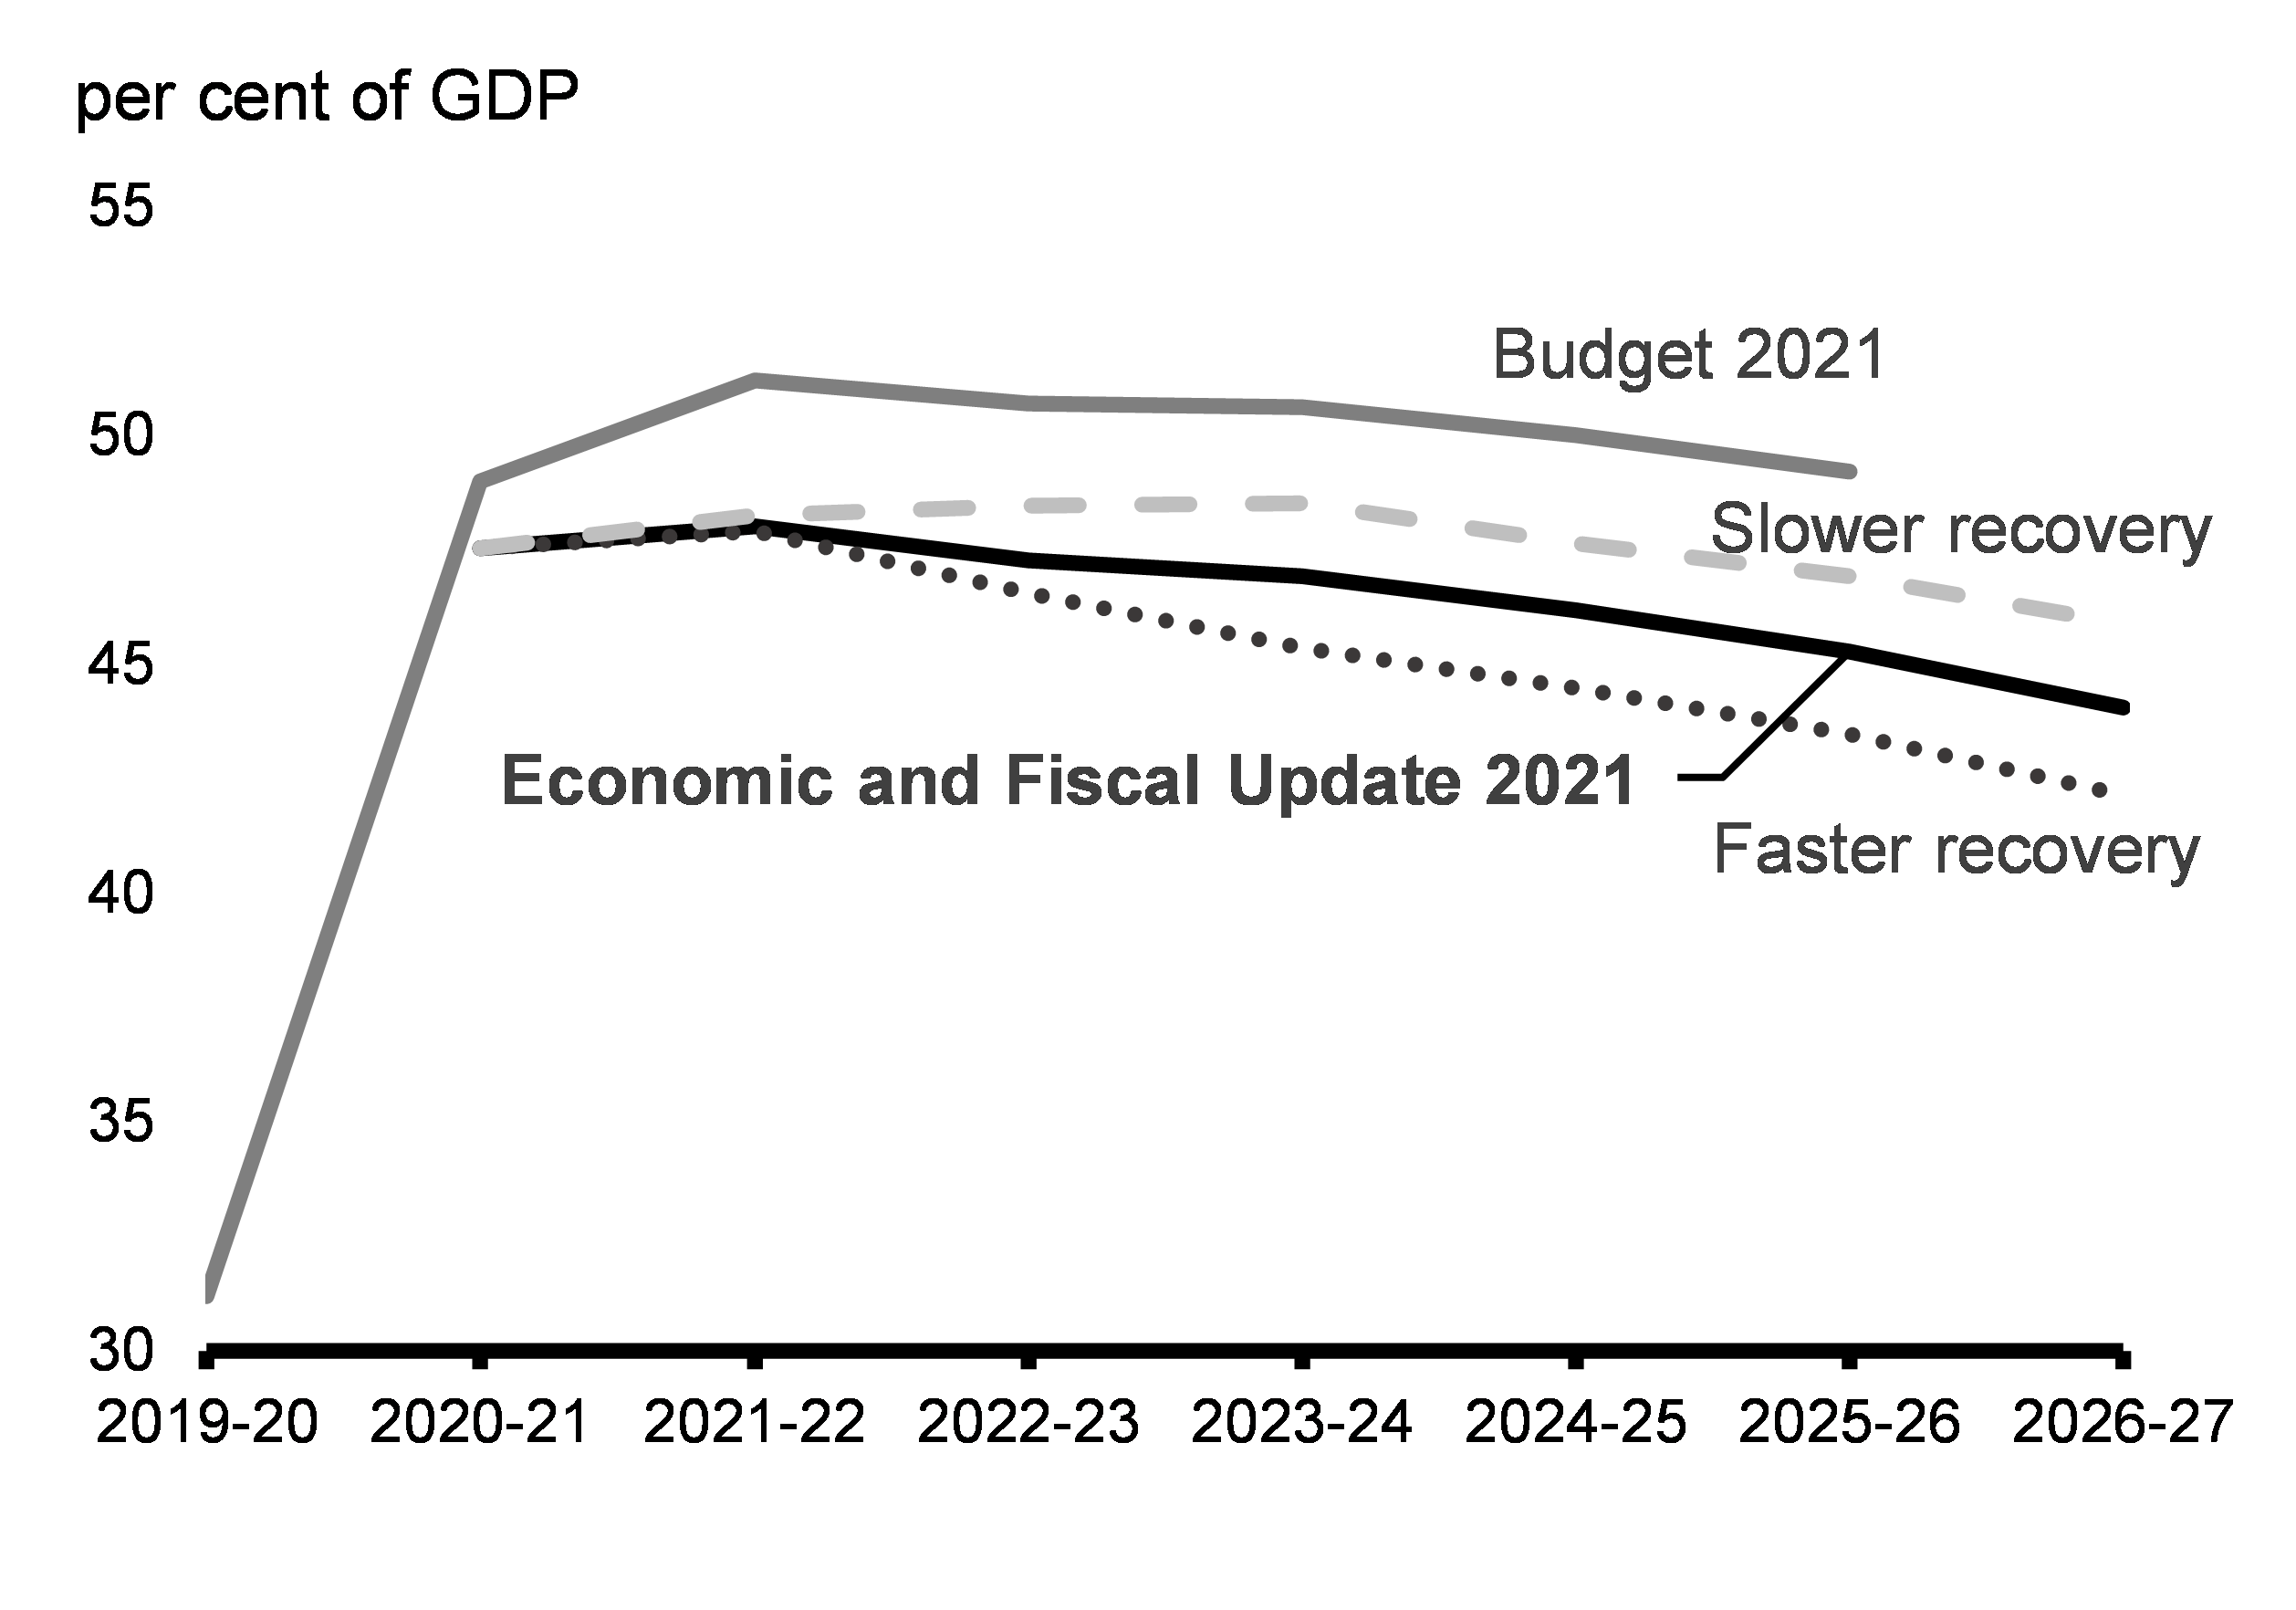
As described in Chapter 2, given ongoing uncertainty surrounding the economic outlook, namely the Omicron variant and ongoing supply shortages, the Department of Finance has considered two alternative scenarios to the projections of private sector economists, which reflect a slower recovery and a faster recovery outlook.
The slower recovery scenario would be expected to add about $6 billion to the deficit across the horizon, and increase the federal debt-to-GDP ratio 1.8 percentage points by 2026-27. In the faster recovery scenario, the deficit would be reduced by approximately $6 billion, on average across the projection, and the federal debt-to-GDP ratio would decrease 1.9 percentage points by 2026-27. The fiscal outlook under these scenarios can be seen in Table 3.1 and Chart 3.2 and the details of these scenarios can be found in Annex 1.
Budget 2022 – A Plan for Canada’s Growth
The government remains committed to unwinding COVID-19-related deficits and reducing the federal debt as a share of the economy over the medium-term. The government is also committed to making new targeted investments that will improve Canadians’ standard of living and contribute to continued economic growth and job creation, while maintaining fiscal sustainability.
The fiscal outlook presented in the 2021 Economic and Fiscal Update outlines a significant change in the budgetary balance, with a debt-to-GDP ratio about 4 percentage points lower than previously forecasted by the end of the forecast horizon. The strength of Canada’s fiscal framework will support Budget 2022 investments that will help boost long-term growth.
The government remains committed to investing in a broad range of policy areas that further Canada’s economic growth and Canadians’ quality of life, recognizing that the best economic investments drive further growth over time. A good example is the government’s Canada-wide early learning and child care plan, which could raise real GDP by as much as 1.2 per cent over the next two decades.
Keeping the federal debt-to-GDP ratio on a downward track will ensure Canada has the ability to address future challenges.
Preserving Canada’s Low Debt Advantage
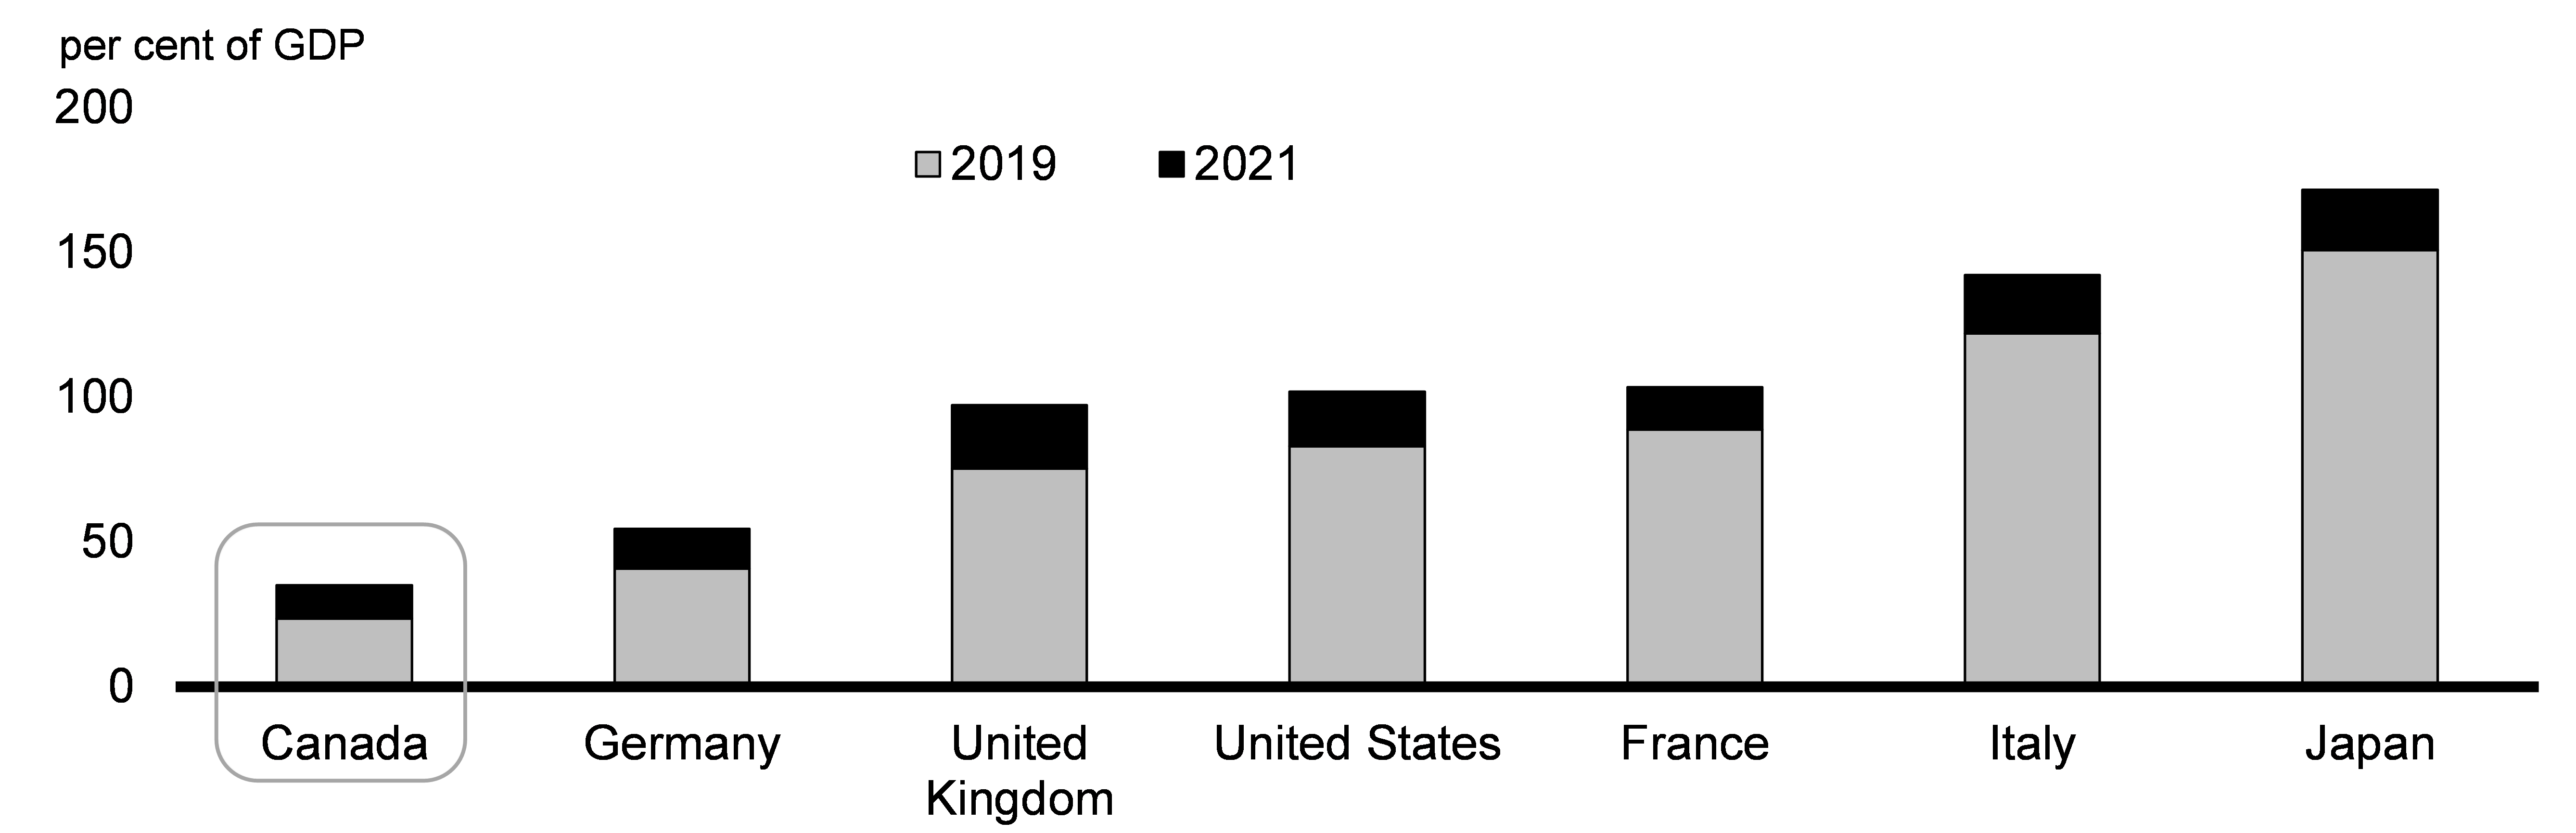
Canada’s history of prudent fiscal management means that, even with unprecedented investments to fight the virus, Canada continues to have the lowest net debt-to-GDP ratio relative to international peers. In fact, over the course of the pandemic, Canada has even increased its low debt advantage (Chart 3.3).
General Government Net Debt, G7 Countries
The strength of Canada’s recovery has contributed to maintaining excellent credit ratings from Moody’s (Aaa), S&P (AAA), DBRS (AAA), and Fitch (AA+). All four rating agencies have reaffirmed Canada’s strong credit ratings this year, with Moody’s reaffirming its rating as recently as mid-November. These ratings reflect Canada’s strong position: economic resilience and diversity, effective policymaking and political institutions, well-regulated financial markets, and monetary and fiscal flexibility.
Fiscal prudence requires acknowledging that there remains uncertainty ahead, with factors like variants of concern and the persistence of global supply chain disruptions remaining uncertain. As shown in Table 3.1 above, even in the face of a slower recovery, the government’s debt-to-GDP ratio is forecast to remain on a downward trend.
The government is committed to preserving these advantages to help ensure borrowing costs remain low and ensure Canada maintains the fiscal firepower to deal with future crises.
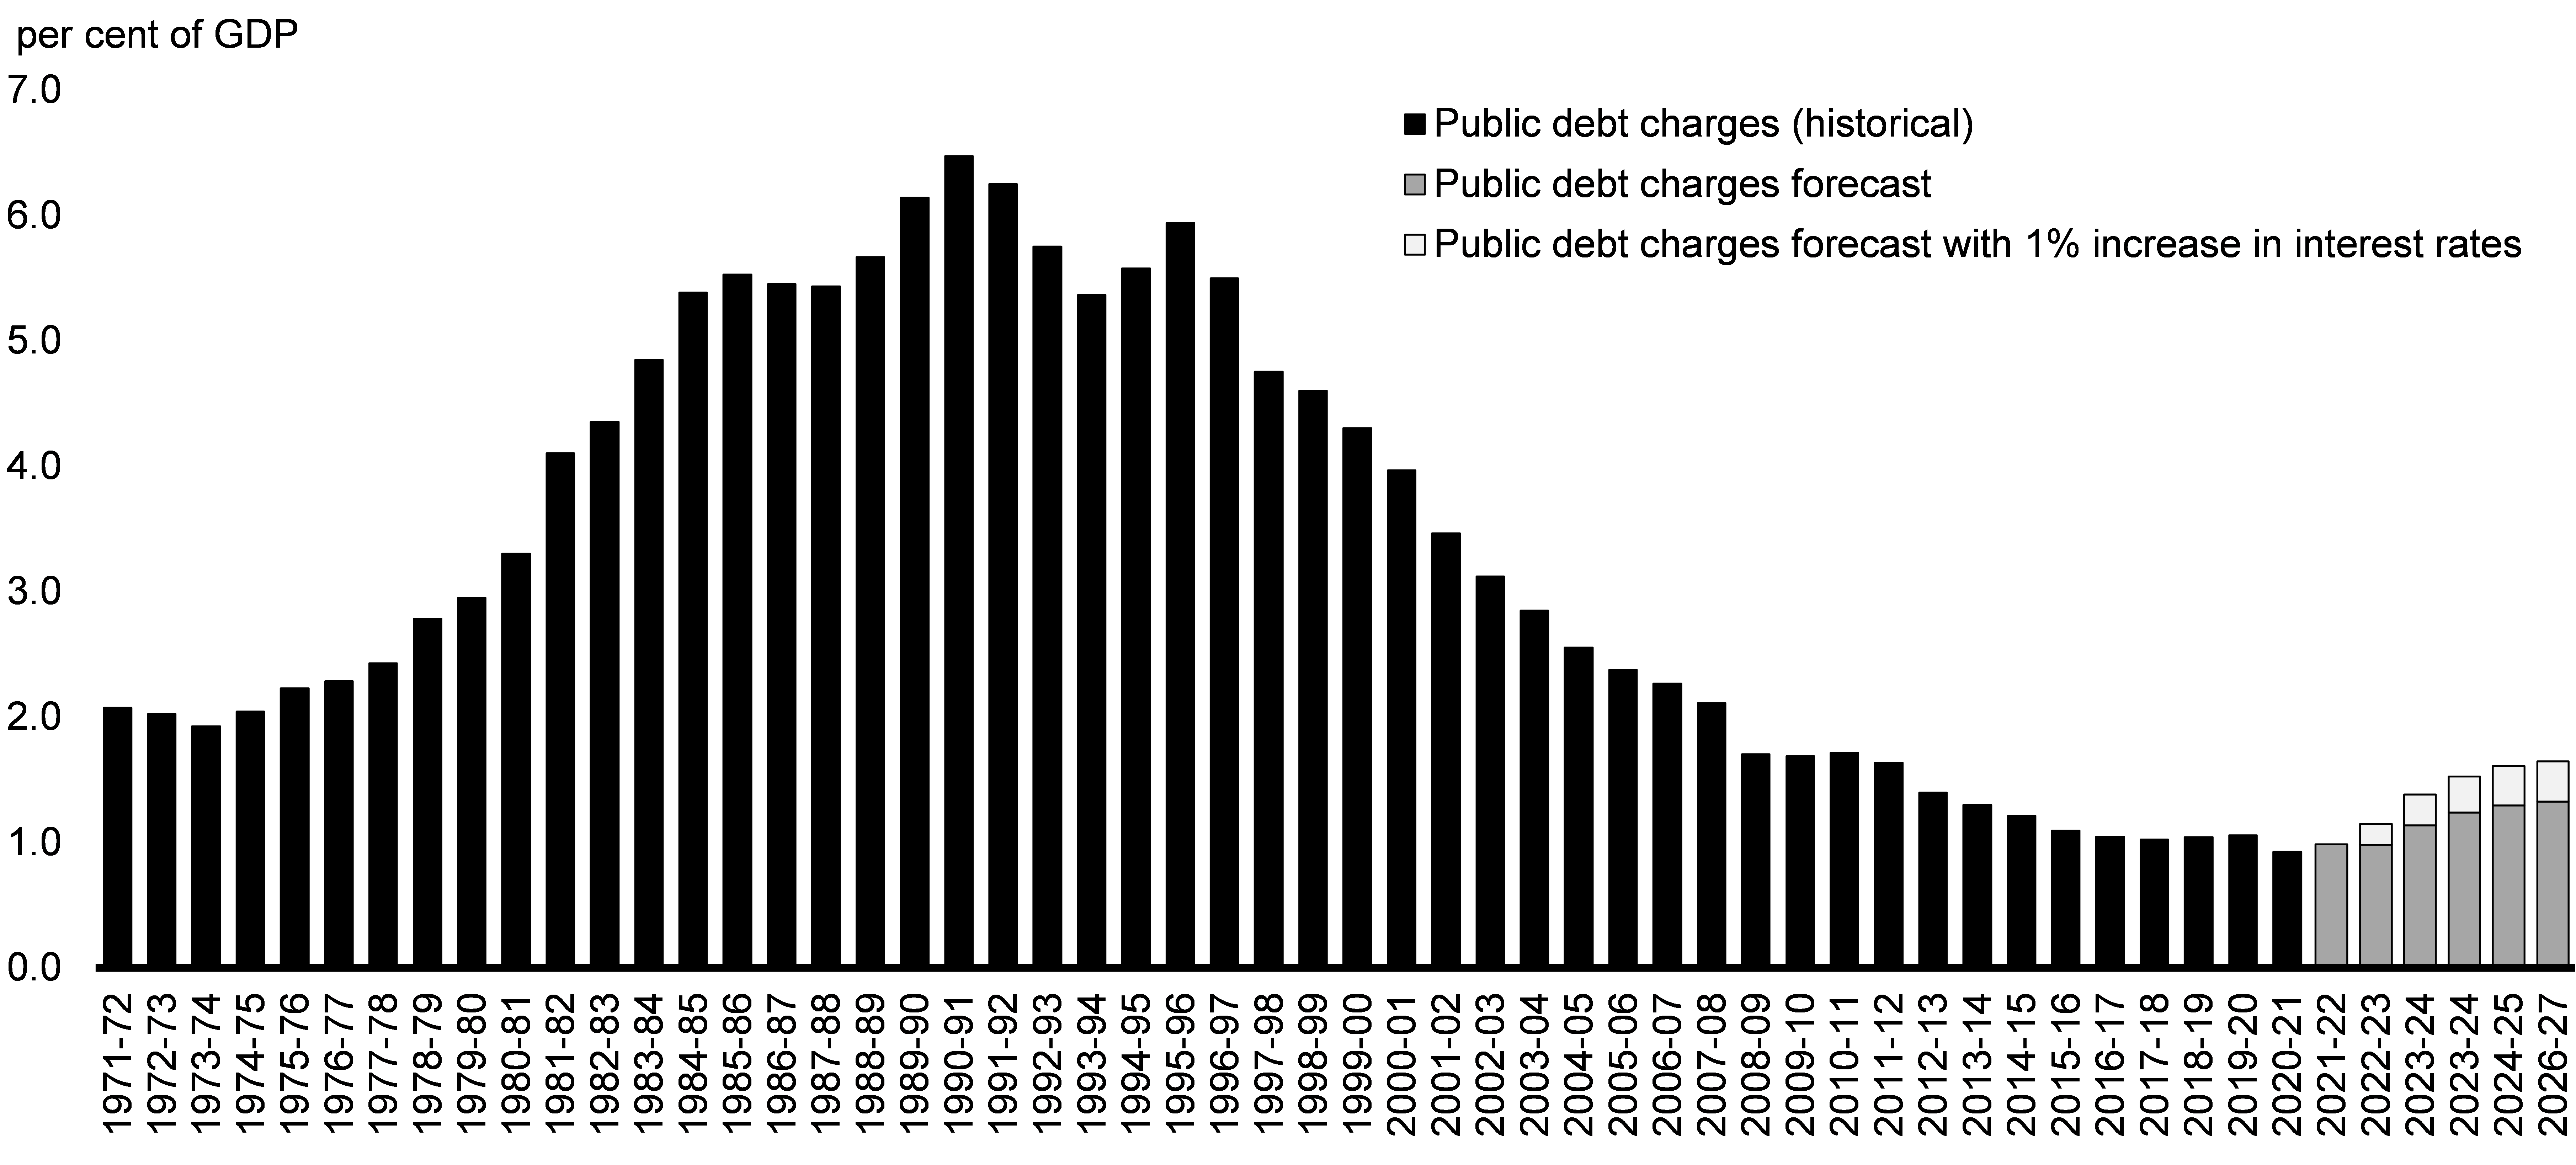
Projected Public Debt Charges
Public debt charges remain at historically low levels. By 2026-27, Canada’s public debt charges are expected to be $40.9 billion, or about 1.3 per cent of GDP. This is well below the pre-financial crisis level of 2.1 per cent in 2007-08, despite extraordinary spending due to the pandemic. This is based on an expected rise in interest rates by private sector forecasters of 190 basis points for the 3-month treasury bill rate and 150 basis points for the 10-year government bond rate over the forecast period as noted in Annex 1.
Chart 3.4 below depicts historical public debt charges and the Economic and Fiscal Update forecast as a per cent of GDP. It also includes an estimate of the sensitivity of federal public debt charges to an additional 1 per cent (100 basis point) increase to all interest rates, on top of the already forecast increase described above, which is built into the baseline forecast (i.e. a 100 basis point increase now, rising to 250 basis point increase for the 10-year government bond rate by 2026-27). Given the current forecast path for an increase in interest rates, this is a highly unlikely scenario but at least illustrative of the resilience of federal finances under such conditions.
Compared to the current forecast, public debt charges would increase $4.4 billion in the first year, $6.7 billion in the second year, and $10.0 billion in the fifth year by which time debt charges would still represent less than 1.7 per cent of GDP.
Historical Public Debt Charges as a Proportion of GDP, and Projected Sensitivity to a 1-Percentage-Point Increase in Interest Rates
With higher interest rates, the government would realize some offsetting benefits, including:
- Higher revenues from the government’s interest-bearing assets.
- Corresponding downward adjustments that reduce public sector pensions and employee benefit obligations.
- Higher government tax revenues if interest rate increases were due to stronger economic growth.
Federal Initiatives Have Supported the Economy and Provincial and Territorial Finances
Since the pandemic began, the federal government has invested $511.6 billion – nearly a quarter of Canada’s GDP – to support Canadians. The federal government took on this responsibility because, when the pandemic began, there was concern about whether provinces had the fiscal space needed to support Canadians through the crisis. The federal government invested nearly $20 billion through the Safe Restart Agreement, $2 billion through the Safe Return to School Fund, and provided $4.5 billion through top-ups to the Canada Health Transfer to support health care systems and $1 billion for vaccine rollouts as part of the response to the pandemic. The government also invested $2.2 billion to top up the Canada Community-Building Fund in 2020-21, along with other direct transfers to the provinces and territories.
Furthermore, federal income and business support measures have protected revenues, with provincial revenues higher due to federal investments to stabilize incomes, protect jobs, and prevent business closures, therefore protecting the tax base.
These significant financial contributions, combined with other federal response measures, have supported a stronger economy across Canada and directly increased provincial and territorial revenues, which, unlike federal revenues, did not go down and even slightly increased during this unprecedented global disruption.
| Federal | Provincial and Territorial |
Total | |
|---|---|---|---|
| Impact ($ billions) | |||
| Direct Measures to Fight COVID-19 and Support People | 346.0 | 86.0 | 432.0 |
| Tax and Payment Deferrals | 85.1 | 31.5 | 116.6 |
| Credit Support | 80.6 | 2.6 | 83.2 |
| Total | 511.6 | 120.1 | 631.7 |
| Share of Spending (per cent) | |||
| Direct Measures to Fight COVID-19 and Support People | 80.1 | 19.9 | 100 |
| Tax and Payment Deferrals | 73.0 | 27.0 | 100 |
| Credit Support | 96.9 | 3.1 | 100 |
| Total | 81.0 | 19.0 | 100 |
|
Notes: Provincial and territorial government announcements; Department of Finance Canada calculations. As of December 8, 2021. For federal totals, the data reflects the total impact which differs from fiscal cost on an accrual basis. Totals may not add due to rounding. |
|||
Fiscal results for 2020-21 highlighted the resilience of provincial and territorial government revenues, which increased in contrast with a decline in federal revenues (Table 3.3). This dynamic reflected substantial federal support and transfers, largely through Canada’s COVID-19 economic response, which helped put a floor under provincial-territorial government revenues, thereby limiting their deficits and debt (Chart 3.5).
Change in Total Revenues by Jurisdiction, 2020-21
per cent
| Canada | -5.3% |
|---|---|
| Newfoundland and Labrador | 2.0% |
| Prince Edward Island | 8.1% |
| Nova Scotia | 0.4% |
| New Brunswick | 4.3% |
| Quebec | 4.8% |
| Ontario | 5.6% |
| Manitoba | 1.0% |
| Saskatchewan | -2.4% |
| Alberta | -6.7% |
| British Columbia | 6.0% |
| Yukon | 11.3% |
| Northwest Territories | 17.7% |
| Nunavut | 10.6% |
| Provincial-territorial aggregate | 3.1% |
Breakdown of Total Provincial-Territorial Revenue by Source, 2019-20 and 2020-21

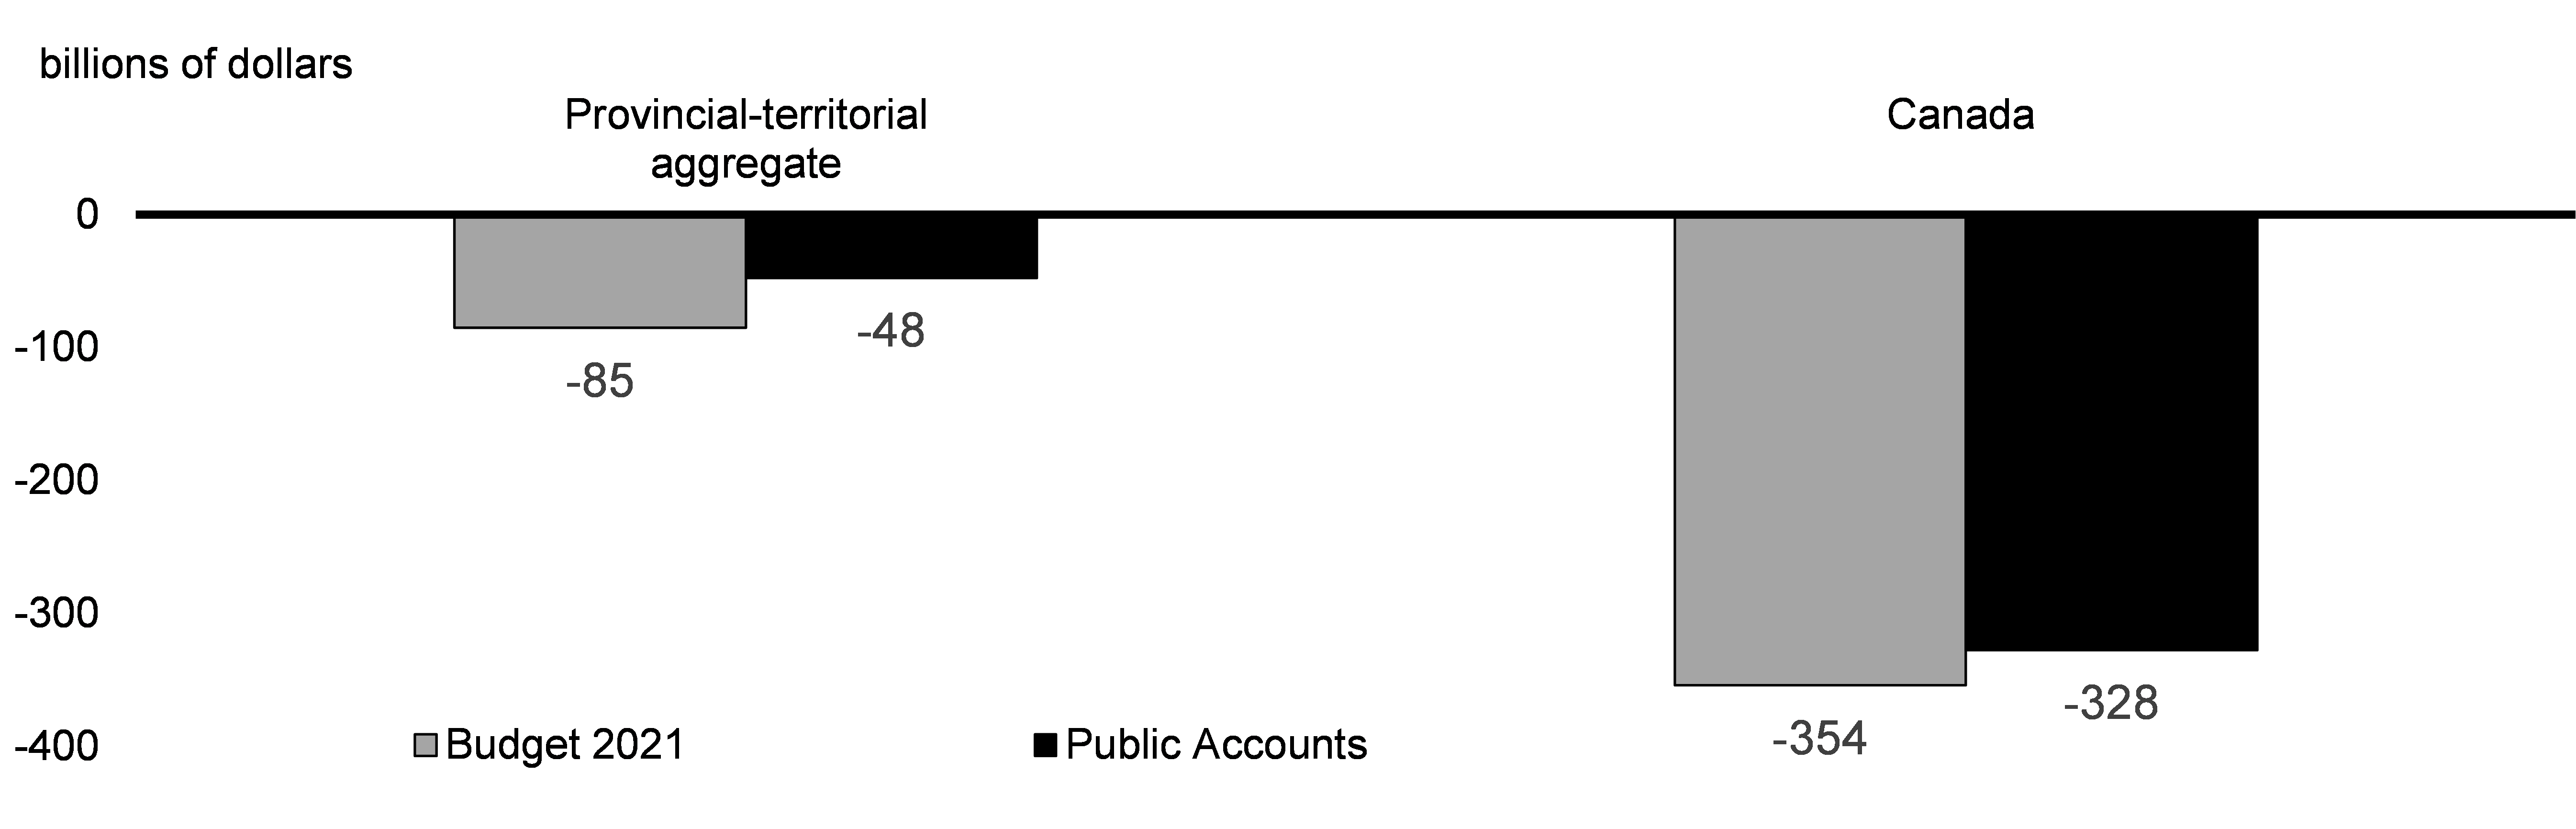
Governments significantly outperformed fiscal projections for 2020-21. Final fiscal results show that the aggregate provincial-territorial deficit was 44 per cent smaller than expected at the time of 2021 budgets, a much larger upside than at the federal level (Chart 3.6).
2020-21 Budgetary Balances
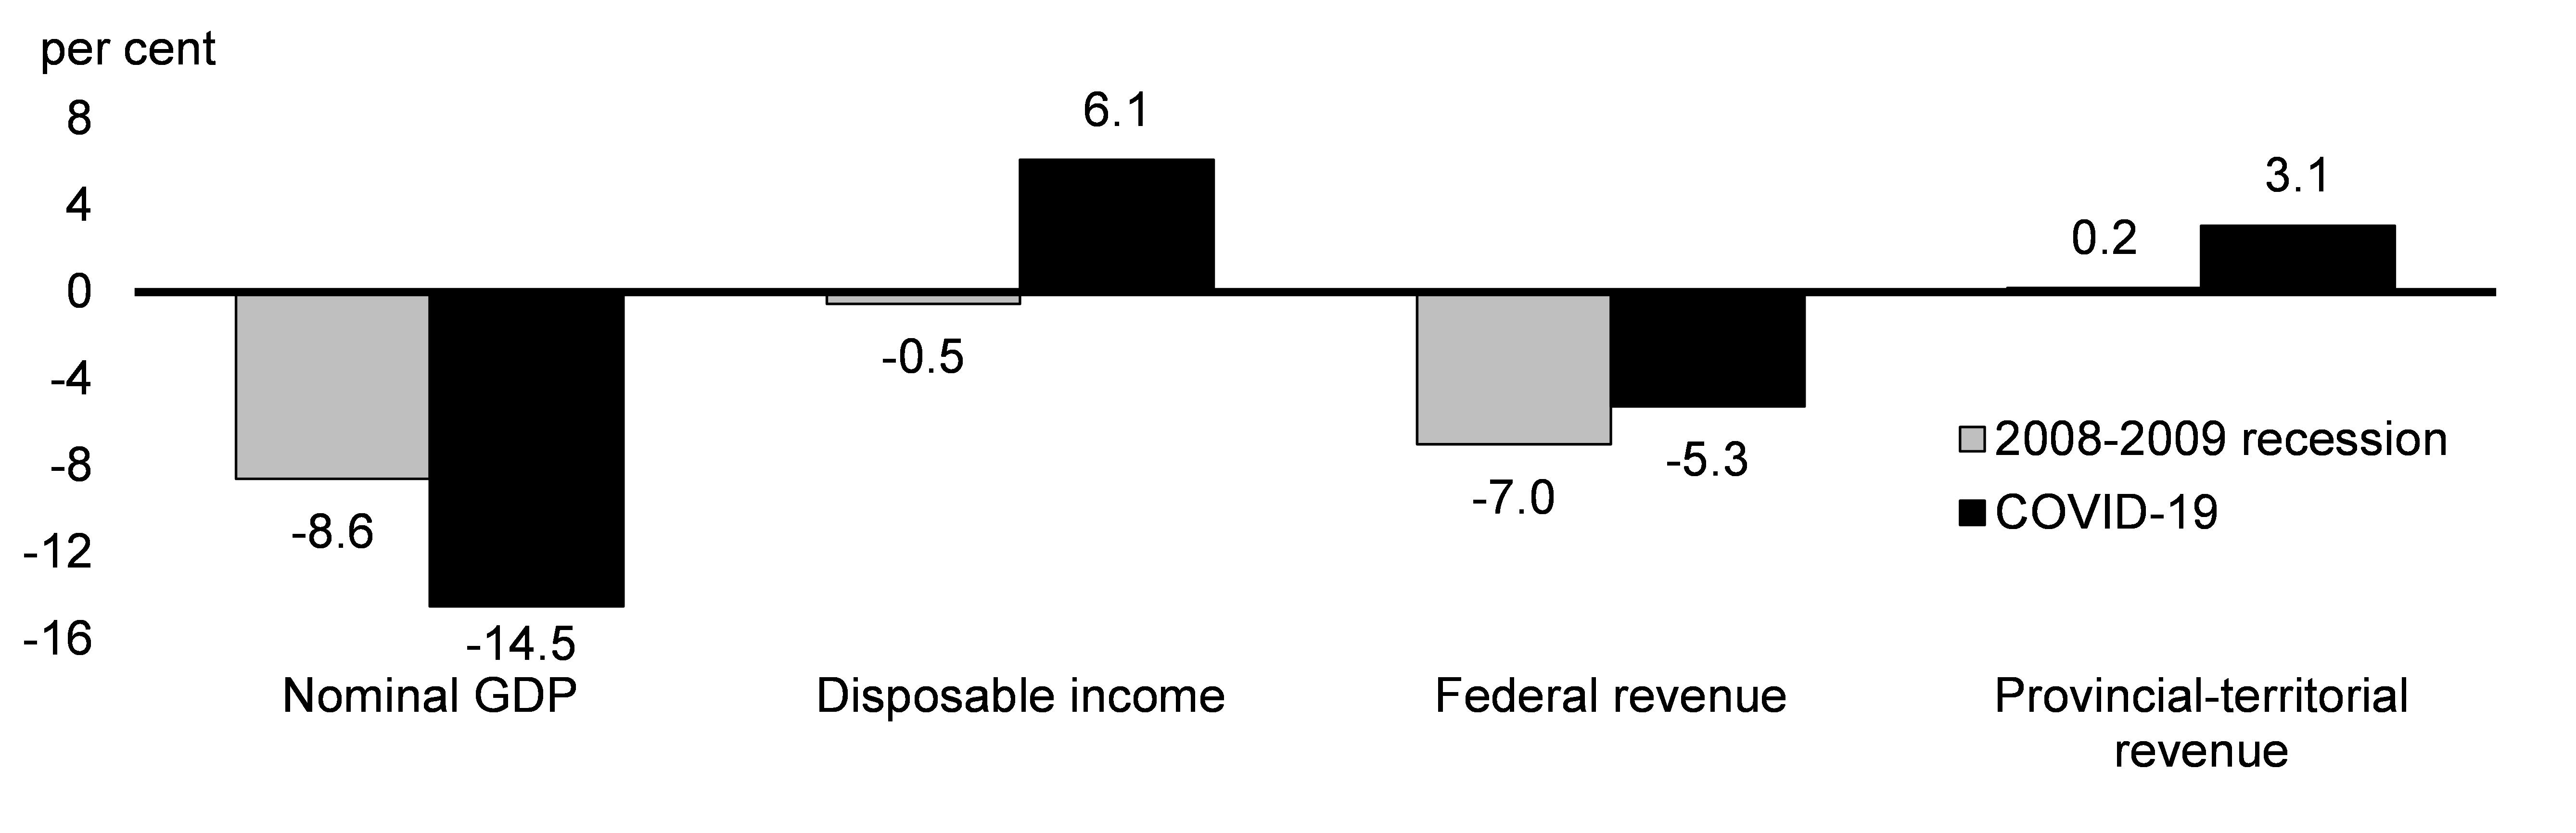
Federal support to workers, businesses, and other orders of government has been notably broad compared with the 2008-09 recession. First and foremost, the decline in nominal GDP was far steeper at the outset of the pandemic than during the 2008-09 recession. The scale of federal government support to Canadians was able to preserve household disposable income and this has fostered a much faster economic recovery than what followed the 2008-09 recession. This, along with the significant direct transfers to other orders of government, has helped bolster the balance sheets of provincial and territorial governments (Chart 3.7).
Evolution of GDP and Government Revenue, 2008-09 Recession Compared to COVID-19 Crisis
Update on Proposed Tax Measures
Underused Housing Tax
Budget 2021 announced the government’s intention to implement a national, annual 1-per-cent tax on the value of non-resident, non-Canadian owned residential real estate in Canada that is considered to be vacant or underused. It is proposed that the tax be effective for the 2022 calendar year.
Digital Services Tax
The government is committed to ensuring that corporations in all sectors, including digital corporations, pay their fair share of tax on the money they earn by doing business in Canada. Canada’s priority and preference has always been a multilateral agreement. As an interim measure, Budget 2021 proposed to implement a Digital Services Tax (DST). The DST would apply at a rate of 3 per cent on revenue earned by large businesses from certain digital services that rely on data and content contributions from Canadian users.
Since that time, 137 members of the OECD/G20 Inclusive Framework have agreed to a two-pillar plan for international tax reform, which was subsequently endorsed by G20 Finance Ministers and Leaders. Canada is working with its international partners to bring the multilateral agreement into effect.
Meanwhile, to ensure that Canadians' interests are protected, the government announced on October 8, 2021, that it would move ahead with legislation to enact the DST. The DST would be imposed as of January 1, 2024, but only if the treaty implementing the new multilateral tax regime has not come into force by that time. In that event, the DST would be payable as of 2024 in respect of revenues earned as of January 1, 2022. It is the government’s sincere hope that the timely implementation of the new international system will make this unnecessary. The government continues to work with its international partners to achieve the timely implementation of the new international system.
Luxury Tax
Budget 2021 proposed to introduce a tax on the sales, for personal use, of luxury cars and personal aircraft with a retail sales price over $100,000, and boats, for personal use, over $250,000. The tax would be calculated at the lesser of 20 per cent of the value above the threshold ($100,000 for cars and personal aircraft, $250,000 for boats) or 10 per cent of the full value of the luxury car, boat, or personal aircraft. The Department of Finance has undertaken consultations with respect to the design of this measure and is working to incorporate the results of this consultation into the proposed tax framework. Draft legislation, including details on coming-into-force, will be released in early 2022.
Tax Incentive for Carbon Capture, Utilization, and Storage
Budget 2021 proposed an investment tax credit for capital invested in carbon capture, utilization, and storage (CCUS) projects with the goal of substantially reducing emissions. The new investment tax credit would be available for a broad range of CCUS applications across different industrial subsectors (e.g. concrete, plastics, fertilizers, fuels), including blue hydrogen projects and direct air capture projects but not enhanced oil recovery projects. The government will consider how equivalent tax support can be provided to producers of green hydrogen. The government has engaged in consultations with stakeholders from industrial subsectors, provincial and territorial governments, as well as other interested parties or members of the public, to provide input on the design of the investment tax credit for CCUS. The government will outline the final design of the proposed investment tax credit in Budget 2022.
Report a problem on this page
- Date modified: