
Archived - Annex 1
Details of Economic and Fiscal Projections
On this page:
Economic Projections
The average of private sector forecasts has been used as the basis for economic and fiscal planning since 1994. This helps ensure objectivity and transparency, and introduces an element of independence into the government’s economic and fiscal forecast. The economic forecast presented in this section is based on a survey conducted in early November 2021. The survey average has been adjusted to incorporate the actual results of the National Accounts for the third quarter of 2021 and the historical revisions released on November 30th.
The November survey includes the views of 12 private sector economists:
- BMO Capital Markets,
- Caisse de dépôt et placement du Québec,
- CIBC World Markets,
- The Conference Board of Canada,
- Desjardins,
- Industrial Alliance Insurance and Financial Services Inc.,
- Laurentian Bank Securities,
- National Bank Financial Markets,
- Royal Bank of Canada,
- Scotiabank,
- TD Bank Financial Group, and
- The University of Toronto (Policy and Economic Analysis Program).
Private sector economists expect real gross domestic product (GDP) growth at 4.6 per cent in 2021, revised down from 5.8 per cent in Budget 2021, reflecting lower-than-expected results in the second quarter and lower than initially expected growth in the second half of this year, mainly resulting from global supply chain disruptions. The outlook for real GDP growth has been revised up slightly for 2022, from 4 per cent in Budget 2021 to 4.2 per cent, and more significantly for 2023, to 2.8 per cent from 2.1 per cent in Budget 2021. Real GDP growth is expected to moderate to about 2 per cent on average per year over the remaining years of the forecast horizon, reflecting a return to trend long-run growth rates.
The unemployment rate is expected to average 7.5 per cent in 2021 and 6.1 per cent in 2022, a faster projected decline than in Budget 2021. The unemployment rate is expected to stand around 5.7 per cent over the remaining years of the forecast horizon, which is low by historical standards and close to where Canada’s unemployment rate was prior to the pandemic.
Private sector economists expect the recent price pressures to continue for some time. Consistent with global trends, the outlook for Consumer Price Index (CPI) inflation has been revised significantly up to 3.3 per cent in 2021 and 3.1 per cent in 2022, compared to, respectively, 2.2 per cent and 2.0 per cent in Budget 2021. The pandemic and related inflation pressures are global trends that owe price pressures to global factors like supply chain disruptions, shipping bottlenecks, and global demand having shifted significantly towards durable goods during the pandemic. CPI inflation is then expected to gradually normalize to around 2 per cent over the remainder of the forecast horizon, which is consistent with the average rate of inflation in Canada over the last 30 years.
Reflecting recent strength in commodity prices, the outlook for West Texas Intermediate crude oil prices has been revised up to US$68 per barrel for 2021 and to US$73 per barrel for 2022, about US$10 per barrel higher on average than in the Budget 2021 projection. Going forward, crude oil prices are expected to remain higher than Budget 2021 by about US$6 per barrel on average per year.
As a result of both domestic inflation and crude oil prices, the outlook for GDP inflation (the broadest measure of economy-wide price inflation) in 2021 is now more than double the Budget 2021 projection (7.6 per cent compared to 3.5 per cent). Going forward, the GDP inflation outlook has been revised down by 0.1 percentage points on average per year compared to Budget 2021.
As a result of these developments, the level of nominal GDP for 2021 (the broadest measure of the tax base) is expected to be $66 billion higher than projected in Budget 2021. The nominal GDP level difference with Budget 2021 is expected to average about $87 billion per year over the 2021-2025 period.
In fact, nominal GDP for 2021 is now at the level originally forecast it would be, at this time, in Budget 2018 ($2,481 billion) and the 2019 Economic and Fiscal Update ($2,479 billion) that was tabled in December 2019, prior to the onset of the COVID-19 pandemic. That this occurred despite the worst economic crisis in nearly 100 years is thanks in part to significant efforts to stabilize incomes throughout the pandemic, which has positioned Canada to recover jobs and economic output faster than expected early in the crisis.
The outlook for short- and long-term interest rates as estimated by private sector economists has been revised up in the November 2021 survey by, respectively, 40 and 10 basis points over the 2021-2025 period compared to the Budget 2021 forecast.
| 2021 | 2022 | 2023 | 2024 | 2025 | 2026 | 2021-2025 | |
|---|---|---|---|---|---|---|---|
| Real GDP growth1 | |||||||
| Budget 2021 | 5.8 | 4.0 | 2.1 | 1.9 | 1.8 | --- | 3.1 |
| Economic and Fiscal Update 2021 | 4.6 | 4.2 | 2.8 | 2.0 | 1.8 | 1.8 | 3.1 |
| GDP inflation1 | |||||||
| Budget 2021 | 3.5 | 2.0 | 2.0 | 2.1 | 2.0 | --- | 2.3 |
| Economic and Fiscal Update 2021 | 7.6 | 2.2 | 1.5 | 1.9 | 1.9 | 1.9 | 3.0 |
| Nominal GDP growth1 | |||||||
| Budget 2021 | 9.5 | 6.0 | 4.0 | 4.0 | 3.8 | --- | 3.3 |
| Economic and Fiscal Update 2021 | 12.5 | 6.6 | 4.3 | 3.9 | 3.7 | 3.8 | 6.2 |
| Nominal GDP level (billions of dollars)1 | |||||||
| Budget 2021 | 2,416 | 2,561 | 2,665 | 2,771 | 2,877 | --- | |
| Economic and Fiscal Update 2021 | 2,482 | 2,644 | 2,758 | 2,866 | 2,973 | 3,086 | |
Difference between Budget 2021 and Economic and Fiscal Update 2021 |
66 | 83 | 94 | 95 | 96 | --- | 87 |
| 3-month treasury bill rate | |||||||
| Budget 2021 | 0.1 | 0.2 | 0.5 | 1.1 | 1.6 | --- | 0.7 |
| Economic and Fiscal Update 2021 | 0.1 | 0.5 | 1.2 | 1.6 | 1.9 | 2.0 | 1.1 |
| 10-year government bond rate | |||||||
| Budget 2021 | 1.5 | 1.8 | 2.1 | 2.5 | 2.7 | --- | 2.1 |
| Economic and Fiscal Update 2021 | 1.4 | 1.9 | 2.3 | 2.5 | 2.7 | 2.9 | 2.2 |
| Exchange rate (US cents/C$) | |||||||
| Budget 2021 | 79.4 | 79.8 | 80.8 | 81.0 | 81.0 | --- | 80.4 |
| Economic and Fiscal Update 2021 | 80.0 | 80.6 | 80.7 | 80.4 | 80.4 | 80.6 | 80.4 |
| Unemployment rate1 | |||||||
| Budget 2021 | 8.0 | 6.5 | 6.2 | 6.0 | 5.9 | --- | 6.5 |
| Economic and Fiscal Update 2021 | 7.6 | 6.1 | 5.7 | 5.7 | 5.6 | 5.7 | 6.1 |
| Consumer Price Index inflation | |||||||
| Budget 2021 | 2.2 | 2.0 | 2.1 | 2.1 | 2.1 | --- | 2.1 |
| Economic and Fiscal Update 2021 | 3.3 | 3.1 | 2.3 | 2.1 | 2.1 | 2.0 | 2.6 |
| U.S. real GDP growth | |||||||
| Budget 2021 | 4.2 | 3.4 | 2.4 | 2.1 | 2.0 | --- | 2.8 |
| Economic and Fiscal Update 2021 | 5.6 | 3.9 | 2.6 | 1.9 | 1.8 | 1.8 | 3.1 |
| West Texas Intermediate crude oil price ($US per barrel) | |||||||
| Budget 2021 | 60 | 61 | 60 | 60 | 60 | --- | 60 |
| Economic and Fiscal Update 2021 | 68 | 73 | 68 | 66 | 65 | 63 | 68 |
|
Note: Forecast averages may not equal average of years due to rounding. Numbers may not add due to rounding. 1 Figures have been restated to reflect the historical revisions in the Canadian System of National Accounts. Sources: Statistics Canada; for Budget 2021, Department of Finance Canada March 2021 survey of private sector economists; for Economic and Fiscal Update 2021, Department of Finance Canada November 2021 survey of private sector economists, which has been adjusted to incorporate the actual results of the National Accounts for the third quarter of 2021 and the historical revisions released on November 30th. |
|||||||
Fiscal Projections
The fiscal outlook presented in this Economic and Fiscal Updateis forecasted based on the economic projections presented earlier. The tables that follow present changes to the fiscal outlook from Budget 2021 for the budgetary balance and by revenue stream and major expense component. These changes include the impact of government policy actions taken since Budget 2021, an improved economic outlook, and stronger-than-expected results in 2020-21.
Changes to the Fiscal Outlook since Budget 2021
| Projection | ||||||||
|---|---|---|---|---|---|---|---|---|
| 2020- 2021 |
2021- 2022 |
2022- 2023 |
2023- 2024 |
2024- 2025 |
2025- 2026 |
2026-2027 | ||
| Budgetary balance – Budget 2021 | -354.2 | -154.7 | -59.7 | -51.0 | -35.8 | -30.7 | ||
| Economic and fiscal developments (Table A1.3) | 36.0 | 38.5 | 14.1 | 14.5 | 11.2 | 12.6 | ||
| Budgetary balance before policy actions and investments | -318.1 | -116.2 | -45.6 | -36.6 | -24.6 | -18.1 | -9.3 | |
| Policy Actions since Budget 2021, and in this Economic and Fiscal Update | ||||||||
| Protecting Our Recovery by Finishing the Fight Against COVID-19 | -13.0 | -7.8 | -3.3 | -0.8 | -0.7 | -0.7 | ||
| Other Policy Actions (Table A1.12) | -1.8 | -3.0 | -2.0 | -1.6 | -1.7 | -0.8 | ||
| Provisions for potential costs of: | ||||||||
Omicron variant response |
-4.5 | |||||||
Recovering from natural disasters in British Columbia |
-5.0 | |||||||
| Addressing past harms and discrimination related to First Nation child welfare | -16.0 | -4.0 | -3.7 | -3.9 | -4.0 | -4.1 | -4.2 | |
Less: Funds previously provisioned in the fiscal framework |
6.4 | 0.0 | 1.8 | 1.8 | 1.9 | 1.9 | 1.9 | |
| Net fiscal impact | -9.6 | -4.0 | -1.9 | -2.1 | -2.1 | -2.2 | -2.3 | |
| Total – Actions since Budget 2021 | -9.6 | -28.4 | -12.8 | -7.4 | -4.6 | -4.6 | -3.8 | |
| Budgetary balance | -327.7 | -144.5 | -58.4 | -43.9 | -29.1 | -22.7 | -13.1 | |
Budgetary balance (per cent of GDP) |
-14.8 | -5.8 | -2.2 | -1.6 | -1.0 | -0.8 | -0.4 | |
Federal debt (per cent of GDP) |
47.5 | 48.0 | 47.3 | 46.9 | 46.2 | 45.3 | 44.0 | |
| Budget 2021 Projections Federal debt (per cent of GDP) |
49.0 | 51.2 | 50.7 | 50.6 | 50.0 | 49.2 | ||
Economic and Fiscal Developments since Budget 2021
| Projection | ||||||
|---|---|---|---|---|---|---|
| 2020- 2021 |
2021-2022 | 2022-2023 | 2023-2024 | 2024-2025 | 2025-2026 | |
| Economic and fiscal developments by component1: | ||||||
| Change in budgetary revenues | ||||||
(1.1) Income taxes |
14.1 | 13.3 | 12.7 | 12.4 | 11.5 | 12.3 |
(1.2) Excise taxes/duties |
2.9 | 1.5 | 2.5 | 2.7 | 2.7 | 2.7 |
(1.3) Proceeds from the pollution pricing framework |
-0.1 | 0.2 | 0.1 | 2.2 | 4.3 | 6.4 |
(1.4) Employment Insurance premiums |
0.2 | 0.5 | 0.8 | 0.9 | 0.9 | 0.9 |
(1.5) Other revenues2 |
3.2 | 0.1 | -2.0 | -0.6 | -1.5 | -1.0 |
| (1) Total budgetary revenues | 20.3 | 15.6 | 14.2 | 17.6 | 17.9 | 21.2 |
| Change in program expenses | ||||||
(2.1) Major transfers to persons |
3.5 | 3.4 | -3.2 | 0.1 | -0.2 | -0.4 |
(2.2) Major transfers to other levels of government |
0.1 | 4.6 | -0.5 | -1.5 | -1.8 | -1.9 |
(2.3) Direct program expenses |
12.1 | 15.5 | 2.9 | -2.6 | -6.1 | -9.0 |
(2.3.1) Of which, Proceeds from the pollution pricing framework returned |
0.2 | 0.0 | 0.0 | -2.5 | -4.4 | -6.4 |
| (2) Total program expenses, excluding net actuarial losses | 15.6 | 23.5 | -0.8 | -4.0 | -8.1 | -11.3 |
| (3) Net actuarial losses | 0.1 | 1.9 | 1.0 | 1.7 | 1.5 | 1.9 |
| (4) Public debt charges | 0.0 | -2.4 | -0.3 | -0.9 | -0.2 | 0.7 |
| (5) Total economic and fiscal developments | 36.0 | 38.5 | 14.1 | 14.5 | 11.2 | 12.6 |
|
1 A negative number implies a deterioration in the budgetary balance (lower revenues or higher expenses). A positive number implies an improvement in the budgetary balance (higher revenues or lower expenses). 2 Includes changes to other revenues, and to revenues from other taxes. |
||||||
Budgetary revenues have been revised up relative to Budget 2021.
- Driven by an improvement in the outlook for the labour market, personal income and corporate profitability, income tax revenues are projected to be higher by roughly $12 billion per year on average over the forecast horizon.
- Excise taxes and import duty revenues have been revised up in large part due to stronger Goods and Services Tax revenue growth, reflecting strong recent results and a better outlook for taxable consumption.
- Proceeds from the federal pollution pricing framework that arise from the provinces and territories that are a part of the federal backstop are projected to be higher largely due to the incorporation of the new carbon pricing profile that will take effect starting 2023-24.Footnote 1 Direct proceeds will continue to be fully returned in the provinces or territories where they are generated.
- Employment Insurance (EI) premium revenues have been revised up due to better-than-expected labour force participation and an improved outlook for economy-wide wage growth.
- Other revenues, such as those resulting from sales of goods and services, investments and loans, interest and penalties, and Crown corporations’ net profits, largely reflect lower expected Bank of Canada profits.
Program expenses, particularly major transfers to other levels of government and direct program expenses, are projected to be significantly lower in 2021-22 relative to Budget 2021, largely reflecting the improved economic outlook, which has helped to lower the projected cost of early pandemic response supports.
- Over the remainder of the forecast horizon, adjustments to major transfers to persons reflect the impact of higher expected inflation, to which the Canada Child Benefit and elderly benefit rates are indexed, which is offset somewhat by lower expected usage of Canada Child Benefits due to higher projected income growth. EI benefits are higher in 2022-23, due to a higher anticipated usage of temporary COVID EI measures, but are largely unchanged over the remainder of the forecast horizon.
- Relative to Budget 2021, major transfers to other levels of government are projected to be lower in 2021-22, largely reflecting the impact of stronger-than-expected provincial government revenue outlooks on potential Fiscal Stabilization payments. In the outer years of the forecast, expenses have been revised upwards as a result of the stronger economic outlook, as the Canada Health Transfer and Equalization payments are indexed to growth in nominal GDP, meaning provinces and territories will directly benefit from the pace of recovery.
- Direct program expenses have been adjusted downward in 2021-22 and 2022-23, largely due to re-estimation of early pandemic response supports. Over the horizon, direct program expenses are revised upward due mainly to an updated carbon pricing profile, which results in increased revenues, as discussed earlier, that are then returned to the jurisdiction of origin through transfer programs. Additionally, higher anticipated departmental spending, and pensions and benefits service costs contribute to the increase over Budget 2021.
Net actuarial losses, which represent changes in the measurement of the government’s obligations for pensions and other employee future benefits accrued in previous fiscal years, are expected to be lower relative to Budget 2021, reflecting upward revisions to projected long-term interest rates used to measure the present value of the obligations.
Public debt charges have increased in 2021-22 due to the impacts of higher inflation on Real Return Bonds. Over the remainder of the forecast, public debt charges are slightly higher due to higher expected interest costs on interest-bearing debt. These higher interest costs are mostly offset by lower financial requirements due to overall improvements in the projected budgetary balance since Budget 2021. Public debt charges remain on a sustainable long-term path and are projected to be $0.7 billion lower in 2025-26 compared to Budget 2021.
Summary Statement of Transactions
| Projection | ||||||||||||
|---|---|---|---|---|---|---|---|---|---|---|---|---|
| 2020– 2021 | 2021– 2022 | 2022– 2023 | 2023– 2024 | 2024– 2025 | 2025– 2026 | 2026– 2027 | ||||||
| Budgetary revenues | 316.5 | 370.5 | 391.7 | 413.9 | 435.7 | 458.9 | 481.0 | |||||
| Program expenses, excluding net actuarial losses | 608.5 | 480.2 | 416.3 | 420.4 | 427.0 | 442.5 | 455.2 | |||||
| Public debt charges | 20.4 | 24.5 | 26.0 | 31.4 | 35.6 | 38.6 | 40.9 | |||||
| Total expenses, excluding net actuarial losses | 628.9 | 504.7 | 442.2 | 451.9 | 462.5 | 481.1 | 496.1 | |||||
| Budgetary balance before net actuarial losses | -312.4 | -134.2 | -50.5 | -38.0 | -26.8 | -22.2 | -15.2 | |||||
| Net actuarial losses | -15.3 | -10.3 | -7.9 | -5.9 | -2.3 | -0.5 | 2.0 | |||||
| Budgetary balance | -327.7 | -144.5 | -58.4 | -43.9 | -29.1 | -22.7 | -13.1 | |||||
| Financial Position | ||||||||||||
| Total liabilities | 1,652.2 | 1,784.4 | 1,833.9 | 1,902.3 | 1,955.9 | 2,004.0 | 2,041.0 | |||||
| Financial assets1 | 502.4 | 492.3 | 480.6 | 502.8 | 524.9 | 548.3 | 570.3 | |||||
| Net debt | 1,149.8 | 1,292.1 | 1,353.3 | 1,399.6 | 1,431.0 | 1,455.6 | 1,470.7 | |||||
| Non-financial assets | 101.1 | 100.5 | 103.3 | 105.7 | 108.0 | 109.9 | 111.8 | |||||
| Federal debt | 1,048.7 | 1,191.6 | 1,250.0 | 1,293.9 | 1,323.0 | 1,345.7 | 1,358.9 | |||||
| Per cent of GDP | ||||||||||||
| Budgetary revenues | 14.3 | 14.9 | 14.8 | 15.0 | 15.2 | 15.4 | 15.6 | |||||
| Program expenses, excluding net actuarial losses | 27.6 | 19.3 | 15.7 | 15.2 | 14.9 | 14.9 | 14.8 | |||||
| Public debt charges | 0.9 | 1.0 | 1.0 | 1.1 | 1.2 | 1.3 | 1.3 | |||||
| Budgetary balance | -14.8 | -5.8 | -2.2 | -1.6 | -1.0 | -0.8 | -0.4 | |||||
| Federal debt | 47.5 | 48.0 | 47.3 | 46.9 | 46.2 | 45.3 | 44.0 | |||||
|
Note: Totals may not add due to rounding. 1 The projected level of financial assets for 2021-22 includes an estimate of other comprehensive income of $1.7 billion for enterprise Crown corporations and other government business enterprises. |
||||||||||||
Outlook for Budgetary Revenues
| Projection | |||||||
|---|---|---|---|---|---|---|---|
| 2020– 2021 |
2021– 2022 |
2022– 2023 |
2023– 2024 |
2024– 2025 |
2025– 2026 |
2026– 2027 |
|
| Income tax revenues | |||||||
Personal income tax |
174.8 | 185.6 | 194.6 | 204.0 | 213.0 | 222.7 | 232.8 |
Corporate income tax |
54.1 | 57.3 | 58.4 | 60.9 | 65.5 | 70.0 | 73.7 |
Non-resident income tax |
8.1 | 10.6 | 10.4 | 10.7 | 11.1 | 11.5 | 12.0 |
Total |
237.0 | 253.5 | 263.4 | 275.6 | 289.6 | 304.2 | 318.5 |
| Excise tax and duty revenues | |||||||
Goods and Services Tax |
32.4 | 42.0 | 45.6 | 47.3 | 48.8 | 50.3 | 51.9 |
Customs import duties |
4.3 | 5.0 | 5.4 | 5.7 | 6.0 | 6.4 | 6.8 |
Other excise taxes/duties |
10.3 | 11.6 | 12.4 | 12.7 | 12.8 | 12.8 | 12.8 |
Total |
47.0 | 58.6 | 63.4 | 65.7 | 67.6 | 69.6 | 71.4 |
| Other taxes | 0.0 | 0.0 | 0.2 | 0.9 | 0.9 | 1.0 | 1.0 |
| Total tax revenues | 283.9 | 312.1 | 326.9 | 342.2 | 358.2 | 374.8 | 391.0 |
| Proceeds from the pollution pricing framework1 | 4.4 | 6.5 | 8.0 | 10.2 | 12.3 | 14.2 | 16.2 |
| Employment Insurance premium revenues | 22.4 | 24.2 | 26.3 | 28.2 | 30.1 | 32.1 | 34.3 |
| Other revenues | |||||||
Enterprise Crown corporations |
-10.5 | 8.9 | 8.9 | 8.5 | 8.8 | 10.2 | 10.9 |
Other programs |
14.1 | 17.3 | 19.8 | 22.7 | 23.9 | 24.7 | 25.6 |
Net foreign exchange |
2.2 | 1.5 | 1.8 | 2.1 | 2.5 | 2.8 | 3.0 |
Total |
5.8 | 27.6 | 30.5 | 33.3 | 35.2 | 37.7 | 39.5 |
| Total budgetary revenues | 316.5 | 370.5 | 391.7 | 413.9 | 435.7 | 458.9 | 481.0 |
| Per cent of GDP | |||||||
| Total tax revenues | 12.9 | 12.6 | 12.4 | 12.4 | 12.5 | 12.6 | 12.7 |
| Proceeds from the pollution pricing framework | 0.2 | 0.3 | 0.3 | 0.4 | 0.4 | 0.5 | 0.5 |
| Employment Insurance premium revenues | 1.0 | 1.0 | 1.0 | 1.0 | 1.1 | 1.1 | 1.1 |
| Other revenues | 0.3 | 1.1 | 1.2 | 1.2 | 1.2 | 1.3 | 1.3 |
| Total budgetary revenues | 14.3 | 14.9 | 14.8 | 15.0 | 15.2 | 15.4 | 15.6 |
|
Note: Totals may not add due to rounding. 1 Includes fuel charge proceeds which will be returned to the province/territory of origin through Climate Action Incentive payments and other climate supports. |
|||||||
The outlook for budgetary revenues, shown in Table A1.5 above, provides an overview of the projection of budgetary revenues by major component.
Income Tax Revenues
Personal income tax revenues – the largest component of budgetary revenues at 55.2 per cent in 2020-21 – are projected to increase to $185.6 billion in 2021-22, or 6.2 per cent, as the economy improves. For the remainder of the forecast, personal income tax revenue growth is expected to return to an average of 4.6 per cent, slightly above projected nominal GDP growth.
Corporate income tax revenues are projected to increase by 5.8 per cent, to $57.3 billion in 2021-22, supported by robust gains in corporate profits and general economic strength. Over the rest of the forecast, these revenues are expected to grow at an average rate of 5.2 per cent per year.
Non-resident income tax revenues are income taxes paid by non-residents on Canadian-sourced income, notably dividends and interest payments. These revenues are expected to grow to $10.6 billion in 2021-22, or 30.4 per cent, as corporate profits and investment income rebound from the economic impacts of the pandemic. For the remainder of the forecast, growth is expected to return to an average of 2.6 per cent.
Excise Tax and Duty Revenues
Goods and Services Tax (GST) revenues are projected to rebound to $42 billion in 2021-22, or 29.6 per cent, from a very weak 2020-21 outcome that was the result of the temporary shutdown of large portions of the retail sector and the reduction in revenues due to the cost of the one-time enhanced GST credit payment. Over the remainder of the projection period, GST revenues are forecast to grow by 4.3 per cent per year, on average, reflecting the outlook for taxable consumption.
Customs import duties are projected to increase 17.3 per cent in 2021-22 with the economic recovery and the reduced demand for remissions of duties on personal protective equipment and other medical goods. Revenue is then estimated to grow at an average annual rate of 6.4 per cent driven by projected growth in imports.
Other excise taxes and duties are expected to increase to $11.6 billion in 2021-22, or 12.7 per cent, as demand recovers, before softening to growth of an average annual rate of 2.0 per cent over the remainder of the projection period, reflecting expected consumption growth of motive fuels and tobacco products, in particular.
Other taxes include revenues from the Underused Housing Tax announced in Budget 2021. Revenues from this tax are projected to be $0.2 billion in 2022-23.
As announced on October 8, 2021, the government is moving ahead with Digital Services Tax legislation. However, consistent with a new international agreement under the auspices of the OECD, the tax will apply only as of 2024, and only if the treaty implementing the new multilateral tax regime (Pillar 1 tax) has not come into force. Given Canada’s strong preference for a multilateral approach and in light of the remaining uncertainties around the final design of Pillar 1 tax, revenues previously projected for the Digital Services Tax for 2023-24 and subsequent years have been provisioned purely as a proxy for revenues from the multilateral approach. In the event that the Pillar 1 treaty does not come into force, the DST would also apply as of 2024 to revenues earned as of January 1, 2022.
EI Premium Revenues
EI premium revenues are projected to grow at 7.2 per cent over the horizon due to labour market improvement. In addition, the two-year freeze in premium rates is currently scheduled to end in 2023, with the rate-setting practice to return to a premium rate-setting structure under current legislation that balances accumulated spending in the account over seven years. Premium rates are assumed to increase gradually from $1.58 in 2022 to $1.83 per $100 insurable earnings, but would remain lower than the peak rate of $1.88 following the 2008-09 recession. Overall, thanks to an improving labour market the cumulative deficit in the account will fall somewhat faster than originally estimated in Budget 2021, with a small surplus in 2028. The government will continue to review premium rates following the results of its consultations on future EI reforms over the course of the next year and taking into consideration the progress of the economic recovery.
Other Revenues
Other revenues consist of three broad components: net income from enterprise Crown corporations; other program revenues from returns on investments, proceeds from the sales of goods and services, and other miscellaneous revenues; and net foreign exchange revenues.
- Enterprise Crown corporation revenues are projected to increase by $19.4 billion in 2021-22 before growing at an average annual rate of 4.3 per cent over the remainder of the projection horizon. This reflects the outlooks presented in corporate plans of respective enterprise Crown corporations, as well as the impact of Bank of Canada programs introduced during COVID-19, including purchases of Government of Canada securities on the secondary market to support liquidity in financial markets.
- Other program revenues are affected by consolidated Crown corporation revenues, interest rates, inflation, and exchange rate movements (which affect the Canadian-dollar value of foreign-denominated assets). These revenues are projected to increase by 22.5 per cent in 2021-22, primarily due to an increase in interest and penalty revenue since waivers provided as part of the government’s COVID-19 response in 2020-21, which reduced that year’s revenue, are no longer in effect and a projected increase in revenue from sales of goods and services (e.g. VIA Rail revenue, fees for passports and visas, and wireless spectrum auction revenue). Over the remainder of the forecast horizon, these revenues continue to grow largely as a result of increased return on investments and interest and penalty revenue.
- Net foreign exchange revenues, which consist mainly of returns on Canada’s official international reserves held in the Exchange Fund Account, are volatile and sensitive to fluctuations in foreign exchange rates and foreign interest rates. Assets in the Exchange Fund Account are mainly invested in debt securities of sovereigns and their agencies, and are held to aid in the control and protection of the external value of the Canadian dollar and to provide a source of liquidity for the government, if required. These revenues are projected to increase as a result of higher expected interest rates.
Employment Insurance Operating Account
| 2020- 2021 |
2021- 2022 |
2022- 2023 |
2023- 2024 |
2024- 2025 |
2025- 2026 |
2026- 2027 |
|||
|---|---|---|---|---|---|---|---|---|---|
EI premium revenues |
22.4 | 24.2 | 26.3 | 28.2 | 30.1 | 32.1 | 34.3 | ||
EI benefits1 |
33.7 | 39.5 | 31.7 | 24.7 | 25.1 | 25.6 | 26.5 | ||
EI administration and other expenses2 |
2.5 | 2.9 | 2.1 | 2.0 | 2.0 | 2.0 | 2.0 | ||
| 20203 | 2021 | 2022 | 2023 | 2024 | 2025 | 2026 | 2027 | 2028 | |
EI Operating Account annual balance |
-6.4 | -21.2 | -10.0 | 1.5 | 3.1 | 4.8 | 6.0 | 7.5 | 7.7 |
EI Operating Account cumulative balance |
1.3 | -19.9 | -29.9 | -28.4 | -25.3 | -20.5 | -14.5 | -6.9 | 0.74 |
Projected premium rate (per $100 of insurable earnings) |
1.58 | 1.58 | 1.58 | 1.63 | 1.68 | 1.73 | 1.78 | 1.83 | 1.83 |
1 EI benefits include regular EI benefits, sickness, maternity, parental, compassionate care, fishing and work sharing benefits, and employment benefits and support measures. EI benefits exclude EI-Emergency Response Benefit costs as these will not be recovered via EI premiums in line with the government’s commitment to credit the EI Operating Account. 2 The remaining EI costs relate mainly to administration and are included in direct program expenses. 3 Values for 2020 are actual data. Values for 2021 and future years are a projection. 4 The EI Operating Account cumulative balance does not reach exactly zero at the end of the seven-year period as projected EI rates are rounded to the nearest whole cent per $100 of insurable earnings, in accordance with the Employment Insurance Act. |
|||||||||
The Employment Insurance (EI) Operating Account operates within the Consolidated Revenue Fund. As such, EI-related revenues and expenses that are credited and charged to the Account, respectively, in accordance with the Employment Insurance Act, are consolidated with those of the government, and impact the budgetary balance. For consistency with the EI premium rate, which is set on a calendar-year basis with the objective of having the Account break even over time, the annual and cumulative balances of the Account are also presented on a calendar-year basis.
The EI Operating Account is expected to record annual deficits from 2020 to 2022 as a result of the increase in EI benefits (excluding the Emergency Response Benefit) and the temporary freeze on EI premiums through 2022. The Account is then projected to record annual surpluses due to projected increases in the premium rate until reaching $1.83. The increases reflect the practice of the break-even rate-setting mechanism that started with the setting of the 2017 premium rate.
The Chief Actuary at the Office of the Superintendent of Financial Institutions Canada estimates a flat seven-year break even rate of $1.81 per $100 of insurable earnings. This differs slightly from the $1.83 that is reached by the end of the period here due to the incorporation of assumptions to better align with the projected fiscal impacts. In particular, Department of Finance projections incorporate the legislatively mandated five-cent limit in annual changes to the premium rate and the premium-rate freeze in 2022.
Outlook for Program Expenses
| Projection | |||||||
|---|---|---|---|---|---|---|---|
| 2020- 2021 |
2021- 2022 |
2022- 2023 |
2023- 2024 |
2024- 2025 |
2025- 2026 |
2026- 2027 |
|
| Major transfers to persons | |||||||
| Elderly benefits | 58.5 | 61.6 | 68.3 | 73.0 | 77.4 | 81.9 | 86.5 |
| Employment Insurance benefits1 | 58.4 | 39.5 | 31.7 | 24.7 | 25.1 | 25.6 | 26.5 |
| COVID-19 income support for workers2 | 55.8 | 20.4 | 0.4 | 0.0 | 0.0 | 0.0 | 0.0 |
| Canada Child Benefit3 | 27.4 | 26.4 | 25.5 | 25.8 | 26.5 | 27.3 | 28.2 |
| Total | 200.1 | 147.9 | 126.0 | 123.5 | 128.9 | 134.8 | 141.2 |
| Major transfers to other levels of government | |||||||
| Canada Health Transfer | 45.9 | 43.1 | 45.2 | 48.7 | 51.1 | 53.2 | 55.2 |
| Canada Social Transfer | 15.0 | 15.5 | 15.9 | 16.4 | 16.9 | 17.4 | 17.9 |
| Equalization | 20.6 | 20.9 | 21.9 | 23.6 | 24.8 | 25.8 | 26.8 |
| Territorial Formula Financing | 4.2 | 4.4 | 4.6 | 4.9 | 5.1 | 5.2 | 5.4 |
| Canada Community-Building Fund | 4.3 | 2.3 | 2.3 | 2.4 | 2.4 | 2.5 | 2.5 |
| Home care and mental health | 1.3 | 1.5 | 1.2 | 1.2 | 1.2 | 1.2 | 1.2 |
| Canada-Wide Early Learning and Child Care4 | 0.0 | 3.0 | 4.5 | 5.5 | 6.5 | 7.7 | 7.7 |
| Other fiscal arrangements5 | 15.4 | -5.6 | -6.0 | -6.5 | -6.8 | -7.2 | -7.5 |
| Total | 106.7 | 85.0 | 89.6 | 96.2 | 101.1 | 105.8 | 109.2 |
| Direct program expenses | |||||||
| Proceeds from the pollution pricing framework returned6 | 4.6 | 4.8 | 7.9 | 11.0 | 12.3 | 14.3 | 16.2 |
| Canada Emergency Wage Subsidy | 80.2 | 20.3 | 0.0 | 0.0 | 0.0 | 0.0 | 0.0 |
| Other transfer payments | 98.0 | 98.5 | 79.4 | 77.2 | 73.6 | 75.5 | 75.5 |
| Operating expenses7 | 119.1 | 123.7 | 113.4 | 112.5 | 111.0 | 112.0 | 113.2 |
| Total | 301.8 | 247.3 | 200.7 | 200.7 | 196.9 | 201.8 | 204.9 |
| Total program expenses, excluding net actuarial losses | 608.5 | 480.2 | 416.3 | 420.4 | 427.0 | 442.5 | 455.2 |
| Net actuarial losses (gains) | 15.3 | 10.3 | 7.9 | 5.9 | 2.3 | 0.5 | -2.0 |
| Per cent of GDP | |||||||
| Major transfers to persons | 9.1 | 6.0 | 4.8 | 4.5 | 4.5 | 4.5 | 4.6 |
| Major transfers to other levels of government | 4.8 | 3.4 | 3.4 | 3.5 | 3.5 | 3.6 | 3.5 |
| Direct program expenses | 13.7 | 10.0 | 7.6 | 7.3 | 6.9 | 6.8 | 6.6 |
| Total program expenses | 27.6 | 19.3 | 15.7 | 15.2 | 14.9 | 14.9 | 14.8 |
|
Note: Totals may not add due to rounding. 1 EI benefits include regular EI benefits, sickness, maternity, parental, compassionate care, fishing and work-sharing benefits, and employment benefits and support measures. Remaining EI costs relate mainly to administration and are part of operating expenses. This includes the portion of payments for the Emergency Response Benefit charged to the EI Operating Account in 2019-20 and 2020-21, but there is no impact on the EI Operating Account since premium revenues will not be used for the Emergency Response Benefit as a credit has been made in 2020-21. 2 Includes the Canada Emergency Response Benefit, the Canada Recovery Benefit, the Canada Recovery Caregiving Benefit, the Canada Recovery Sickness Benefit, and the Canada Worker Lockdown Benefit. 3 Includes the Child Disability Benefit and residual payments for the Universal Child Care Benefit, now replaced by the Canada Child Benefit 4 Canada-Wide Early Learning and Child Care transfer payments to provinces and territories, as included in Budget 2021, have been reclassified from Direct program expenses to Major transfers to other levels of government, with no impact on total program expenses. Amounts exclude funding for Indigenous Early Learning and Child Care, which are included in the other transfer payments line 5 Other fiscal arrangements include the Quebec Abatement (Youth Allowances Recovery and Alternative Payments for Standing Programs); payments under the Canada-Nova Scotia Arrangement on Offshore Revenues; and potential Fiscal Stabilization payments. This also includes certain COVID-19 response measures such as the Safe Restart Agreement, Safe Return to Class Fund, the COVID-19 Essential Workers Support Fund and Canada’s COVID-19 Immunization Plan 6 Includes fuel charge proceeds which will be returned to the province/territory of origin through Climate Action Incentive payments and other climate supports 7 This includes capital amortization expenses. |
|||||||
The outlook for program expenses, shown in Table A1.6 above, provides an overview of the projection for program expenses by major component. As shown in the outlook, total program expenses as a share of GDP will continue to track downward, reflecting prudent and responsible fiscal management and a more normal trend in spending post-COVID-19.
Program expenses consist of three main categories: major transfers to persons, major transfers to other levels of government, and direct program expenses.
Major Transfers to Persons
Major transfers to persons consist of elderly benefits, Employment Insurance (EI) benefits, the Canada Child Benefit, and the Canada Emergency Response Benefit and Recovery Benefits.
Elderly benefits are projected to reach $61.6 billion in 2021-22, up 5.2 per cent compared to last year but slightly lower than originally forecast in Budget 2021. Over the remainder of the horizon, elderly benefits are forecast to grow by $4.9 billion per year on average. Growth in elderly benefits is due to the increasing population of seniors, reflecting this ongoing demographic change, and projected consumer price inflation, to which benefits are fully indexed, as well as the 10 per cent increase to Old Age Security payments for pensioners 75 and over on an ongoing basis as of July 2022 announced in Budget 2021.
EI benefits are projected to decrease to $39.5 billion in 2021-22, largely reflecting the expiration of temporary COVID-related EI measures and a lower unemployment rate. EI benefits are expected to fall further to $24.7 billion by 2023-24 as a result of the projected improvement in the labour market and grow at an average of 2.3 per cent annually thereafter.
The Canada Emergency Response Benefit was introduced as part of Canada’s COVID-19 Economic Response Plan to provide immediate assistance to Canadians not eligible for EI benefits. In September 2020, when this program ended, the government continued to support all Canadians with the Canada Recovery Benefit, the Canada Recovery Sickness Benefit, and the Canada Recovery Caregiving Benefit. While the Canada Recovery Benefit ended on October 23, 2021, the government is proposing to extend the sickness and caregiving benefits until May 7, 2022, and introduce the Canada Worker Lockdown Benefit. The latter is a targeted benefit available to workers who face direct work interruptions due to public health lockdowns that would be accessible up until May 7, 2022. These income support programs for workers are expected to cost $20.4 billion in 2021-22, decreasing to $0.4 billion in 2022-23 as the recovery strengthens and temporary programs end.
Canada Child Benefit (CCB) payments are projected to decrease 3.5 per cent to $26.4 billion in 2021-22, largely reflecting the conclusion of 2020-21 temporary top-up transfer. CCB benefits will decline further in 2022-23 due to the conclusion of the temporary supplement for families with young children introduced in the 2020 Fall Economic Statement. For the period of 2023-24 to 2026-27, CCB payments are expected to grow at an average annual rate of 2.5 per cent, reflecting forecasted consumer price inflation to which the benefits are indexed.
Major Transfers to Other Levels of Government
Major transfers to other levels of government, which include the Canada Health Transfer (CHT), the Canada Social Transfer (CST), Equalization, Territorial Formula Financing, and the Canada Community-Building Fund (formerly known as the Gas Tax Fund), among others, are expected to decrease by 20.3 per cent to $85 billion in 2021-22, a return to more normal levels following the unprecedented level of support provided to provinces and territories in 2020-21, during the height of the pandemic.
The CHT is projected to grow from $43.1 billion in 2021-22 to $55.2 billion in 2026-27, as it grows in line with a three-year moving average of nominal GDP growth, with funding guaranteed to increase by at least 3 per cent per year. The CST is legislated to grow at 3 per cent per year. Canada Community-Building Fund payments are indexed at 2 per cent per year, with increases applied in $100 million increments. Home care and mental health transfers are projected to be $1.5 billion in 2021-22, before stabilizing at $1.2 billion starting in 2022-23. Canada-Wide Early Learning and Child Care transfer payments will increase from $3.0 billion in 2021-22 to $7.7 billion in 2025-26.
Direct Program Expenses
Direct program expenses consist of proceeds from the pollution pricing framework returned, the Canada Emergency Wage Subsidy, other transfer payments administered by departments, and operating expenses.
- Other transfer payments administered by departments are projected to increase slightly to $98.5 billion in 2021-22. After which they are projected to decline until 2024-25 at an average of 9.2 per cent annually. The decline is a result of the phasing out of pandemic supports, which is somewhat offset in the early years of the projection period by measures taken to support hardest-hit sectors through the recovery (e.g., the Hardest-Hit Business Recovery Program and Canada Recovery Hiring Program). From 2024-25 onwards, other transfer payments are forecasted to modestly increase to $75.5 billion by 2026-27.
- Operating expenses, which are projected to increase 3.9 per cent to $123.7 billion in 2021-22, reflect the broad range of day-to-day costs of government operations for more than 100 government departments, agencies, and Crown corporations, in addition to pandemic-related expenses for the procurement of vaccines, personal protective equipment, and rapid testing kits. Operating expenses are then anticipated to decline, in line with the phasing out of pandemic supports, by an average of 3.6 per cent annually until 2024-25, after which they are projected to stabilize with steady growth, reaching $113.2 billion by 2026-27.
Net Actuarial Losses
Net actuarial losses, which represent changes in the measurement of the government’s obligations for pensions and other employee future benefits, are expected to gradually decline over the forecast horizon, from a projected loss of $10.3 billion in 2021-22 to a projected net actuarial gain of $2.0 billion in 2026-27, reflecting higher expected interest rates used to measure the present value of the obligations.
Financial Source/Requirement
The financial/source requirement measures the difference between cash coming in to the government and cash going out. In contrast, the budgetary balance is presented on a full accrual basis of accounting, meaning that government revenues and expenses are recorded when they are earned or incurred, regardless of when the cash is received or paid. Table A1.7 provides a reconciliation of the two measures, starting with the budgetary balance. Non-budgetary transactions shown in the table reflect the reversal of certain revenues and expenses included in the budgetary balance that have no impact on cash flows in the year, such as the amortization of non-financial assets, and the addition of changes in asset and liability balances that have no accrual impact in a year but do result in the inflow or outflow of cash, such as the payment of accounts payable. Increases to liabilities or decreases to assets contribute towards a financial source, whereas decreases to liabilities and increases to assets contribute to a financial requirement.
| Projection | |||||||
|---|---|---|---|---|---|---|---|
| 2020– 2021 |
2021– 2022 |
2022– 2023 |
2023– 2024 |
2024– 2025 |
2025– 2026 |
2026– 2027 |
|
| Budgetary balance | -327.7 | -144.5 | -58.4 | -43.9 | -29.1 | -22.7 | -13.1 |
| Non-budgetary transactions | |||||||
| Pensions and other accounts | 16.9 | 11.5 | 9.1 | 6.4 | 2.2 | 0.0 | -1.3 |
| Non-financial assets | -9.5 | 0.5 | -2.7 | -2.4 | -2.3 | -1.9 | -1.9 |
Loans, investments and advances |
|||||||
Enterprise Crown corporations |
5.5 | -5.5 | -9.9 | -9.8 | -8.4 | -10.1 | -9.8 |
Other |
-31.9 | -7.9 | 30.5 | -2.9 | -3.6 | -3.6 | -2.6 |
Total |
-26.4 | -13.4 | 20.6 | -12.7 | -11.9 | -13.7 | -12.5 |
Other transactions |
|||||||
Accounts payable, receivable, accruals and allowances |
19.9 | -4.4 | -28.9 | -10.8 | -7.2 | -7.3 | -7.2 |
Foreign exchange activities |
12.3 | -5.5 | -4.0 | -4.0 | -4.1 | -3.3 | -3.2 |
Total |
32.2 | -9.9 | -32.9 | -14.8 | -11.3 | -10.7 | -10.4 |
| Total | 13.2 | -11.3 | -6.0 | -23.5 | -23.3 | -26.3 | -26.0 |
| Financial source/requirement | -314.6 | -155.8 | -64.4 | -67.4 | -52.5 | -49.0 | -39.2 |
As shown in Table A1.7, a financial requirement is projected in each year over the forecast horizon, largely reflecting financial requirements associated with the projected budgetary balance. Reflecting an overall better fiscal outlook and less need for cash, the total financial requirement for 2021-22 of $155.8 billion is approximately $35 billion lower than forecast in Budget 2021.
A financial source is projected for pensions and other accounts for 2021-22 to 2024-25. Pensions and other accounts include the activities of the Government of Canada’s employee pension plans and those of federally appointed judges and Members of Parliament, as well as a variety of other employee future benefit plans, such as health care and dental plans, and disability and other benefits for veterans and others. The financial source for pensions and other accounts reflects the difference between non-cash pension and benefit expenses recorded as part of the budgetary balance to reflect the value of benefits earned by employees during a fiscal year and the annual cash outflows for benefit payments.
Financial requirements for non-financial assets mainly reflect the difference between cash outlays for the acquisition of new tangible capital assets and the amortization of capital assets included in the budgetary balance. They also include disposals of tangible capital assets and changes in inventories and prepaid expenses. A net financial source of $0.5 billion is projected for 2021-22.
Loans, investments and advances include the government’s investments in enterprise Crown corporations, including Canada Mortgage and Housing Corporation, Export Development Canada, the Business Development Bank of Canada, and Farm Credit Canada. They also include loans, investments and advances to national and provincial governments and international organizations, and under government programs, including the Canada Emergency Business Account (CEBA). The projected financial requirement in 2021-22 mainly reflects the disbursement of loans under CEBA and loans advanced to enterprise Crown corporations under the consolidated borrowing framework. A financial source is projected for 2022-23, largely reflecting the anticipated repayment of CEBA loans. Financial requirements are projected from 2023-24 to 2026-27, reflecting retained earnings of enterprise Crown corporations, as well loans provided to Crown corporations and third parties.
In general, loans, investments and advances are expected to generate additional revenues for the government in the form of interest or additional net profits of enterprise Crown corporations, which partly offset debt charges associated with these borrowing requirements. These revenues are reflected in projections of the budgetary balance.
Other transactions include the payment of tax refunds and other accounts payable, the collection of taxes and other accounts receivable, the conversion of other accrual adjustments included in the budgetary balance into cash, as well as foreign exchange activities. Projected cash requirements over the forecast horizon mainly reflect the payment of accounts payable, forecast increases in the government’s official international reserves held in the Exchange Fund Account, as well as projected growth in accounts receivable, in line with historical trends.
Alternative Economic Scenarios
Uncertainty surrounding the economic outlook continues to be elevated in particular with the Omicron variant and ongoing supply shortages. While many supply-side issues are expected to gradually ease in 2022, the situation remains fluid and could last for longer than expected. The longer-term trajectory of the pandemic and economic behaviour are equally uncertain. In this context, the Department of Finance Canada has considered two alternative scenarios to the projections of the private sector economists which reflect downside and upside risks to the outlook.
Slower Recovery Scenario
In this scenario, we consider the impact of more prolonged supply-side issues and difficulty in adapting to COVID‑19 if new variants of concern, such as Omicron, delay the return to normal economic conditions. Resurgent waves of the virus prevent a full recovery in hard-hit businesses in sectors requiring close contact, large gatherings, or international travel—leading to persistent unevenness that weighs on Canada’s economic potential. The ongoing pandemic also exacerbates the supply disruptions and labour shortages impacting a range of industries, with acute challenges extending until 2023. Meanwhile, the severe flooding in B.C. puts additional pressure on supply chains in the near term, weighing on the recovery in the fourth quarter of 2021. Despite weaker growth over this year and next, supply and labour shortages create significant cost pressures that keep inflation elevated into the second half of 2022, though inflation is somewhat weaker than currently expected over the remainder of the forecast horizon.
Overall, the downside risk scenario suggests a reduced pace of growth over the next few quarters until the end of 2022 compared to the November survey outlook. This reduces the rebound in real GDP to around 4.4 per cent in 2021 and 2.8 per cent in 2022, compared to growth rates of, respectively, 4.6 per cent and 4.2 per cent expected in the November 2021 survey (Table A1.8). However, the recovery is expected to accelerate in early 2023, maintaining annual growth rates of about 2.7 per cent in both 2023 and 2024.
In this scenario, the level of nominal GDP is expected to be about $45 billion lower on average per year over the 2022-2026 period compared to the November 2021 survey.
Faster Recovery Scenario
In this scenario, we consider a world in which supply-side issues are resolved more quickly than expected. While certain industries continue to face challenges, the most acute supply and labour shortages ease by early 2022 as businesses adjust their supply chains and boost capital spending to alleviate capacity pressures and supply shortages. Meanwhile, Canadian consumers and businesses quickly adapt to ongoing COVID-19 risks, enabling a shift in spending from goods to services that takes pressure off supply chains and supports a robust recovery in hard-hit sectors. With stronger growth, inflation pressures could be stronger than expected over the near-term as robust demand offsets fading pressures from supply constraints.
Overall, the upside risk scenario suggests much faster growth starting in the second quarter of 2022 compared to the November survey forecast, with growth slowing in mid-2023, resulting in annual growth rates of 5.0 per cent in 2022 and 3.7 per cent in 2023, followed by slower growth of around 1.7 per cent in 2024.
In this scenario, the level of nominal GDP is expected to be about $47 billion higher on average per year over the 2022-2026 period compared to the November 2021 survey.
| 2021Q4 | 2022Q1 | 2022Q2 | 2021 | 2022 | 2023 | 2024 | 2025 | 2026 | |
|---|---|---|---|---|---|---|---|---|---|
| Real GDP Growth | |||||||||
| Economic and Fiscal Update 2021 | 5.1 | 4.8 | 4.9 | 4.6 | 4.2 | 2.8 | 2.0 | 1.8 | 1.8 |
| Scenario: Slower Recovery | 2.0 | 3.5 | 3.1 | 4.4 | 2.8 | 2.7 | 2.7 | 1.9 | 1.8 |
| Scenario: Faster Recovery | 5.9 | 5.2 | 6.3 | 4.6 | 5.0 | 3.7 | 1.7 | 1.7 | 1.8 |
| GDP Inflation | |||||||||
| Economic and Fiscal Update 2021 | 3.0 | 0.9 | 1.2 | 7.6 | 2.2 | 1.5 | 1.9 | 1.9 | 1.9 |
| Scenario: Slower Recovery | 3.3 | 0.9 | 1.1 | 7.6 | 2.2 | 1.2 | 1.7 | 1.8 | 1.8 |
| Scenario: Faster Recovery | 2.7 | 0.9 | 1.3 | 7.5 | 2.2 | 1.8 | 2.0 | 1.9 | 1.9 |
| Nominal GDP Growth | |||||||||
| Economic and Fiscal Update 2021 | 8.2 | 5.7 | 6.1 | 12.5 | 6.6 | 4.3 | 3.9 | 3.7 | 3.8 |
| Scenario: Slower Recovery | 5.3 | 4.4 | 4.2 | 12.3 | 5.0 | 4.0 | 4.5 | 3.6 | 3.7 |
| Scenario: Faster Recovery | 8.8 | 6.1 | 7.7 | 12.5 | 7.4 | 5.6 | 3.7 | 3.6 | 3.7 |
| Nominal GDP Level ($ billions) | |||||||||
| Economic and Fiscal Update 2021 | 2,482 | 2,644 | 2,758 | 2,866 | 2,973 | 3,086 | |||
| Scenario: Slower Recovery | 2,477 | 2,602 | 2,705 | 2,826 | 2,929 | 3,037 | |||
| Scenario: Faster Recovery | 2,482 | 2,667 | 2,815 | 2,919 | 3,024 | 3,136 | |||
| Difference between Economic and Fiscal Update 2021 and Scenario: Slower Recovery | -4 | -42 | -53 | -39 | -44 | -48 | |||
| Difference between Economic and Fiscal Update 2021 and Scenario: Faster Recovery | 1 | 23 | 57 | 53 | 51 | 51 | |||
| Unemployment Rate | |||||||||
| Economic and Fiscal Update 2021 | 6.7 | 6.4 | 6.1 | 7.6 | 6.1 | 5.7 | 5.7 | 5.6 | 5.7 |
| Scenario: Slower Recovery | 6.7 | 6.7 | 6.4 | 7.6 | 6.3 | 5.9 | 5.7 | 5.6 | 5.7 |
| Scenario: Faster Recovery | 6.6 | 6.3 | 6.0 | 7.5 | 5.9 | 5.5 | 5.6 | 5.6 | 5.7 |
| 3-month Treasury Bill Rate | |||||||||
| Economic and Fiscal Update 2021 | 0.2 | 0.2 | 0.3 | 0.1 | 0.5 | 1.2 | 1.6 | 1.9 | 2.0 |
| Scenario: Slower Recovery | 0.2 | 0.2 | 0.3 | 0.1 | 0.5 | 1.2 | 1.6 | 1.9 | 2.0 |
| Scenario: Faster Recovery | 0.2 | 0.2 | 0.3 | 0.1 | 0.5 | 1.3 | 1.7 | 2.0 | 2.1 |
| 10-Year Government Bond Rate | |||||||||
| Economic and Fiscal Update 2021 | 1.5 | 1.8 | 1.9 | 1.4 | 1.9 | 2.3 | 2.5 | 2.7 | 2.9 |
| Scenario: Slower Recovery | 1.5 | 1.8 | 1.9 | 1.4 | 1.9 | 2.2 | 2.4 | 2.7 | 2.8 |
| Scenario: Faster Recovery | 1.6 | 1.8 | 1.9 | 1.4 | 1.9 | 2.3 | 2.6 | 2.8 | 3.0 |
|
Sources: Statistics Canada; for Economic and Fiscal Update 2021, Department of Finance Canada November 2021 survey of private sector economists, which has been adjusted to incorporate the actual results of the National Accounts for the third quarter of 2021 and the historical revisions released on November 30th; Department of Finance Canada calculations. |
|||||||||
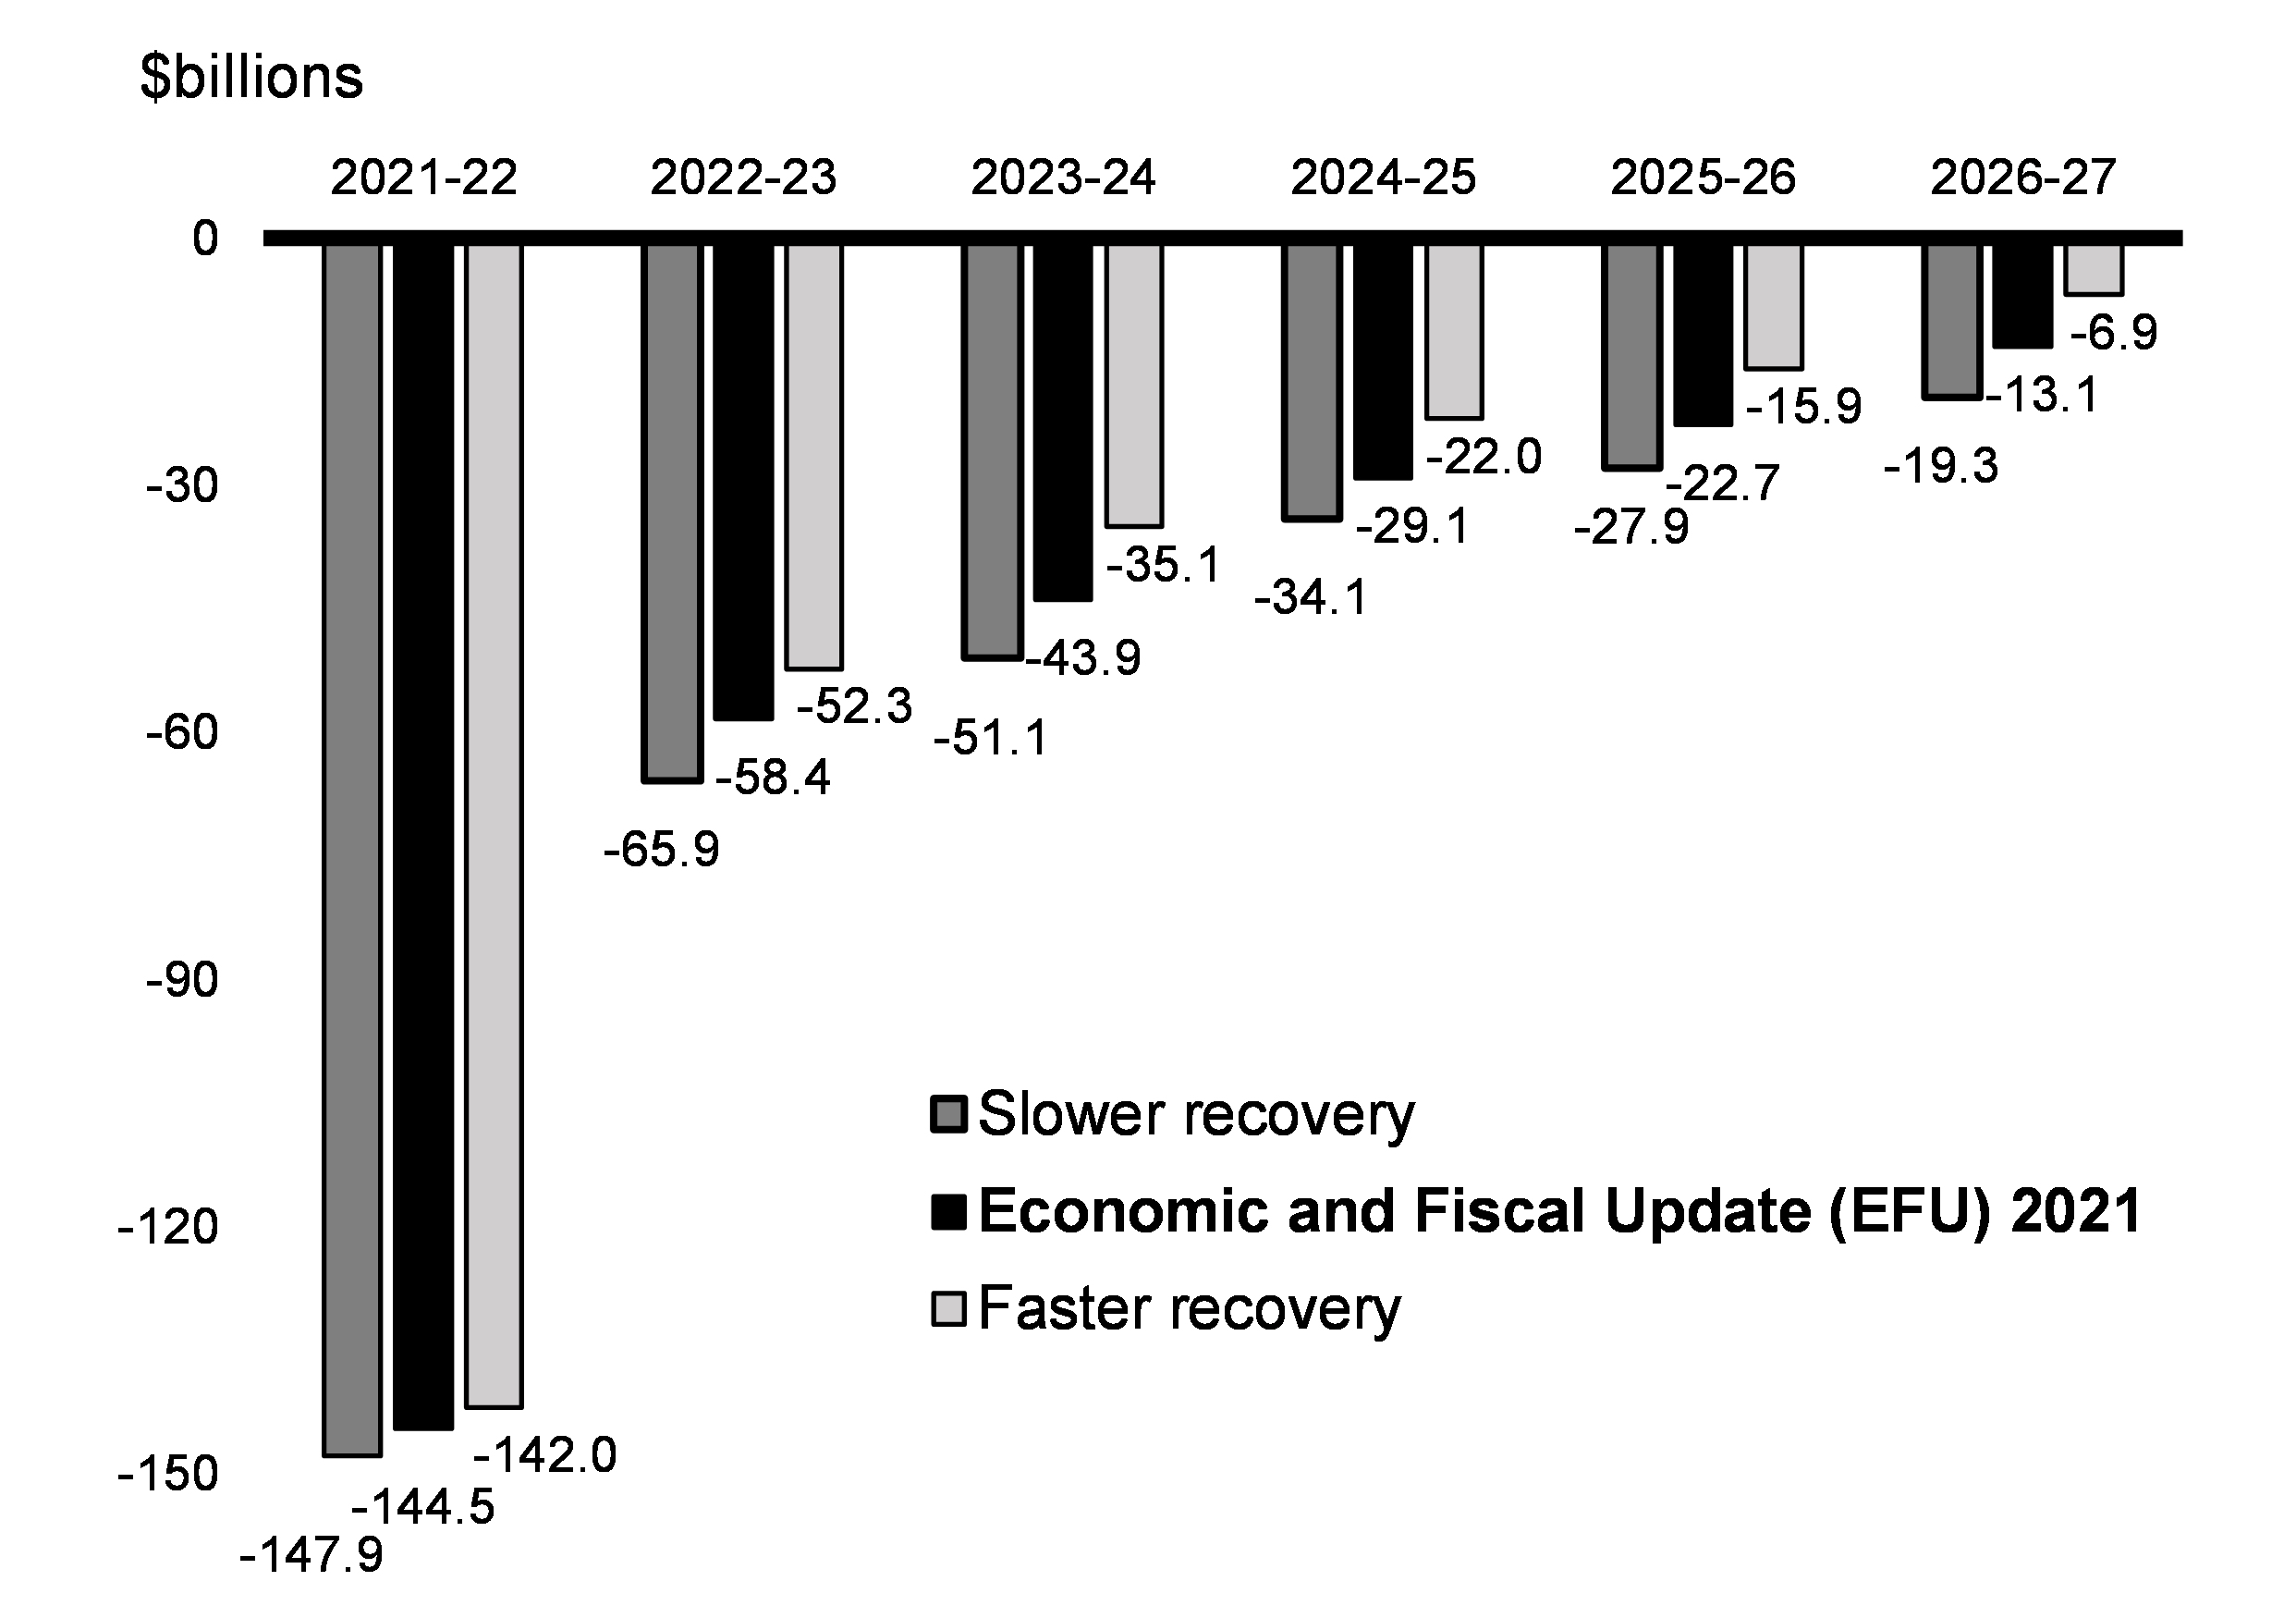
The potential impact of these alternative scenarios on the projected federal deficit and debt-to-GDP ratio is shown in Charts A1.1 and A1.2 below. The relative change in economic activity under both scenarios would be expected to affect tax revenues, and expenses such as Employment Insurance benefits, the government’s economic recovery programs including the Canada Recovery Benefits, and major health and social transfer payments to provinces. In the slower recovery scenario, supports for businesses in hard-hit sectors are expected to experience greater takeup in addition to income supports for workers in these industries. In the faster recovery scenario, lower usage of income and rent supports is somewhat offset by increased uptake of rehiring supports available to hard-hit business.
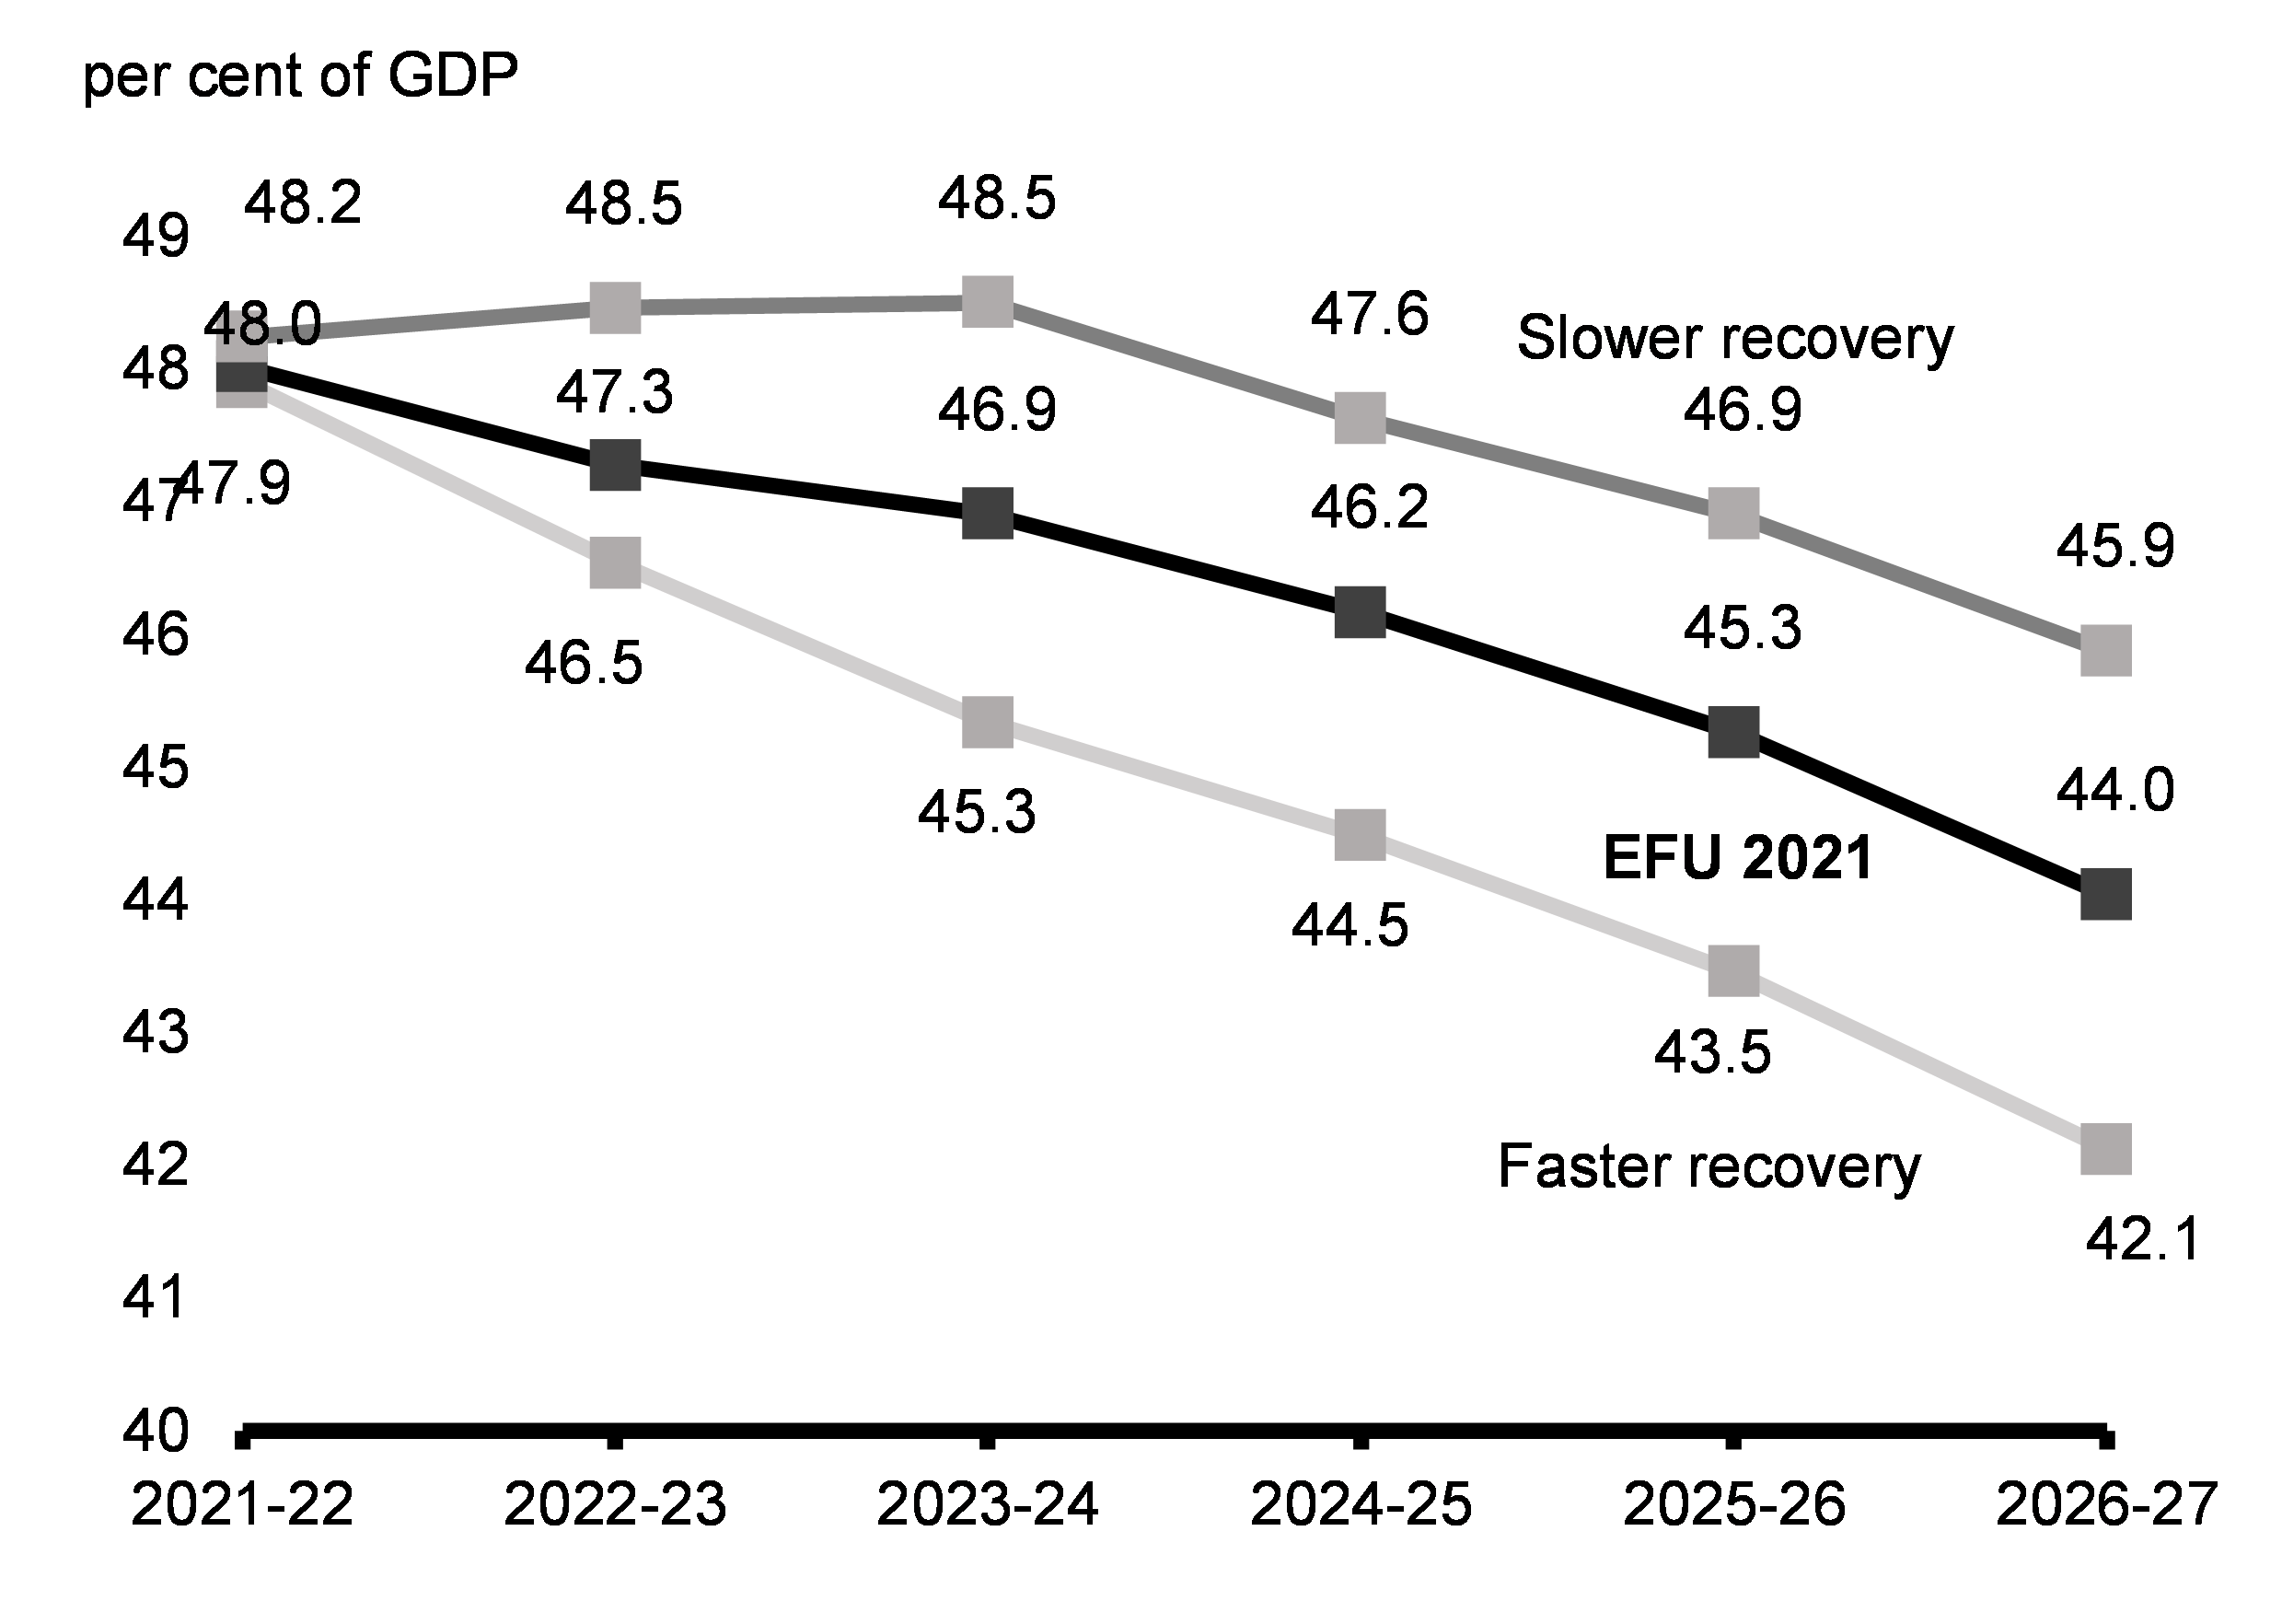
In total, the slower recovery scenario could be expected to add about $6 billion on average to the deficit across the horizon, and 1.8 percentage points to the federal debt-to-GDP ratio by 2026-27. In the faster recovery scenario, the deficit would be reduced by approximately $6 billion, on average across the projection, and the federal debt-to-GDP ratio would fall 1.9 percentage points to 42.1 per cent by 2026-27.
Even in the case of the slower recovery scenario, the federal debt-to-GDP outlook would be lower than the baseline forecast of Budget 2021, tabled just months ago.
Deficit under Alternative Economic Scenarios
Federal Debt-to-GDP Ratio under Alternative Economic Scenarios
Supplementary Information
Sensitivity of Fiscal Projections to Economic Shocks
Changes in economic assumptions affect the projections for revenues and expenses. The following tables illustrate the sensitivity of the budgetary balance to a number of economic shocks:
- A one-year, 1-percentage-point decrease in real GDP growth driven equally by lower productivity and employment growth.
- A decrease in nominal GDP growth resulting solely from a one-year, 1-percentage-point decrease in the rate of GDP inflation (assuming that the Consumer Price Index (CPI) moves in line with GDP inflation).
- A sustained 100-basis-point increase in all interest rates.
These sensitivities are generalized rules of thumb that assume any decrease in economic activity is proportional across income and expenditure components, and are meant to provide a broad illustration of the impact of economic shocks on the outlook for the budgetary balance. The sensitivity analysis conducted in this section has been presented routinely in budgets since 1994, and is separate from the scenarios for a faster or slower recovery presented earlier in this annex. Actual economic shocks may have different fiscal impacts. For example, they may be concentrated in specific sectors of the economy or cause different responses in key economic variables (e.g., GDP inflation and CPI inflation may have different responses to a given shock).
| Year 1 | Year 2 | Year 5 | |
|---|---|---|---|
| Federal revenues | |||
Tax revenues |
|||
Personal income tax |
-2.8 | -2.9 | -3.4 |
Corporate income tax |
-0.6 | -0.6 | -0.8 |
Goods and Services Tax |
-0.4 | -0.4 | -0.5 |
Other |
-0.2 | -0.2 | -0.2 |
Total tax revenues |
-3.9 | -4.2 | -4.8 |
| Employment Insurance premiums | -0.1 | -0.2 | -0.2 |
| Other revenues | -0.1 | -0.1 | -0.2 |
| Total budgetary revenues | -4.2 | -4.4 | -5.1 |
| Federal expenses | |||
Major transfers to persons |
|||
Elderly benefits |
0.0 | 0.0 | 0.0 |
Employment Insurance benefits |
1.0 | 1.0 | 1.1 |
Canada Child Benefit |
0.0 | 0.1 | 0.1 |
Total major transfers to persons |
1.0 | 1.1 | 1.2 |
| Other program expenses | -0.4 | -0.5 | -0.8 |
| Public debt charges | 0.1 | 0.2 | 0.6 |
| Total expenses | 0.6 | 0.8 | 1.0 |
| Budgetary balance | -4.9 | -5.2 | -6.2 |
A 1-percentage-point decrease in real GDP growth proportional across income and expenditure components reduces the budgetary balance by $4.9 billion in the first year, $5.2 billion in the second year, and $6.2 billion in the fifth year (Table A1.9).
- Tax revenues from all sources fall by a total of $3.9 billion in the first year. Personal income tax revenues decrease as employment and the underlying tax base fall. Corporate income tax revenues fall as output and profits decrease. GST revenues decrease as a result of lower consumer spending associated with the fall in employment and personal income.
- EI premium revenues are relatively unchanged, as the EI premium rate is bound by the 5-cent maximum annual increase throughout the baseline forecast. EI revenues would typically rise as a result of this shock, as the EI premium rate increases under the seven-year break-even mechanism, adjusting to offset the increase in benefits such that the EI Operating Account balances over time.
- Expenses rise, mainly reflecting higher EI benefits (due to an increase in the number of unemployed) and higher public debt charges (reflecting a higher stock of debt due to the lower budgetary balance). This rise is partially offset by lower other program expenses (as certain programs are linked to growth in nominal GDP).
| Year 1 | Year 2 | Year 5 | |
|---|---|---|---|
| Federal revenues | |||
Tax revenues |
|||
Personal income tax |
-2.6 | -2.5 | -2.6 |
Corporate income tax |
-0.6 | -0.6 | -0.8 |
Goods and Services Tax |
-0.4 | -0.4 | -0.5 |
Other |
-0.2 | -0.2 | -0.2 |
Total tax revenues |
-3.8 | -3.7 | -4.0 |
| Employment Insurance premiums | 0.0 | -0.1 | -0.2 |
| Other revenues | -0.1 | -0.1 | -0.2 |
| Total budgetary revenues | -3.9 | -3.9 | -4.4 |
| Federal expenses | |||
Major transfers to persons |
|||
Elderly benefits |
-0.4 | -0.8 | -0.9 |
Employment Insurance benefits |
0.1 | 0.1 | 0.2 |
Canada Child Benefit |
0.0 | -0.1 | -0.3 |
Total major transfers to persons |
-0.3 | -0.8 | -1.0 |
| Other program expenses | -0.8 | -0.9 | -1.9 |
| Public debt charges | -0.6 | 0.0 | 0.0 |
| Total expenses | -1.7 | -1.7 | -2.9 |
| Budgetary balance | -2.2 | -2.2 | -1.5 |
A 1-percentage-point decrease in nominal GDP growth proportional across income and expenditure components, resulting solely from lower GDP inflation (assuming that the CPI moves in line with GDP inflation), lowers the budgetary balance by $2.2 billion in the first year, $2.2 billion in the second year, and $1.5 billion in the fifth year (Table A1.10).
- Lower prices result in lower nominal income and, as a result, personal income tax revenues decrease. As the parameters of the personal income tax system are indexed to inflation, the fiscal impact is smaller than under the real shock. For the other sources of tax revenue, the negative impacts are similar under the real and nominal GDP shocks.
- EI premium revenues decrease in response to lower earnings.
- Other revenues decline slightly as lower prices lead to lower revenues from the sales of goods and services.
- Partly offsetting lower revenues are the declines in the cost of statutory programs that are indexed to inflation, such as elderly benefit payments, which puts downward pressure on federal program expenses. In addition, other program expenses are also lower as certain programs are linked directly to growth in wages and nominal GDP.
- Public debt charges decline in the first year due to lower costs associated with Real Return Bonds.
| Year 1 | Year 2 | Year 5 | |
|---|---|---|---|
| Federal revenues | -0.5 | 0.9 | 3.6 |
| Federal expenses | 4.4 | 6.7 | 10.0 |
Of which: public debt charges |
4.4 | 6.7 | 10.0 |
| Budgetary balance | -4.9 | -5.8 | -6.4 |
A 1 per cent increase in interest rates decreases the budgetary balance by $4.9 billion in the first year, $5.8 billion in the second year, and $6.4 billion in the fifth year (Table A1.11). Higher interest rates directly impact estimated public debt charges on marketable debt in two ways. First, interest costs increase as existing debt matures and is refinanced at higher rates. Second, rising rates increase the expected cost of future borrowing needs. Public debt charges are estimated based on the current expectations for future changes in interest rates, which are subject to change based on economic conditions.
It is important to note that interest rates also directly affect other government revenue and expenses and that they typically do not change in isolation. That is, with higher interest rates, the government would realize some offsetting benefits, including:
- Higher revenues from the government’s interest-bearing assets, which are recorded as part of other revenues;
- Corresponding downward adjustments that reduce public sector pensions and employee benefits obligations, which are not incorporated in the table above; and,
- Higher government tax revenues if interest rate increases were due to stronger economic growth (also not included in the table above).
Even with a 1 per cent increase in interest rates, public debt charges are sustainable and would remain near historic lows as a proportion of GDP. Further discussion of historical and forecasted public debt charges can be found in Chapter 3 (Chart 3.4).
Policy Actions Taken since the 2021 Budget
Since 2016, the government has provided a transparent overview of all off-cycle spending. The investments (Table A1.12) ensure that Canadians are continually well served by the programs they rely on and that government operations carry on as usual.
| 2021– 2022 |
2022– 2023 |
2023– 2024 |
2024– 2025 |
2025– 2026 |
2026– 2027 |
|
|---|---|---|---|---|---|---|
| Government Operations, Fairness and Openness | 14 | 249 | 162 | 140 | 164 | 143 |
| Financial restructuring of the Lower Churchill Projects | 14 | 14 | 13 | 13 | 12 | 12 |
| Implementation of the Agreement in Principle on the financial restructuring for the Lower Churchill Projects between the Government of Canada and the Government of Newfoundland and Labrador signed July 28, 2021. Measures include: 1) a $1 billion investment in the province’s portion of the Projects’ Labrador–Island Link; 2) a third federal loan guarantee of $1 billion for the Projects’ Muskrat Falls and Labrador Transmission Assets; and 3) a waiver of the guarantee fee for the second federal loan guarantee entered into May 10, 2017. | ||||||
| Transfer of Hibernia Net Profits Interest (NPI) and Incidental Net Profits Interest (INPI) Net Revenues to Newfoundland and Labrador | 0 | 235 | 148 | 127 | 151 | 131 |
| Implementation of the Government of Canada’s commitment to make annual transfers to the Government of Newfoundland and Labrador equivalent to Canada’s yearly net revenue from the Hibernia offshore oil project Net Profit Interest (NPI) and Incidental Net Profit Interest (INPI), as announced on July 28, 2021. This is subject to a legislative appropriation which will be forthcoming. | ||||||
| Supporting the City of Burnaby’s Emergency Response Capacity | 2 | 2 | 2 | 2 | 2 | 2 |
Less: Funds Sourced From Existing Departmental Resources |
-2 | -2 | -2 | -2 | -2 | -2 |
| Funding from Pacific Economic Development Canada to provide support to the City of Burnaby to increase their emergency response capacity through the establishment of a new fire hall. | ||||||
| Growth, Innovation, Infrastructure and the Environment | -1,593 | 64 | 397 | 219 | 200 | 155 |
| Historic Investments in Canada's Natural Legacy | 6 | 12 | 24 | 21 | 19 | 0 |
| Funding provided to the Parks Canada Agency to support conservation activities. | ||||||
| Encourage Canadians to Take Environmental and Climate Change Action | 6 | 0 | 0 | 0 | 0 | 0 |
| Funding for Environment and Climate Change Canada to encourage Canadians to take concrete actions that will help fight climate change and achieve a cleaner and safer environment. | ||||||
| Support to the Confederation Bridge Operator | 3 | 0 | 0 | 0 | 0 | 0 |
| Funding proposed for Transport Canada to cover toll revenue shortfalls on the Confederation Bridge related to decreased traffic due to the COVID-19 pandemic, as announced on August 12, 2021. Funding will enable the operator, Strait Crossing Bridge limited, to avoid increasing tolls to recover losses. | ||||||
| Support for Ocean Networks Canada | 9 | 0 | 0 | 0 | 0 | 0 |
| Funding proposed for Fisheries and Oceans Canada to support Ocean Networks Canada, an initiative of the University of Victoria, with their ocean research and observation activities to help protect Canada’s oceans, as announced on August 11, 2021. Ocean observation will help support the sustainable management of the ecosystems and species that Canadians depend on for our livelihood, safety and culture. This will help provide the information we need to overcome modern ocean challenges – like warming oceans, rising sea levels and ocean acidification. | ||||||
| Contributing Canadian-made Technology to the International Square Kilometre Array Observatory | 3 | 13 | 0 | 0 | 0 | 0 |
Less: Funds Sourced From Existing Departmental Resources |
-3 | 0 | 0 | 0 | 0 | 0 |
| The Square Kilometre Array Observatory is a partnership among over a dozen countries to build the world's largest radio telescope, involving thousands of dishes located in South Africa and Australia to provide astronomers images of large areas of sky with unprecedented detail. Funding would support Canada’s continued status as observer in the partnership and support the development and provision of advanced processing technology to this groundbreaking endeavor. | ||||||
| Old Port of Montréal Revitalization | 0 | 11 | 18 | 15 | 9 | 0 |
| Approval for Canada Lands Company to implement the initial phase of the Old Port of Montréal Master Plan, funded through the reallocation of planned dividends to the federal government. This initiative, announced on August 13, 2021, will revitalize the site, improve green and public spaces, and enhance visitor safety and accessibility. | ||||||
| Modernizing Rail Safety and Security | 41 | 28 | 20 | 7 | 7 | 0 |
| Funding proposed for Transport Canada to further improve the safety and security of Canada's rail system, as announced on August 13, 2021. This will help advance the safe and secure transportation of people and goods by rail in Canada. | ||||||
| AgriRecovery funding to support farmers facing extreme weather | 400 | 0 | 0 | 0 | 0 | 0 |
| Funding authorized for Agriculture and Agri-Food Canada to help farmers in Ontario and Western Canada pay for the extraordinary costs created by the historical drought they faced during Summer 2021. | ||||||
| Price and Volume Protection for Real Federal Property | 2 | 107 | 107 | 107 | 107 | 107 |
| Funding for Public Services and Procurement Canada to maintain current office, common use accommodation, and related real property service levels for federal departments and agencies. | ||||||
| Delivering Climate Action Incentive Payments Quarterly | -2,085 | -150 | 95 | 20 | 10 | 0 |
| Canada Revenue Agency Administrative Costs | 15 | 53 | 50 | 48 | 48 | 48 |
| Under the government’s proposal, starting in July 2022, individuals in backstop provinces will receive Climate Action Incentive payments quarterly through the benefit system (first announced in Budget 2021). This will provide payments on a more regular basis. This change results in a positive fiscal impact upfront strictly owing to accounting differences in the treatment of payments delivered through the benefit system, compared to the T1 system previously. On a cash basis all proceeds raised are returned to Canadians from the federal pollution pricing framework to the jurisdiction of origin, as has always been the approach of the government. In addition, funding is also proposed for the Canada Revenue Agency to continue administering these payments. | ||||||
| Returning the proceeds from the price on pollution directly to farmers | 34 | 107 | 80 | 0 | 0 | 0 |
| Canada Revenue Agency Administrative Costs | 3 | 4 | 2 | |||
Less: Funds Previously Provisioned in the Fiscal Framework |
-100 | -122 | 0 | 0 | 0 | 0 |
| Consistent with the government’s Budget 2021 commitment, starting for the 2021-22 fuel charge year, it is proposed that a portion of proceeds from the price on pollution be returned directly to eligible farming businesses in backstop provinces via refundable tax credits. In addition, funding is also proposed for the Canada Revenue Agency to administer these credits. | ||||||
| Support for Reliable Transportation in Northern Manitoba | 30 | 10 | 0 | 0 | 0 | 0 |
Less: Funds Sourced From Existing Departmental Resources |
-30 | -10 | 0 | 0 | 0 | 0 |
| Funding provided to Indigenous Services Canada to support urgent repairs and maintenance on the Hudson Bay Railway by the Indigenous-owned Arctic Gateway Group Limited Partnership, as announced on August 6, 2021. This will preserve transportation links for both people and essential goods between remote communities in northern Manitoba and the rest of Canada and expand economic opportunities for communities in the North. | ||||||
| Top-up for the Incentives for Zero-Emission Vehicles Program | 73 | 0 | 0 | 0 | 0 | 0 |
| Funding proposed for Transport Canada for the Incentives for Zero-Emission Vehicles program. This will allow Transport Canada to continue offering purchase incentives for zero emission vehicles until the end of March 2022. | ||||||
| Labour Markets, Health, Safety and Economic Prosperity of Canadians | 336 | 198 | 52 | 32 | 11 | 1 |
| Supporting the Public Inquiry into the Nova Scotia Tragedy | 11 | 1 | 0 | 0 | 0 | 0 |
| Additional funding for the Privy Council Office, to support a joint federal-provincial public inquiry into the April 2020 tragedy in Nova Scotia. | ||||||
| Procurement Strategy for Indigenous Business | 3 | 9 | 9 | 8 | 8 | 0 |
| Funding provided for Indigenous Services Canada and the Treasury Board Secretariat to work to meet Canada’s target of 5 per cent of federal contracts being awarded to businesses managed and led by Indigenous peoples as announced on August 6, 2021. The funding will be used to modernize the Procurement Strategy for Aboriginal Business, engage and consult with Indigenous partners and rights holders, and implement a reporting framework. | ||||||
| New support for child and family services in Cowessess First Nation | 25 | 13 | 0 | 0 | 0 | 0 |
Less: Funds Sourced From Existing Departmental Resources |
-4 | -1 | 0 | 0 | 0 | 0 |
| Funding proposed for Indigenous Services Canada to support a coordination agreement with Cowessess First Nation to exercise jurisdiction over child and family services under An Act respecting First Nations, Inuit and Métis children, youth and families, as announced on July 6, 2021. | ||||||
| Addressing the legacy of residential schools | 164 | 131 | 9 | 13 | 3 | 0 |
| Funding is proposed for the departments of Canadian Heritage, Crown-Indigenous Relations and Indigenous Services Canada to further address the tragic legacy of residential schools. Funding will allow more Indigenous communities to undertake the work to locate, document and commemorate the burials of children who died while attending residential schools, enhance residential schools commemoration activities, install a National Residential Schools Monument, increase access to trauma-informed health and cultural support services and support the demolition and rehabilitation of residential school sites, as announced on August 10, 2021. | ||||||
| Modernization of the Official Languages Act | 0 | 16 | 0 | 0 | 0 | 0 |
| Funding proposed for Canadian Heritage, the Treasury Board Secretariat, the Commissioner of Official Languages, and Immigration, Refugees and Citizenship Canada to support the implementation of the proposed An Act for the Substantive Equality of French and English and the Strengthening of the Official Languages Act, upon Royal Assent. | ||||||
| Supporting the Construction of the New Library and Archives/Ottawa Public Library Joint Facility Project | 0 | 0 | 0 | 0 | 1 | 1 |
| Funding provided to Library and Archives Canada to address updated construction cost estimates to build a new facility in collaboration with the City of Ottawa and Ottawa Public Library, as announced on October 27, 2021. This new facility will house part of Library and Archives Canada's public services and programs in the National Capital Region. | ||||||
| Funding for British Columbia Homelessness Initiatives | 120 | 0 | 0 | 0 | 0 | 0 |
| Funding proposed for Employment and Social Development to support the Government of British Columbia's provincially-led homelessness initiatives. This will help the province provide temporary housing, reduce crowding in existing homelessness shelters, and provide safe isolation spaces for vulnerable populations and individuals experiencing homelessness until permanent housing is available. | ||||||
| Supporting those Affected by British Columbia Wildfires | 5 | 0 | 0 | 0 | 0 | 0 |
| Funding for Public Safety Canada to match donations to the Canadian Red Cross British Columbia Fires Appeal Fundraising Campaign. The campaign supported relief efforts for those affected by the fires, and will contribute to longer-term recovery, as announced on July 11, 2021. | ||||||
| Accelerating the Work to Implement Pharmacare in Prince Edward Island | 3 | 11 | 11 | 11 | 0 | 0 |
| Funding proposed for Prince Edward Island to accelerate the implementation of national universal pharmacare in the province, as announced on August 11, 2021. This will allow the province to add new drugs to its list of covered drugs and lower out of pocket costs for drugs covered under existing public plans for Island residents. | ||||||
| Investing in a Sustainable Pesticide Regulatory System | 9 | 18 | 23 | 0 | 0 | 0 |
| Funding proposed for Health Canada, Agriculture and Agri-Food Canada and Environment Canada to strengthen the Pest Management Regulatory Agency, including increasing the availability of independent data to further support pesticide review decisions. Funding will also support work to accelerate the research, development and adoption of alternative pest management solutions. This measure was announced on August 4, 2021. | ||||||
| Trade, International Relations and Security | 358 | 379 | 340 | 414 | 490 | 41 |
| Increased Contributions for the Service Income Security Insurance Plan | 109 | 26 | 26 | 26 | 26 | 26 |
| Funding proposed for the Department of National Defence to cover increased contributions under the Service Income Security Insurance Plan, the long-term disability plan for members of the Canadian Armed Forces, to reflect salary increases for Canadian Armed Forces members. This will ensure that disabled veterans receive the benefits to which they are entitled. | ||||||
| Canada’s International Climate Finance | 553 | 620 | 684 | 749 | 846 | 0 |
Less: Funds Previously Provisioned in the Fiscal Framework |
-200 | -179 | -200 | -200 | -200 | 0 |
Less: Funds Sourced From Existing Departmental Resources |
-204 | -225 | -204 | -204 | -204 | 0 |
| Funding proposed for Global Affairs Canada and Environment and Climate Change Canada to support developing countries in combatting climate change and adapting to its harmful consequences, as announced at the G7 Leader's Summit on June 13, 2021. This contribution will help facilitate the transition to sustainable, low-carbon, climate-resilient, nature-positive and inclusive development. | ||||||
| Contributing to the Global Partnership for Education and to other international assistance priorities | 100 | 100 | 60 | 60 | 60 | 0 |
Less: Funds Sourced From Existing Departmental Resources |
0 | 0 | -60 | -60 | -60 | 0 |
| Funding proposed for Global Affairs Canada to support Canada’s pledge to the Global Partnership for Education and for other international assistance priorities, as announced at the G7 Leaders' Summit on June 13, 2021. This contribution will help build stronger education systems, as well as to improve the volume, quality and efficiency of domestic resources for education in the world’s poorest countries. These resources will also support other international assistance priorities. | ||||||
| Humanitarian Assistance for West Bank and Gaza | 22 | 3 | 0 | 0 | 0 | 0 |
Less: Funds Sourced From Existing International Assistance Envelope – Crisis Pool Resources and Other Departmental Resources |
-22 | -3 | 0 | 0 | 0 | 0 |
| Funding allocated to Global Affairs Canada to support Palestinian civilians in West Bank and Gaza, as announced on May 28, 2021. These funds were provided to United Nations agencies and other organizations with proven track records of delivering assistance effectively and in accordance with Canadian requirements. Funding is sourced from existing International Assistance Envelope – Crisis Pool resources and other departmental resources. | ||||||
| International Commitment on Care Work | 10 | 15 | 35 | 20 | 20 | 0 |
Less: Funds Sourced From Existing International Assistance Envelope – Strategic Priorities Funds Resources and Other Departmental Resources |
-10 | -15 | -35 | -20 | -20 | 0 |
| Funding proposed for Global Affairs Canada to support Canada’s international commitment on care work, as announced at the Generation Equality Forum on June 30-July 2, 2021. This contribution will support the empowerment and socio-economic well-being of women and girls in developing countries, through a more equal distribution of care responsibilities. Funding is sourced from existing International Assistance Envelope – Strategic Priorities Fund resources and other departmental resources. | ||||||
| Responding to Global Food Crises | 150 | 0 | 0 | 0 | 0 | 0 |
Less: Funds Sourced From Existing International Assistance Envelope – Crisis Pool Resources and Other Departmental Resources |
-150 | 0 | 0 | 0 | 0 | 0 |
| Funding allocated for Global Affairs Canada to respond to global food crises, as announced on August 13, 2021. These resources will provide food and nutrition focused humanitarian assistance in the world’s poorest countries. Funding is sourced from existing International Assistance Envelope – Crisis Pool resources and other departmental resources. | ||||||
| Renewing Canada’s Engagement in UN Peace Operations | 0 | 47 | 43 | 53 | 22 | 15 |
Less: Funds Sourced From Existing Departmental Resources |
0 | -10 | -10 | -10 | 0 | 0 |
| Funding proposed for Global Affairs Canada to renew Canada’s engagement in United Nations peace operations. This will allow Canada to shape United Nations peace operations to make them more effective and inclusive, while preventing conflict and supporting peacebuilding efforts. A portion of the funding is sourced from existing departmental resources. | ||||||
| Tax and Financial Sector Policy | 0 | 30 | 25 | 25 | 25 | 25 |
| Reduction in Underused Housing Tax Revenues Resulting from Vacation Property Exemption | 0 | 30 | 25 | 25 | 25 | 25 |
| Budget 2021 announced the government’s intention to implement a national, annual 1-per-cent tax on the value of non-resident, non-Canadian owned residential real estate in Canada that is considered to be vacant or underused. It is proposed that the tax be effective for the 2022 calendar year. The government also plans to bring forward an exemption for certain vacation/recreational properties that would be effective for the 2022 calendar year. | ||||||
| (Net) Fiscal Impact of Non-Announced Measures since Budget 2021 | 2,729 | 2,109 | 1,001 | 750 | 814 | 460 |
| The net fiscal impact of measures that are not announced is presented at the aggregate level, and would include provisions for anticipated Cabinet decisions not yet made (including the use of such provisions from previous budgets or updates) and funding decisions related to national security, commercial sensitivity, contract negotiations and litigation issues. | ||||||
| Net Fiscal Impact – Total Policy Actions Taken Since Budget 2021 | 1,843 | 3,029 | 1,976 | 1,580 | 1,704 | 825 |
|
Note: Totals may not add due to rounding. |
||||||
Canada’s COVID-19 Economic Response Plan
Since March 2020, the government has committed over $346 billion – 15.7 per cent of 2020 GDP – to support Canadians through the pandemic, with major investments in health care, procuring vaccines and personal protective equipment, in income support, and responding to businesses’ urgent needs. Altogether, these investments by the federal government represent 8 out of every 10 dollars provided in Canada to fight COVID-19 and support Canadians.
Table A1.13 below updates the overview of Canada’s COVID-19 Economic Response Plan detailed in Chapters 1 and 2 of the Fall Economic Statement 2020, with new COVID response measures included in this Economic and Fiscal Update.
| Net Fiscal Impact (Accrual) | |||||
|---|---|---|---|---|---|
| Impact Value1 | 2019– 2020 |
2020– 2021 |
2021– 2022 |
Future Years2 |
|
| Protecting Health and Safety | |||||
| Safe Restart Agreement | 19,909 | - | 19,909 | - | - |
| Safe Return to Class | 2,000 | - | 2,000 | - | - |
| Vaccines and Therapeutics | 14,340 | - | 7,520 | 6,530 | 826 |
| PPE and Medical Equipment | 5,352 | 200 | 3,331 | 1,821 | 289 |
| Long-Term Care | 1,340 | - | 824 | 516 | 1 |
| Helping Health Care Systems Recover | 4,000 | - | 4,000 | - | - |
| Canada’s COVID-19 Immunization Plan | 1,000 | - | 1,000 | - | - |
| Other Public Health Support | 11,445 | 382 | 6,830 | 3,877 | 431 |
| Enhanced Border and Quarantine Measures3 | 894 | - | - | 894 | - |
| Vaccines Mandates - Core Public Administration and the Royal Canadian Mounted Police5 | 86 | - | - | 86 | 113 |
| Vaccines Mandates – Making Travel Safer | 5 | - | - | 5 | 33 |
| Rapid Tests | 1,450 | - | - | 1,450 | - |
| Additional COVID-19 Therapeutics Procurement | 1,000 | - | - | 1,000 | 1,000 |
| Improving Ventilation in Schools and Community Buildings — Safe Return to Class Fund | 110 | - | - | 110 | - |
| Support for Proof of Vaccination — Proof of Vaccination Fund | 300 | - | - | 300 | - |
| Omicron Variant Response | 500 | - | - | 500 | - |
| Total - Protecting Health and Safety | 63,730 | 582 | 45,414 | 17,089 | 2,694 |
Of which: |
|||||
Policy Actions in Budget 2021 |
59,385 | 582 | 45,414 | 12,744 | 1,547 |
Policy Actions Since Budget 2021 |
980 | - | - | 980 | 113 |
Policy Actions in EFU 2021 |
3,365 | - | - | 3,365 | 1,033 |
| Direct Support Measures | |||||
| Canada Emergency Wage Subsidy | 100,495 | - | 80,166 | 20,329 | - |
Budget 2021 |
110,545 | - | 84,590 | 25,955 | - |
Revised estimate |
99,655 | - | 80,166 | 19,489 | - |
Difference |
-10,890 | - | -4,424 | -6,466 | - |
Extension announced July 30, 2021 |
840 | - | - | 840 | - |
Canada Emergency Rent Subsidy and Lockdown Support |
8,015 | - | 4,045 | 3,970 | - |
Budget 2021 |
8,405 | - | 4,065 | 4,340 | - |
Revised estimate |
7,775 | - | 4,045 | 3,730 | - |
Difference |
-630 | - | -20 | -610 | - |
Extension announced July 30, 2021 |
240 | - | - | 240 | - |
Canada Emergency Response Benefit |
70,671 | 6,505 | 64,166 | - | - |
Budget 2021 |
73,056 | 6,505 | 66,551 | - | - |
Revised estimate |
70,761 | 6,505 | 64,166 | - | - |
Difference |
-2,385 | - | -2,385 | - | - |
Enhancements to Employment Insurance |
13,133 | - | 3,240 | 9,893 | 2,954 |
Budget 2021 |
13,046 | - | 3,240 | 9,806 | 2,905 |
Extension announced July 30, 2021 |
87 | - | - | 87 | 50 |
Canada Recovery Benefit |
28,661 | - | 14,442 | 14,212 | 76 |
Budget 2021 |
26,794 | - | 14,462 | 12,332 | 69 |
Revised estimate |
26,787 | - | 14,442 | 12,345 | 69 |
Difference |
-7 | - | -20 | 13 | 0 |
Extension announced July 30, 2021 |
1,875 | - | - | 1,868 | 7 |
Canada Recovery Sickness Benefit |
1,383 | - | 419 | 864 | 115 |
Budget 2021 |
738 | - | 456 | 282 | 15 |
Revised estimate |
759 | - | 419 | 340 | 15 |
Difference |
21 | - | -37 | 58 | - |
Extension announced July 30, 2021 |
86 | - | - | 85 | 1 |
Extension announced October 21, 20214 |
538 | - | - | 439 | 99 |
Canada Recovery Caregiver Benefit |
5,273 | - | 1,967 | 2,986 | 341 |
Budget 2021 |
3,546 | - | 1,953 | 1,593 | 22 |
Revised estimate |
3,537 | - | 1,967 | 1,570 | 22 |
Difference |
-9 | - | 14 | -23 | - |
Extension announced July 30, 2021 |
218 | - | - | 217 | 1 |
Extension announced October 21, 20214 |
1,517 | - | - | 1,199 | 318 |
Canada Emergency Business Account - Incentive |
14,076 | - | 13,085 | 992 | - |
Budget 2021 |
13,822 | - | 12,618 | 1,205 | - |
Revised estimate |
14,076 | - | 13,085 | 992 | - |
Difference |
254 | - | 467 | -213 | - |
Other Direct Support Measures (FES 2020) |
|||||
Budget 2021 |
36,289 | 106 | 31,206 | 3,604 | 1,916 |
Revised estimate |
33,234 | 106 | 28,151 | 3,604 | 1,916 |
Difference |
-3,055 | - | -3,055 | - | - |
Targeting Supports for Businesses Affected by the Pandemic4,5 |
3,185 | - | - | 3,010 | 175 |
Additional Human Health Resources5 |
80 | - | - | 80 | - |
Help for Students Affected by CERB Payments |
68 | - | - | 68 | - |
Small Businesses Air Quality Improvement Tax Credit |
15 | - | - | 15 | 226 |
Enhanced Support for Teachers |
4 | - | - | 4 | 15 |
Omicron Variant Response |
4,000 | - | - | 4,000 | - |
| Total - Direct Support Measures | 282,294 | 6,611 | 209,681 | 64,027 | 5,818 |
Of which: |
|||||
Policy Actions in Budget 2021 |
286,242 | 6,611 | 219,141 | 59,117 | 4,926 |
Impact of re-estimated costs |
-16,702 | - | -9,460 | -7,242 | 0 |
Policy Actions since Budget 20214 |
8,667 | - | - | 8,065 | 651 |
Policy Actions in EFU 2021 |
4,087 | - | - | 4,087 | 241 |
| Total-Protecting Health and Safety and Direct Support Measures | 346,024 | 7,193 | 255,095 | 81,116 | 8,512 |
| Tax and Customs Duty Payment Liquidity (in FES 2020) | 85,050 | 56 | 2,938 | 15 | -5 |
| Business Credit Availability Program and Other Credit Liquidity Support | 80,571 | - | 5,073 | 4,051 | 2,666 |
Of which: |
|||||
Policy Actions in Budget 2021 |
81,889 | - | 5,989 | 4,453 | 2,592 |
Impact of re-estimated costs |
-1,319 | - | -916 | -402 | 75 |
| Total- COVID-19 Economic Response Plan | 511,644 | 7,249 | 261,753 | 85,182 | 11,173 |
Of which: |
|||||
Policy Actions in Budget 20216 |
512,567 | 7,249 | 272,129 | 76,329 | 9,060 |
Impact of re-estimated costs |
-18,021 | - | -10,376 | -7,644 | 85 |
Policy Actions since Budget 20214 |
9,646 | - | - | 9,045 | 764 |
Policy Actions in EFU 2021 |
7,452 | - | - | 7,452 | 1,274 |
|
Note: Numbers may not add due to rounding. 1 The impact value reflects projected cash expenditures and liquidity support over the 2019-20 to 2021-22 period. Measures listed in footnote 4 also include projected expenditures in 2022-23 (totalling $592 million). The impact value is higher than the fiscal (budgetary) impact on an accrual basis, owing to cash-accrual accounting differences, and the fact that some of these measures relate to loans and tax deferrals, for which only provisions for potential losses, and forgone interest and penalties would affect the budgetary balance, respectively. Of note, these figures do not include all adjustments to spending profiles that may have occurred since they were announced, as a result of operational requirements (for instance, timing of actual payments, particularly for health expenditures). 2 2022-2023 to 2025-2026 3 Re-classified as a COVID-19 Economic Response Measure following Budget 2021. 4 Impact values of the Canada Recovery Sickness Benefit, Canada Recovery Caregiving Benefit and Targeting Supports for Businesses Affected by the Pandemic announced on October 21, 2021 include costs in 2022-2023 as these programs would be available until May 7, 2022 under proposed legislation. 5 Announced since Budget 2021. 6 Net fiscal impact, after amounts provisioned in the 2020 Economic and Fiscal Snapshot for Anticipated Decisions. |
|||||
Report a problem on this page
- Date modified: