
Chapter 1 - Economic and Fiscal Update
Introduction
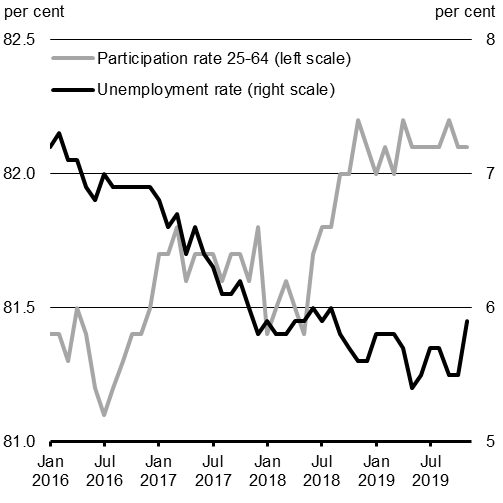
Despite challenging global conditions that include softer global growth and a rise in international trade disputes, Canada's economy continues to grow at a solid pace. Labour market conditions in Canada are strong, with historically low unemployment rates recorded this year and historically high numbers of Canadians working (as a share of the working-age population) (Chart 1.1). Tighter labour markets have translated into stronger wage growth—bolstering consumer confidence and helping to keep Canada's economy strong and growing.
Following some temporary weakness in late 2018 and early 2019—particularly in the mining, oil and gas sector—economic growth in Canada is on track to average 1.7 per cent in 2019 and 1.6 per cent in 2020. As a result, Canada is expected to be the second-fastest-growing economy in the Group of Seven (G7) in both 2019 and 2020.
Canada will continue to be a G7 leader in economic growth, underpinned by strong job creation
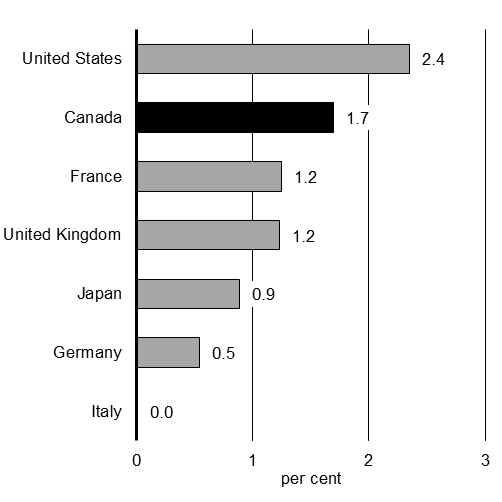
Source: Statistics Canada.
Recent Economic Developments
Global Economic Developments
After peaking in early 2018, global economic activity has moderated significantly, with growth restrained by several factors, including fading fiscal stimulus in the United States, rising international trade tensions and ongoing geopolitical uncertainty. These elements, together with concerns about softer longer-term growth prospects, are weighing on industrial production and commodity prices, and putting downward pressure on long-term interest rates (Chart 1.2).
In response to these developments, some major central banks have cut rates, injected liquidity and introduced asset purchase programs to support short-term growth in their domestic economies. These actions have had a positive effect, but there remains an ongoing risk that underlying weakness in the global manufacturing sector will spill over into the broader global economy and negatively impact growth prospects.
The global growth slowdown has put pressure on central banks to refuel economic activity
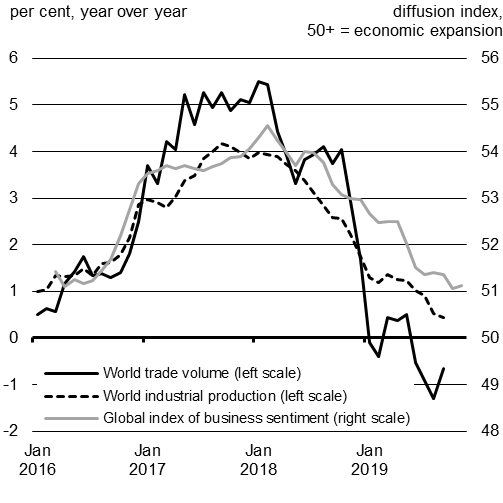
Sources: CPB World Trade Monitor—July 2019; Bloomberg; J.P. Morgan.
Source: Haver Analytics.
In the U.S., economic growth is gradually slowing to a more normal pace after a few years of strong activity fuelled by stimulus spending. In other parts of the world, the growth slowdown is more pronounced. In China, real GDP growth has reached its slowest pace since official records for quarterly growth started in 1992. In Europe, economic activity remained sluggish in the third quarter of 2019 as the region continues to grapple with a sharp slowdown in industrial production—particularly in Germany—and lingering uncertainty around the potential exit of the United Kingdom from the European Union.
At the same time, there are also fundamental structural shifts taking place in the global economy, which may have long-lasting impacts on future global economic growth. Increases in trade tariffs and related retaliatory measures have prompted many businesses to re-evaluate and reconfigure their production and supply chain processes across countries. Over time, this may result in rising costs for producing goods and services while at the same time reducing economic output. These structural changes could result in lower global growth, particularly when paired with other challenges—including those posed by an aging population, slower labour force growth, and the trend toward slower productivity growth observed in recent decades across G7 economies (Chart 1.3).
Global economies face greater risk of low growth
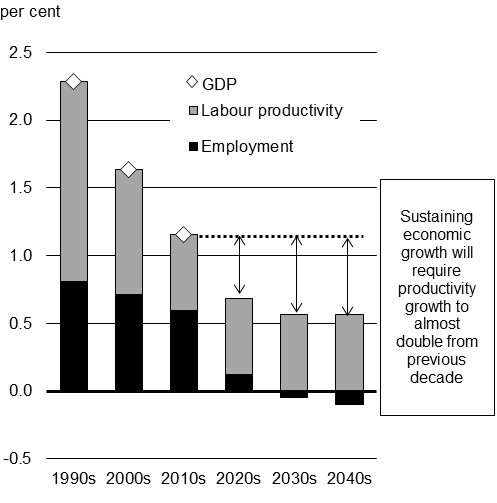
Sources: OECD Economic Outlook, July 2018; Department of Finance Canada calculations and assumptions for the projection period.
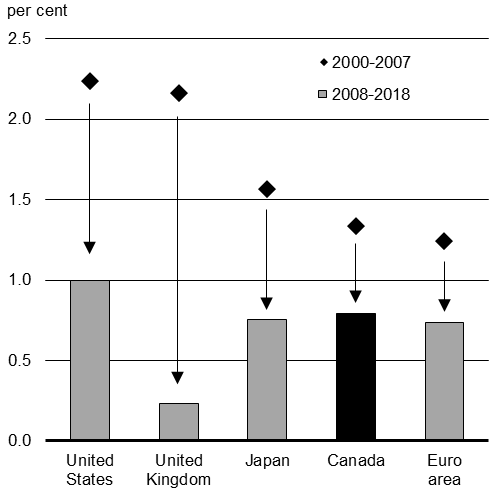
Source: Organisation for Economic Co-operation and Development (OECD) database.
Canadian Economic Developments
Canada's economy has continued to perform well, even in a context that includes slowing global growth and ongoing trade disruptions. Over the past four years, strong employment gains and rising household incomes have helped Canadian consumers feel generally confident about the future—supporting broader economic growth. However, the benefits of growth have been uneven across the country, with people living in regions facing economic challenges—such as the Prairies—feeling generally less positive about their personal economic situations.
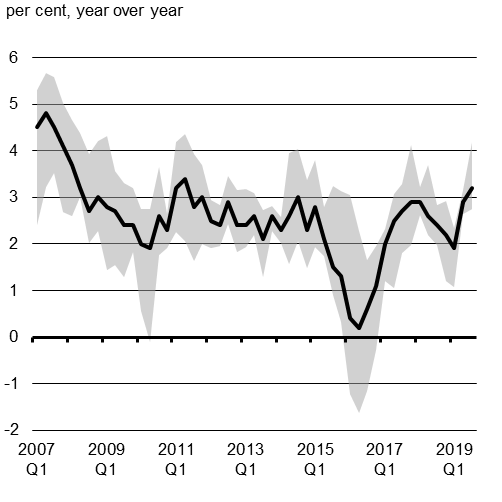
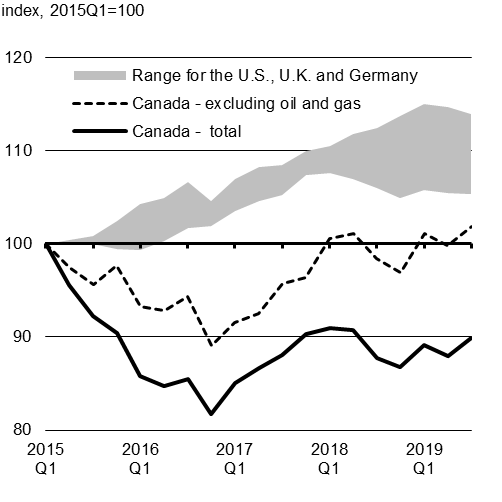
At the same time, while Canadian businesses have faced challenges in recent years—such as pipeline capacity constraints and tariffs on aluminum and steel—indicators of business confidence remain modestly positive, bolstered by opportunities created by stronger domestic sales and ongoing growth in U.S. demand. Economic activity slowed temporarily starting in late 2018, stemming in part from acute crude oil transportation constraints followed by mandated crude oil production cuts in Alberta. The Canadian economy was then able to recover quickly, supported by continued growth in the services sector (Chart 1.4).
Recent uneven economic growth driven by weakness in Canada's energy sector
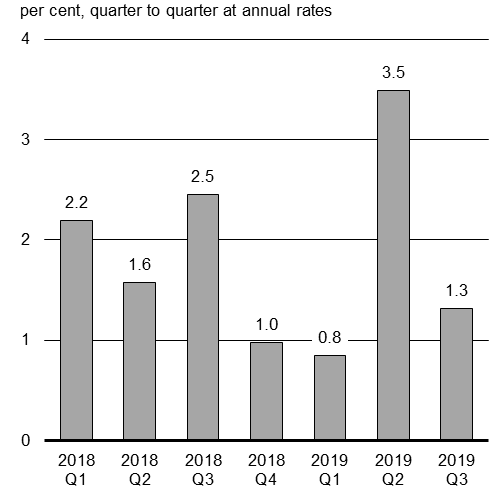
Source: Statistics Canada.

Sources: Statistics Canada; Department of Finance Canada calculations.
So far in 2019, employment has risen by nearly 400,000 from its 2018 level, its strongest growth since 2007 (Chart 1.5) even when factoring in the loss of 71,000 jobs in November. As a result, for this year as a whole, the unemployment rate is on pace to reach its lowest level in more than 40 years. The labour force participation rate of working-age Canadians has reached an all-time high this year, reflecting increasing integration of women in the labour market.
In addition to strong employment gains, wages have increased. Robust gains are seen across all major wage groups and, if current trends continue, 2019 could mark the strongest year of wage growth in close to a decade. Sustaining this employment growth and wage gains will be important to supporting incomes for Canadian households.
The pace of job creation, and wage growth, are on the rise
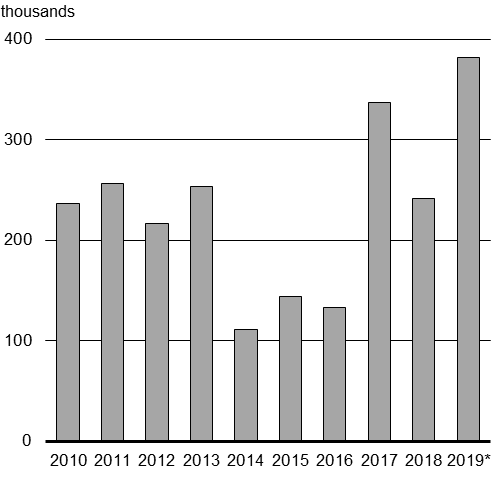
Source: Statistics Canada.
Sources: Statistics Canada; Department of Finance Canada calculations.
As it has throughout Canada's history, immigration has also played an important role in giving Canada a strong labour market, and a strong economy. Since 2015, newcomers have accounted for more than three-quarters of Canada's population growth. As a result, Canada's population is growing at its fastest pace in more than 20 years and at a pace well above that of other G7 economies (Chart 1.6). Since 2015, Canada has also seen more new Canadians join the workforce, helping to drive stronger economic growth that benefits everyone.
Immigration is contributing to stronger labour force and employment growth
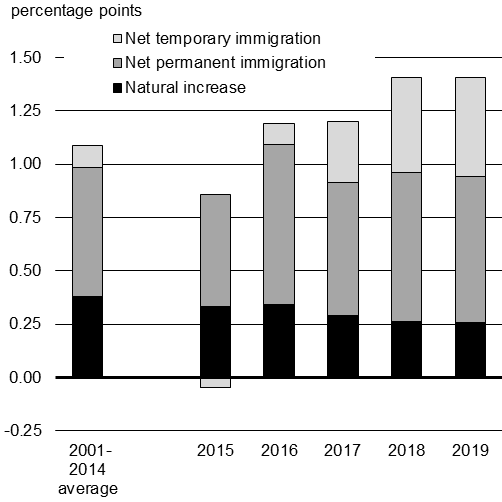
Sources: Statistics Canada; Department of Finance Canada calculations.

Across Canada, home resales have begun to rebound in recent months and have been particularly robust in Montréal and Toronto (Chart 1.7). House prices have also started to pick up, with price growth in Toronto reaching 10 per cent and prices in Vancouver rising again following declines since spring 2018.
Affordability remains a challenge for many people who would like to buy a home. Prices are remaining at relatively high levels in Toronto and Vancouver, driven largely by their limited housing supply response in a climate of strong demand. House prices in Calgary remain soft, as the relatively weak economic recovery and continuing challenges in the energy sector have resulted in an oversupply of housing.
Housing markets are recovering following a period of adjustment

Source: Canadian Real Estate Association.

Source: Canadian Real Estate Association.
Growth remains uneven across regions of the country, largely reflecting challenges facing the oil and gas sector (see box entitled "Challenges and Opportunities for the Canadian Oil and Gas Sector"). Real GDP growth was positive in virtually all provinces in 2018, despite more limited momentum in provinces still affected by the oil price shock. Employment gains over the last four years have been broad-based but unemployment rates remain elevated in some provinces (Chart 1.8).
Economic indicators suggest weaker momentum in some provinces


Source: Statistics Canada.
Challenges and Opportunities for the Canadian Oil and Gas Sector
Canada's oil and gas sector plays an important role in both our national economy and in global commodity markets. When producers face challenges—particularly those in Alberta and Saskatchewan—Canada's entire economy feels the effect. Oil and gas extraction, including related support activities and investment, accounted for roughly 5 per cent of Canada's GDP and 14 per cent of Canada's total exports in 2018. Beyond this economic contribution, the sector is also an important source of business opportunities and good, well-paying jobs for many Canadians, including those in rural and Indigenous communities.
Moreover, Canadian energy firms are becoming more competitive, through significantly reducing production costs across a broad range of operations (including several oil sands extraction and upgrading projects). Most importantly, the carbon intensity, or greenhouse gas emissions per barrel, of oil produced in Canadian oil sands has been cut by 21 per cent between 2009 and 2017. Through Canada's Oil Sands Innovation Alliance, Canadian producers have invested more than $1.4 billion in technologies to reduce greenhouse gas emissions and better manage water, tailings and land—delivering a steady improvement that must be maintained as Canada transitions to a low-carbon future.
While global market opportunities exist for the Canadian energy sector, it continues to face ongoing transportation constraints that make it difficult to get its products to world markets. Insufficient export pipeline infrastructure is reducing Canadian crude oil and natural gas prices, meaning lower profits for producers, reduced investment within the industry, fewer good, well-paying jobs for Canadian workers, and lost revenues at all levels of government. These challenges are expected to persist until major projects, such as the Trans Mountain Expansion and LNG Canada, are completed.
Construction of the Trans Mountain Expansion Project resumed in August 2019 and construction work is now well underway at the Burnaby Terminal, the Westridge Marine Terminal and the Edmonton Terminal. There is also work happening along the right-of-way in the greater Edmonton area and west of Edmonton, with more than 2,200 people currently working on the project. At peak construction, there are expected to be 5,500 people employed in the construction of the pipeline. Similarly, construction of the LNG Canada project—the largest single private sector investment in the country's history—is well underway, and expected to create 10,000 jobs at the height of construction.
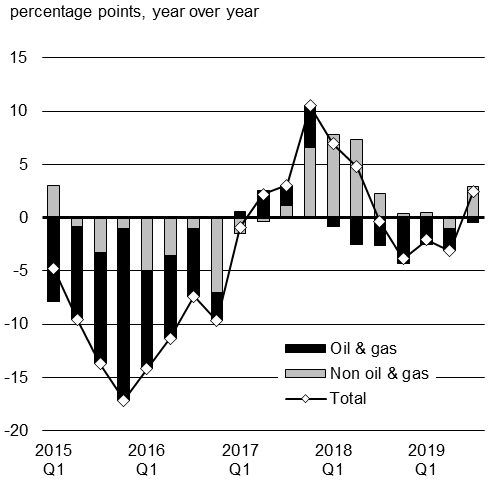
The challenging global marketplace continues to weigh on Canada's exports. Since 2015, increases in total real exports have been driven in large part by exports of energy commodities and services (Chart 1.9). When it comes to exports of services, knowledge-intensive services are leading the way, with cutting-edge new developments and investments in Canadian-made entertainment software and digital services.
However, real exports of non-energy goods—which account for roughly two-thirds of Canada's total exports—have remained largely unchanged, as Canadian exporters have struggled to maintain their share in the U.S. market. Rising protectionism and trade policy uncertainty are further restraining exports of certain commodities.
Following the introduction of U.S. tariffs on Chinese goods, China's market share in the U.S. has declined from its 2017 level. At the same time, exports from other countries, including those in Asia and Europe, have been able to make gains in the U.S. market.
To ensure that Canada's exporters—including Canada's agri-food producers—are better able to compete, succeed and create more good jobs, the Government will accelerate its efforts to ensure that Canadian companies have the support they need to break into new markets, expand their presence in existing markets, execute on their export growth plans and take full advantage of new trade agreements. Canada is the G7 country with the most signed trade agreements and is well-positioned to make gains in trade around the world.
Intense global competition is a continuing challenge for Canadian exporters of non-energy goods
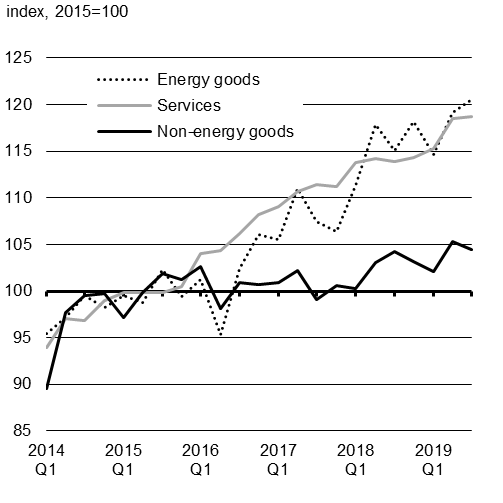
Sources: Statistics Canada; Department of Finance Canada calculations.
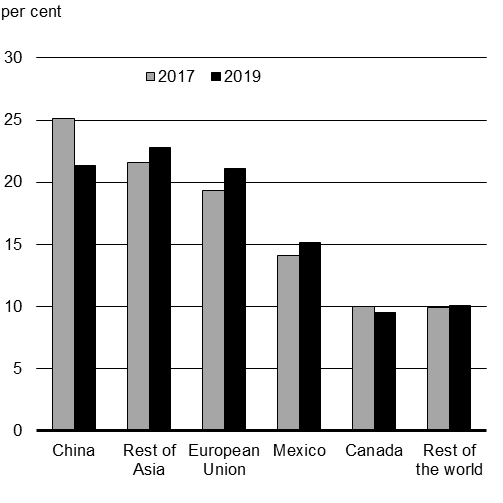
Sources: United States International Trade Commission; Department of Finance Canada calculations.
Export weakness, along with uncertainty over future trade prospects, has also weighed on business investment—which was already on the decline in Canada's oil and gas sector. As a result, business investment in Canada has lagged that of other major advanced economies in recent years (Chart 1.10).
Going forward, growth in business investment is expected to remain restrained until trade policy and geopolitical uncertainty subside. While investment in the oil and gas sector appears to be stabilizing, it will likely remain modest until additional transportation capacity from pipeline projects that are planned or already underway comes on line.
Despite these recent challenges, indicators of overall business confidence and intentions to invest have remained modestly positive over the past year. The signing of new and modernized trade agreements, such as the Canada-United States-Mexico Agreement, the tax incentives introduced in the 2018 Fall Economic Statement to encourage business investment and improved business lending conditions are expected to support more robust business investment in the coming years.
Business investment is still regaining lost ground
Sources: Statistics Canada; United Kingdom Office for National Statistics; German Federal Statistical Office; Haver Analytics; Department of Finance Canada calculations.
Sources: Statistics Canada; Department of Finance Canada calculations.
Canadian Economic Outlook
The Department of Finance Canada surveyed a group of private sector economists in September of this year, following the release of the National Accounts second-quarter results for 2019. Private sector economists expect real GDP growth to moderate to 1.7 per cent in 2019, the same as in Budget 2019. Average growth over the 2019-2023 horizon is similar to projections in Budget 2019 (see Annex 1 for full details of the updated outlook).
The outlook for GDP inflation (the broadest measure of economy-wide inflation) has been revised up in both 2019 and 2020 relative to Budget 2019. Overall, the projected level of nominal GDP (the broadest single measure of the tax base) in the September survey is slightly higher by an average of about $3 billion per year over the forecast horizon compared to Budget 2019 projections.
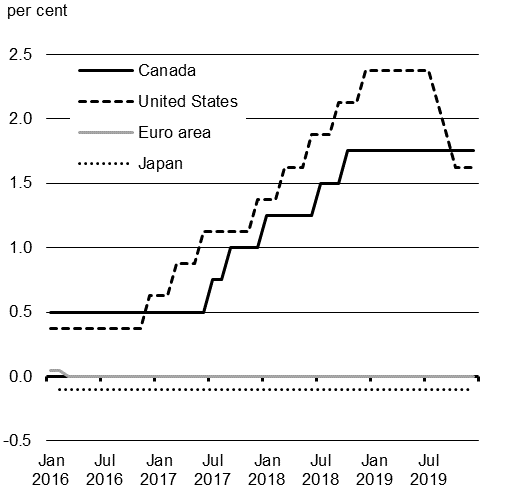
Reflecting the recent declines in interest rates on most Government of Canada securities, private sector economists have revised down their outlook for both short- and long-term interest rates. The 3-month treasury bill rate is expected to be 40 basis points lower on average per year over the forecast horizon, while the downward forecast revision for the 10-year government bond rate is much larger at 90 basis points on average per year.
| 2019 | 2020 | 2021 | 2022 | 2023 | 2024 | Forecast Average | |
|---|---|---|---|---|---|---|---|
| Real GDP growth | |||||||
| Budget 2019 | 1.7 | 1.6 | 1.7 | 1.9 | 1.9 | – | 1.8 |
| 2019 Economic and Fiscal Update | 1.7 | 1.6 | 1.8 | 1.8 | 1.9 | 1.9 | 1.8 |
| Nominal GDP growth | |||||||
| Budget 2019 | 3.4 | 3.5 | 3.7 | 3.9 | 4.0 | – | 3.7 |
| 2019 Economic and Fiscal Update | 3.6 | 3.7 | 3.8 | 3.8 | 3.9 | 3.9 | 3.8 |
| Nominal GDP level (billions of dollars) | |||||||
| Budget 2019 | 2,304 | 2,385 | 2,473 | 2,571 | 2,674 | – | |
| 2019 Economic and Fiscal Update | 2,304 | 2,388 | 2,479 | 2,574 | 2,675 | 2,778 | |
| Difference between Budget 2019 and 2019 Economic and Fiscal Update |
0 | 3 | 6 | 4 | 1 | – | 3 |
| 3-month treasury bill rate | |||||||
| Budget 2019 | 1.9 | 2.2 | 2.3 | 2.4 | 2.5 | – | 2.2 |
| 2019 Economic and Fiscal Update | 1.6 | 1.5 | 1.6 | 1.9 | 2.2 | 2.4 | 1.8 |
| 10-year government bond rate | |||||||
| Budget 2019 | 2.4 | 2.7 | 2.8 | 3.1 | 3.3 | – | 2.9 |
| 2019 Economic and Fiscal Update | 1.5 | 1.6 | 2.0 | 2.4 | 2.7 | 3.0 | 2.0 |
Revised Fiscal Outlook
In light of slowing global growth prospects and lower yields on government bonds, the Government has been taking advantage of low borrowing costs to finance new investments that will help strengthen and grow the economy and improve the quality of life for all Canadians. Investments in infrastructure—such as public transit—support long-term economic growth, and help to make our communities better places to live. Similarly, investments in people—including child care that makes it possible for parents to work, and post-secondary education and skills training—give Canadians the tools they need to succeed, and keep our economy strong.
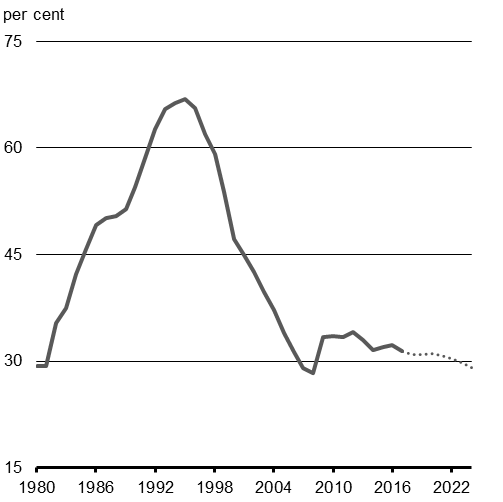
The interest rates paid on new government borrowing are lower than the expected growth rate of the economy. Historically low interest rates give the Government fiscal room to invest in the things that will deliver long-term growth while recording manageable deficits, ensuring the long-term sustainability of public finances, and continuing to protect the competitive advantage that comes with the lowest net debt-to-GDP ratio in the G7 (Chart 1.11).
Canada's public debt is the lowest among the G7

Source: IMF, October 2019 Fiscal Monitor.

Source: IMF, October 2019 Fiscal Monitor.
Changes to the Fiscal Outlook Since Budget 2019
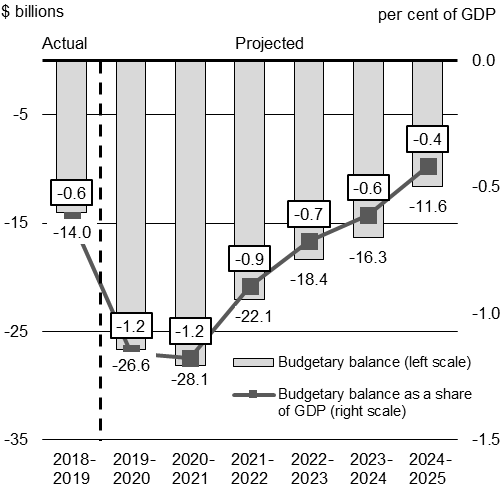
Table 1.2 below outlines the fiscal impact of economic and fiscal developments, including the impact of policy actions taken since Budget 2019. In total, the deficit, including an adjustment for risk, is projected to decline from $26.6 billion in 2019–20 to $11.6 billion in 2024–25.
| Projection | |||||||
|---|---|---|---|---|---|---|---|
| 2018– 2019 |
2019– 2020 |
2020– 2021 |
2021– 2022 |
2022– 2023 |
2023– 2024 |
2024– 2025 |
|
| Budget 2019 budgetary balance | -14.9 | -19.8 | -19.7 | -14.8 | -12.1 | -9.8 | |
| Adjustment for risk from Budget 2019 | 0.0 | 3.0 | 3.0 | 3.0 | 3.0 | 3.0 | |
| Budget 2019 budgetary balance (without risk adjustment) |
-14.9 | -16.8 | -16.7 | -11.8 | -9.1 | -6.8 | |
| Economic and fiscal developments since Budget 2019 |
|||||||
| Revenues | 0.0 | 1.7 | 1.8 | 2.2 | 3.5 | 3.8 | |
| Expenses | 0.9 | -5.8 | -7.6 | -6.3 | -5.7 | -5.2 | |
| Of which: Employee pensions and future benefits | 0.0 | -4.9 | -7.6 | -6.3 | -4.8 | -4.2 | |
| Total | 0.9 | -4.2 | -5.9 | -4.1 | -2.2 | -1.5 | |
| Revised budgetary balance before policy actions and investments | -14.0 | -21.0 | -22.6 | -15.9 | -11.3 | -8.3 | |
| Policy actions since Budget 20192 | |||||||
| Hibernia Dividend Backed Annuity Agreement with Newfoundland and Labrador | -1.9 | 0.0 | 0.0 | 0.0 | 0.0 | 0.0 | |
| Other Policy Actions since Budget 2019 | -1.5 | 0.5 | 0.9 | 1.1 | 1.0 | 1.2 | |
| Increase to the Basic Personal Amount | -0.7 | -3.0 | -4.1 | -5.1 | -6.0 | -6.2 | |
| Final budgetary balance | -14.0 | -25.1 | -25.1 | -19.1 | -15.4 | -13.3 | -8.6 |
| Federal debt (per cent of GDP) | 30.8 | 30.9 | 30.9 | 30.5 | 30.0 | 29.3 | 28.5 |
| Adjustment for risk 3 | -1.5 | -3.0 | -3.0 | -3.0 | -3.0 | -3.0 | |
| Budgetary balance after adjustment for risk | -14.0 | -26.6 | -28.1 | -22.1 | -18.4 | -16.3 | -11.6 |
| Federal debt after adjustment for risk (per cent of GDP) |
30.8 | 31.0 | 31.0 | 30.8 | 30.4 | 29.8 | 29.1 |
Economic and fiscal developments since Budget 2019 have reduced the projected budgetary balance in the near term, by roughly $4.2 billion in 2019–20 and $5.9 billion in 2020–21. Comprehensive details on changes to the fiscal outlook are provided in Annex 1.
The change relative to Budget 2019 is largely driven by increased expenses related to actuarial revaluations of employee pensions and other future benefits (e.g., including veterans programs and Royal Canadian Mounted Police disability programs, health care and dental care benefits for pensioners, as well as a number of smaller benefit plans).
The Government's obligations for pensions and other future benefits are determined on a present value basis, and dependent on year-end interest rates. The lower interest rate outlook relative to Budget 2019 results in larger estimated obligations, which translate into higher annual expenses for the Government.
This Economic and Fiscal Update also incorporates the fiscal impact of policy actions taken since Budget 2019, including the recently proposed increase in the Basic Personal Amount; the Hibernia Dividend Backed Annuity Agreement, signed between Canada and the Government of Newfoundland and Labrador in April 2019; and compensation for supply-managed dairy producers announced in August 2019.
Over the fiscal horizon, policy actions announced since Budget 2019 are entirely offset by stronger projected personal and corporate income tax revenues. Costs related to the Basic Personal Amount are also partially offset by these revenue gains.
The Government will also launch the first phase of a comprehensive review of government spending and tax expenditures, to ensure that resources are efficiently allocated to continue to invest in people and keep the economy strong and growing. This review will result in $1.5 billion in annual savings, starting in 2020-21.
Looking ahead, the federal debt-to-GDP ratio, after including an adjustment for risk, is expected to decline to 29.1 per cent by 2024–25 (Chart 1.12), representing its lowest level since 2008-09.
The Government's fiscal situation is strong and sustainable for future generations
Improving Transparency in the Government's Financial Reporting
As discussed above, the increase in expenses relative to Budget 2019 estimates is largely attributable to the annual revaluation of the Government's obligations related to public sector employee pensions and other future benefits. These obligations are particularly sensitive to changes in the forecast for short- and long-term interest rates, and to other actuarial assumptions, such as inflation, retirement rates and mortality rates.
While these annual revaluations are an important part of providing an accurate picture of the Government's balance sheet, they can also result in large swings in the budgetary balance, which have the potential to obscure underlying trends in government spending, and can make prudent fiscal management more challenging.
To improve the transparency of the Government's financial reporting, the Government intends to consult on a potential new financial measurement concept—the operating balance— and how it might be used in its financial reporting framework. The operating balance could isolate the volatility often seen from actuarial gains and losses on pension and other future benefit obligations by showing actuarial gains or losses as a separate line item—rather than as part of overall program expenses. The table below provides an illustration of this concept based on the fiscal projections set out in this Economic and Fiscal Update.
| Projection | |||||||
|---|---|---|---|---|---|---|---|
| 2018– 2019 |
2019– 2020 |
2020– 2021 |
2021– 2022 |
2022– 2023 |
2023– 2024 |
2024– 2025 |
|
| Budgetary revenues | 332.2 | 340.1 | 352.3 | 367.2 | 381.8 | 395.9 | 411.9 |
| Program expenses | 314.6 | 330.0 | 343.7 | 354.2 | 366.2 | 376.9 | 389.4 |
| Public debt charges | 23.3 | 24.4 | 23.7 | 25.3 | 27.3 | 29.5 | 31.5 |
| Expenses, excluding actuarial losses/gains | 337.8 | 354.5 | 367.5 | 379.5 | 393.5 | 406.3 | 420.8 |
| Adjustment for risk | -1.5 | -3.0 | -3.0 | -3.0 | -3.0 | -3.0 | |
| Operating balance | -5.6 | -15.9 | -18.2 | -15.3 | -14.7 | -13.4 | -11.9 |
| Actuarial (losses) gains | -8.4 | -10.8 | -9.9 | -6.8 | -3.7 | -2.9 | 0.3 |
| Budgetary balance (with risk adjustment) | -14.0 | -26.6 | -28.1 | -22.1 | -18.4 | -16.3 | -11.6 |
A similar approach is used by countries such as Australia and New Zealand, which, like Canada, are among the few countries that follow the highest standards of accounting. The Government would continue to present the traditional budgetary balance, or annual deficit/surplus, in its budget and financial reporting as the most comprehensive measure of financial performance. However, as an option, the operating balance could act as a useful supplementary measure that would make it easier to see the effects of gains and losses during a specific accounting period, separate from the Government's planned spending on programs.
In the coming months, the Government will launch consultations with accounting experts and stakeholders to further explore the possibility of changing the way that actuarial gains and losses are reported in the Government's financial results, including defining and evaluating the merits of incorporating the operating balance measurement concept in the federal financial reporting framework.
Impact of Alternative Economic Scenarios
Since 1994, the average of private sector economic forecasts has been used as the basis for the Department of Finance Canada's fiscal planning assumptions. This helps ensure objectivity and transparency in the fiscal forecast.
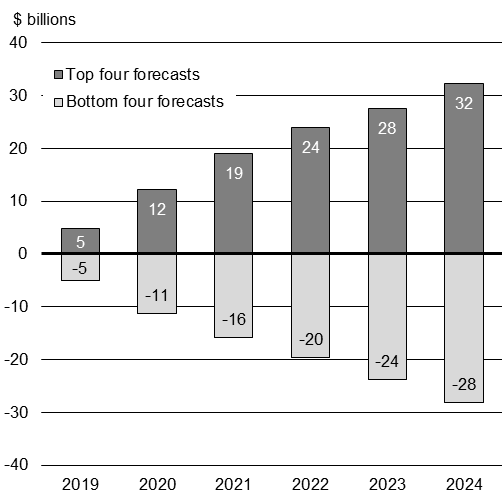
One way to illustrate the uncertainty around the core budgetary balance forecast is to consider the variety of views within the individual private sector survey responses. Indeed, economists have differing models and forecasts on various aspects and risks to the economic outlook, such as the economy's long-term potential growth rate or the impact of external developments on commodity prices. Fundamentally, the growth path over a five-year forecast horizon is unlikely to be as smooth as what is depicted in the survey average, which is what underpins the fiscal outlook.
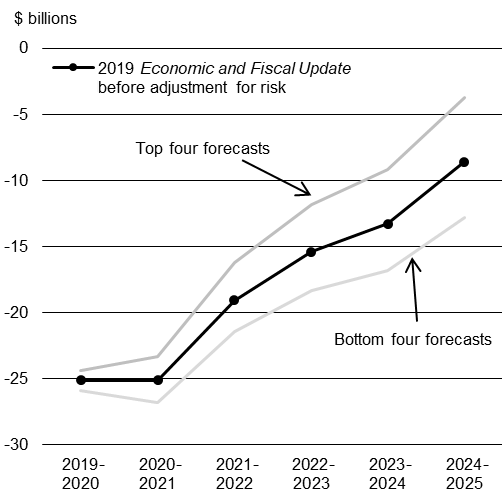
Chart 1.13 presents the most optimistic and pessimistic economic forecasts from the September 2019 survey relative to the survey average, as well as their impact on the projected budgetary balance. By the fifth year of the forecast horizon, the four most optimistic (pessimistic) forecasts for the level of nominal GDP are about $30 billion higher (lower) than the survey average, which translates into a wide range of deficit outcomes in the medium-term fiscal outlook.
Differences between optimistic and pessimistic views translate into a wide range of fiscal outcomes
Report a problem on this page
- Date modified: