Archived - Update of Economic and Fiscal Projections: Chapter 2 - Economic Developments and Prospects
Archived information
Archived information is provided for reference, research or recordkeeping purposes. It is not subject to the Government of Canada Web Standards and has not been altered or updated since it was archived. Please contact us to request a format other than those available.
Introduction
Global economic growth moderated in the first half of 2015, as slower growth in China and other emerging economies was accompanied by a continued soft recovery in most advanced economies. As a result, the global growth outlook for this year has once again been downgraded, to its slowest pace since the end of the global recession in mid-2009.
Crude oil prices remain at levels less than half those prevailing in mid-2014, reflecting persistent global oversupply and softening demand. For Canada, as a producer and net exporter of crude oil, low oil prices have led to sharp declines in capital investment in the energy sector, which has reduced real gross domestic product (GDP) growth, particularly over the first half of 2015. Although recent data point to a strengthening in the Canadian economy, weakness earlier in the year is expected to result in real GDP growth of just 1.2 per cent for 2015, down from 2.4 per cent in 2014. Growth is expected to increase to 2 per cent in 2016.
This chapter reviews major global and Canadian economic developments since the April 2015 budget (Budget 2015), presents the October 2015 average private sector economic forecast that forms the basis for the fiscal projections presented in this Update, and discusses the risks and uncertainties surrounding this economic forecast.
Notes: This chapter incorporates data available up to and including November 16, 2015, unless otherwise indicated. All growth rates in this chapter are reported at annual rates unless otherwise noted.
Global Economic Developments and Outlook
Global growth moderated in the first half of 2015, reflecting a further slowdown in emerging economies and a continued soft recovery in most advanced economies. As a result, global growth projections for this year have been marked down from expectations at the time of Budget 2015, to the slowest pace since the end of the global recession in mid-2009 (Chart 2.1).
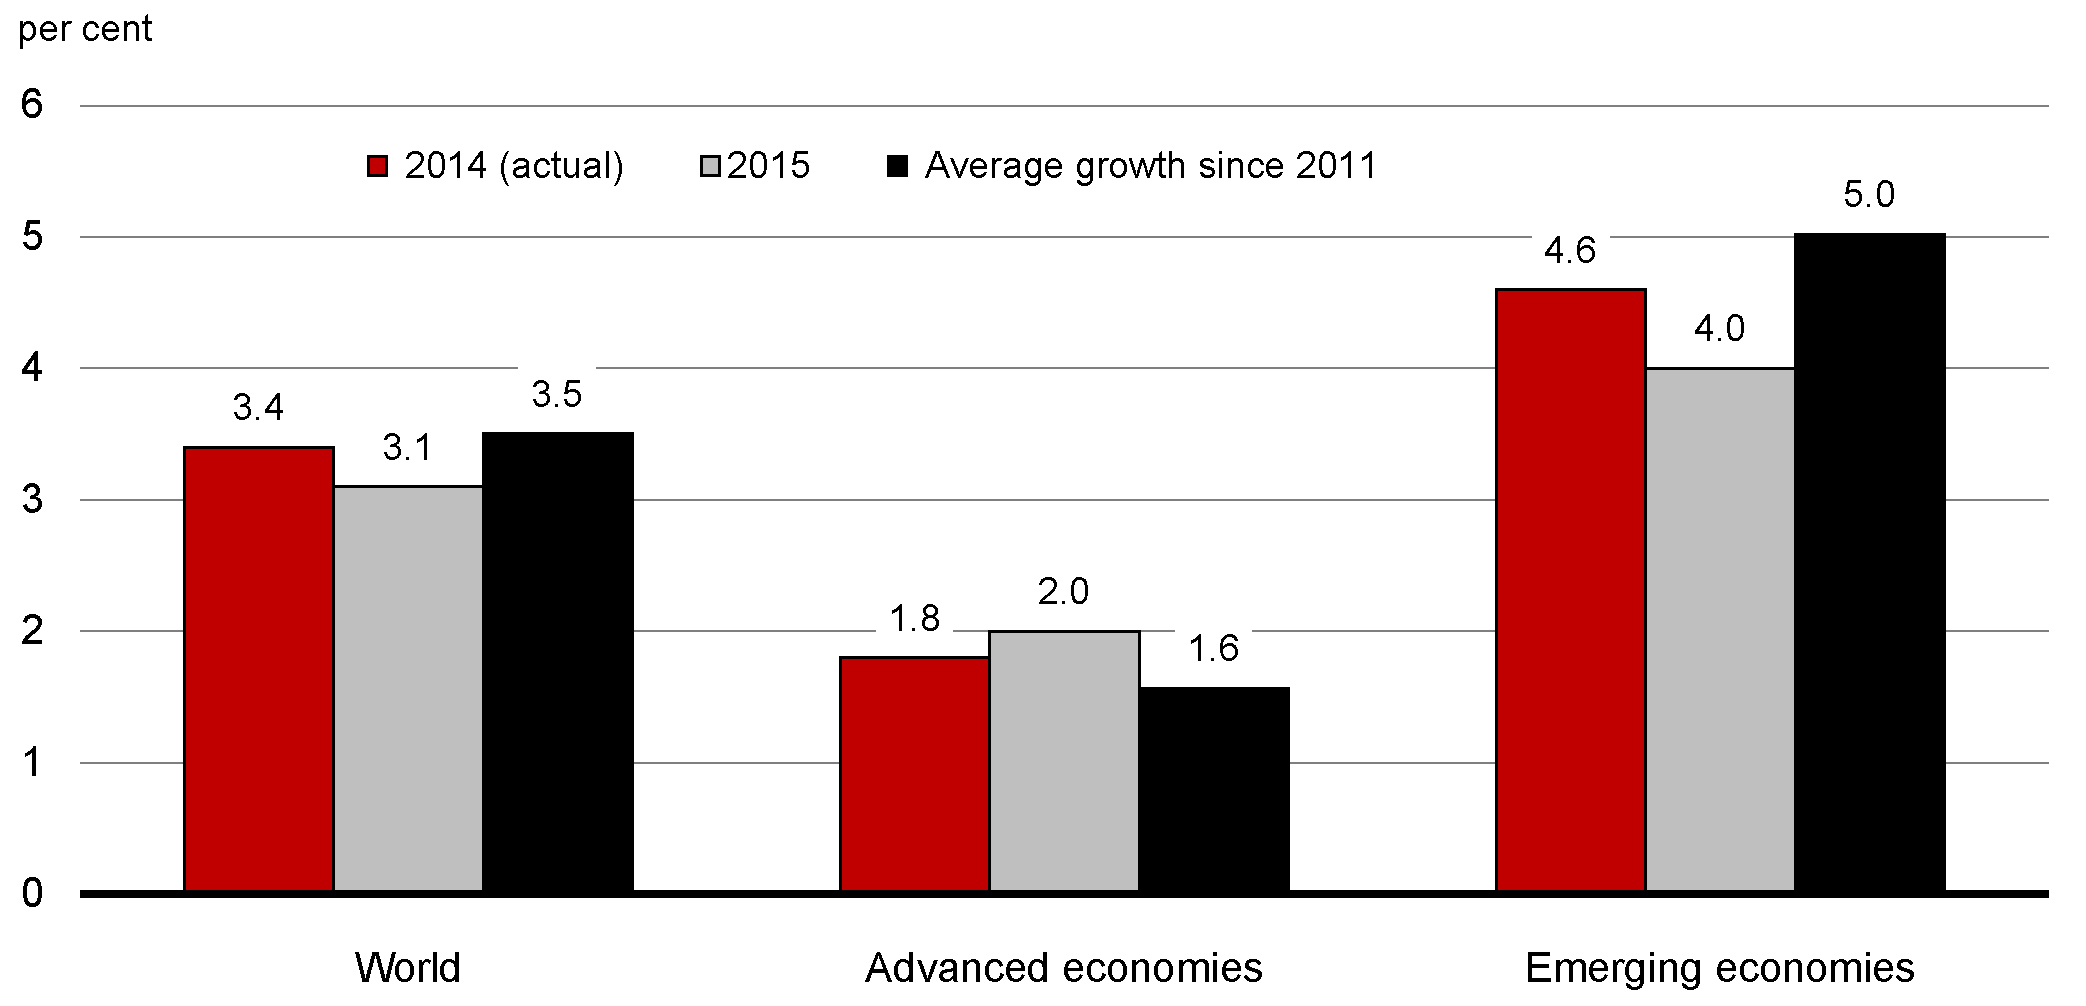
Note: The average since 2011 covers the period 2011-2015.
Source: International Monetary Fund (IMF), October 2015 World Economic Outlook.
United States
In the United States, the economic recovery continues to strengthen, notwithstanding variability in recent quarterly growth rates.
- After picking up from 1.5 per cent in 2013 to 2.4 per cent in 2014, the pace of economic activity slowed to a near standstill in the first quarter of 2015. This weakening was due to temporary factors such as severe winter weather and port delays, as well as the negative impact of lower oil prices on capital spending in the energy sector.
- Growth picked up strongly to 3.9 per cent in the second quarter of 2015, reflecting in part the unwinding of these temporary factors. The firming in growth also reflected a boost to consumer spending from lower gasoline prices.
- Growth slowed again in the third quarter to 1.5 per cent, as high levels of inventory investment were drawn down in the quarter. Absent this large but temporary drag from inventories, underlying economic activity remained strong in the third quarter, buoyed by robust growth in household and business spending (3.2 per cent).
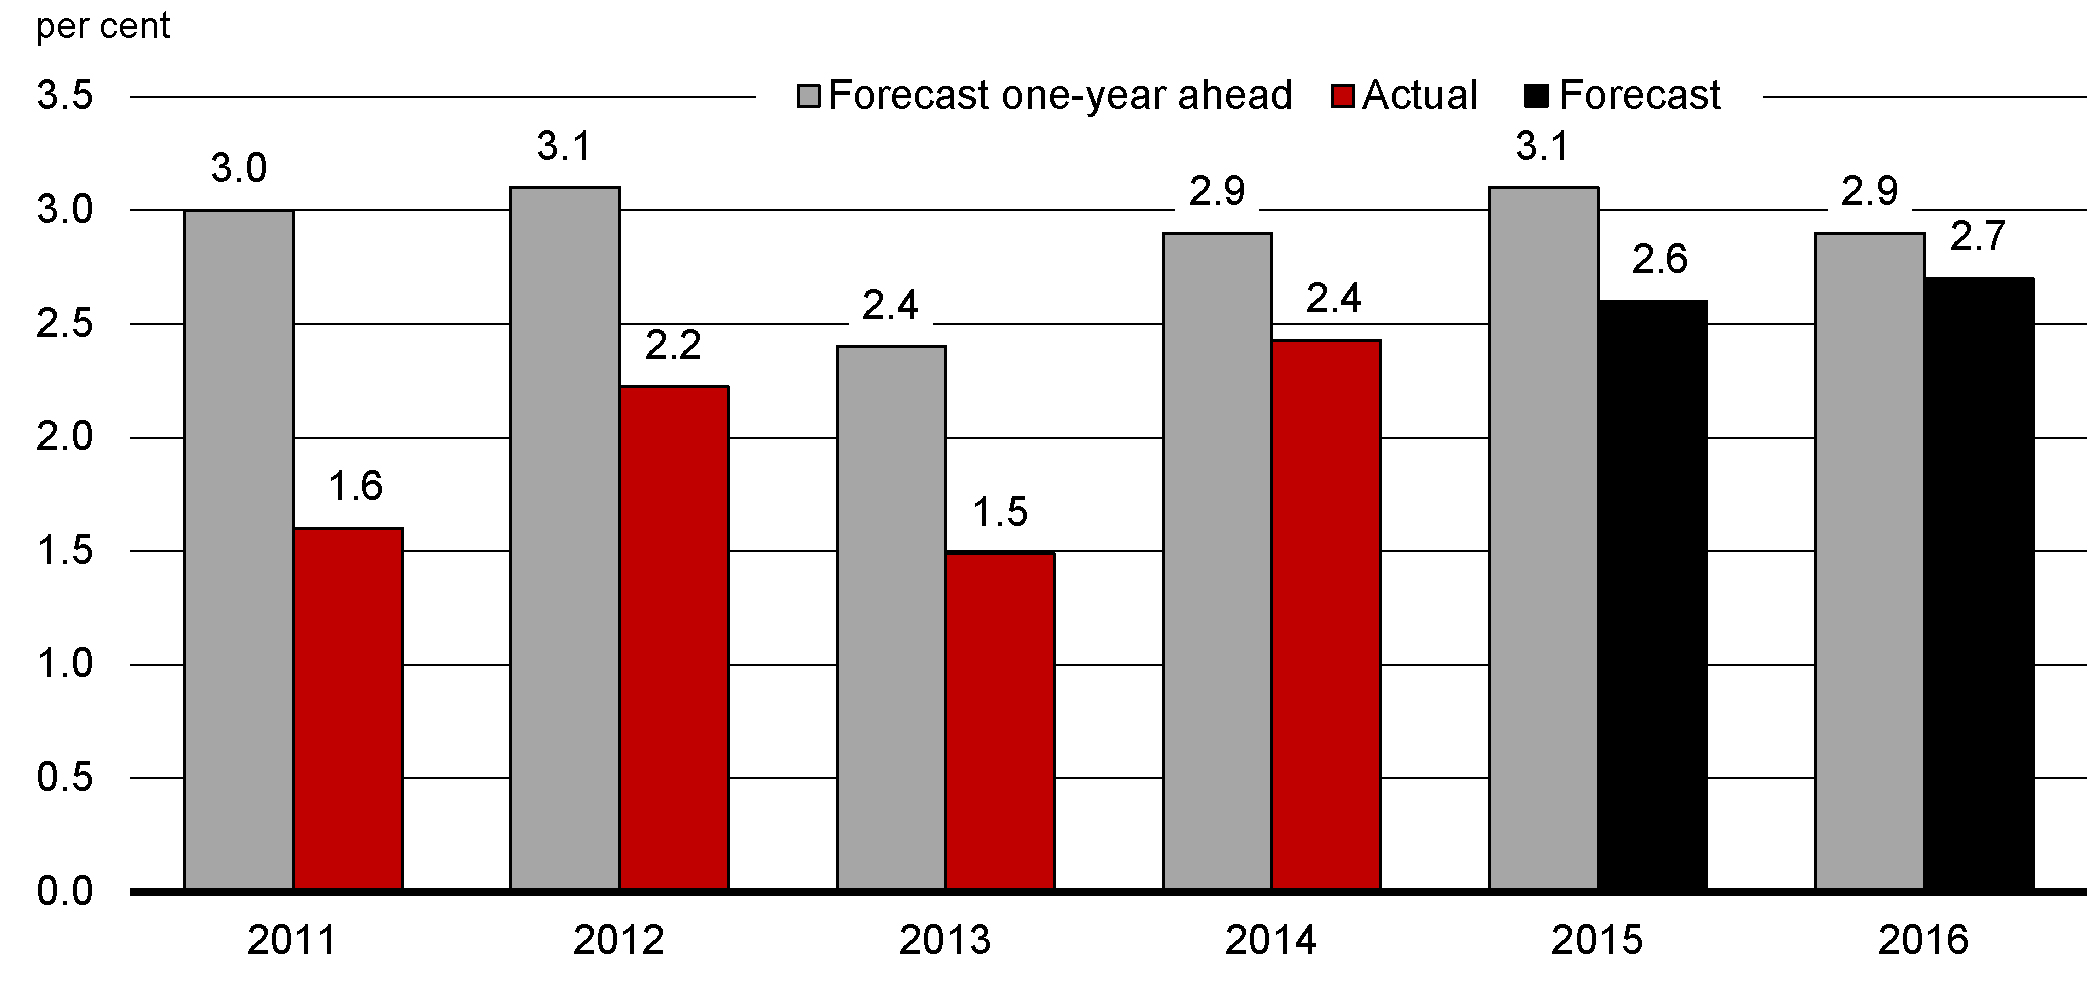
U.S. growth is expected to remain solid going forward. Strong private domestic demand is expected to more than offset the drag from the trade sector due to the appreciation of the U.S. dollar and slower overseas growth. Private domestic demand is being supported by lower energy prices, stronger household balance sheets and an improving housing market. Labour market indicators are also encouraging. Monthly job gains are averaging around 200,000 over the first 10 months of the year while the unemployment rate has fallen to 5.0 per cent, its level at the start of the 2008–2009 global recession. Wage growth, however, remains subdued. Growth will also be supported by highly accommodative monetary policy over the near term, as the U.S. Federal Reserve is expected to raise its policy rate at a very gradual pace beginning in December 2015.
Looking ahead, private sector economists in the Department of Finance's October 2015 survey expect real GDP growth to pick up from 2.4 per cent in 2014 to 2.6 per cent in 2015 and to 2.7 per cent in 2016. This is somewhat slower than was expected at the time of Budget 2015, when growth was projected to be around 3 per cent both this year and next. Weaker-than-expected growth continues to be a risk for the U.S. given the weak overall global economic environment and drag from the stronger U.S. dollar (Chart 2.2).
On the fiscal front, uncertainty flared up again in the late summer and fall. Negotiations on addressing both the spending authority for the federal government—and more importantly, the federal debt limit—continued into late October. A bipartisan deal was reached in the final week of October, just before the U.S. Treasury's projected deadline of November 3. The deal suspended the debt ceiling until March 15, 2017 and averted a potential debt default. U.S. authorities are currently in discussions on extending the federal government's spending authority. While a deal is expected to be reached prior to the December 11, 2015 deadline, a government shutdown remains a possibility.
Europe
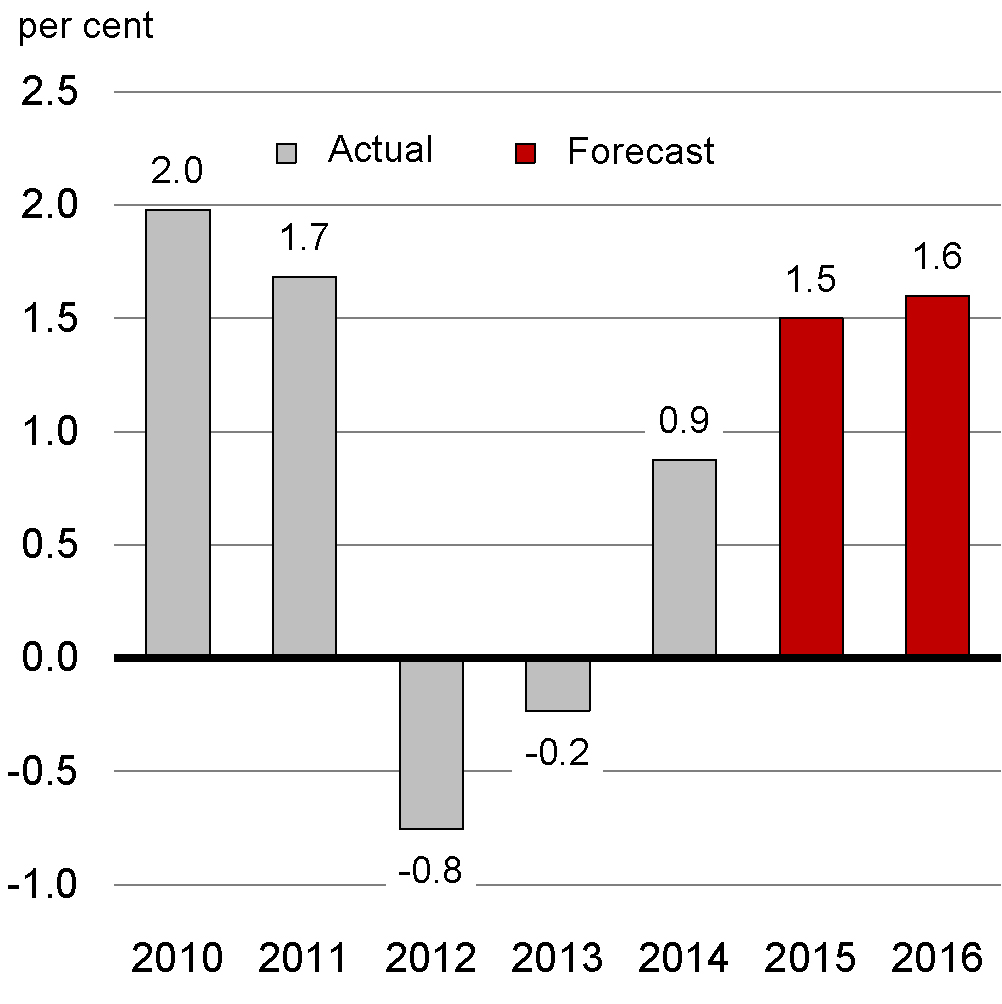
Two years after emerging from a year-and-a-half-long recession, growth in the euro area is improving. However, the pace of recovery remains modest and is uneven among member countries. A return to stronger growth is being hampered by ongoing private and public balance sheet repair, slow recovery in private investment and still-high unemployment, especially in peripheral countries. Looking ahead, the International Monetary Fund (IMF) expects real GDP growth in the euro area to pick up from 0.9 per cent in 2014 to 1.5 per cent in 2015 and to 1.6 per cent in 2016 (Chart 2.3). Growth is expected to be supported by low interest rates and a weaker euro exchange rate—reflecting, in part, easing measures by the European Central Bank (ECB)—as well as lower oil prices.
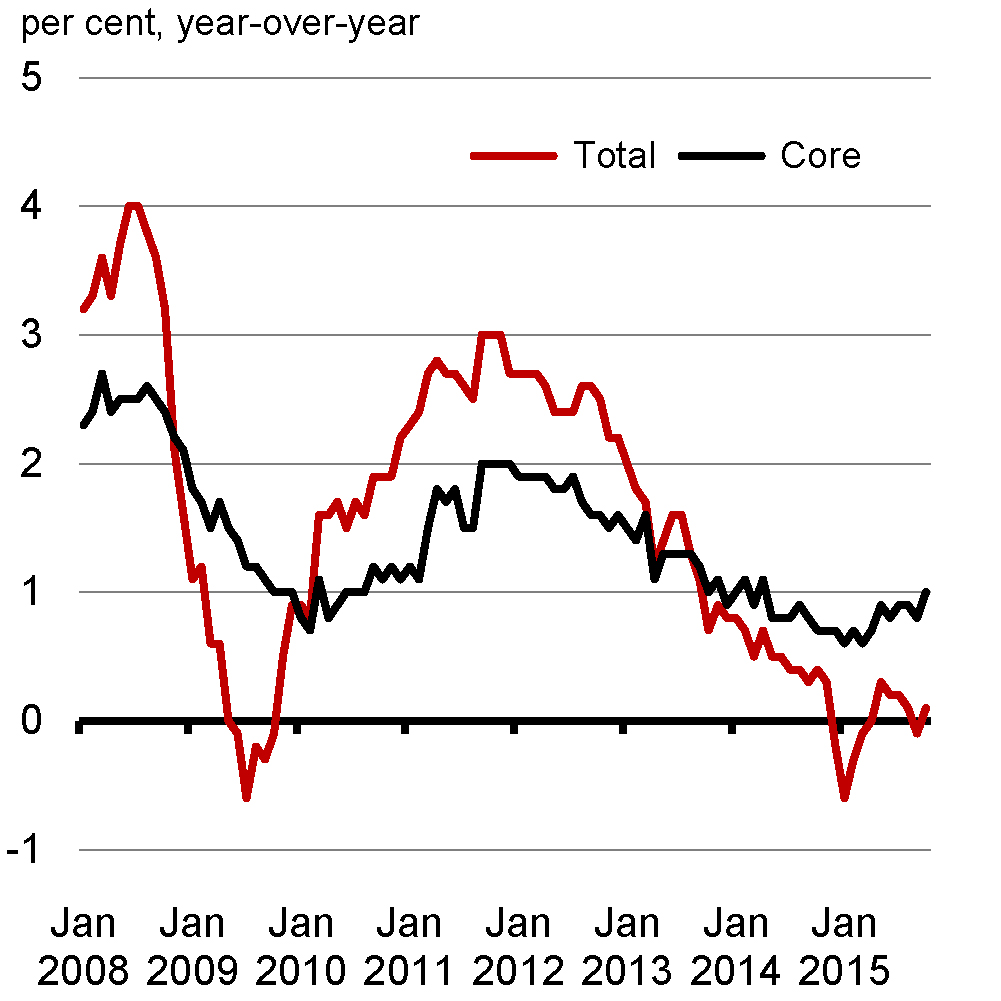
Reflecting persistent economic slack, as well as lower crude oil prices, inflation in the region remains weak. Headline inflation is near zero, while core inflation (i.e., excluding energy and food)—despite a recent uptick—remains subdued. Both measures are far from the ECB's target of below, but close to, 2 per cent. In response, the ECB has indicated that it would re-examine the degree of monetary policy accommodation at its December 2015 policy meeting.
Note: Last data point is October 2015.
Source: Haver Analytics.
Low overall growth in the euro area, combined with limited fiscal and monetary policy space—due to high public debt levels and the near-zero ECB policy rate—have left the region vulnerable to economic shocks. Domestic downside risks to the euro area economic outlook include lingering weak underlying momentum, low inflation and the latent threat of Greek contagion. External downside risks include slowing growth in emerging economies, geopolitical tensions on Europe's frontiers and global financial market volatility. The ongoing migrant crisis in the European Union (EU) could also potentially impose short-term strains on member country budgets.
In Greece, financial uncertainty and contagion risks have subsided following the August 2015 agreement on a new European Stability Mechanism program and the September 2015 re-election of the Greek government. However, should policy and political uncertainty re-emerge in Greece, sovereign and financial sector stress in the euro area could flare up, with potentially broader global spillovers.
Other Advanced Economies
In other advanced economies, continued accommodative monetary policy and low oil prices should help support growth going forward. In the United Kingdom (U.K.), growth has remained solid, led by strong household consumption expenditures. Fiscal consolidation measures—primarily cuts to social expenditures and targeted tax increases—should help the U.K. return to a balanced budget in 2019–20. While the fiscal outlook is on a stable footing, the impending referendum on U.K. membership in the EU is raising uncertainty. Following strong growth of 2.9 per cent in 2014, the IMF expects the pace of growth to ease to 2.5 per cent in 2015 and to 2.2 per cent in 2016, primarily reflecting slowing investment growth.
In Japan, growth has been volatile since the start of the year. Following a minor contraction of 0.1 per cent for 2014 as a whole, real GDP rose 4.6 per cent in the first quarter of 2015 before declining by 0.7 and 0.8 per cent in the second and third quarters, respectively. Excluding the impacts of lower commodity prices, core consumer prices are up 0.9 per cent in September from one year earlier. Outside of periods following consumption tax hikes, this marks the fastest pace of core inflation in Japan (i.e., excluding food and energy) since the mid-1990s. This suggests the Bank of Japan's quantitative easing measures may be starting to gain traction. The IMF expects growth in Japan to pick up to 0.6 per cent in 2015, followed by 1.0 per cent growth in 2016. Nonetheless, the pace of growth is expected to remain weak relative to other advanced economies, in large part due to Japan's declining population.
Emerging Economies
In China, growth continues to moderate, as the economy gradually shifts away from investment and exports and towards a greater role for domestic consumption and services. Real GDP was up 6.9 per cent year-over-year in the third quarter of 2015, compared to 7.3 per cent growth in 2014. This is well below the 10 per cent pace seen prior to the global recession. While the recent slowdown in Chinese growth has been fairly gradual, it has had a significant impact on the global economy, particularly on commodity markets. China accounts for roughly one half of global demand for base metals such as copper and aluminum. The combination of a slower pace of Chinese industrial production and oversupply of many metals has pushed the prices of base metals down roughly 20 per cent from a year earlier. The IMF expects the Chinese economy to grow 6.8 per cent this year, before easing to 6.3 per cent in 2016.
The slowdown in growth has been welcomed by the Chinese authorities as the "new normal" of a more sustainable growth model. There remains considerable uncertainty about the extent of the slowing in growth in China. At the same time the authorities have implemented several policy stimulus measures over the past year, including interest rate cuts by the central bank, to ensure growth remains near its 7 per cent annual target. Such measures helped stoke a rapid run-up in Chinese equity prices over the first half of 2015, which then unwound rapidly over the summer. The economic fallout from the recent equity market turmoil is expected to be limited, but the episode highlights the challenges facing the Chinese authorities in implementing financial and economic reforms while still supporting growth.
Recent declines in energy and other commodity prices have had negative impacts on commodity-exporting emerging economies, the largest being Russia and Brazil. Declining terms of trade for both countries resulted in sharp exchange rate depreciations and surging inflation, which has slowed consumer spending. Hoping to avoid further inflation, the central banks in both Russia and Brazil have raised interest rates, further tightening financial conditions. In Brazil, the weakening economy—combined with increased political uncertainty and a reduction in the government's fiscal targets—led to a downgrade in its sovereign debt rating. The Russian economy also continues to be hampered by international sanctions related to its actions in Ukraine. Following subdued growth in 2014, the IMF expects the economies of both Brazil and Russia to contract sharply in 2015, followed by further moderate declines in 2016.
Conversely, India, as well as other commodity-importing emerging economies in Asia such as Thailand, the Philippines and Vietnam, have all benefited from lower commodity prices. With lower input costs and a stable domestic policy environment, growth in India is expected to remain stable at 7.3 per cent in 2015, the first year its pace of growth will exceed that of China since 1999. The IMF expects economic growth in these countries to roughly maintain its strong pace or even accelerate in 2016.
Overall, the IMF now expects global growth of 3.1 per cent in 2015, down from 3.4 per cent growth in 2014, and its slowest pace since 2009. The slowdown reflects weaker growth in emerging economies more than offsetting modest improvement in advanced economies. Global growth is expected to rebound to 3.6 per cent in 2016, as emerging economy growth bounces back, primarily due to stabilization in Russia and Brazil, while growth in advanced economies continues to improve. However, given consistent downward revisions to global growth projections over the last four years, and the elevated level of uncertainty regarding the prospects for several important global economies, global growth could again disappoint relative to these expectations.
Financial Market Developments
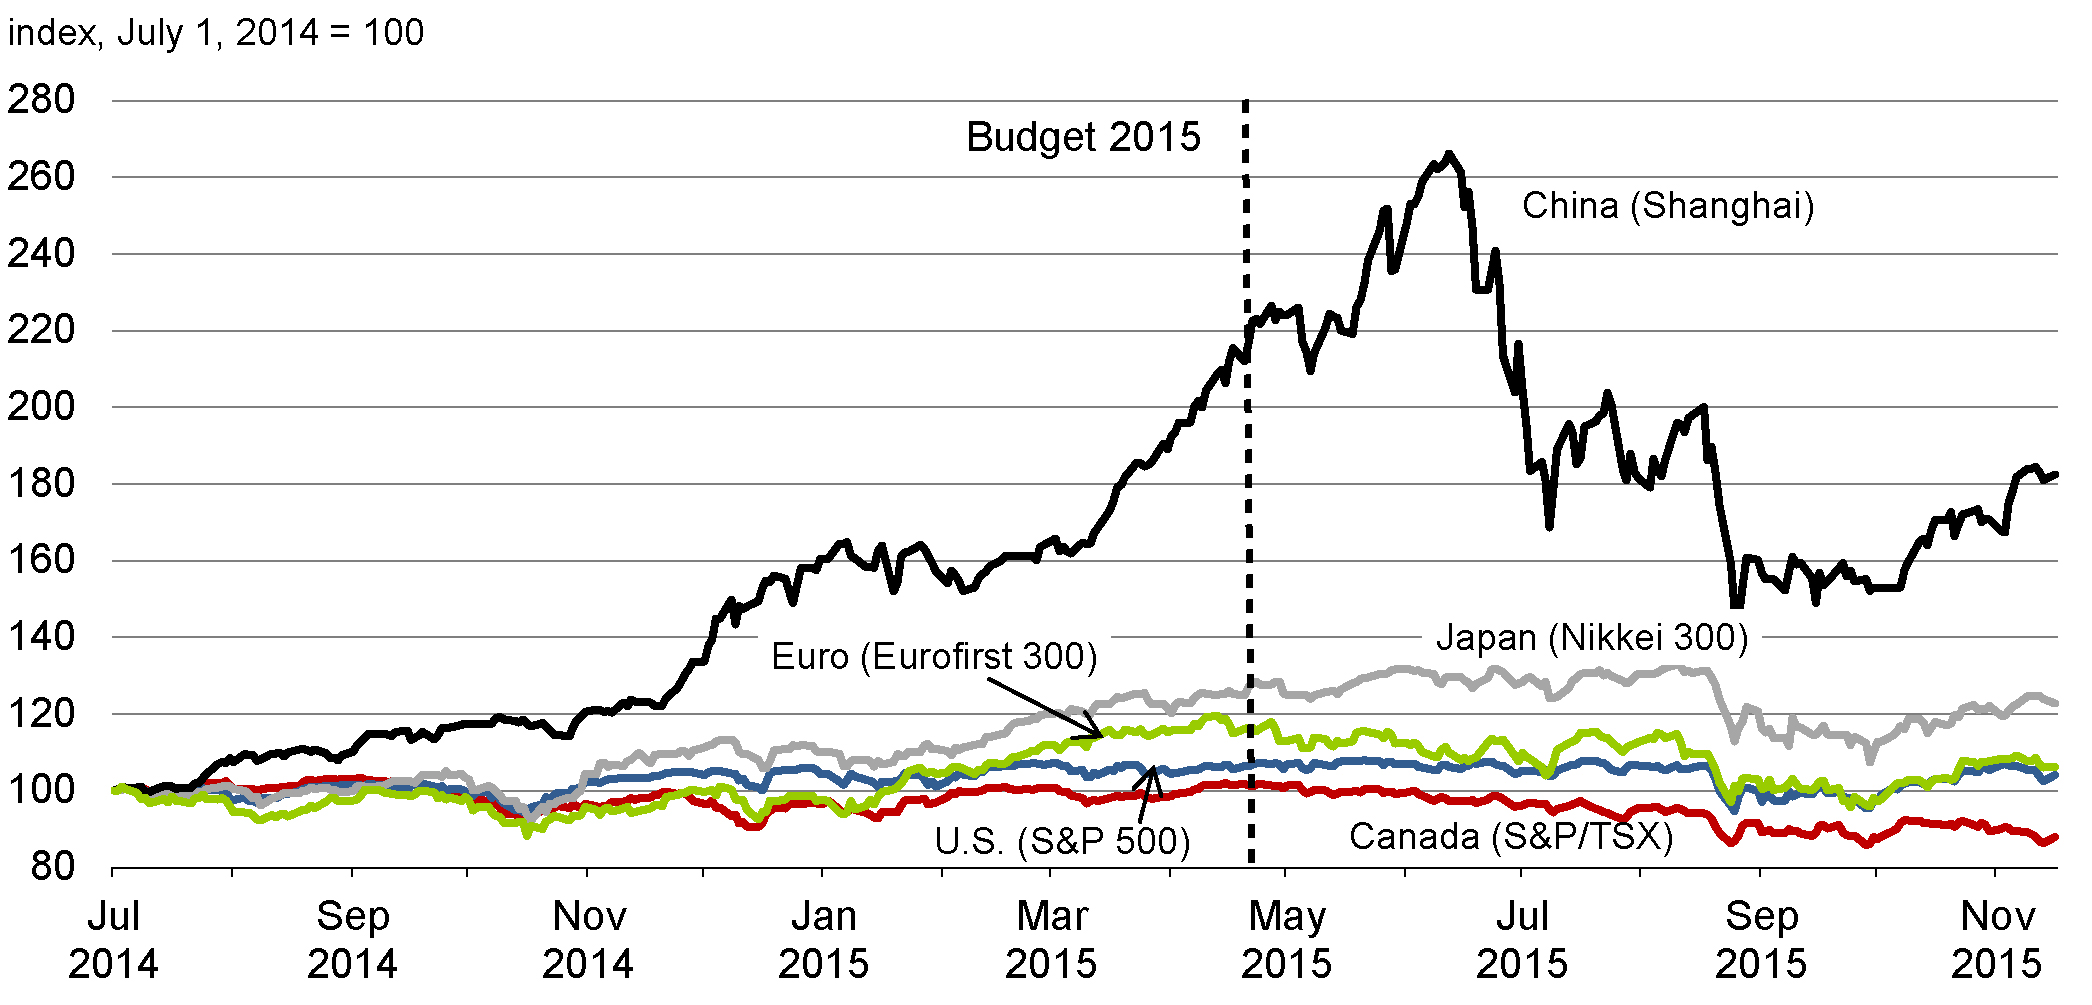
Financial market volatility rose during the summer. One trigger was Greece's default on a payment to the IMF and fears that it would exit the euro area. Volatility was further fuelled by slowing economic growth and a stock market correction in China. Chinese stock prices increased rapidly through the first half of 2015, with gains fuelled by central bank interest rate cuts and a growing number of individual Chinese investors borrowing and purchasing equities on margin. Prompted by margin calls and a crackdown on unregulated loans, Chinese stock prices fell sharply beginning in mid-June 2015. Markets continued to fall into July and August, despite significant efforts on the part of the authorities to arrest the decline. While Chinese equity prices have regained some ground since September, they remain close to levels seen before the run-up.
The correction in Chinese equity prices through the summer, along with recent weaker Chinese economic data, translated into declines in global equity prices in August. Global markets have not rebounded materially and continue to experience elevated levels of volatility. Beyond these factors, financial market volatility has also been affected by uncertainty over the timing and pace of monetary tightening in the U.S. (Chart 2.4).
Note: Daily data up to and including November 16, 2015.
Source: Haver Analytics.
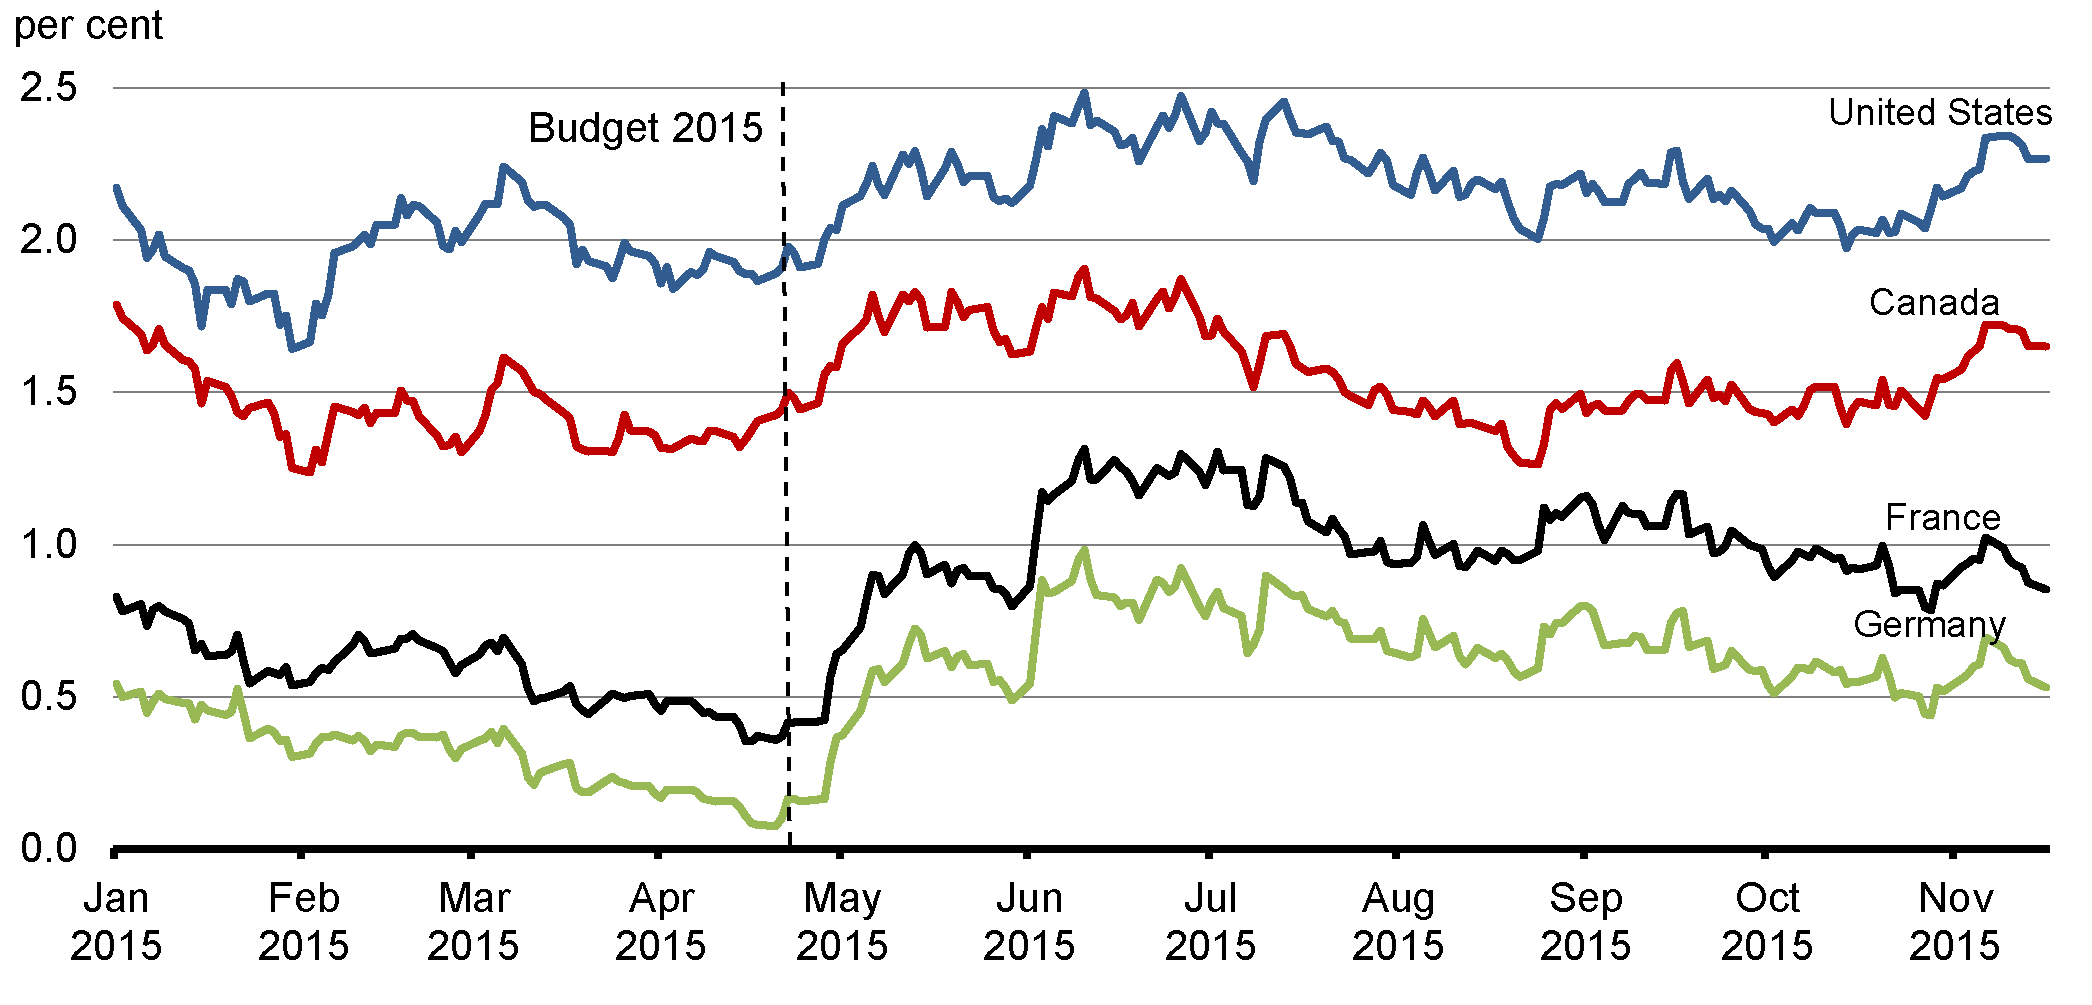
Starting last May, government bond rates for most major developed economies rose from record low levels, in part due to expectations of eventual U.S. monetary policy rate increases. However, the above-noted increase in uncertainty over the global economic outlook, and fears of broader spillovers from the Chinese equity market collapse, resulted in a flight to quality to the U.S. and other advanced economies, including Canada. This led to lower bond rates in these countries, with yields still down from their peaks in June (Chart 2.5).
Source: Bloomberg.
Commodity Prices
Global crude oil prices remain at levels less than half those prevailing in mid-2014 (Chart 2.6). After declining sharply from over US$100 per barrel between mid-2014 and early 2015, West Texas Intermediate (WTI) crude oil prices showed signs of recovering through the spring of 2015, reflecting signs of strengthening global growth and signs that U.S. crude oil production would soon decline. However, prices once again declined beginning in early July, reflecting the collapse of Chinese equity prices and more generalized concerns about growth prospects in China. Prices were also pushed down by an agreement in principle on the removal of Iranian trade sanctions, potentially resulting in a material increase in global oil supply as early as 2016. As well, the continued increase in production from the Organization of the Petroleum Exporting Countries (OPEC) has also contributed to the recent weakening in oil prices. Canadian prices have declined broadly in line with WTI prices, leaving the discount for Canadian prices close to its average since 2011.
Changes in global commodity prices have significant impacts on Canada's economy. Canada is a global-scale producer and exporter of many commodities beyond crude oil, including wood pulp, wheat, aluminum, nickel and zinc. Changes in the prices of these commodities affect the income of commodity-producing firms and their domestic investment and employment decisions. Overall, the commodity sector accounts for about 16 per cent of Canada's nominal GDP, and about one-third of our total exports.
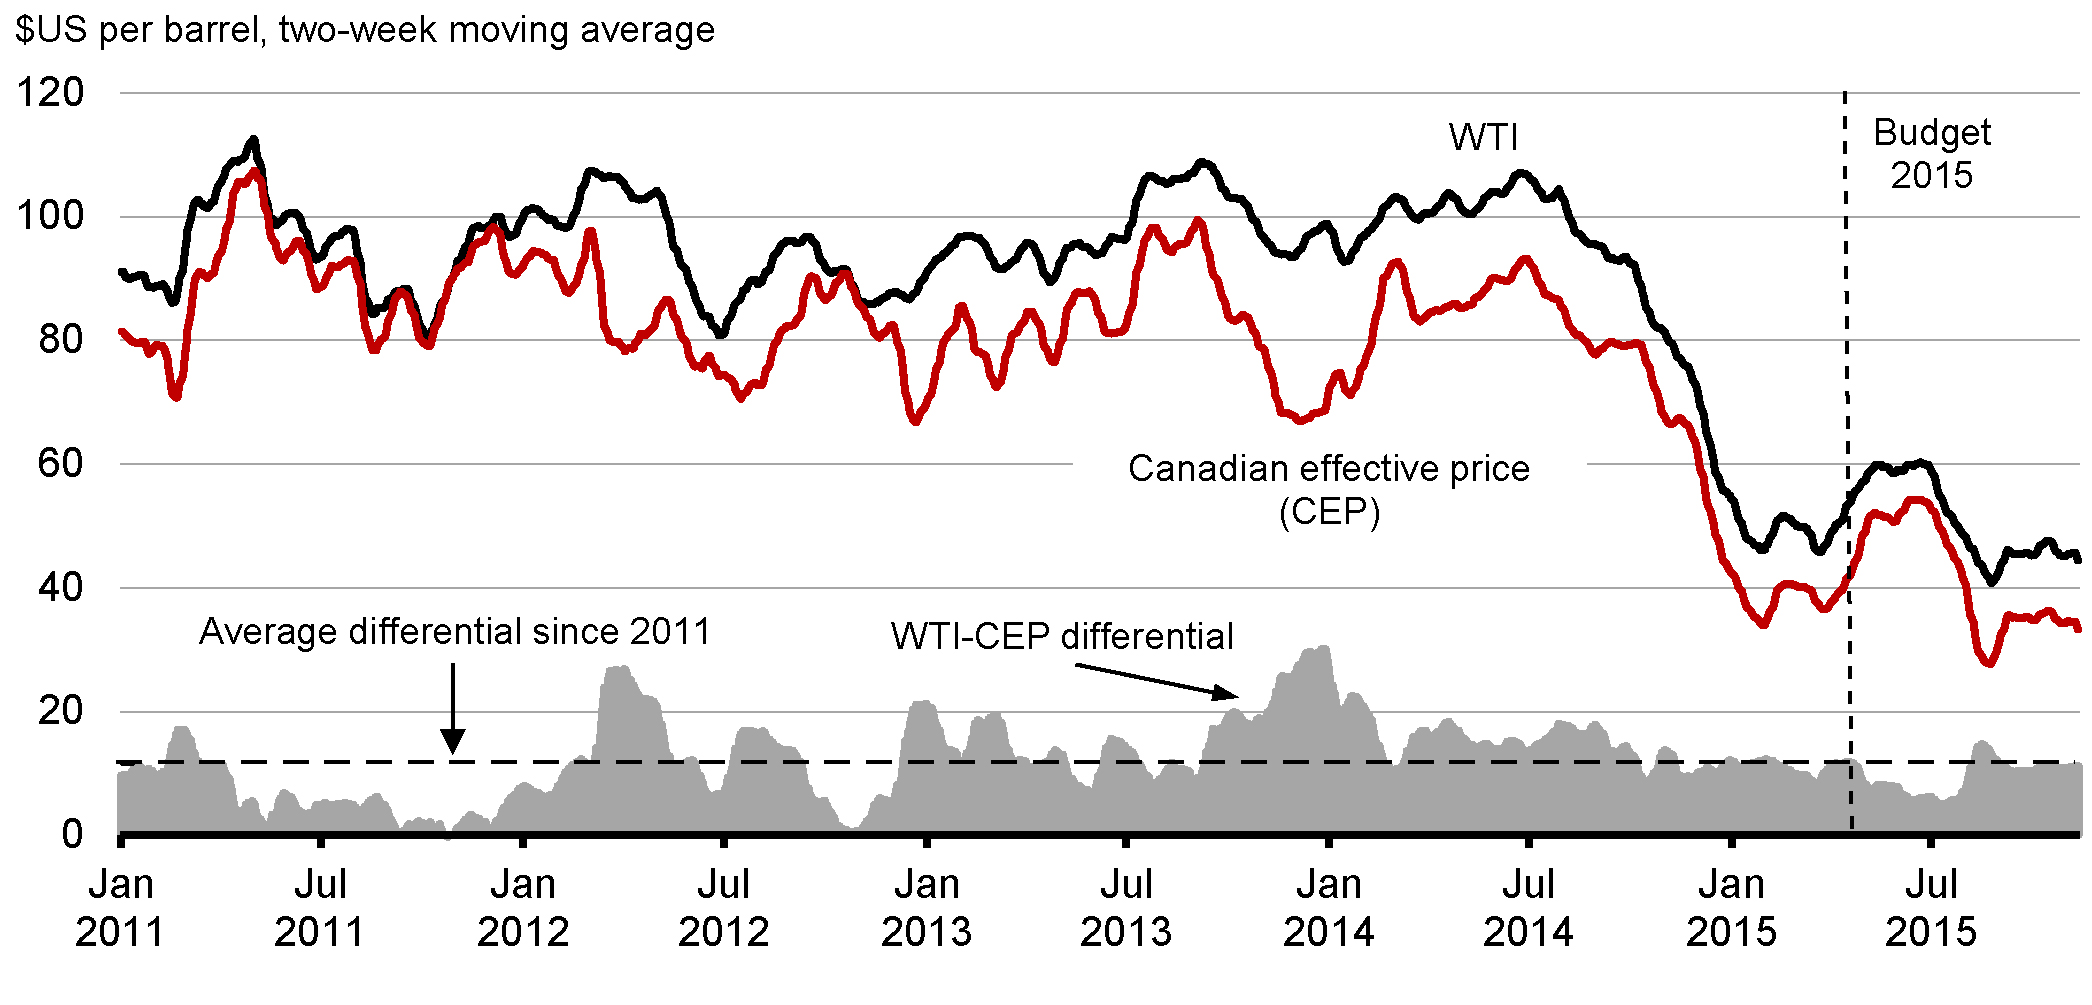
Notes: This chart shows the U.S. WTI benchmark and the Canadian effective price (CEP), an export-weighted composite of Canadian Light Sweet (Western Canadian light), the global Brent benchmark (the benchmark for Newfoundland and Labrador light crude oil) and Western Canada Select (Western Canadian heavy, including bitumen) crude oil prices. Last data point is the two-week average ending November 13, 2015.
Sources: Commodity Research Bureau; Bloomberg; Department of Finance calculations.
The global oil market is currently oversupplied, though not excessively so. The fundamental factor weighing on global prices is that global supply has not yet fallen sufficiently in response to weaker global demand growth. U.S. shale oil production, which has been the main driver of the growth in global supply in recent years, has yet to decline meaningfully despite a sharp reduction in the number of active oil rigs. This is because producers are shutting down their least productive rigs and refocusing efforts on fields with lower costs and higher productivity. As a result, crude oil inventory levels remain near record highs, placing further downward pressure on prices. Moreover, OPEC countries have abandoned their role as swing producer and continue to maintain (and even increase) their production levels, in an effort to maintain their global market share.
Persistently low crude oil prices have resulted in repeated downward shifts in futures prices, particularly over the medium term. When spot prices were at their peaks of close to US$110 per barrel in June 2014, futures markets suggested that financial market participants expected prices of approximately US$85 per barrel by 2020 (Chart 2.7). In contrast, as of mid-November 2015, market participants now expect prices of less than US$60 per barrel.
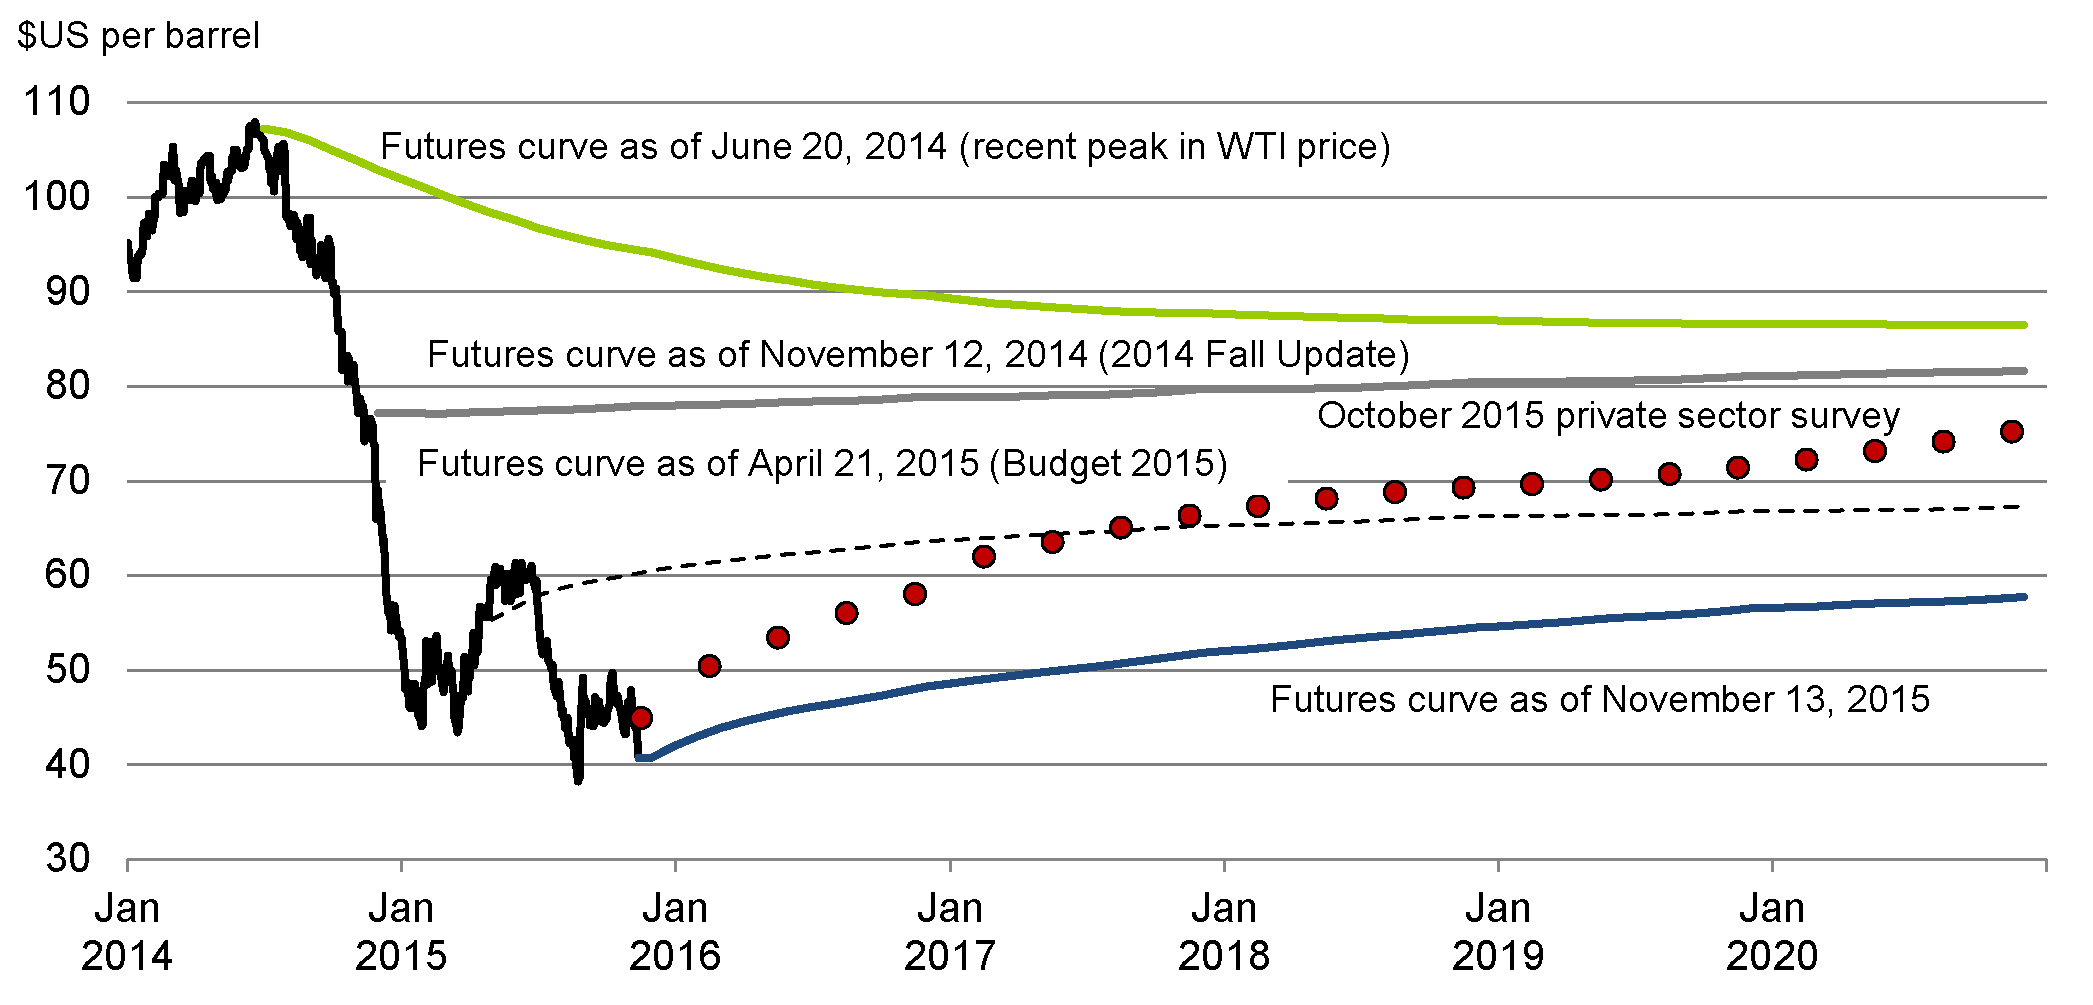
Note: Daily data for actual WTI spot prices, monthly data for futures contracts for WTI prices, and quarterly data for the average private sector forecast for WTI prices. Last data points are December 2020 and 2020Q4.
Sources: Commodity Research Bureau; Department of Finance October 2015 survey of private sector economists.
Ongoing weaker-than-expected global economic growth, along with increased supply, has also dampened prices for most other commodities (Chart 2.8). In particular, expectations of slower global growth have pushed down base metal prices notably since Budget 2015. Agriculture prices have declined due to lower prices for wheat and live cattle, reflecting increased North American inventories. Natural gas prices have also fallen significantly, reflecting relatively high inventories and expectations of a warmer-than-normal winter due to the El Niño effect. Lumber prices have improved since Budget 2015 due to stronger U.S. demand, in line with improving housing market conditions in that country.
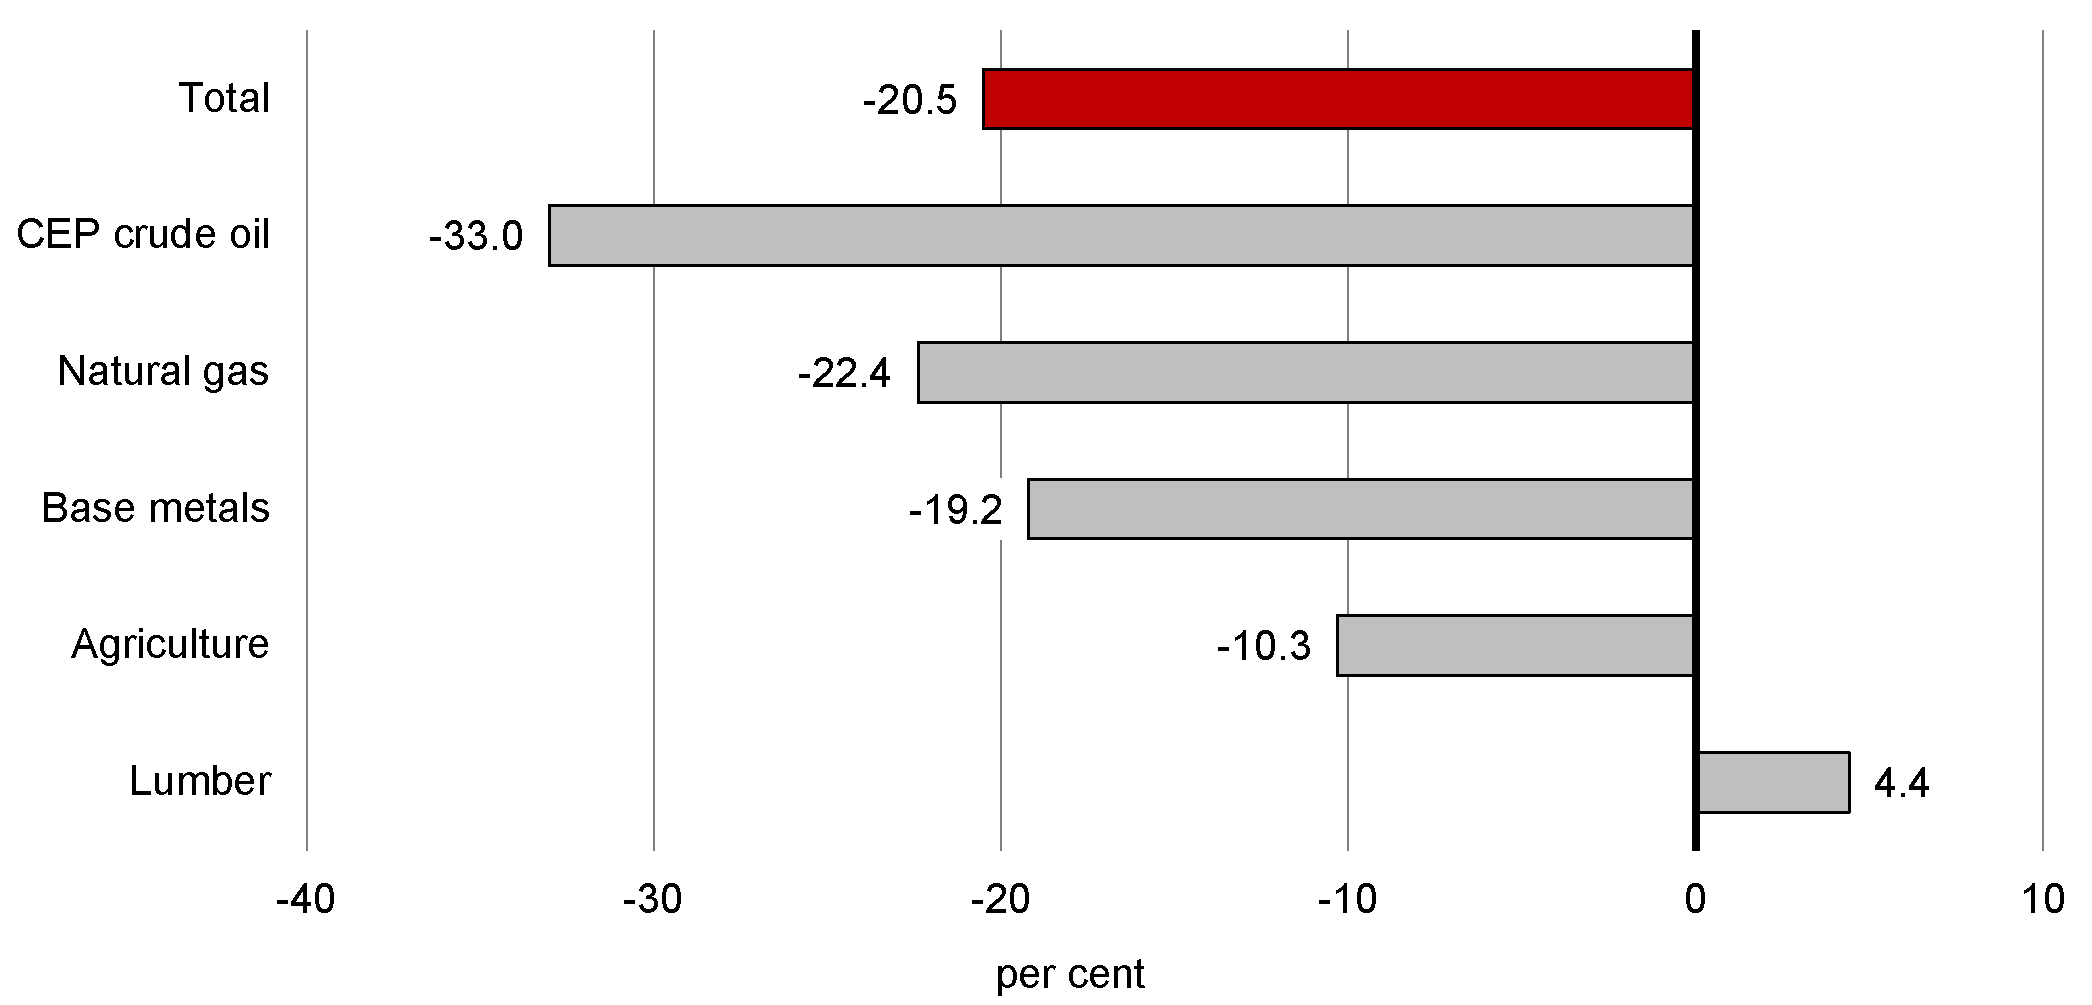
Notes: Change is between April 21, 2015 and November 13, 2015. Underlying prices are measured in U.S. dollars.
Sources: Commodity Research Bureau; Bloomberg; Department of Finance calculations.
Recent Economic Developments in Canada
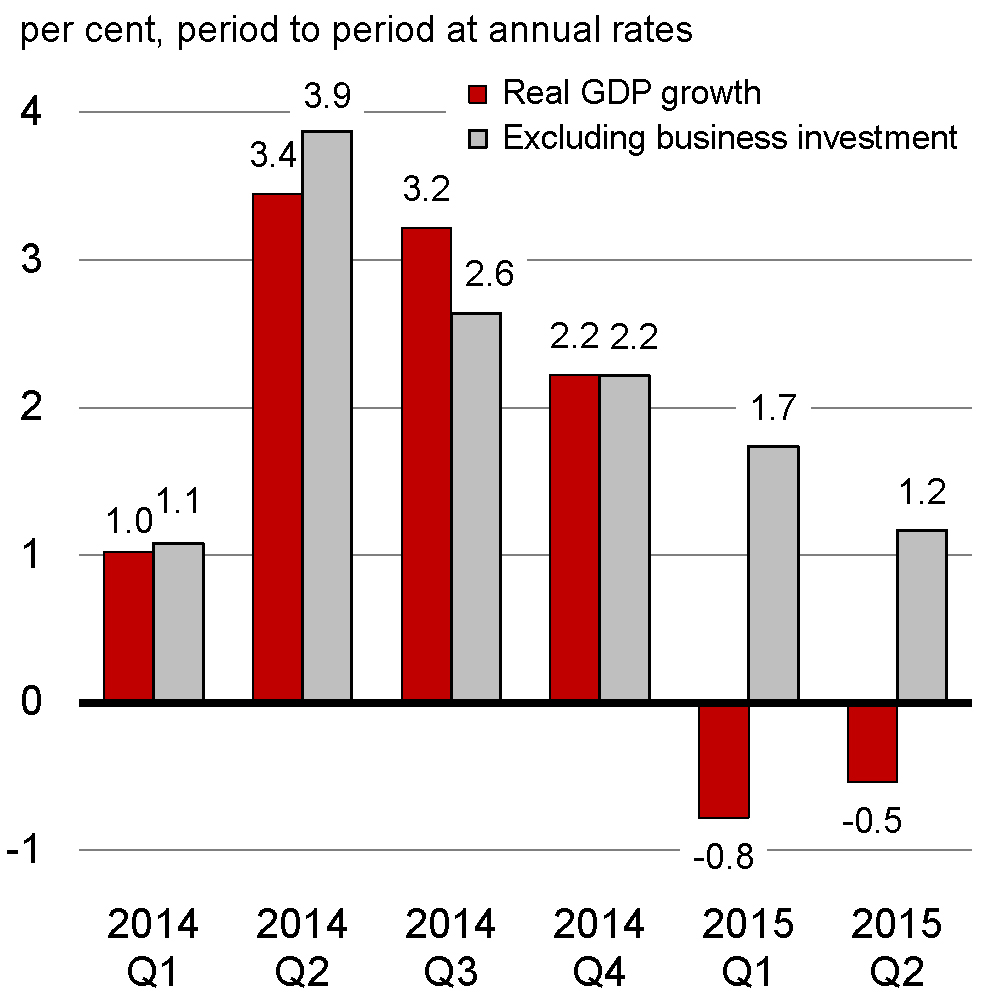
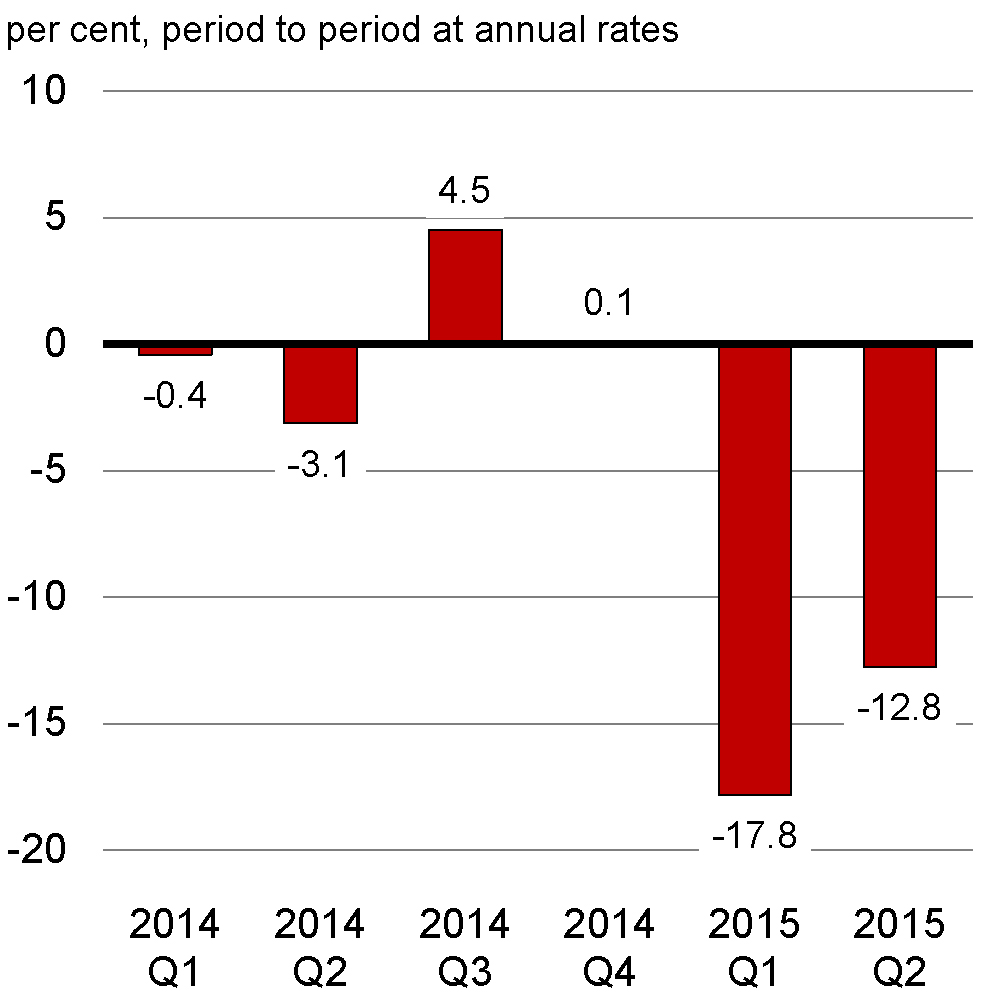
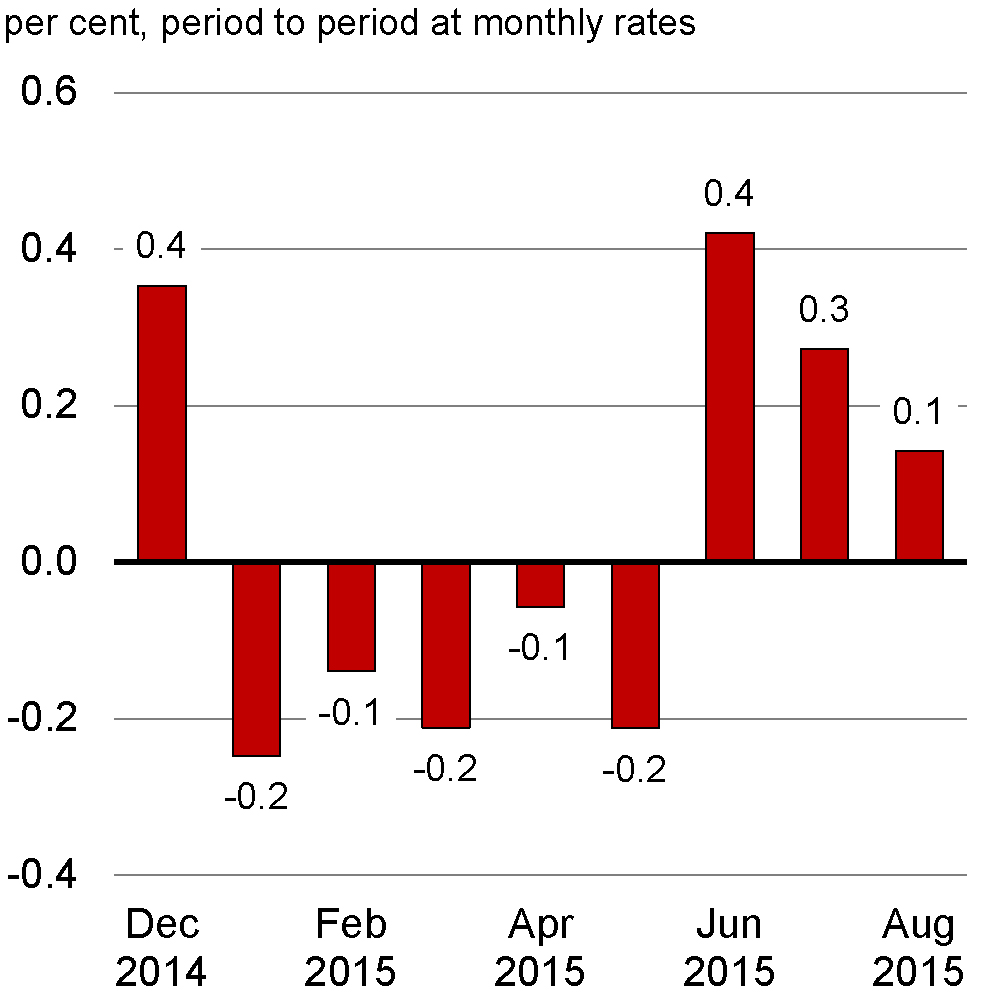
Following the collapse in oil prices in mid-2014, Canadian economic activity fell in the first half of 2015, with real GDP declining by 0.8 per cent in the first quarter and 0.5 per cent in the second quarter (Chart 2.9). Lower crude oil prices resulted in a reduction in the incomes and profits of firms in the energy sector. This, in turn, impacted real GDP as these firms implemented sharp reductions in their investment spending. Total business investment fell 17.8 per cent and 12.8 per cent in the first and second quarter of 2015 respectively, led by declines in the energy sector.
Despite the observed decline in overall economic output, the contraction during the first half of 2015 was concentrated in those areas of the economy most closely related to the energy sector. Output in these sectors fell by 7.0 per cent from December 2014 to May 2015. Output has recovered some of these losses and now stands 3.3 per cent below its level of December 2014. In contrast, output in all other sectors of the economy has grown by 0.4 per cent since December 2014 (Chart 2.10).
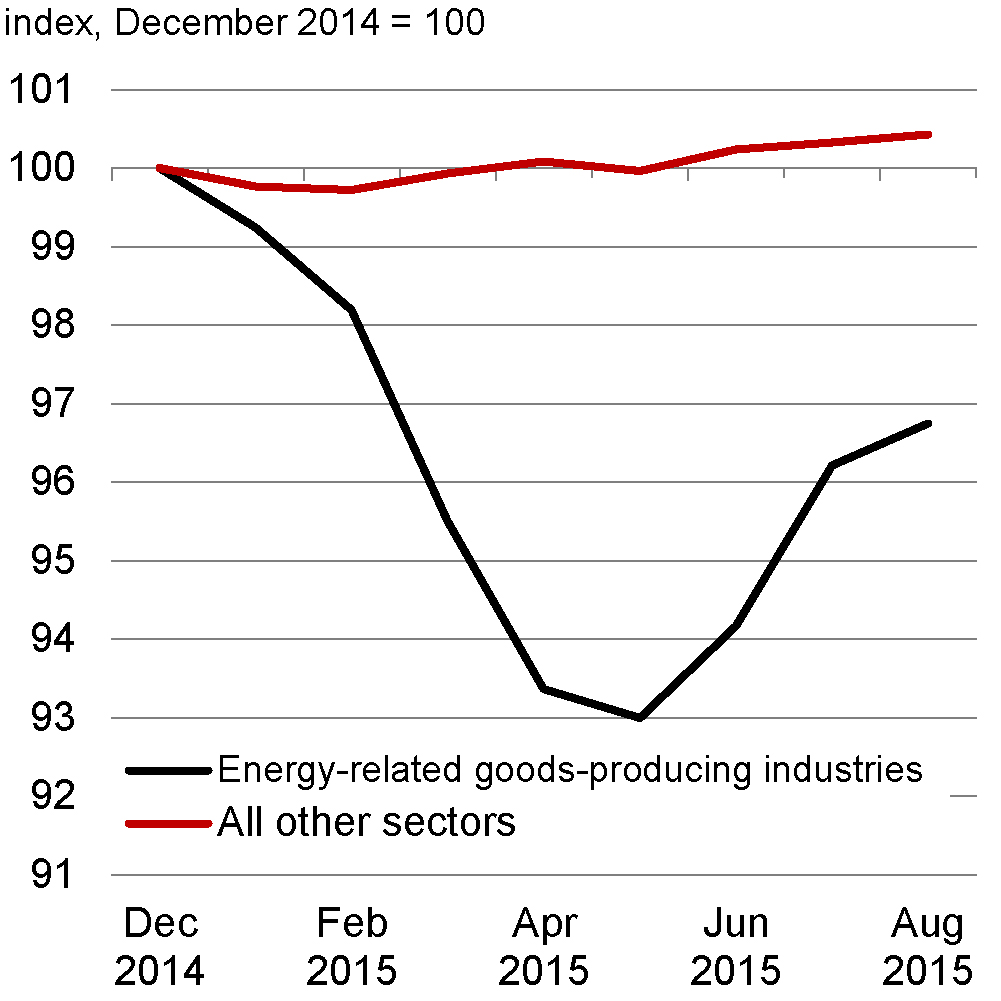
Notes: Real GDP at basic prices (2007 constant prices) by industry. Energy-related goods-producing industries include oil and gas extraction, support activities for mining and oil and gas extraction, and engineering and other construction activities. Last data point is August 2015.
Sources: Statistics Canada; Department of Finance calculations.
Note: Real GDP at basic prices (chained 2007 dollars) by industry.
Source: Statistics Canada.
Other factors restrained output growth in non-energy related sectors during the first half of 2015. These included weaker consumption (after consumption growth outpaced income growth in mid-2014), the very weak performance of the U.S. economy in the first quarter of 2015, and the temporary shutdown of a major auto plant in Ontario for retooling between February and June. In addition, the external economic environment over this period was highly uncertain, due to the near exit of Greece from the euro area and concerns about equity markets and overall economic prospects in China.
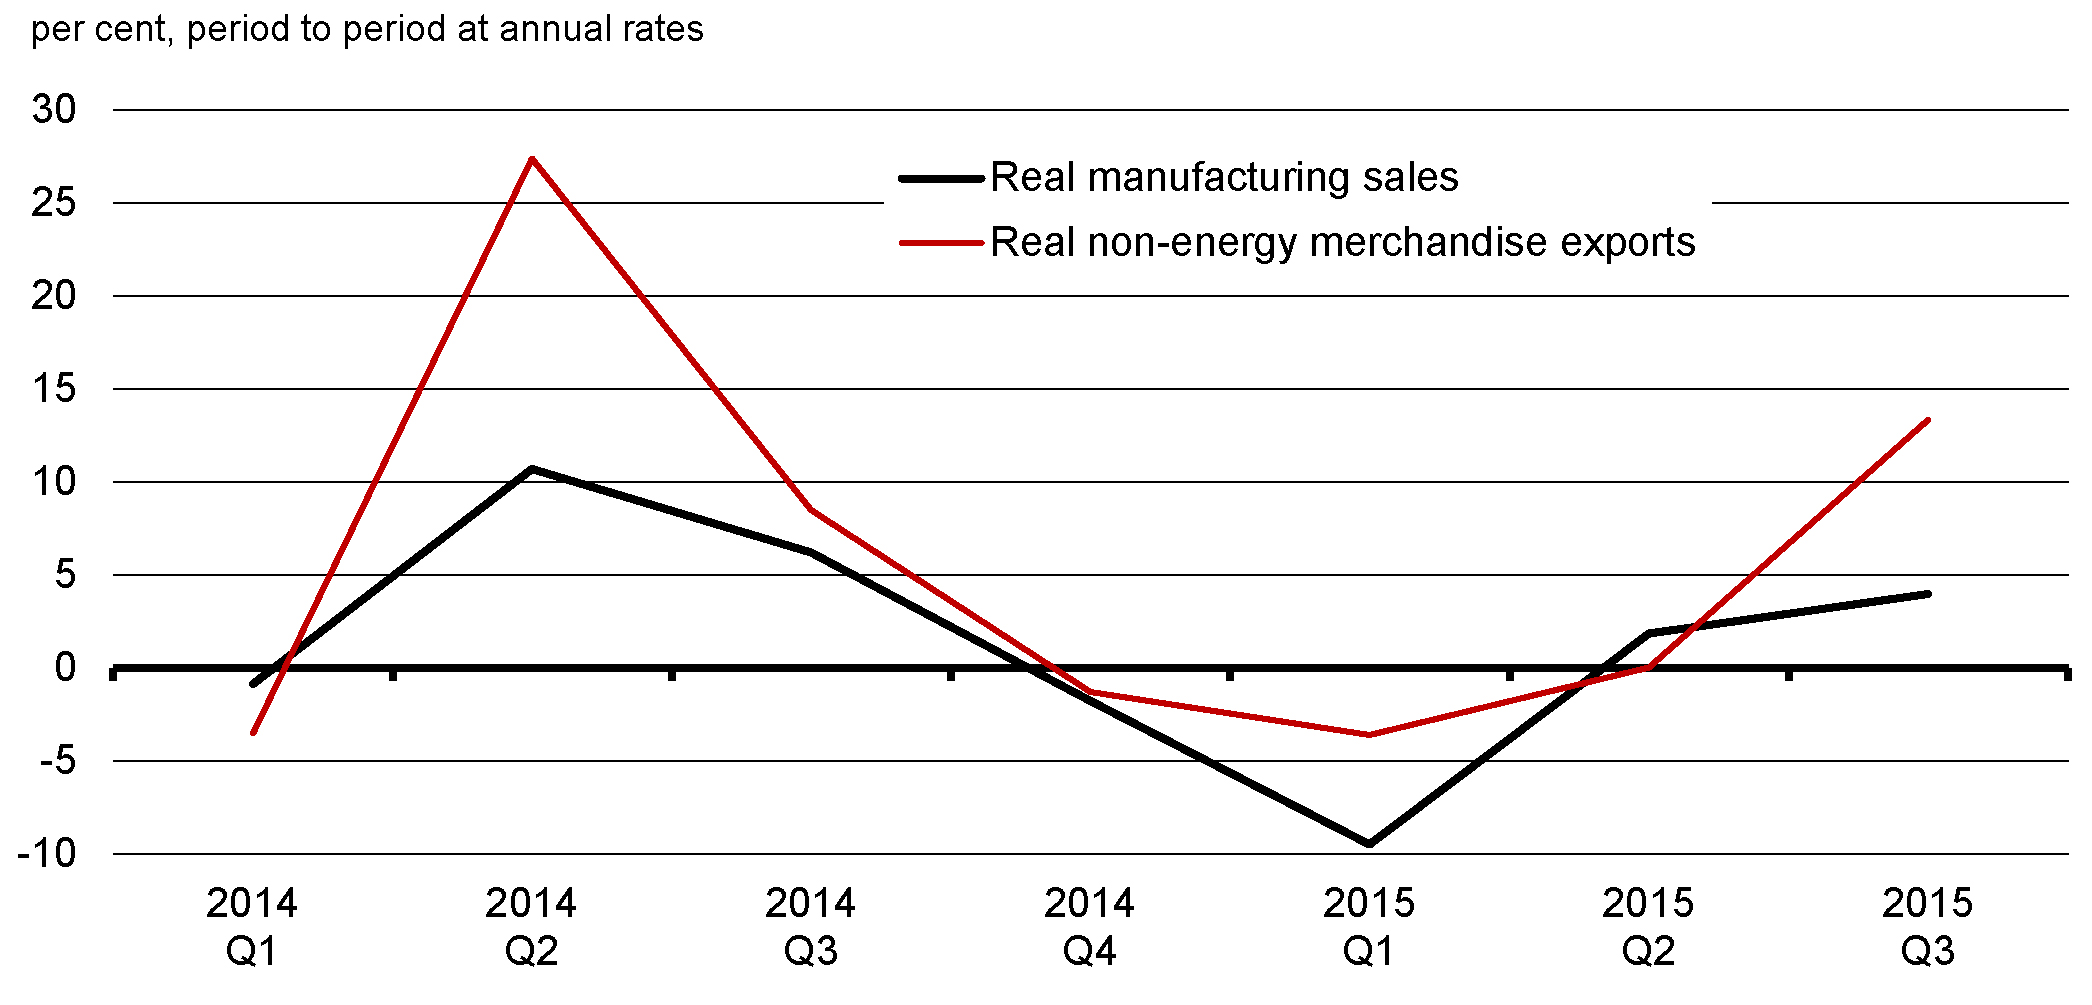
More recently growth in Canada has resumed, with monthly real GDP up in June, July and August following five consecutive months of declines. Real manufacturing sales grew by 4.0 per cent during the third quarter while real non-energy merchandise exports, which represent the vast majority of Canadian exports, rebounded by 13.3 per cent (Chart 2.11).
The pick-up in exports is also being aided by strong momentum in U.S. demand and the impact of the lower value of the Canadian dollar, which is making Canadian exports more competitive internationally. The Canadian dollar began depreciating in the third quarter of 2014. The current lower level of the dollar should continue to support export growth in Canada during 2016 and into 2017, given that a lower dollar generally takes about four to six quarters to reach its maximum impact on non-energy export growth.
Notes: Non-energy merchandise exports include all products other than crude oil and crude bitumen, natural gas, natural gas liquids and related products, and refined petroleum energy products. Last data point is 2015Q3.
Sources: Statistics Canada; Department of Finance calculations.
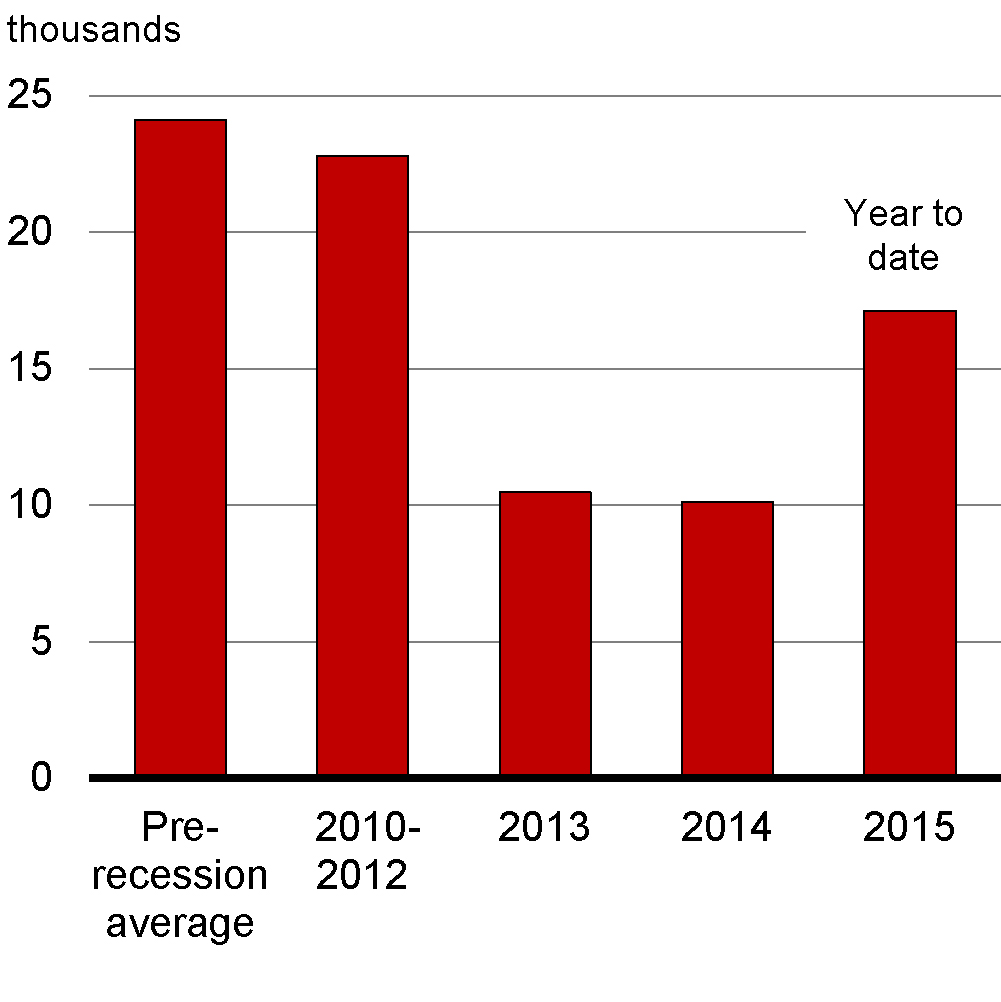
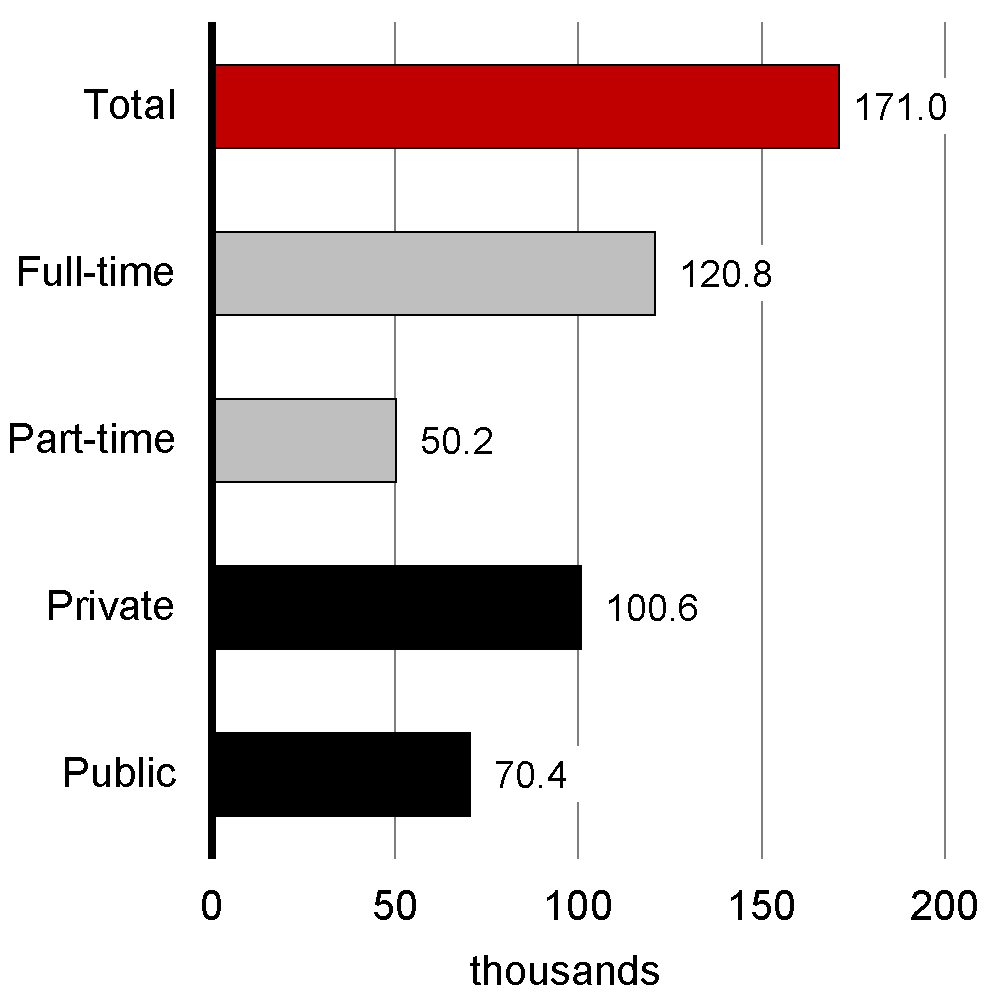
Employment has increased by 171,000 net jobs so far in 2015, or an average increase of 17,100 net jobs per month (Chart 2.12). While this is a stronger pace than that observed over the past two years, it is still much slower than the pace recorded in the years immediately following the recession (+22,800 per month).
Job gains in 2015 have been concentrated in full-time employment, which has increased by about 120,000 net jobs over the first 10 months of this year, while part-time employment has increased by about 50,000.
Source: Statistics Canada.
Source: Statistics Canada.
Employment growth in 2015 to date has been restrained by losses recorded in the energy sector and closely related industries—the construction sector (-31,500 net jobs) and the forestry, fishing, mining, oil and gas sector (-29,500 net jobs). These declines have been more than offset by gains elsewhere, including health care and social assistance services (+74,500 net jobs) and professional, scientific and technical services (+41,700 net jobs). Public administration employment has also increased solidly (+36,800 net jobs). However, this gain was in large part related to the temporary impact of the federal election, which boosted overall employment growth in October 2015 (Chart 2.13).
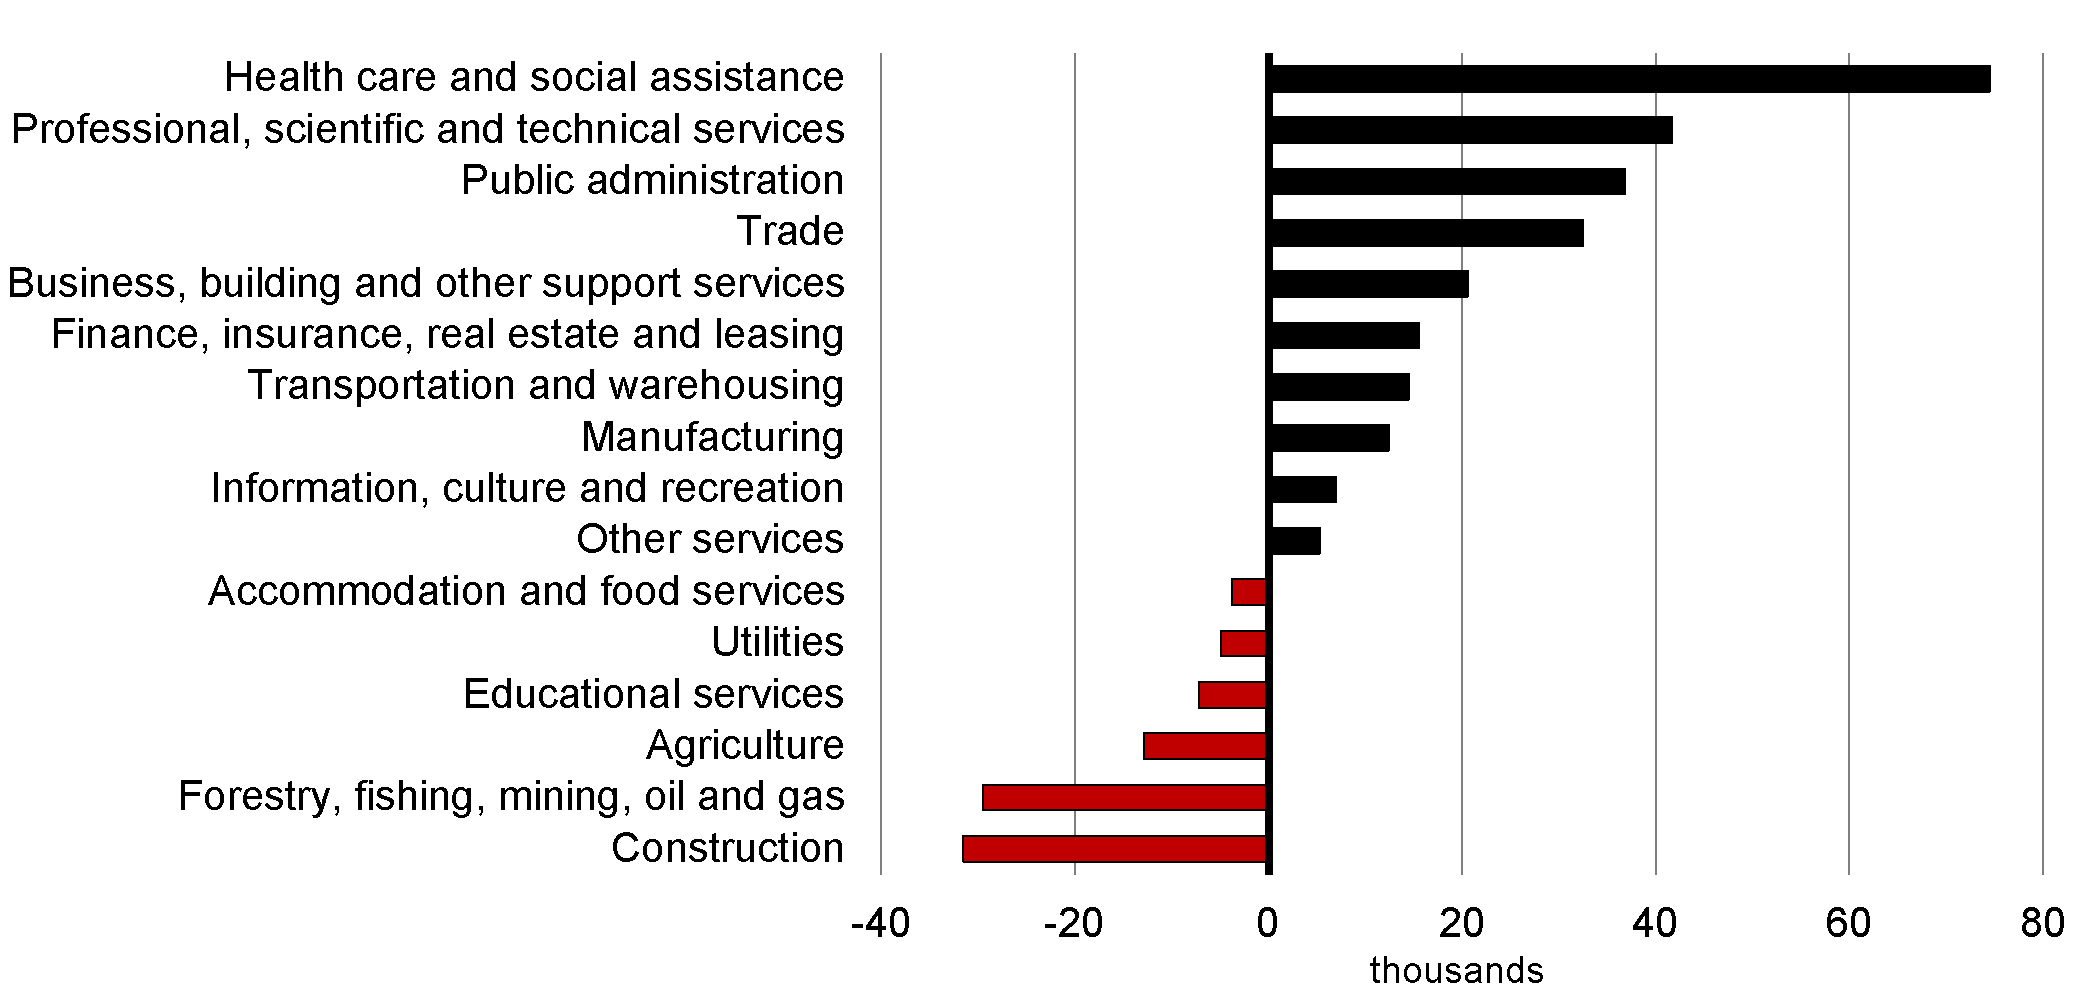
Sources: Statistics Canada; Department of Finance calculations.
Despite ongoing employment gains, the unemployment rate has edged up to 7.0 per cent as of October after reaching a low of 6.6 per cent in January 2015. This is due to the fact that employment gains have not kept pace with labour force growth throughout 2015, particularly in the Western provinces. Overall, the unemployment rate has not shown any durable declines since the beginning of 2013, but rather has averaged 7.0 per cent over this period. This compares to a pre-recession level of about 6 per cent. The youth unemployment rate remains more elevated at 13.3 per cent, which is about 2 percentage points above its
pre-recession level.
Residential investment has continued to support real GDP growth throughout 2015. New housing starts have strengthened since the beginning of the year, although they remain in line with demographic requirements. Existing home sales and prices have also generally risen, and later stabilized, through 2015. The appreciation in the national average home price continues to mostly reflect developments in Toronto and Vancouver. In these two cities, strength in resale prices is being bolstered by strong price gains among the most expensive homes in the single-detached segment, partly as a result of land scarcity and continued urban densification. In the rest of Canada, housing market activity has generally remained moderate (Chart 2.14). The exception is in resource-producing regions, such as Alberta, where the impact of lower oil prices led to a sharp cooling of housing market activity between November 2014 and February 2015. Alberta's housing market regained some of this lost ground through July 2015, but conditions have generally softened again since then.
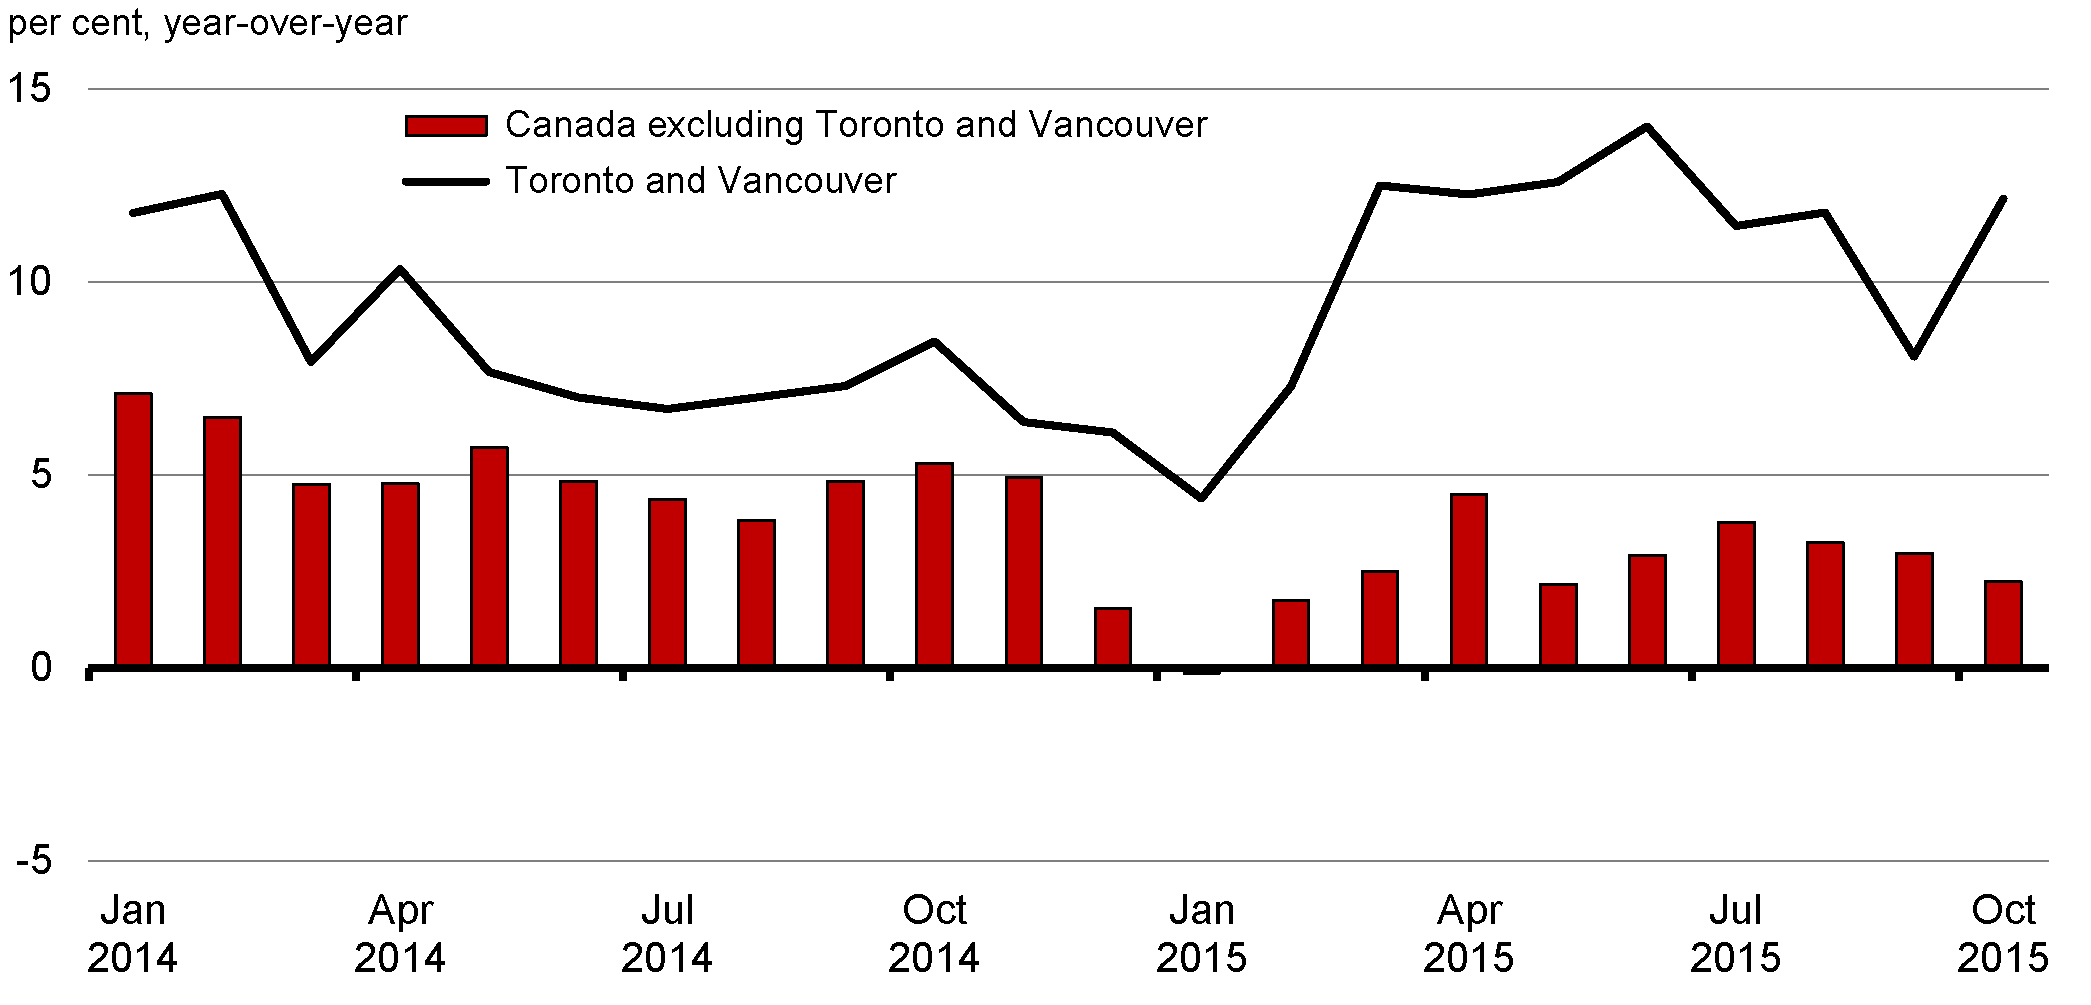
Sources: Canadian Real Estate Association; Department of Finance calculations.
Along with rising national house prices, there has been an increase in the level of household indebtedness in Canada, as the majority of household debt is mortgage debt. Household debt now stands at 165 per cent of disposable income (Chart 2.15). The rise in indebtedness has been more than matched by a rise in the value of assets held by the household sector—with assets not related to housing accounting for over 55 per cent of the gain since 2000. As a result, household net worth continues to rise, and is now more than 7.5 times disposable income.
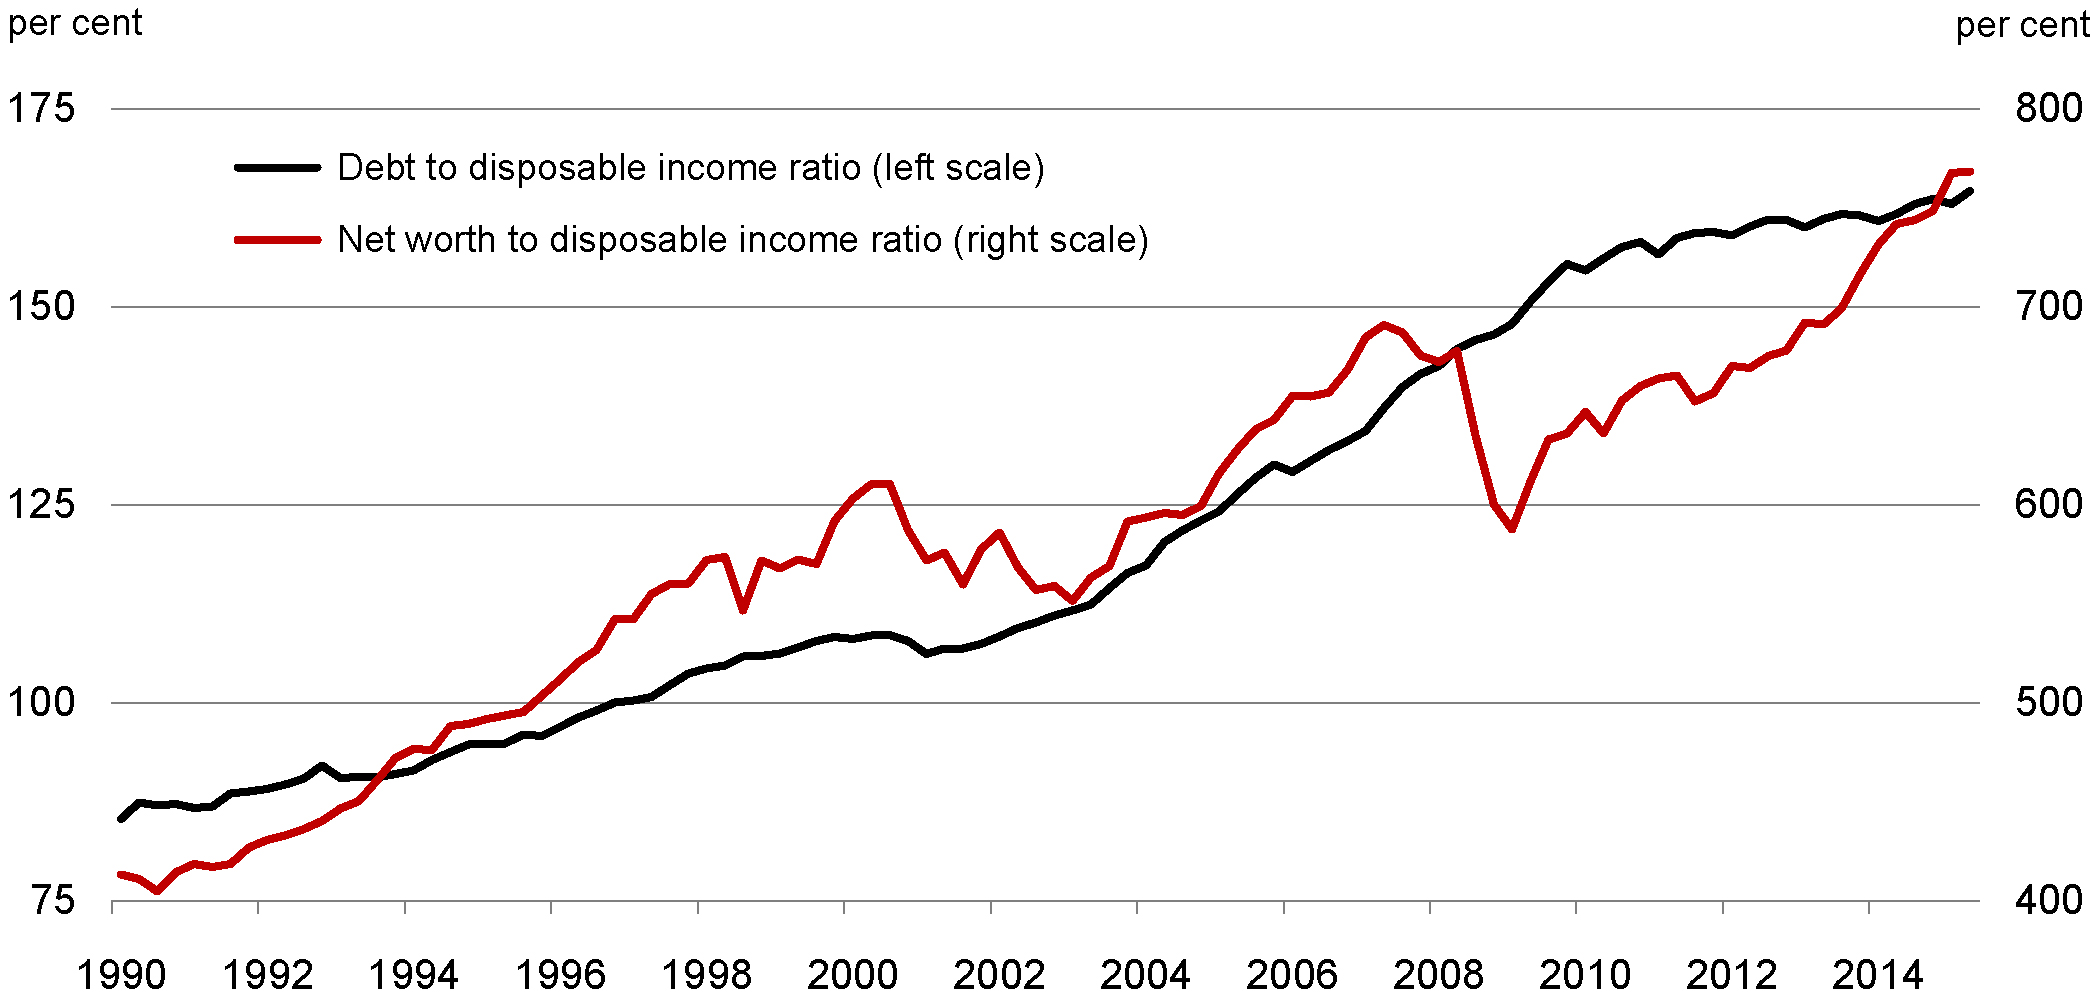
Source: Statistics Canada.
Several factors will support Canadian economic growth in the coming quarters. These include the lower value of the Canadian dollar and the steadily improving U.S. economy, both of which will help support exports. Accommodative monetary policy conditions are also continuing to support consumption and residential and business investment. However, given the renewed fall in crude oil prices in the third quarter, energy-related investment will likely continue to act as a drag on output growth in the second half of 2015 and into 2016, albeit to a lesser extent than in the first half of this year. Economic activity will continue to be heavily influenced by the global economy, which has experienced slower-than-anticipated growth in recent years and may continue to do so going forward.
Canadian Economic Outlook—Private Sector Forecasts
The average of private sector economic forecasts has been used as the basis for fiscal planning since 1994 and introduces an element of independence into the Government's fiscal forecast. This practice has been supported by international organizations such as the IMF.
The Department of Finance regularly surveys private sector economists on their views on the outlook for the Canadian economy. The economic forecast presented in this section is based on a survey conducted in the first week of October 2015.
The October 2015 survey includes the views of 15 private sector economists:
- BMO Capital Markets,
- Caisse de dépôt et placement du Québec,
- Canadian Federation of Independent Business,
- CIBC World Markets,
- The Conference Board of Canada,
- Desjardins,
- Deutsche Bank of Canada,
- IHS Global Insight,
- Industrial Alliance Insurance and Financial Services Inc.,
- Laurentian Bank Securities,
- National Bank Financial Group,
- Royal Bank of Canada,
- Scotiabank,
- TD Bank Financial Group, and
- the University of Toronto (Policy and Economic Analysis Program).
In the survey, private sector economists expect Canadian real GDP growth to slow to 1.2 per cent in 2015 from 2.4 per cent growth recorded in 2014, reflecting the contraction in output in the first half of this year (Table 2.1). Real GDP is expected to increase by 2.2 per cent on average over the second half of 2015 and to continue to grow by 2.0 per cent in 2016. Overall, economists expect real growth to average 1.9 per cent per year over the 2015 to 2019 period, 0.2 percentage points lower than their expectations at the time of Budget 2015 (Table 2.2).
WTI crude oil prices eased back to US$47 per barrel in the third quarter of 2015 following a 20 per cent increase that pushed prices up to US$58 per barrel on average in the second quarter. Private sector economists expect oil prices to remain virtually flat in the fourth quarter of 2015, leaving the average price for 2015 as a whole some US$5 lower than expected in Budget 2015. As of mid-November, WTI crude oil prices are trading just above US$40, down somewhat from their third-quarter levels. Prices are expected to increase in 2016 but at a slower pace than expected in Budget 2015. Beyond next year, the economists expect WTI prices to rise at a similar rate as projected in Budget 2015.
While GDP inflation (the broadest measure of economy-wide price inflation) was higher than anticipated in the first half of 2015, lower crude oil prices have led the private sector economists to revise down their expectations for GDP inflation for the second half of 2015 and for 2016.
As a result of these developments, nominal GDP growth in the October 2015 survey of private sector economists is expected to be 0.9 per cent in 2015 and 4.1 per cent in 2016 (compared with expectations of 1.6 per cent and 4.9 per cent, respectively, in Budget 2015). This has lowered the projected level of nominal GDP in the October survey by $15 billion in 2015 and by $32 billion, on average, over the 2016 to 2019 period, compared to the outlook in Budget 2015.
| Actual1 | Forecast | |||||||
|---|---|---|---|---|---|---|---|---|
| 2015Q1 | 2015Q2 | 2015Q3 | 2015Q4 | 2016Q1 | 2016Q2 | 2015 | 2016 | |
| Real GDP growth | ||||||||
| Budget 20152 | 1.2 | 1.5 | 2.0 | 2.3 | 2.4 | 2.3 | 2.0 | 2.2 |
| 2015 Fall Update | -0.8 | -0.5 | 2.5 | 2.0 | 2.2 | 2.1 | 1.2 | 2.0 |
| GDP inflation | ||||||||
| Budget 20152 | -3.1 | 1.0 | 2.5 | 2.7 | 2.9 | 2.5 | -0.3 | 2.6 |
| 2015 Fall Update | -1.8 | 1.2 | 0.3 | 1.7 | 2.7 | 2.4 | -0.2 | 2.1 |
| Nominal GDP growth | ||||||||
| Budget 20152 | -2.0 | 2.4 | 4.4 | 5.0 | 5.4 | 4.8 | 1.6 | 4.9 |
| 2015 Fall Update | -2.6 | 0.7 | 2.8 | 3.8 | 5.0 | 4.6 | 0.9 | 4.1 |
| WTI crude oil price ($US per barrel) | ||||||||
| Budget 2015 | 48 | 50 | 56 | 60 | 63 | 66 | 54 | 67 |
| 2015 Fall Update3 | 49 | 58 | 47 | 45 | 50 | 53 | 49 | 54 |
| 1 All values for 2015Q1 and 2015Q2 for the 2015 Fall Update are actual values and are in italics. 2 Annual figures have been restated due to historical revisions to the Canadian System of National Accounts from Statistics Canada. 3 The WTI crude oil price value for 2015Q3 for the 2015 Fall Update is an actual value and is in italics. Sources: Statistics Canada; Commodity Research Bureau; for Budget 2015, Department of Finance March 2015 survey of private sector economists; for the 2015 Fall Update, Department of Finance October 2015 survey of private sector economists. |
||||||||
The economists have revised up their outlook for the unemployment rate by 0.2 percentage points per year, on average, over the 2015 to 2019 period. They expect the unemployment rate to fall to 6.3 per cent by 2019.
Reflecting higher CPI inflation in the first half of 2015 than anticipated at the time of the budget, the outlook for CPI inflation has been revised up to 1.2 per cent in 2015 from 0.9 per cent. Beyond 2015, the inflation rate is expected to remain at around 2 per cent.
The economists have significantly revised down their expectations for both short- and long-term interest rates over the medium term relative to Budget 2015. This mainly reflects developments since the time of the budget. Interest rates have been lower than expected so far this year, consistent with the Bank of Canada's 25-basis-point reduction in the target for the overnight rate on July 15 and the softness in global growth during this period.
Risk Assessment
Risks surrounding the Canadian outlook remain tilted to the downside, mostly reflecting low and volatile global oil prices and a weak and uncertain global environment.
Externally, the overall risk remains that growth in emerging and advanced economies continues to fall short of expectations.
- Growth in China is expected to continue its gradual moderation. However, a sharper-than-expected slowdown remains possible, given the challenges facing Chinese authorities in balancing the reorientation of their economy to a more sustainable growth model with the goal of meeting their announced growth targets. A sharper slowdown in China would likely lead to further declines in global commodity prices, which would weigh further on the prices of Canada's energy and non-energy commodity exports. Slower growth in China could also lead to financial spillovers to China's trading partners.
- In the U.S., growth could once again disappoint. The most likely source is greater-than-expected drag from net exports, reflecting weaker foreign demand and further U.S.-dollar appreciation.
- The Federal Reserve is expected to begin raising its policy rate at the end of this year. The prospect of higher interest rates and a stronger U.S. dollar could cause a re-emergence of financial stress among emerging-market economies, particularly those with significant amounts of U.S.-dollar-denominated debt.
- Across advanced economies, productivity growth has continued to fall short of its pre-recession pace. Together with the ongoing impact of population aging on employment growth, this suggests that potential growth rates of advanced economies might stabilize at levels lower than those seen before the recession.
- Overall, this suggests that the pattern of continued global underperformance relative to expectations may not yet have run its course. There is therefore a risk that current global growth projections will again be too optimistic.
In Canada, the sharp decline in crude oil prices since mid-2014 has had clear negative impacts on the economy in the first half of 2015. While growth is expected to resume in the third quarter of 2015, the impact of sustained lower oil prices on the Canadian economy may not have been fully realized yet. Moreover, the possibility of further cutbacks in energy-related investment and employment could result in a re-emergence of very weak growth during the fourth quarter of 2015 and into the first half of 2016. A further decline in oil prices, or persistence in their current weakness, would result in further economic weakness.
Canadian household debt levels also remain elevated relative to historical norms. While this is not a risk in and of itself, it does limit the contribution that consumption and residential investment can make to growth. Moreover, if there were a negative external shock to the economy, this could trigger deleveraging among those households holding higher levels of debt, leading to a commensurate impact on consumption and residential investment.
Taken together, the above factors suggest that an extended period of sub-par global growth—as we have now seen since 2011—constitutes the most significant risk to the Canadian economy. This possibility, along with the potential for a more prolonged period of flat or even declining commodity prices and elevated levels of domestic household debt, could impede the return to stronger growth in Canada for some time to come.
While the balance of risks is clearly on the downside, there are also some upside risks to the outlook. Specifically, it is possible that oil prices will firm more rapidly than expected, that the U.S. economy could exhibit stronger-than-expected momentum and that the incipient slowdown in China is, and will be, less severe than thought.
In light of these risks, for fiscal planning purposes, the Government is adjusting downward the private sector forecast for nominal GDP by $10 billion for 2015 and $20 billion per year for 2016 through 2020, to account for the possibility of lower oil prices or that global growth will continue to disappoint. A $20 billion reduction in the level of nominal GDP in 2016 would roughly result from crude oil prices remaining flat at current levels, rather than rising as projected in the private sector survey. The Government will continue to evaluate economic developments and risks to determine whether or not it would be appropriate to maintain this forecast adjustment in the future. The fiscal outlook, including the impact of the forecast adjustment, which translates into a fiscal impact of $1.5 billion in 2015–16 and $3.0 billion per year between 2016–17 and 2020–21, is presented in Chapter 3.
| 2015 | 2016 | 2017 | 2018 | 2019 | 2020 | 2015– 2019 |
|
|---|---|---|---|---|---|---|---|
| Real GDP growth | |||||||
| Budget 20151 | 2.0 | 2.2 | 2.3 | 2.2 | 2.0 | – | 2.1 |
| 2015 Fall Update | 1.2 | 2.0 | 2.2 | 2.2 | 2.0 | 2.0 | 1.9 |
| GDP inflation | |||||||
| Budget 20151 | -0.3 | 2.6 | 2.3 | 2.1 | 2.1 | – | 1.8 |
| 2015 Fall Update | -0.2 | 2.1 | 2.4 | 2.1 | 2.2 | 2.1 | 1.7 |
| Nominal GDP growth | |||||||
| Budget 20151 | 1.6 | 4.9 | 4.7 | 4.3 | 4.2 | – | 3.9 |
| 2015 Fall Update | 0.9 | 4.1 | 4.6 | 4.4 | 4.2 | 4.2 | 3.7 |
| Nominal GDP level (billions of dollars) | |||||||
| Budget 20151 | 2,007 | 2,105 | 2,203 | 2,298 | 2,395 | – | – |
| 2015 Fall Update | 1,993 | 2,075 | 2,171 | 2,266 | 2,362 | 2,460 | – |
| Forecast adjustment | -10 | -20 | -20 | -20 | -20 | -20 | – |
| 2015 Fall Update—adjusted for planning purposes | 1,983 | 2,055 | 2,151 | 2,246 | 2,342 | 2,440 | – |
| Difference between 2015 Fall Update adjusted for planning purposes and Budget 20151 | -25 | -50 | -52 | -52 | -53 | – | – |
| 3-month treasury bill rate | |||||||
| Budget 2015 | 0.6 | 1.0 | 2.0 | 2.7 | 3.0 | – | 1.9 |
| 2015 Fall Update | 0.5 | 0.6 | 1.3 | 2.1 | 2.7 | 3.0 | 1.4 |
| 10-year government bond rate | |||||||
| Budget 2015 | 1.7 | 2.5 | 3.2 | 3.7 | 3.9 | – | 3.0 |
| 2015 Fall Update | 1.5 | 2.1 | 2.8 | 3.3 | 3.6 | 3.9 | 2.7 |
| Exchange rate (US cents/C$) | |||||||
| Budget 2015 | 79.2 | 80.8 | 83.6 | 85.5 | 86.5 | – | 83.1 |
| 2015 Fall Update | 78.2 | 75.4 | 78.8 | 81.4 | 83.3 | 84.9 | 79.4 |
| Unemployment rate | |||||||
| Budget 2015 | 6.7 | 6.6 | 6.3 | 6.2 | 6.1 | – | 6.4 |
| 2015 Fall Update | 6.8 | 6.8 | 6.6 | 6.4 | 6.3 | 6.3 | 6.6 |
| Consumer Price Index inflation | |||||||
| Budget 2015 | 0.9 | 2.2 | 2.0 | 2.0 | 2.0 | – | 1.8 |
| 2015 Fall Update | 1.2 | 2.0 | 2.1 | 2.0 | 1.9 | 2.0 | 1.8 |
| U.S. real GDP growth | |||||||
| Budget 2015 | 3.1 | 2.9 | 2.6 | 2.4 | 2.4 | – | 2.7 |
| 2015 Fall Update | 2.6 | 2.7 | 2.6 | 2.4 | 2.3 | 2.3 | 2.5 |
| WTI crude oil price ($US per barrel) | |||||||
| Budget 2015 | 54 | 67 | 75 | 78 | 78 | – | 70 |
| 2015 Fall Update | 49 | 54 | 64 | 68 | 70 | 74 | 61 |
| 1 Figures have been restated due to historical revisions to the Canadian System of National Accounts from Statistics Canada.
Sources: For Budget 2015, Department of Finance March 2015 survey of private sector economists; for the 2015 Fall Update, Department of Finance October 2015 survey of private sector economists. |
|||||||
- Date modified: