Archived - Update of Economic and Fiscal Projections: Highlights and Chapter 1
Archived information
Archived information is provided for reference, research or recordkeeping purposes. It is not subject to the Government of Canada Web Standards and has not been altered or updated since it was archived. Please contact us to request a format other than those available.
Highlights
- The Government will pursue an approach to fiscal management that is realistic, sustainable, prudent and transparent.
- This Update of Economic and Fiscal Projections reviews the federal government’s economic and fiscal outlook, which has deteriorated since the previous Government presented the budget in April 2015.
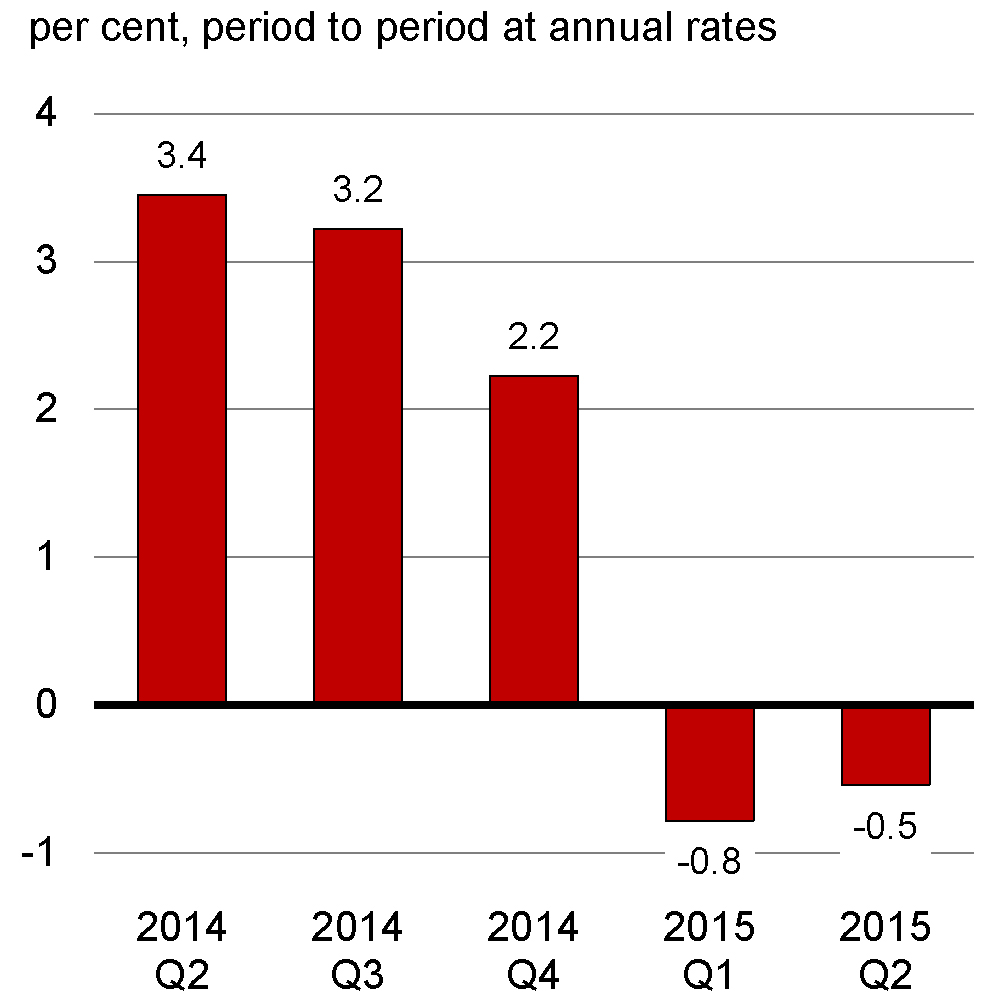
- The Canadian economy contracted in the first half of 2015, with real gross domestic product (GDP) declining by 0.8 per cent in the first quarter and 0.5 per cent in the second quarter.
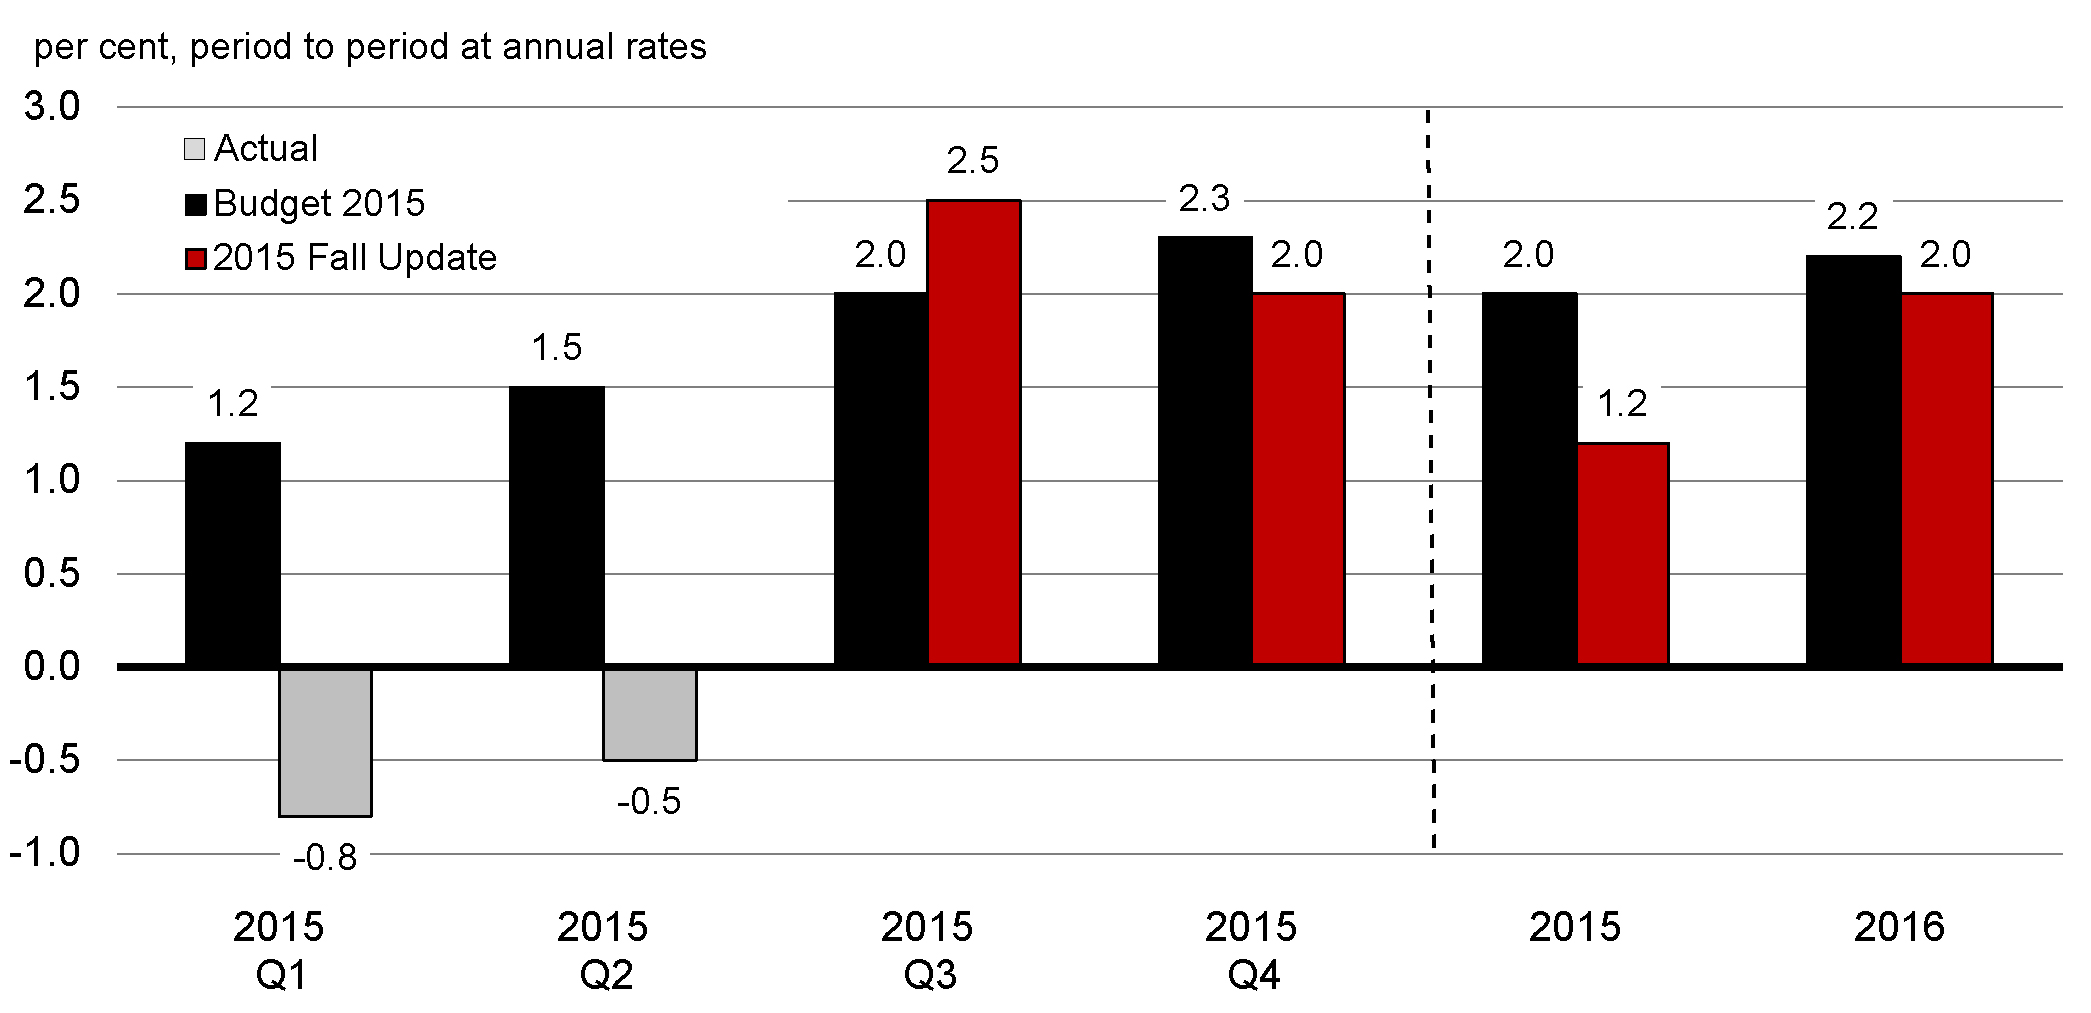
- Real GDP is expected to increase by 2.2 per cent on average over the second half of 2015 and to continue to grow at a modest pace in 2016.
- In addition, the outlook for GDP inflation, which measures the change in economy-wide prices, has been revised down, reflecting lower crude oil prices than anticipated at the time of the budget.
- These economic developments have led to a downward adjustment to the fiscal outlook. Notably, projected tax revenues are being dragged down by lower expected nominal GDP, while projected expenses are being driven up by higher expected Employment Insurance claims and charges related to the cost of employee benefits as a result of lower interest rates.
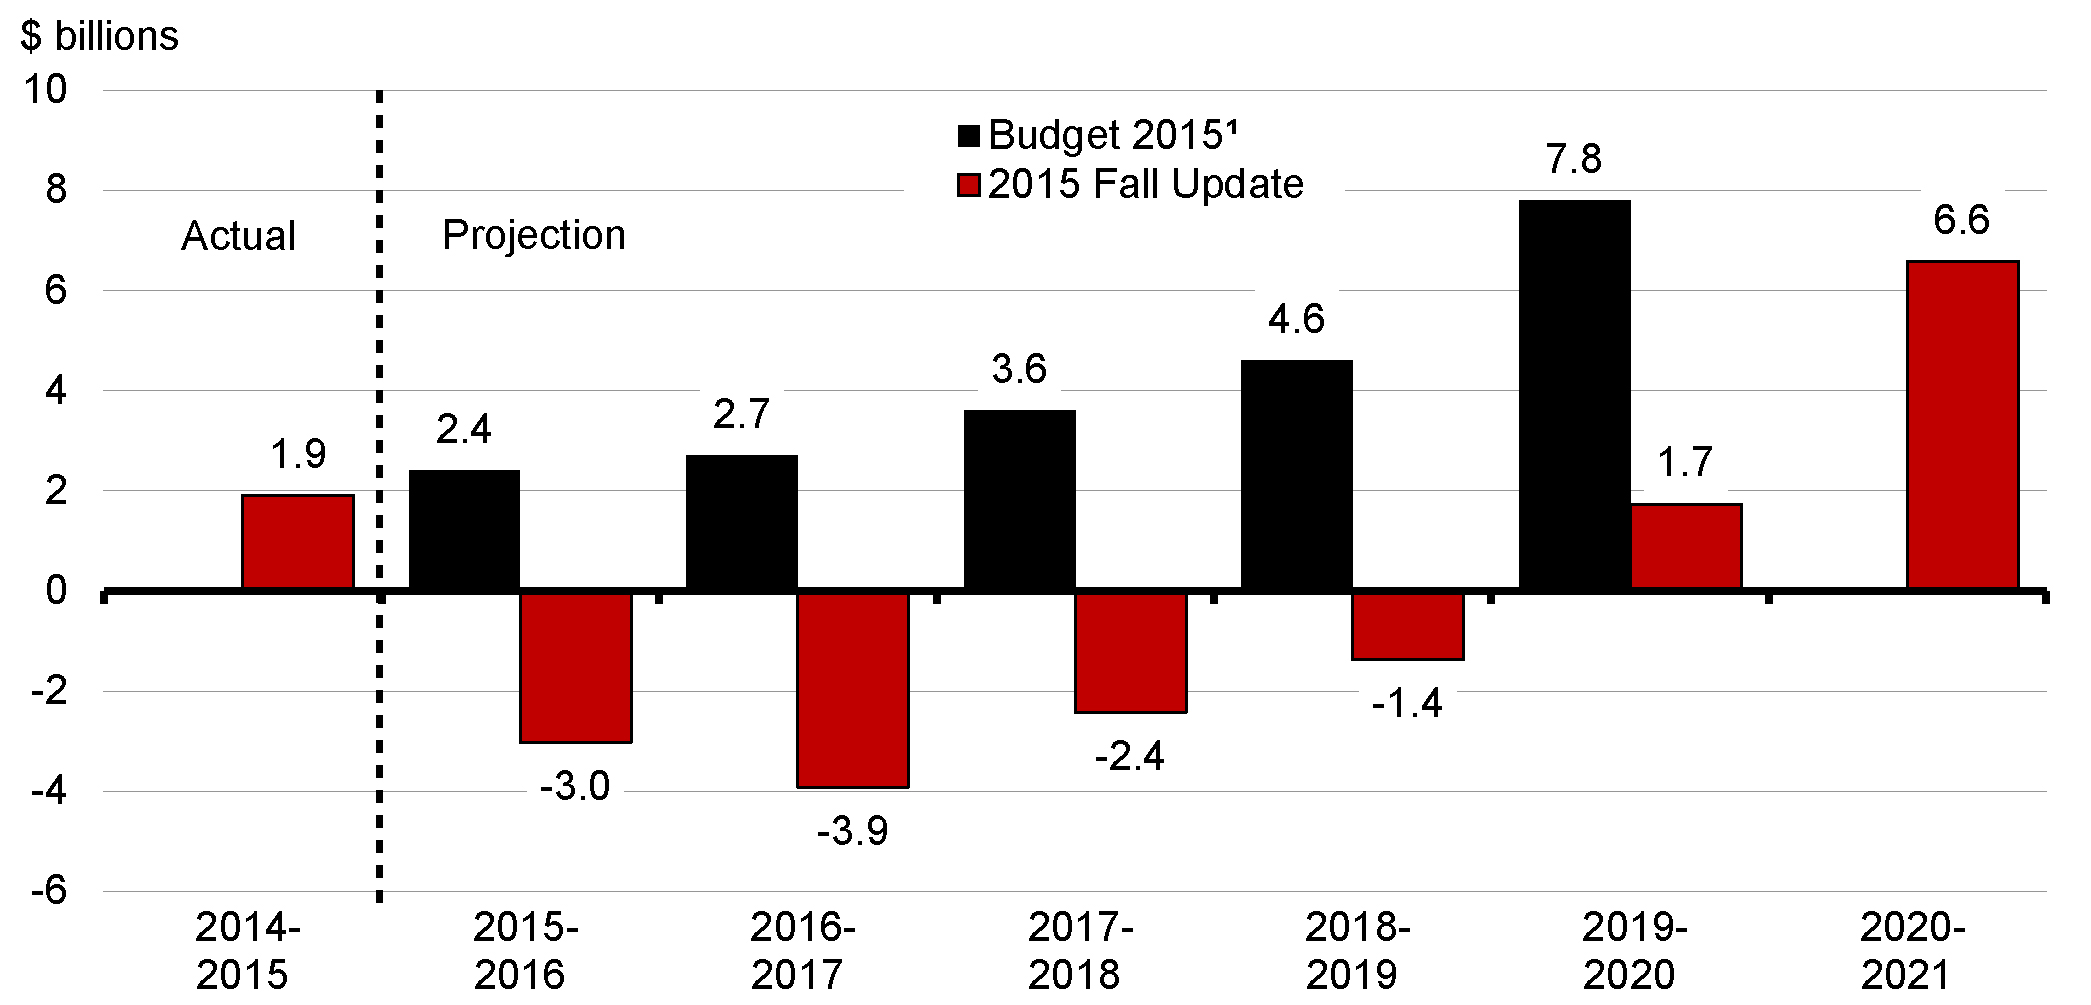
- These developments have reduced the projected budgetary balance by about $6.0 billion per year, on average, relative to Budget 2015, resulting in deficits of $3.0 billion in 2015–16 and $3.9 billion in 2016–17 and improving to surpluses of $1.7 billion in 2019–20 and $6.6 billion in 2020–21.
- These are the fiscal projections inherited by this Government. They do not include any measures adopted by this Government. Nor do they include any of the economic and fiscal benefits arising from the Government’s fiscal investments, including infrastructure and measures to invest in low- and middle-income families.
- Further details on the Government’s medium- and long-term fiscal objectives will be outlined in the 2016 budget.
Chapter 1 - Introduction
The Government will pursue an approach to fiscal management that is realistic, sustainable, prudent and transparent. This Update of Economic and Fiscal Projections reviews the federal government’s economic and fiscal outlook, which has deteriorated since the previous Government presented the budget in April 2015 (Budget 2015).
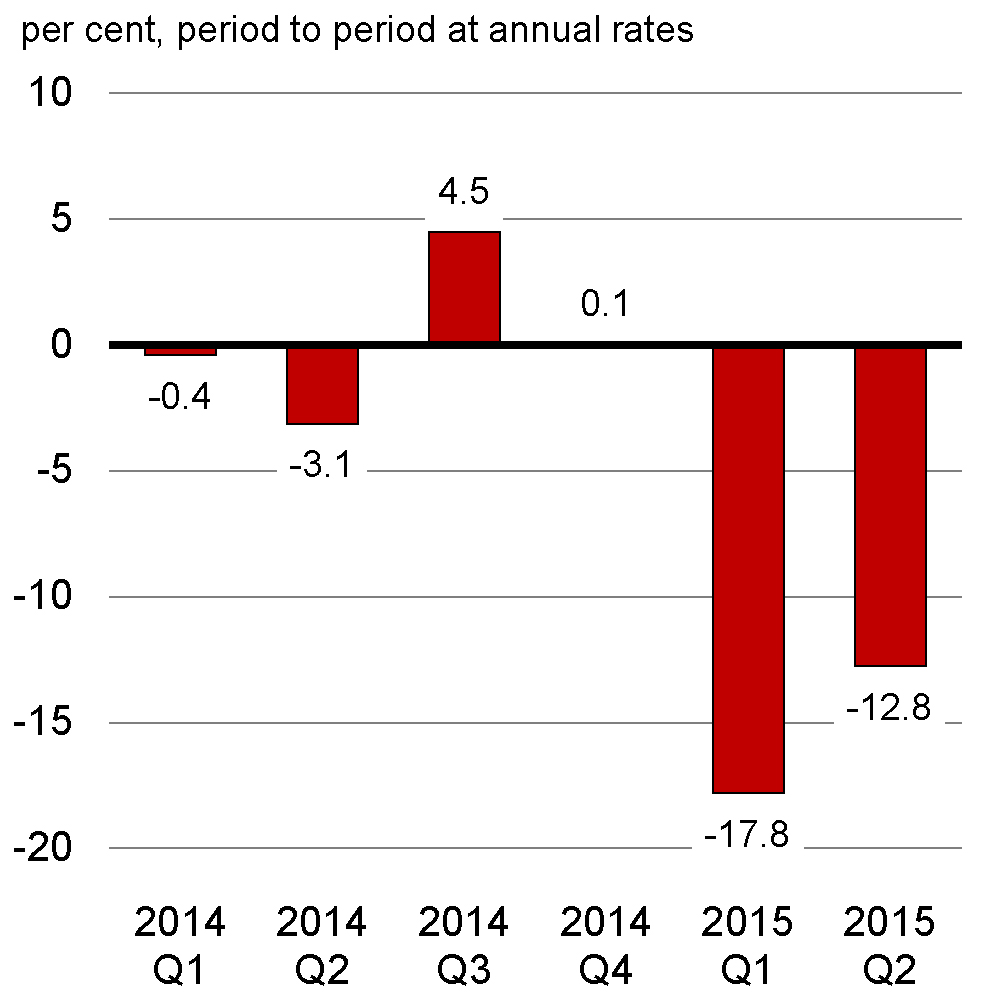
The Canadian economy contracted in the first half of 2015, with real gross domestic product (GDP) declining by 0.8 per cent in the first quarter and 0.5 per cent in the second quarter (Chart 1.1). Lower crude oil prices resulted in a reduction in incomes and profits in the energy sector, leading to a significant drop in total business investment.
Several other factors also contributed to the contraction in real GDP during the first half of 2015. These included the very weak performance of the U.S. economy in the first quarter, as well as elevated global economic uncertainty due to the near exit of Greece from the euro area and concerns about economic prospects in China.
More recently, growth in Canada has resumed, with monthly real GDP up in June, July and August following five consecutive months of declines. Several factors will continue to support Canadian economic growth going forward, including the lower value of the dollar, the steadily improving U.S. economy and the ongoing impact of accommodative monetary policy.
However, risks to the Canadian outlook remain tilted to the downside, primarily reflecting low and volatile crude oil prices and a weak and uncertain global environment. Indeed, global growth projections for this year have once again been marked down from expectations at the time of Budget 2015 (Chart 1.2).
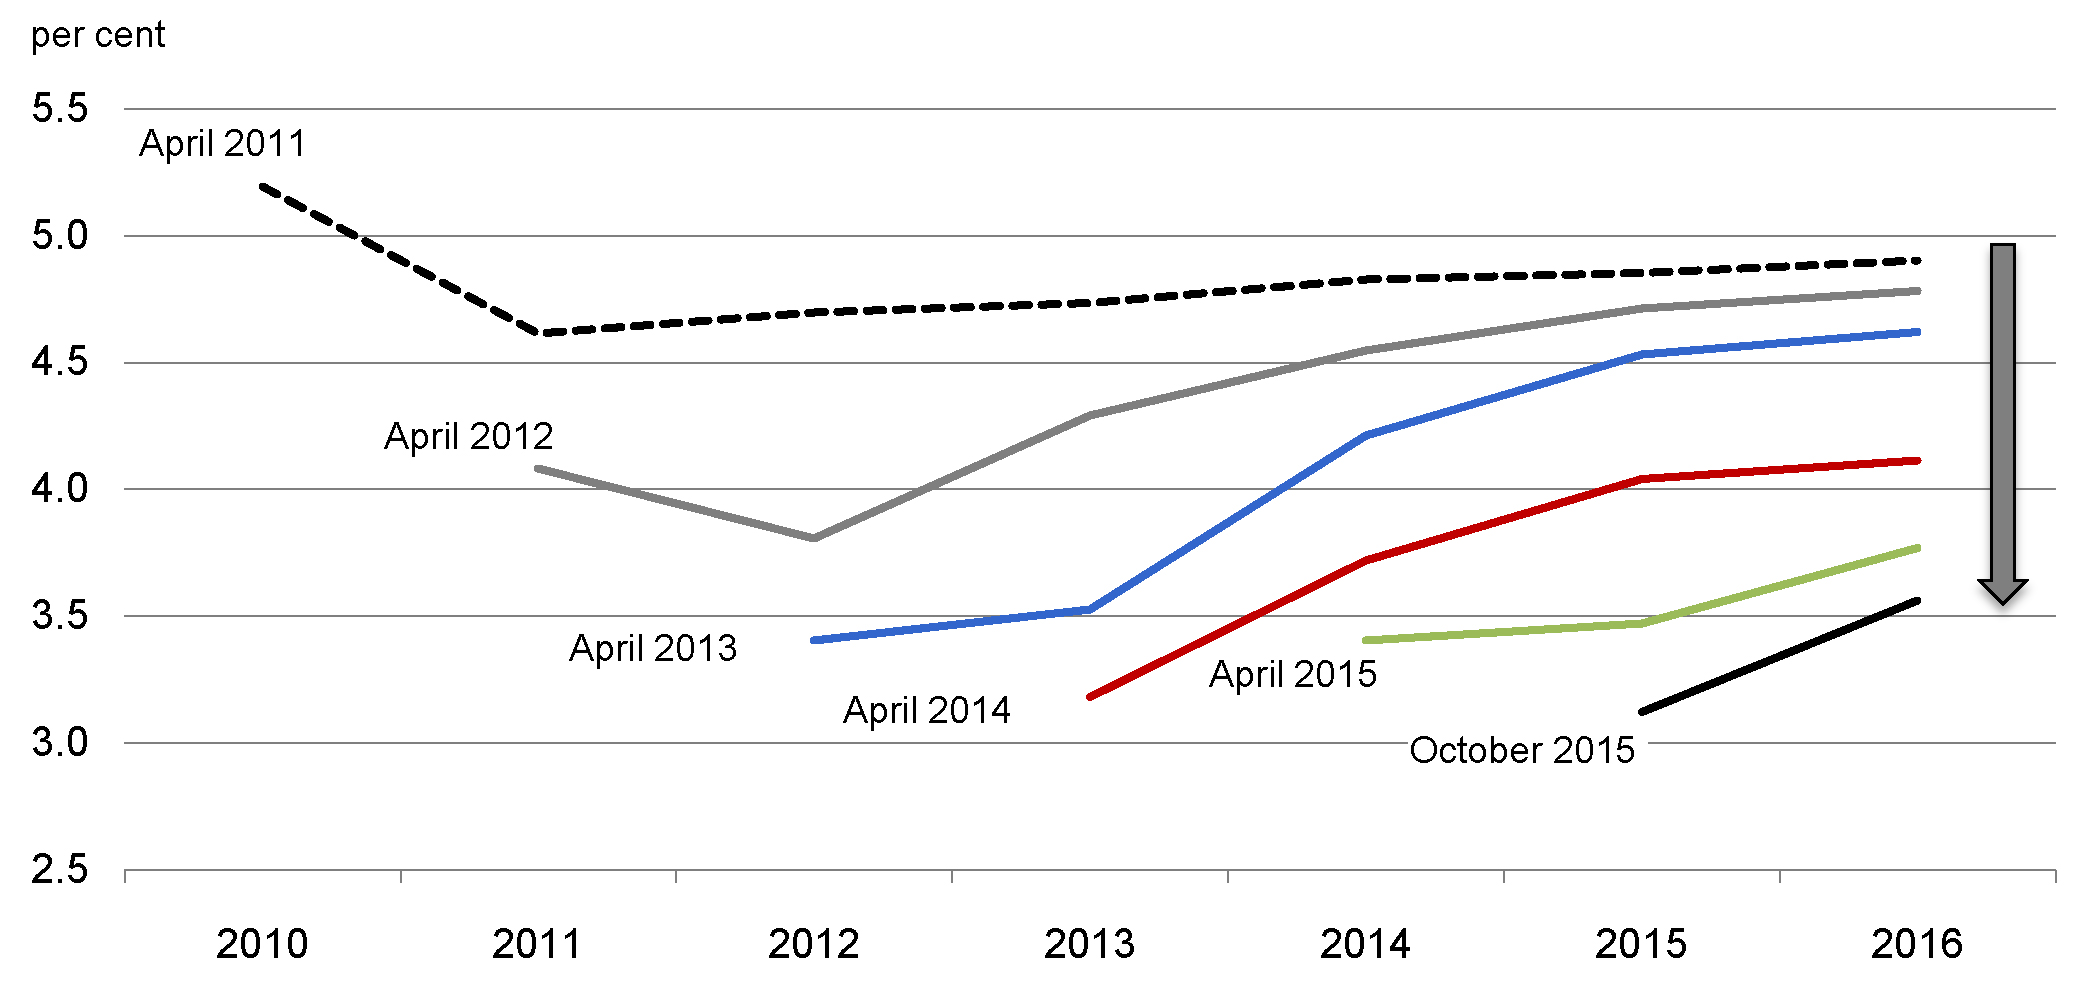
Sources: International Monetary Fund, April 2011, April 2012, April 2013, April 2014, April 2015 and October 2015 World Economic Outlook; Department of Finance calculations.
The Department of Finance regularly surveys private sector economists on their views on the outlook for the Canadian economy. The average of the private sector economic forecasts has been used as the basis for fiscal planning since 1994 and introduces an element of independence into the Government’s fiscal forecast. This practice has been supported by international organizations such as the International Monetary Fund, and will be continued by this Government.
In the latest survey, which was conducted in October, private sector economists expect Canadian real GDP growth to slow to 1.2 per cent in 2015 from 2.4 per cent growth recorded in 2014, reflecting the contraction in output in the first half of this year (Chart 1.3). Real GDP is expected to increase by 2.2 per cent on average over the second half of 2015 and to continue to grow at a modest pace in 2016. Overall, economists expect real growth to average 1.9 per cent per year over the 2015 to 2019 period, 0.2 percentage points lower than their expectations at the time of Budget 2015.
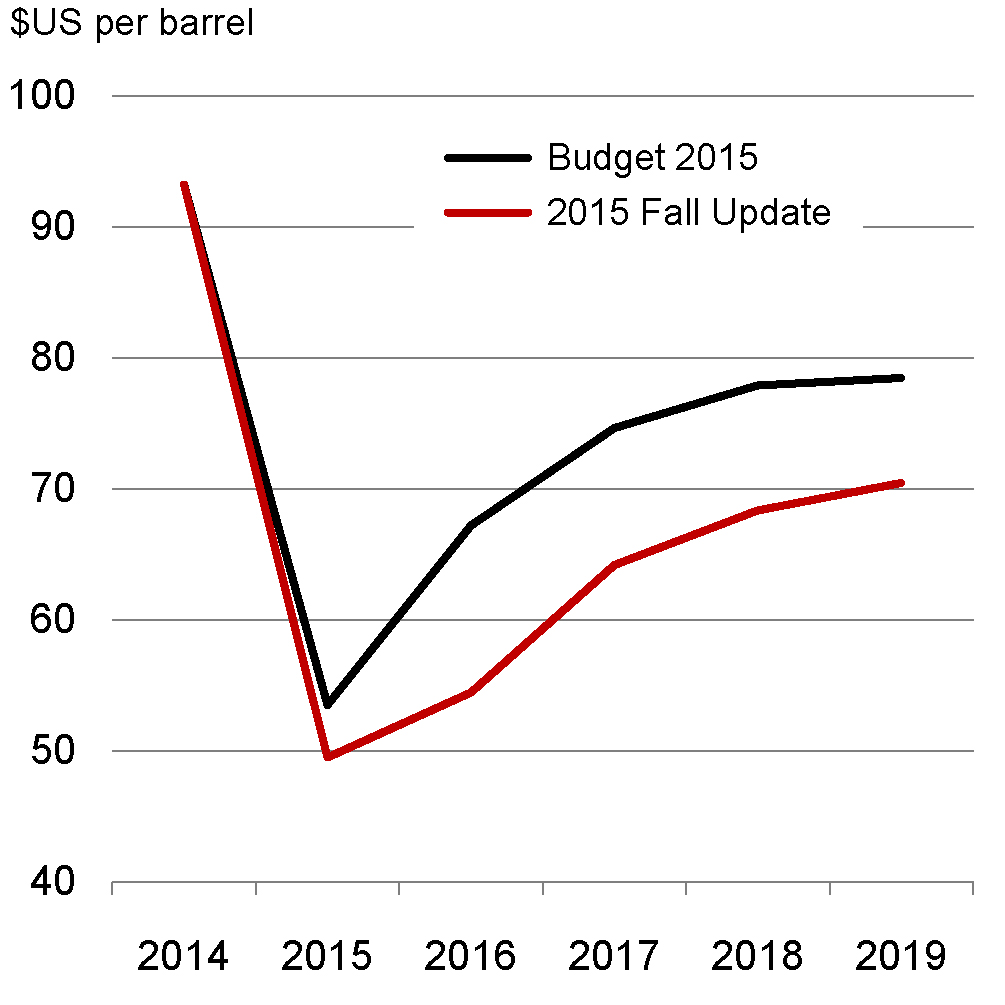
Furthermore, the outlook for GDP inflation, which measures the change in economy-wide prices, has been revised down for the second half of 2015 and 2016. This reflects a smaller increase in global crude oil prices than anticipated at the time of Budget 2015.
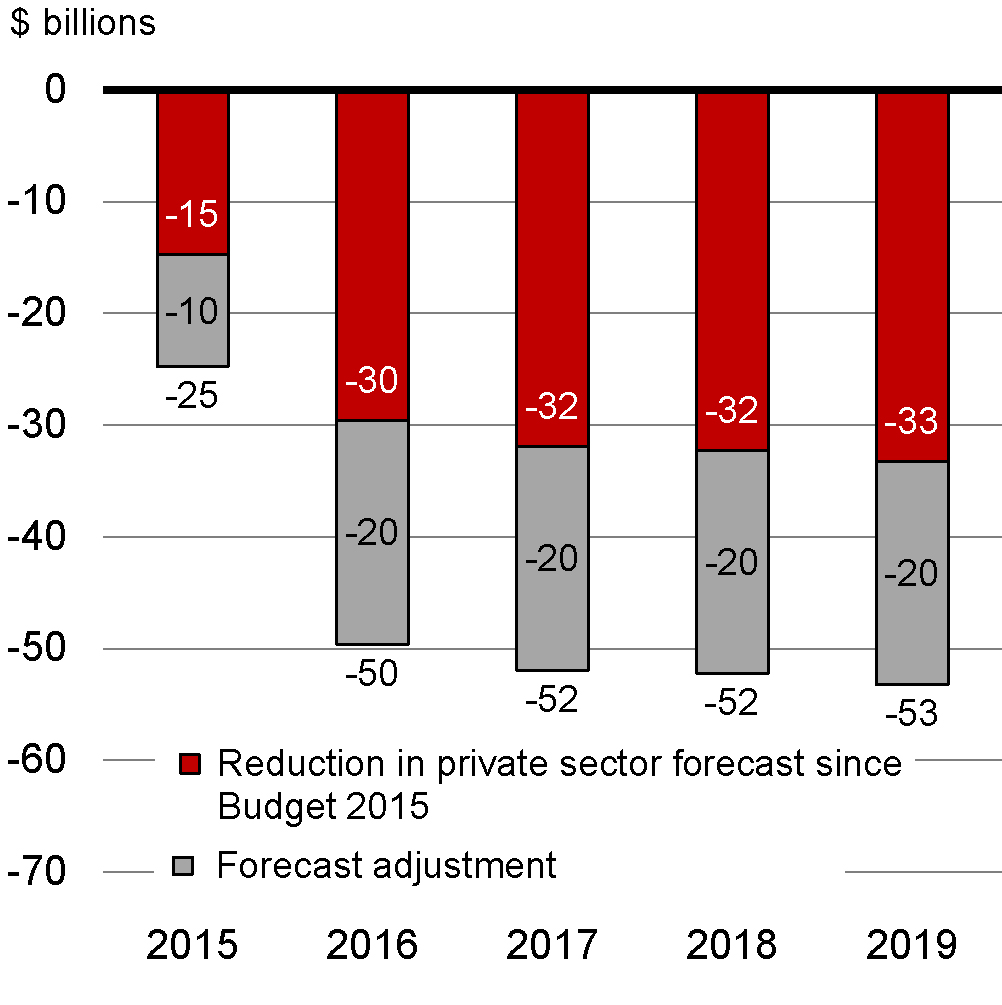
As a result, the projected level of nominal GDP in the October survey has been lowered by $15 billion in 2015 and by $32 billion per year, on average, over the 2016 to 2019 period, compared to the outlook in Budget 2015.
The balance of risks to the Canadian economic outlook remain tilted to the downside, reflecting both uncertainty about the projected recovery in global oil prices and a weak and uncertain global environment. Taken together, the overall risk remains that growth continues to fall short of expectations. In light of this, for fiscal planning purposes, the Government is adjusting downward the private sector forecast for nominal GDP by $10 billion for 2015 and $20 billion per year for 2016 through 2020 to account for the possibility of lower oil prices or that global growth will once again disappoint. This results in an average reduction since the 2015 budget of approximately $46 billion per year to projected nominal GDP over the forecast horizon (Chart 1.4).
Economic developments have led to a downward adjustment to the fiscal outlook, leading to projected deficits of $3.0 billion in 2015–16 and $3.9 billion in 2016–17 and improving to surpluses of $1.7 billion in 2019–20 and $6.6 billion in 2020–21 (Chart 1.5). Projected tax revenues are being dragged down by lower expected nominal GDP, while projected expenses are being driven up by higher expected Employment Insurance claims and charges on the accrual of employee benefits as a result of lower interest rates.
Source: Department of Finance.
These are the fiscal projections inherited by this Government. They do not include any measures adopted by this Government, nor do they include any of the economic and fiscal benefits arising from the Government’s fiscal investments, including infrastructure and measures to invest in low- and middle-income families.
- Date modified: