Archived - Update of Economic and Fiscal Projections: Chapter 3 - Changes in the Fiscal Outlook Since the April 2015 Budget
Archived information
Archived information is provided for reference, research or recordkeeping purposes. It is not subject to the Government of Canada Web Standards and has not been altered or updated since it was archived. Please contact us to request a format other than those available.
As described in Chapter 2, the projection for nominal gross domestic product (GDP) for planning purposes has been revised down since the Government’s April 2015 budget (Budget 2015). The lower forecast for nominal GDP largely reflects the contraction in real output during the first half of the year and the economic impact of the decline in commodity prices, led by lower crude oil prices. Interest rates are also lower than projected in Budget 2015.
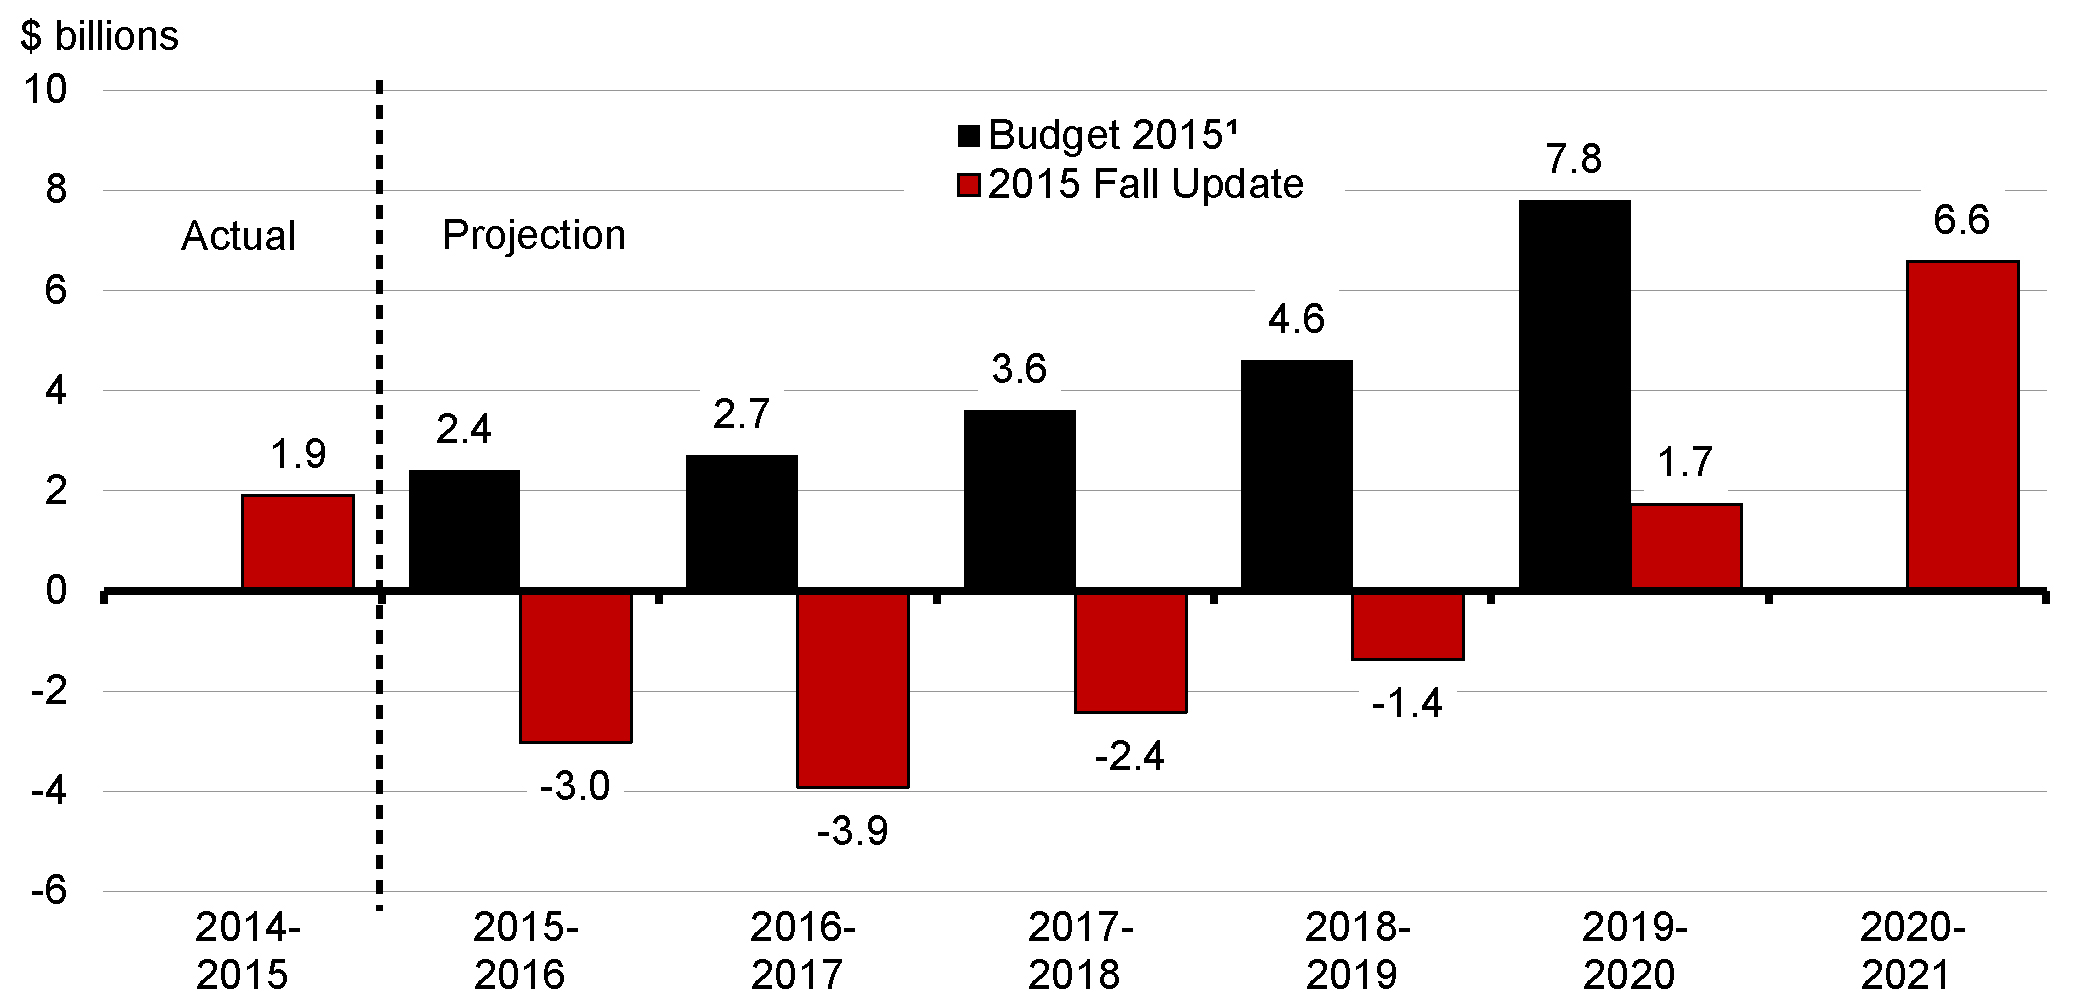
Altogether, these developments have reduced the projected budgetary balance by about $6.0 billion per year, on average, relative to Budget 2015, resulting in deficits of $3.0 billion in 2015–16 and $3.9 billion in 2016–17 and improving to surpluses of $1.7 billion in 2019–20 and $6.6 billion in 2020–21 (Chart 3.1).
A summary of changes since Budget 2015 is provided in Table 3.1.
Source: Department of Finance.
| Projection | |||||||
|---|---|---|---|---|---|---|---|
| 2014– 2015 |
2015– 2016 |
2016– 2017 |
2017– 2018 |
2018– 2019 |
2019– 2020 |
2020– 2021 |
|
| Budget 2015 budgetary balance1 | -2.0 | 2.4 | 2.7 | 3.6 | 4.6 | 7.8 | n/a |
| Economic and fiscal developments since Budget 2015 | 3.9 | -5.4 | -6.6 | -6.1 | -6.0 | -6.1 | |
| Revised budgetary balance | 1.9 | -3.0 | -3.9 | -2.4 | -1.4 | 1.7 | 6.6 |
| Economic and fiscal developments by component2: | |||||||
| Budgetary revenues | 3.0 | -2.9 | -5.2 | -5.3 | -5.4 | -5.8 | |
| Program expenses | |||||||
| Major transfers to persons | -0.8 | -1.5 | -1.3 | -1.1 | -1.0 | -0.9 | |
| Major transfers to other levels of government | 0.1 | 0.2 | 0.0 | 0.3 | 0.4 | 0.5 | |
| Direct program expenses | 1.5 | -1.0 | -0.6 | -0.8 | -0.8 | -0.4 | |
| Total | 0.8 | -2.3 | -2.0 | -1.6 | -1.4 | -0.8 | |
| Public debt charges | 0.1 | -0.2 | 0.5 | 0.9 | 0.9 | 0.5 | |
| Total economic and fiscal developments | 3.9 | -5.4 | -6.6 | -6.1 | -6.0 | -6.1 | |
| Note: Totals may not add due to rounding. 1 Budgetary balance before set-aside for contingencies. 2 A negative number implies a deterioration in the budgetary balance (lower revenues or higher spending). A positive number implies an improvement in the budgetary balance (higher revenues or lower spending). |
|||||||
Impact of Economic and Fiscal Developments
Compared to Budget 2015, projected budgetary revenues are lower across the forecast horizon, reflecting the lower forecast for nominal GDP, as well as lower projected interest rates (which negatively impact the expected rate of return on interest-bearing assets, recorded as part of other revenues). The overall projected decline in revenues is somewhat lower than the weaker economic outlook would imply, due to the offsetting impact of better-than-expected tax revenue results for 2014–15 and 2015–16 (on a year-to-date basis), which carry forward across the forecast horizon.
Compared to Budget 2015, projected expenses are higher over the forecast horizon, with a projected increase in direct program expenses being only partially offset beyond 2015–16 by lower projected public debt charges.
Major transfers to persons are projected to be higher than in Budget 2015, largely due to higher projected Employment Insurance benefits, reflecting the weaker economic outlook.
Major transfers to other levels of government are broadly unchanged from Budget 2015 projections in the near term. However, they are expected to be lower in the outer years due to the lower forecast for nominal GDP.
Direct program expenses are expected to be higher than projected in Budget 2015, largely as a result of higher projected public service pension and benefit expenses. Long-term interest rates are used in the valuations of the Government’s liabilities for employee pensions and other future benefits. While the total pension and benefit obligation of the Government has not changed, lower projected interest rates result in relatively more of these costs being recognized in the near term rather than the future.
Relative to the Budget 2015 forecast, public debt charges are expected to be lower in 2016–17 and future years due to lower projected interest rates. In 2015–16, the effect of lower interest rates is more than offset by higher-than-expected charges resulting from an August 2015 bond buyback operation, as well as higher Consumer Price Index adjustments on Real Return Bonds resulting from an increase in the inflation forecast for 2015–16.
Summary Statement of Transactions
Table 3.2 summarizes the Government’s financial position over the forecast horizon. These projections are based on the forecast for the economy described in Chapter 2, and do not include any new policy action. Given the continued weakness in global growth, the Government will be introducing a growth agenda in Budget 2016, including significant new fiscal investment to help achieve strong, sustainable and balanced growth, while maintaining the debt-to-GDP ratio on a sustainable path.
| Projection | |||||||
|---|---|---|---|---|---|---|---|
| 2014– 2015 |
2015– 2016 |
2016– 2017 |
2017– 2018 |
2018– 2019 |
2019– 2020 |
2020– 2021 |
|
| Budgetary revenues | 282.3 | 288.4 | 298.2 | 309.0 | 322.6 | 336.8 | 351.8 |
| Program expenses | 253.8 | 265.5 | 276.3 | 284.3 | 294.4 | 303.4 | 311.8 |
| Public debt charges | 26.6 | 25.9 | 25.9 | 27.2 | 29.6 | 31.7 | 33.3 |
| Total expenses | 280.4 | 291.4 | 302.2 | 311.4 | 324.0 | 335.0 | 345.2 |
| Budgetary balance | 1.9 | -3.0 | -3.9 | -2.4 | -1.4 | 1.7 | 6.6 |
| Federal debt1 | 612.3 | 616.5 | 620.4 | 622.8 | 624.2 | 622.5 | 615.9 |
| Per cent of GDP | |||||||
| Budgetary revenues | 14.3 | 14.5 | 14.5 | 14.4 | 14.4 | 14.4 | 14.4 |
| Program expenses | 12.9 | 13.4 | 13.4 | 13.2 | 13.1 | 13.0 | 12.8 |
| Public debt charges | 1.3 | 1.3 | 1.3 | 1.3 | 1.3 | 1.4 | 1.4 |
| Budgetary balance | 0.1 | -0.2 | -0.2 | -0.1 | -0.1 | 0.1 | 0.3 |
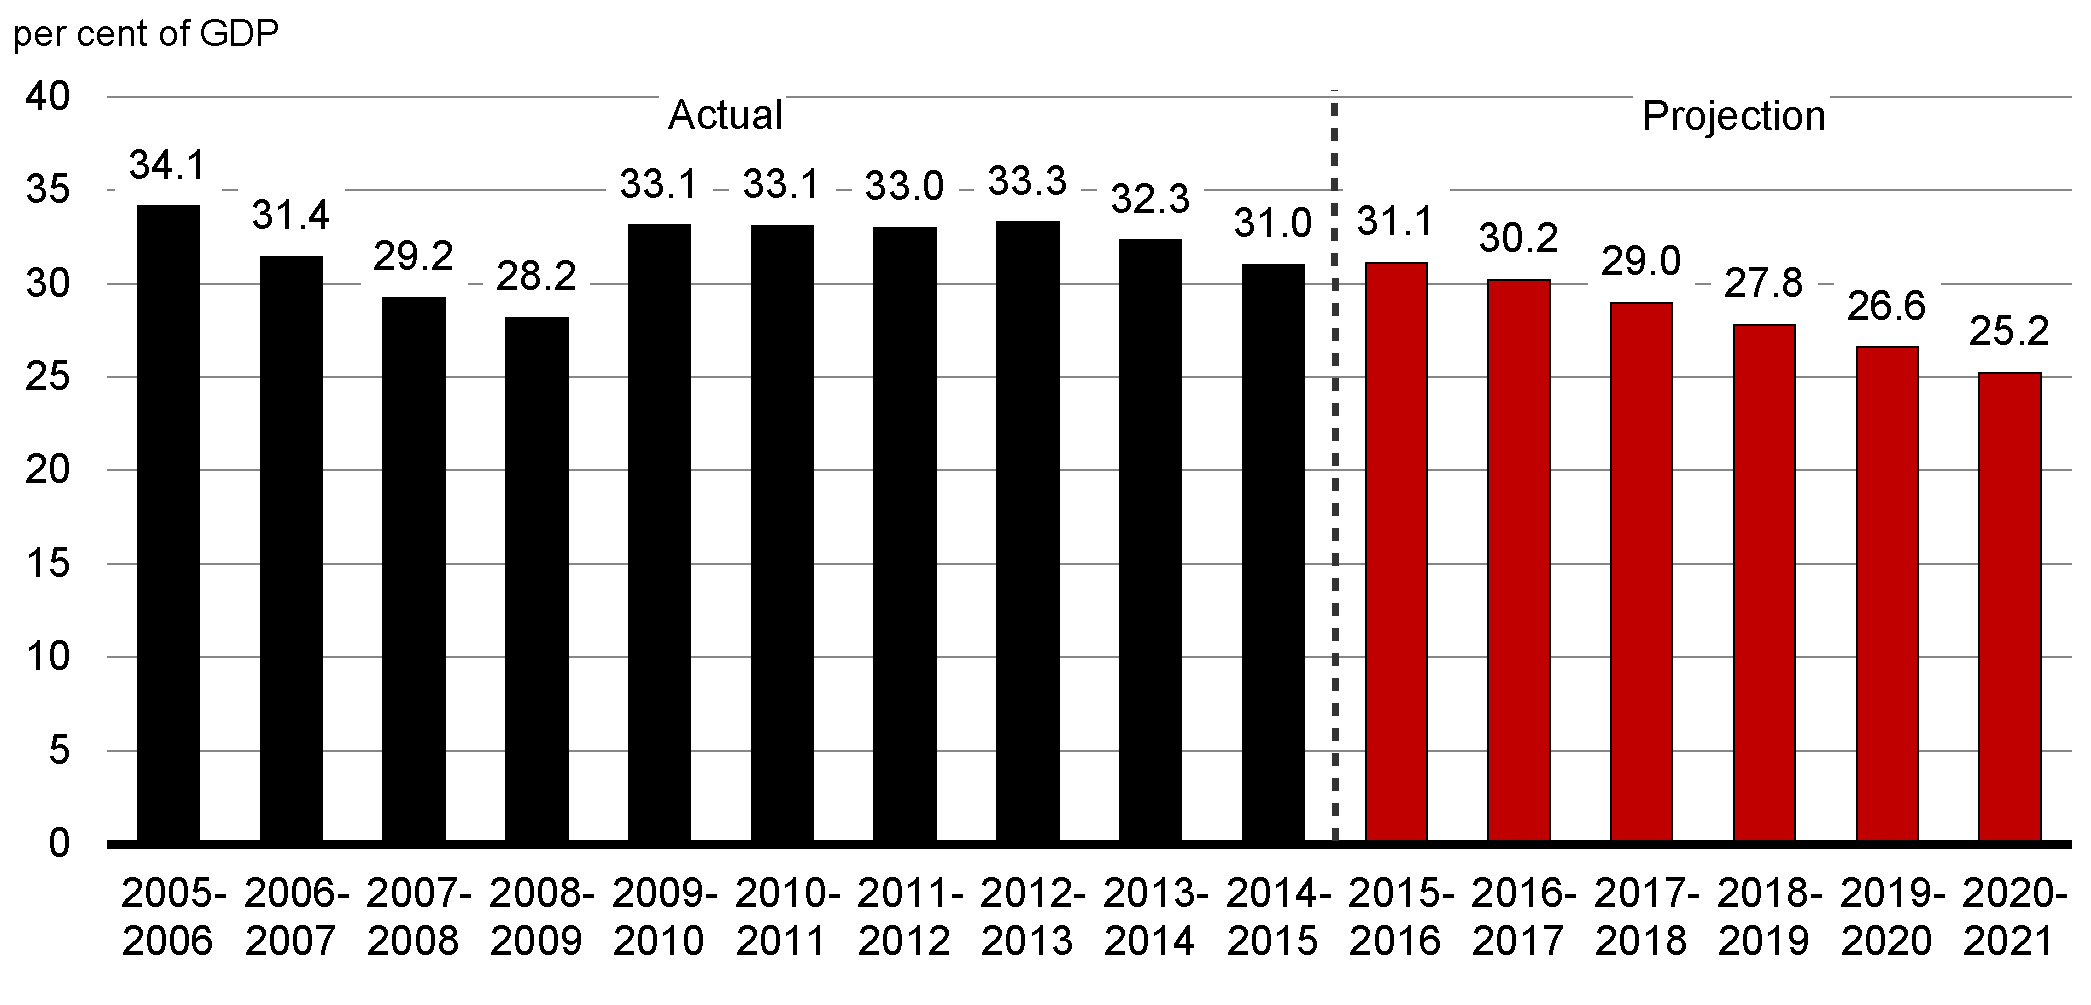
| Federal debt | 31.0 | 31.1 | 30.2 | 29.0 | 27.8 | 26.6 | 25.2 |
| Note: Totals may not add due to rounding. 1 The projected level of federal debt for 2015–16 includes an estimate of other comprehensive income. |
|||||||
After accounting for economic and fiscal developments since Budget 2015, the budgetary balance is expected to show deficits of $3.0 billion in 2015–16 and $3.9 billion in 2016–17, improving to surpluses of $1.7 billion in 2019–20 and $6.6 billion in 2020–21.
The debt-to-GDP ratio is projected to fall over the forecast horizon, down to 25.2 per cent by 2020–21. Reducing the federal debt-to-GDP ratio will help to ensure that the Government of Canada’s fiscal position remains sustainable and enviable amongst other G-7 and G-20 partners. Further details on the Government’s medium- and long-term fiscal objectives will be outlined in the 2016 budget.
Outlook for Budgetary Revenues
| Projection | |||||||
|---|---|---|---|---|---|---|---|
| 2014– 2015 |
2015– 2016 |
2016– 2017 |
2017– 2018 |
2018– 2019 |
2019– 2020 |
2020– 2021 |
|
| Income taxes | |||||||
| Personal income tax | 135.7 | 141.8 | 150.4 | 158.3 | 165.2 | 172.8 | 180.8 |
| Corporate income tax | 39.4 | 36.8 | 39.0 | 40.2 | 41.0 | 42.5 | 44.6 |
| Non-resident income tax | 6.2 | 6.6 | 6.5 | 6.7 | 6.9 | 7.2 | 7.6 |
| Total income tax | 181.4 | 185.1 | 195.9 | 205.2 | 213.2 | 222.5 | 232.9 |
| Excise taxes/duties | |||||||
| Goods and Services Tax | 31.3 | 33.2 | 34.7 | 36.3 | 37.8 | 39.4 | 41.1 |
| Customs import duties | 4.6 | 5.1 | 5.0 | 4.4 | 4.6 | 4.7 | 4.9 |
| Other excise taxes/duties | 11.3 | 11.4 | 11.2 | 11.2 | 11.3 | 11.3 | 11.3 |
| Total excise taxes/duties | 47.2 | 49.7 | 50.9 | 51.9 | 53.6 | 55.4 | 57.4 |
| Total tax revenues | 228.6 | 234.8 | 246.8 | 257.1 | 266.8 | 277.9 | 290.3 |
| Employment Insurance premium revenues | 22.6 | 23.2 | 22.3 | 20.2 | 21.0 | 21.9 | 22.7 |
| Other revenues | 31.2 | 30.3 | 29.1 | 31.7 | 34.8 | 37.0 | 38.8 |
| Total budgetary revenues | 282.3 | 288.4 | 298.2 | 309.0 | 322.6 | 336.8 | 351.8 |
| Per cent of GDP | |||||||
| Personal income tax | 6.9 | 7.2 | 7.3 | 7.4 | 7.4 | 7.4 | 7.4 |
| Corporate income tax | 2.0 | 1.9 | 1.9 | 1.9 | 1.8 | 1.8 | 1.8 |
| Goods and Services Tax | 1.6 | 1.7 | 1.7 | 1.7 | 1.7 | 1.7 | 1.7 |
| Total tax revenues | 11.6 | 11.8 | 12.0 | 12.0 | 11.9 | 11.9 | 11.9 |
| Employment Insurance premium revenues | 1.1 | 1.2 | 1.1 | 0.9 | 0.9 | 0.9 | 0.9 |
| Other revenues | 1.6 | 1.5 | 1.4 | 1.5 | 1.5 | 1.6 | 1.6 |
| Total budgetary revenues | 14.3 | 14.5 | 14.5 | 14.4 | 14.4 | 14.4 | 14.4 |
| Note: Totals may not add due to rounding. | |||||||
Table 3.3 sets out the Government’s projection for budgetary revenues. Overall, budgetary revenues are expected to increase by 2.1 per cent in 2015–16, reflecting the impact of low oil prices. Over the remainder of the forecast horizon, revenues are projected to grow at an average annual rate of 4.1 per cent, roughly in line with growth in nominal GDP for planning purposes.
Personal income tax revenues—the largest component of budgetary revenues—are projected to increase by $6.0 billion, or 4.5 per cent, to $141.8 billion in 2015–16. Over the remainder of the projection period, personal income tax revenues are forecast to increase somewhat faster than growth in nominal GDP, averaging 5.0 per cent annual growth, reflecting personal income growth combined with the progressive nature of the personal income tax system.
Corporate income tax revenues are projected to decline by $2.7 billion, or 6.8 per cent, to $36.8 billion in 2015–16. This reflects the expectation that despite strong revenue growth through September, low oil prices will have a significant negative impact on corporate income tax liabilities, primarily through an increase in corporate losses in the oil and gas sector. The projected increase in corporate losses has a negative impact on tax revenues in 2015–16, as corporations can carry back losses to request refunds of taxes paid over the past three years. Any remaining losses can also be carried forward against future tax liabilities, which is expected to have a negative impact on revenues in the following years. As a result, in 2016–17 and future years, corporate income tax revenues are projected to grow at an average annual rate of 3.9 per cent, reflecting the projected recovery in oil prices and growth in corporate profits, partly offset by the projected amount of losses carried forward.
Non-resident income tax revenues are income taxes paid by non-residents on Canadian-sourced income, notably dividends and interest payments. For 2015–16, non-resident income tax revenues are projected to increase by $0.4 billion, or 6.0 per cent. Over the remainder of the forecast horizon, non-resident income tax revenues are projected to increase at an average annual rate of 2.8 per cent, driven by growth of dividends, interest payments and profits.
Goods and Services Tax (GST) revenues are forecast to grow by 5.9 per cent in 2015–16 based on projected growth in taxable consumption and year-to-date results. Over the remainder of the projection period, GST revenues are forecast to grow by 4.4 per cent per year on average, based on projected growth in taxable consumption and in the GST/Harmonized Sales Tax Credit.
Customs import duties are projected to increase by 11.3 per cent in 2015–16, reflecting strong growth through September and increases in effective tariff rates for certain countries, following the modernization of the General Preferential Tariff regime. Customs import duties are projected to decrease slightly in 2016–17 and more significantly in 2017–18, mainly as a result of the expected impacts of the continued implementation of the Canada-Korea Free Trade Agreement, as well as the planned introduction of the Canada-European Union Comprehensive Economic and Trade Agreement and the potential introduction of the Trans-Pacific Partnership on January 1, 2017. Customs import duties are expected to return to an upward trend in
2018–19 onwards.
Other excise taxes and duties are projected to increase by 1.4 per cent in 2015–16, consistent with results through September.
Employment Insurance (EI) premium revenues are projected to grow by 2.9 per cent in 2015–16, reflecting growth in insurable earnings and the impact of the Small Business Job Credit. EI premium revenues are then projected to decline significantly in 2016–17 and 2017–18 due to the introduction of the seven-year break-even rate mechanism in 2017. Based on current policy, the break-even EI premium rate would be $1.52 in 2017, thereby ensuring that premium revenues are set equal to the projected status quo EI program costs over the seven-year period starting that year.
| 2014– 2015 |
2015– 2016 |
2016– 2017 |
2017– 2018 |
2018– 2019 |
2019– 2020 |
2020– 2021 |
|
|---|---|---|---|---|---|---|---|
| EI premium revenues | 22.6 | 23.2 | 22.3 | 20.2 | 21.0 | 21.9 | 22.7 |
| EI benefits1 | 18.1 | 19.3 | 19.7 | 20.0 | 20.5 | 21.1 | 21.7 |
| 2014 | 2015 | 2016 | 2017 | 2018 | 2019 | 2020 | |
| EI Operating Account annual balance | 3.5 | 2.5 | 2.9 | -1.3 | -0.9 | -0.6 | -0.3 |
| EI Operating Account cumulative balance | -1.7 | 0.8 | 3.6 | 2.3 | 1.4 | 0.8 | 0.5 |
| Projected premium rate (per $100 of insurable earnings) | |||||||
| Fiscal planning assumption | 1.88 | 1.88 | 1.88 | 1.52 | 1.52 | 1.52 | 1.52 |
| 1 EI benefits include regular EI benefits, sickness, maternity, parental, compassionate care, fishing and work sharing benefits, and employment benefits and support measures. These represent about 90 per cent of total EI program expenses. The remaining EI costs relate mainly to administration and are included in direct program expenses. | |||||||
Other revenues include revenues from consolidated Crown corporations, net income from enterprise Crown corporations, returns on investments, foreign exchange revenues and proceeds from the sales of goods and services. These revenues can be volatile, owing to the impact of returns on investments, and the net gains or losses from enterprise Crown corporations. These revenues are also affected by the impact of exchange rate movements on the Canadian-dollar value of foreign-denominated assets as well as flow-through items that give rise to an offsetting expense and therefore do not impact the budgetary balance.
For 2015–16, other revenues are projected to decline by 2.8 per cent, primarily due to lower enterprise Crown corporation revenues and lower interest rates. Growth in other revenues is expected to average 5.0 per cent over the remainder of the forecast horizon, primarily based on the projected profiles of interest rates and nominal GDP.
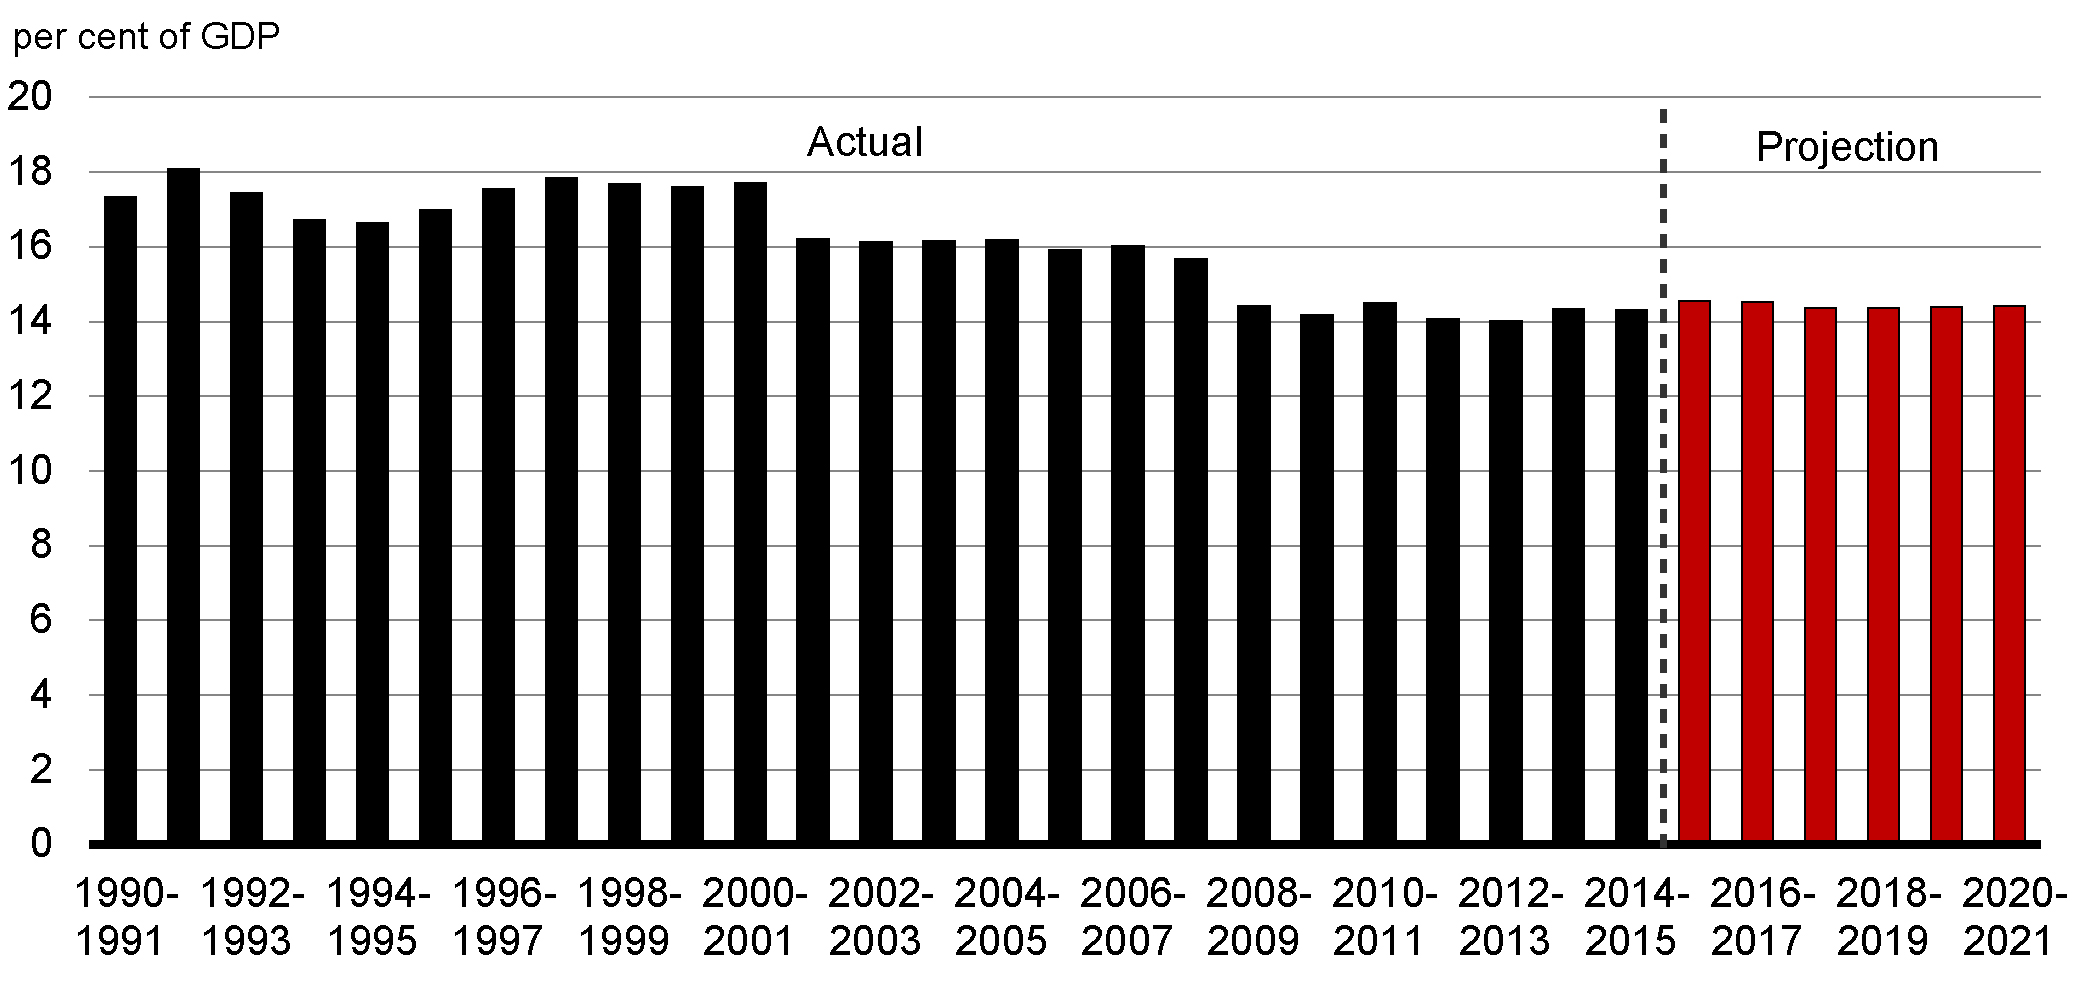
The revenue-to-GDP ratio is influenced primarily by changes in statutory tax rates and by economic developments. The ratio stood at 14.3 per cent in 2014-15 and is projected to remain relatively stable over the forecast horizon. Overall, the revenue ratio has been on a downward trend since 2001–02, reflecting the impact of tax reduction measures.
Outlook for Program Expenses
| Projection | |||||||
|---|---|---|---|---|---|---|---|
| 2014– 2015 |
2015– 2016 |
2016– 2017 |
2017– 2018 |
2018– 2019 |
2019– 2020 |
2020– 2021 |
|
| Major transfers to persons | |||||||
| Elderly benefits | 44.1 | 46.0 | 48.4 | 51.1 | 53.9 | 56.9 | 60.2 |
| Employment Insurance benefits1 | 18.1 | 19.3 | 19.7 | 20.0 | 20.5 | 21.1 | 21.7 |
| Children’s benefits | 14.3 | 18.2 | 18.4 | 18.6 | 18.8 | 19.1 | 19.3 |
| Total | 76.5 | 83.5 | 86.5 | 89.7 | 93.3 | 97.0 | 101.2 |
| Major transfers to other levels of government | |||||||
| Canada Health Transfer | 32.1 | 34.0 | 36.1 | 37.2 | 38.9 | 40.6 | 42.3 |
| Canada Social Transfer | 12.6 | 13.0 | 13.3 | 13.7 | 14.2 | 14.6 | 15.0 |
| Equalization | 16.7 | 17.3 | 17.9 | 18.5 | 19.3 | 20.1 | 21.0 |
| Territorial Formula Financing | 3.5 | 3.6 | 3.6 | 3.8 | 3.9 | 4.0 | 4.0 |
| Gas Tax Fund2 | 2.0 | 2.0 | 2.1 | 2.1 | 2.2 | 2.2 | 2.2 |
| Other fiscal arrangements3 | -3.7 | -4.6 | -4.7 | -5.1 | -5.3 | -5.6 | -5.9 |
| Total | 63.1 | 65.3 | 68.3 | 70.2 | 73.1 | 75.8 | 78.6 |
| Direct program expenses | |||||||
| Operating expenses | 74.4 | 77.3 | 79.0 | 80.9 | 83.2 | 84.8 | 85.9 |
| Transfer payments | 35.1 | 34.0 | 36.9 | 37.7 | 38.7 | 39.3 | 39.3 |
| Capital amortization | 4.8 | 5.5 | 5.6 | 5.8 | 6.2 | 6.5 | 6.8 |
| Total | 114.3 | 116.7 | 121.5 | 124.3 | 128.1 | 130.6 | 132.1 |
| Total program expenses | 253.8 | 265.5 | 276.3 | 284.3 | 294.4 | 303.4 | 311.8 |
| Per cent of GDP | |||||||
| Major transfers to persons | 3.9 | 4.2 | 4.2 | 4.2 | 4.2 | 4.1 | 4.1 |
| Major transfers to other levels of government | 3.2 | 3.3 | 3.3 | 3.3 | 3.3 | 3.2 | 3.2 |
| Direct program expenses | 5.8 | 5.9 | 5.9 | 5.8 | 5.7 | 5.6 | 5.4 |
| Total program expenses | 12.9 | 13.4 | 13.4 | 13.2 | 13.1 | 13.0 | 12.8 |
Note: Totals may not add due to rounding. |
|||||||
Table 3.4 provides an overview of the projections for program expenses by major component. Program expenses consist of major transfers to persons, major transfers to other levels of government and direct program expenses.
Major transfers to persons increase steadily over the forecast horizon, with spending expected to increase from $83.5 billion in 2015–16 to $101.2 billion in 2020–21. Major transfers to persons consist of elderly, EI and children’s benefits.
Elderly benefits are comprised of Old Age Security, Guaranteed Income Supplement and Allowance payments to qualifying seniors. Old Age Security payments represent approximately 75 per cent of these expenditures. Elderly benefits are projected to grow from $46.0 billion in 2015–16 to $60.2 billion in 2020–21, or approximately 5.5 per cent per year—faster than nominal GDP, which is projected to grow on average by 4.2 per cent per year. The projected increase in elderly benefits is due to projected consumer price inflation, to which benefits are fully indexed, and a projected increase in the seniors’ population.
EI benefits are projected to increase by 6.8 per cent to $19.3 billion in 2015–16. This growth is in line with year-to-date results and reflects the weakening of the labour market, particularly in oil-producing provinces. Over the remainder of the projection period, EI benefits are projected to grow moderately, averaging 2.4 per cent annually, as the impact of increasing average weekly benefits is expected to be partially offset by a slight decline in the number of regular beneficiaries, reflecting the expected improvement in the labour market.
Under status quo assumptions, children’s benefits, which currently consist of the Canada Child Tax Benefit and the Universal Child Care Benefit, are projected to steadily increase over the forecast horizon, largely reflecting expected growth in the eligible population.
Major transfers to other levels of government are expected to increase over the forecast horizon, from $65.3 billion in 2015–16 to $78.6 billion in 2020–21.
Major transfers to other levels of government include transfers in support of health and social programs, Equalization and Territorial Formula Financing, and the Gas Tax Fund, among others.
The Canada Health Transfer (CHT) is projected to grow from $34.0 billion in 2015–16 to $42.3 billion in 2020–21. Starting in 2017–18, the CHT is legislated to grow in line with a three-year moving average of nominal GDP growth, with funding guaranteed to increase by at least 3 per cent per year.
The Canada Social Transfer is legislated to continue to grow at 3 per cent per year, increasing from $13.0 billion in 2015–16 to $15.0 billion in 2020–21.
The Gas Tax Fund is projected to grow from $2.0 billion in 2015–16 to $2.2 billion in 2020–21 as these payments are indexed at 2 per cent per year, with increases applied in $100 million increments.
Direct program expenses include operating expenses, transfer payments administered by departments and capital amortization.
Operating expenses reflect the cost of doing business for more than 100 government departments and agencies. Under status quo assumptions, operating expenses are projected to grow modestly over the forecast horizon, increasing from $77.3 billion in 2015–16 to $85.9 billion in 2020–21. However, as a share of GDP, operating expenses decline over the projection period from 3.9 per cent in 2015–16 to 3.5 per cent in 2020–21.
Transfer payments administered by departments are broadly stable over the forecast horizon, increasing from $34.0 billion in 2015–16 to $39.3 billion in 2020–21.
The amount of capital amortization is expected to increase modestly from $5.5 billion in 2015–16 to $6.8 billion in 2020–21 as a result of new investments and upgrades to existing capital.
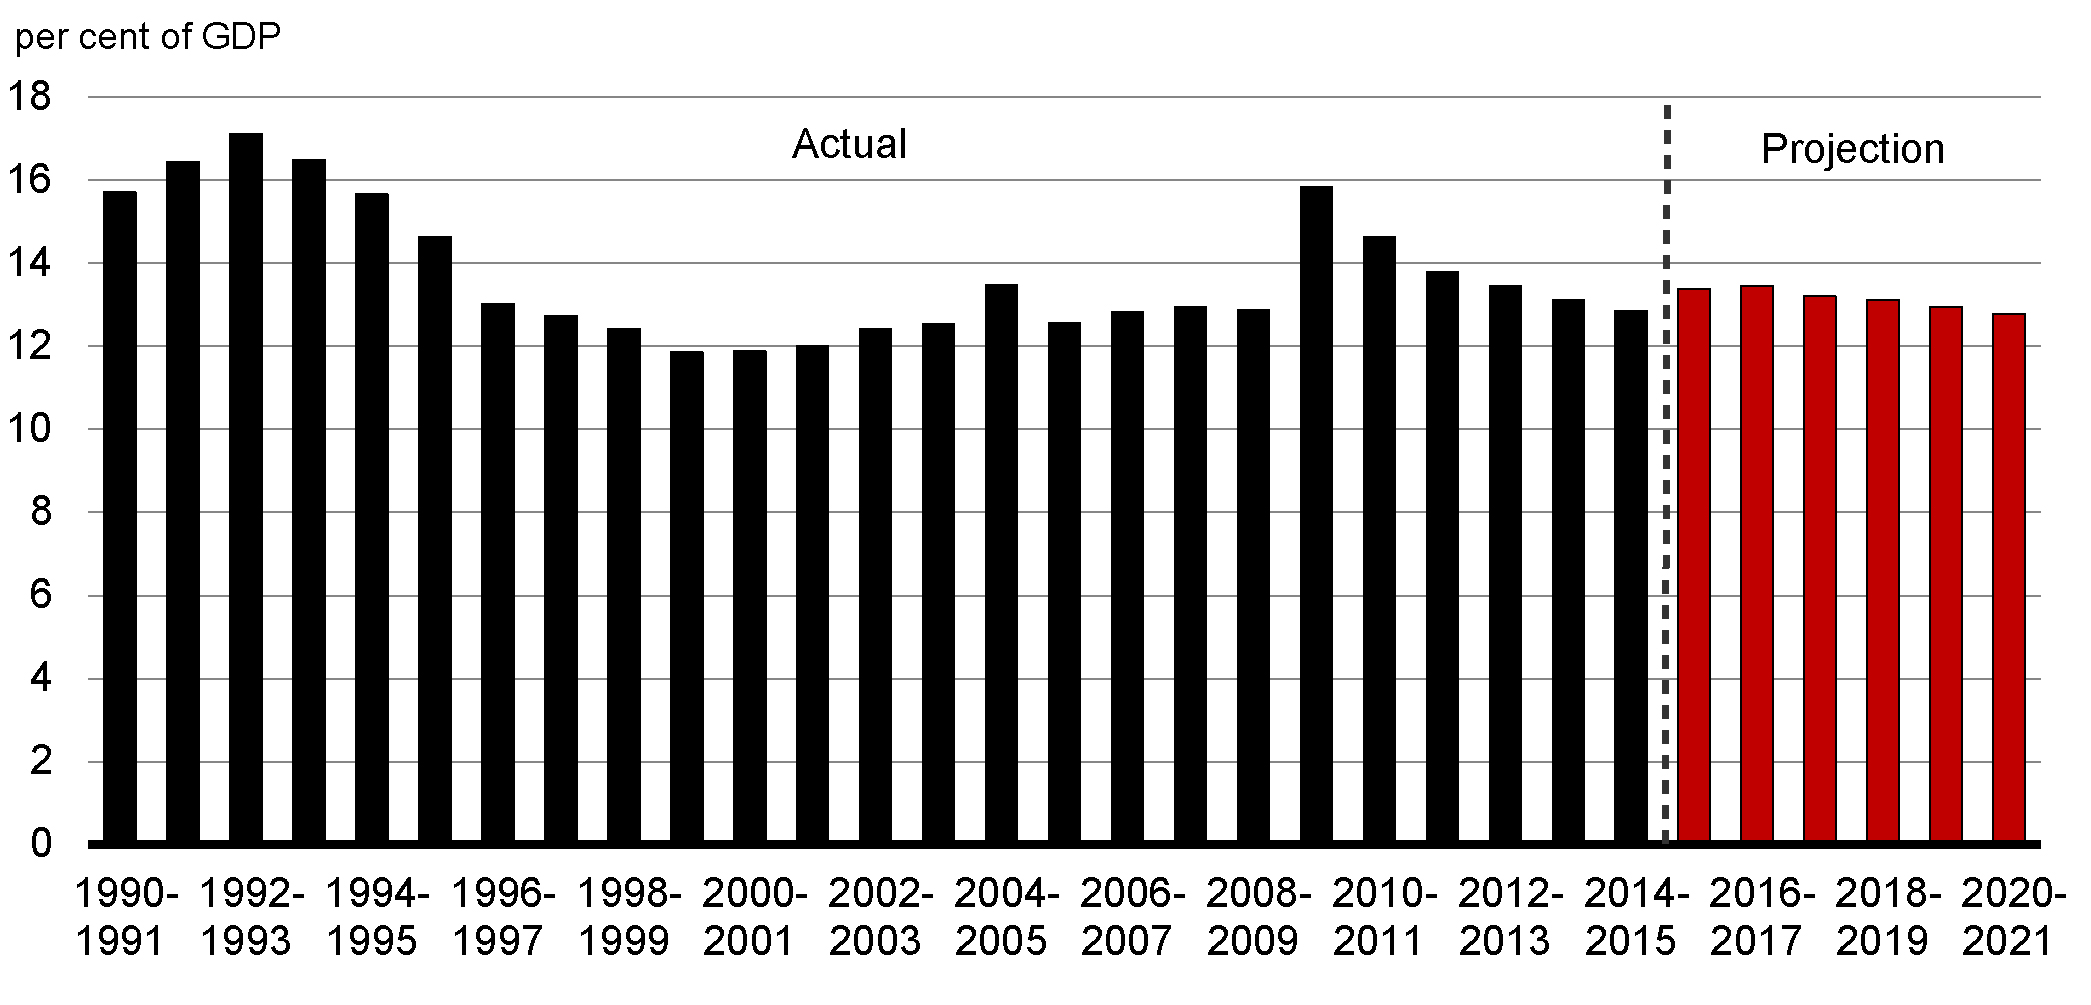
As a share of GDP, program expenses are projected to decline from 13.4 per cent in 2015–16 to 12.8 per cent in 2020–21 (Chart 3.4).
Risks to the Fiscal Projections
Risks associated with the economic outlook are the greatest source of uncertainty for fiscal projections. To help quantify these risks in respect of their impact on the fiscal outlook, tables illustrating the sensitivity of the budgetary balance to a number of economic shocks are provided below.
Besides the economic outlook, there are other, unique sources of upside or downside risks to the fiscal projections, such as the volatility in the relationships between fiscal variables and the underlying activities to which they relate. For example, relationships between personal income taxes and personal income or the extent to which departments and agencies do not fully use all of the resources appropriated by Parliament can fluctuate for reasons not directly linked to economic variables. These fluctuations introduce an additional level of uncertainty for fiscal projections.
Sensitivity of the Budgetary Balance to Economic Shocks
Changes in economic assumptions affect the projections for revenues and expenses. The following tables illustrate the sensitivity of the budgetary balance to a number of economic shocks:
- A one-year, 1-percentage-point decrease in real GDP growth driven equally by lower productivity and employment growth.
- A decrease in nominal GDP growth resulting solely from a one-year, 1-percentage-point decrease in the rate of GDP inflation (assuming that the Consumer Price Index moves in line with GDP inflation).
- A sustained 100-basis-point increase in all interest rates.
These sensitivities are generalized rules of thumb that assume any decrease in economic activity is proportional across income and expenditure components, and are meant to provide a broad illustration of the impact of economic shocks on the outlook for the budgetary balance. Actual economic shocks may have different fiscal impacts. For example, they may be concentrated in specific sectors of the economy or cause different responses in key economic variables (e.g. GDP inflation and Consumer Price Index inflation may have different responses to a given shock).
| Year 1 | Year 2 | Year 5 | |
|---|---|---|---|
| Federal revenues | |||
| Tax revenues | |||
| Personal income tax | -3.0 | -3.0 | -3.4 |
| Corporate income tax | -0.4 | -0.4 | -0.4 |
| Goods and Services Tax | -0.4 | -0.4 | -0.4 |
| Other | 0.1 | -0.2 | -0.2 |
| Total tax revenues | -3.6 | -3.9 | -4.4 |
| Employment Insurance premiums | -0.2 | -0.2 | -0.3 |
| Other revenues | -0.1 | -0.1 | -0.1 |
| Total budgetary revenues | -3.9 | -4.2 | -4.8 |
| Federal expenses | |||
| Major transfers to persons | |||
| Elderly benefits | 0.0 | 0.0 | 0.0 |
| Employment Insurance benefits | 1.0 | 0.9 | 0.3 |
| Children’s benefits | 0.1 | 0.1 | 0.1 |
| Total | 1.0 | 0.9 | 0.3 |
| Other program expenses | -0.1 | -0.1 | -0.4 |
| Public debt charges | 0.0 | 0.1 | 0.6 |
| Total expenses | 0.9 | 1.0 | 0.5 |
| Budgetary balance | -4.8 | -5.2 | -5.3 |
| Note: Totals may not add due to rounding. | |||
A 1-percentage-point decrease in real GDP growth proportional across income and expenditure components reduces the budgetary balance by $4.8 billion in the first year, $5.2 billion in the second year and $5.3 billion in the fifth year (Table 3.5).
- Tax revenues from all sources fall by a total of $3.6 billion in the first year and by $3.9 billion in the second year. Personal income tax revenues decrease as employment and the underlying tax base fall. Corporate income tax revenues fall as output and profits decrease. GST revenues decrease as a result of lower consumer spending associated with the fall in employment and personal income.
- EI premium revenues decrease as employment and wages and salaries fall. In order to isolate the direct impact of the economic shock and provide a general overview of the fiscal impacts, the EI premium revenue impacts do not include changes in the premium rate.
- Expenses rise, mainly reflecting higher EI benefits (due to an increase in the number of unemployed) and higher public debt charges (reflecting a higher stock of debt due to the lower budgetary balance). This rise is partially offset by lower other program expenses (as certain programs are tied directly to growth in nominal GDP).
| Year 1 | Year 2 | Year 5 | |
|---|---|---|---|
| Federal revenues | |||
| Tax revenues | |||
| Personal income tax | -2.5 | -1.7 | -1.6 |
| Corporate income tax | -0.4 | -0.4 | -0.4 |
| Goods and Services Tax | -0.4 | -0.4 | -0.4 |
| Other | -0.2 | -0.2 | -0.2 |
| Total tax revenues | -3.3 | -2.6 | -2.6 |
| Employment Insurance premiums | -0.1 | -0.2 | -0.3 |
| Other revenues | -0.1 | -0.1 | -0.2 |
| Total budgetary revenues | -3.6 | -2.9 | -3.0 |
| Federal expenses | |||
| Major transfers to persons | |||
| Elderly benefits | -0.4 | -0.5 | -0.6 |
| Employment Insurance benefits | -0.1 | -0.1 | -0.1 |
| Children’s benefits | -0.1 | -0.1 | -0.1 |
| Total | -0.6 | -0.8 | -0.9 |
| Other program expenses | -0.4 | -0.4 | -1.1 |
| Public debt charges | -0.5 | 0.1 | 0.2 |
| Total expenses | -1.5 | -1.1 | -1.7 |
| Budgetary balance | -2.1 | -1.7 | -1.3 |
| Note: Totals may not add due to rounding. | |||
A 1-percentage-point decrease in nominal GDP growth proportional across income and expenditure components resulting solely from lower GDP inflation (assuming that the Consumer Price Index moves in line with GDP inflation) lowers the budgetary balance by $2.1 billion in the first year, $1.7 billion in the second year and $1.3 billion in the fifth year (Table 3.6).
- Lower prices result in lower nominal income and, as a result, personal income tax revenues decrease, reflecting declines in the underlying nominal tax base. As the parameters of the personal income tax system are indexed to inflation and automatically adjust in response to the shock, the fiscal impact is smaller than under the real shock. For the other sources of tax revenue, the negative impacts are similar under the real and nominal GDP shocks.
- EI premium revenues decrease in response to lower earnings. In order to isolate the direct impact of the economic shock and provide a general overview of the fiscal impacts, the EI premium revenue impacts do not include changes in the premium rate.
- Other revenues decline slightly as lower prices lead to lower revenues from the sales of goods and services.
- Partly offsetting lower revenues are the declines in the cost of statutory programs that are indexed to inflation, such as elderly benefit payments and the Canada Child Tax Benefit, and downward pressure on federal program expenses. Payments under these programs are smaller if inflation is lower. In addition, other program expenses are also lower as certain programs are tied directly to growth in nominal GDP.
- Public debt charges decline in the first year due to lower costs associated with Real Return Bonds, then rise due to the higher stock of debt.
| Year 1 | Year 2 | Year 5 | |
|---|---|---|---|
| Federal revenues | 1.4 | 1.8 | 2.6 |
| Federal expenses | 2.2 | 3.3 | 4.8 |
| Budgetary balance | -0.8 | -1.5 | -2.2 |
| Note: Totals may not add due to rounding. | |||
An increase in interest rates decreases the budgetary balance by $0.8 billion in the first year, $1.5 billion in the second year and $2.2 billion in the fifth year (Table 3.7). The decline stems entirely from increased expenses associated with public debt charges. The impact on debt charges rises through time as longer-term debt matures and is refinanced at higher rates. Moderating the overall impact is an increase in revenues associated with the increase in the rate of return on the Government’s interest-bearing assets, which are recorded as part of other revenues. The impacts of changes in interest rates on public sector pension and benefit expenses are excluded from the sensitivity analysis.
- Date modified: