Update of Economic and Fiscal Projections — 2014: Part 4 of 4
Annex
Update of Long-Term Economic and Fiscal Projections
This annex presents long-term economic and fiscal projections to 2050–51, using the medium-term forecast presented in this Updateas the starting point. These projections follow the recommendation of the Auditor General of Canada to publish long-term fiscal sustainability analyses on an annual basis and update the Government’s long-term economic and fiscal projections published in the 2013 Update of Economic and Fiscal Projections.
Like any projection that extends over several decades, the demographic, economic and fiscal projections discussed in this annex are subject to considerable uncertainty. Rather than a forecast of the future, these projections are based on long-term developments that can be expected to occur based on current trends and policies and reasonable assumptions.
Long-Term Economic and Fiscal Projections
Since the publication of the Government’s last long-term fiscal sustainability analysis in November 2013, demographic, economic and fiscal trends have been relatively stable. Despite ongoing uncertainty and external weaknesses, the expansion in Canada’s real gross domestic product (GDP) has outpaced all its Group of Seven (G-7) peers over the recession and recovery and the return to balanced budgets is in sight. At the same time, Canada is still expected to age more rapidly than most other countries, meaning that Canadians and their governments will have to adjust to the economic and public finance implications of population aging sooner than many other advanced economies.
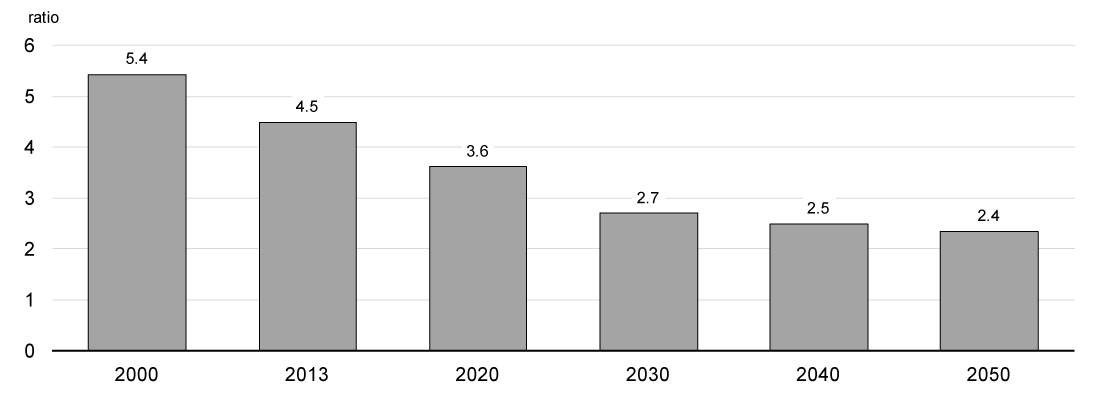
Over the past decade, Canada’s strong employment performance has been a key factor behind the country’s strong economic performance relative to other G-7 countries. Canada’s employment as a share of the working-age population is now one of the highest among Organisation for Economic Co-operation and Development (OECD) countries. Going forward, however, demographic changes will make it increasingly difficult to continue to improve Canada’s economic performance through increases in employment. Indeed, falling fertility rates since the end of the baby boom and continuously increasing longevity have resulted in the Canadian population gradually growing older.1 And with the baby boomers gradually moving into retirement, the pace of population aging will soon accelerate with important consequences for Canadians and their governments. Indeed, the number of working-age Canadians for every senior is expected to fall from close to 5 over the past decade to about 2.5 in less than 20 years (Chart A.1), one of the largest projected decreases among OECD countries.
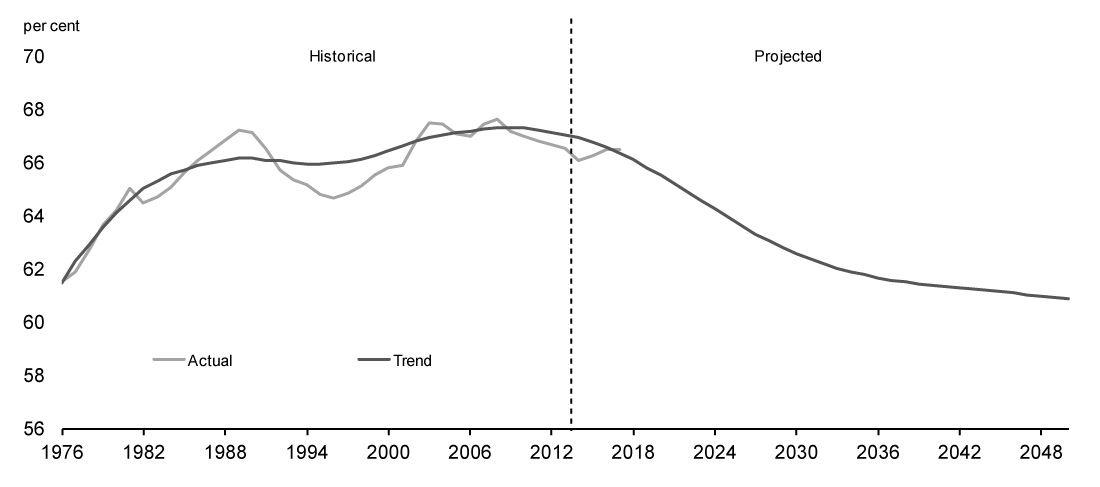
Population aging will result in an increase in the share of older workers in the labour force. Because older workers participate less in the labour market than younger workers, an aging population is expected to lead to a reduction in the overall rate of labour force participation (Chart A.2).2 In fact, the impact of the shift toward an older population is already being felt, as the overall participation rate has already likely reached its peak. Combined with slower growth in the population aged 15 and over and slightly declining average weekly hours worked per worker,3 reduced labour market participation is expected to reduce future growth in labour supply (i.e. the total number of hours worked by Canadians).
Economic growth stems from growth in either labour supply or labour productivity (real output per hour worked). Hence, unless labour market participation and productivity improve, population aging will negatively impact growth. With inflation expected to remain around 2 per cent per year, this impact on economic growth will be translated into lower growth in nominal GDP, the broadest single measure of the tax base. Slower nominal GDP growth will reduce the growth rate of government revenues, thereby limiting the capacity of governments to continue to finance growth in public expenditures at rates as high as in the past. At the same time, population aging is also expected to put upward pressure on public expenditures, notably for age-related programs such as elderly benefits and health care.
In the context of this upcoming rapid demographic transition, the Government has taken a number of actions since Budget 2010 to eliminate the deficit, which represents the first crucial and necessary step to guarantee long-term fiscal sustainability. Actions to return to balanced budgets in 2015 include controlling spending of federal departments, ensuring reasonable and affordable federal employee compensation, and closing tax loopholes. As shown in this Update, the success of these measures will be sufficient to ensure a return to balanced budgets starting in 2015–16, which will be achieved without raising taxes or cutting important transfers in support of health care and social services. To ensure public finances remain sustainable over the longer term as population aging pressures strengthen, actions to return to balanced budgets have been supplemented by measures to preserve social programs.
Updated long-term fiscal projections suggest that the Government’s actions will put the federal debt-to-GDP ratio on a downward trend (Chart A.3). These updated long-term fiscal projections are similar to those presented in the 2013 Update of Economic and Fiscal Projections, reflecting broadly unchanged economic, fiscal and demographic trends.
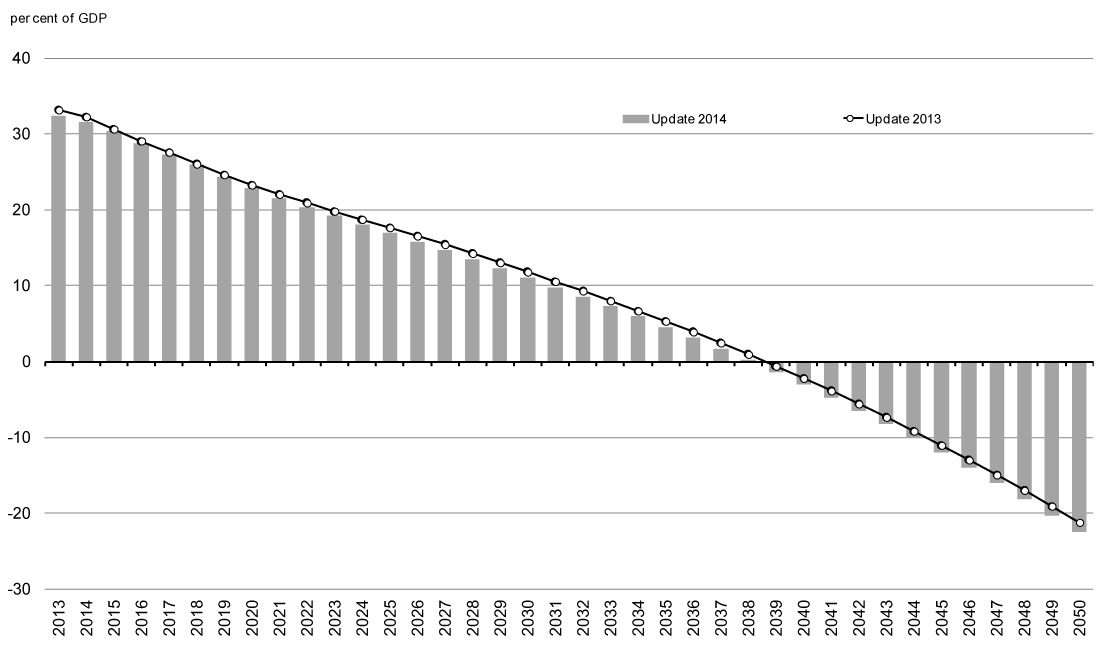
Source: Department of Finance calculations.
It is important to note that, while useful to help assess the long-term impact of public policies based on “status quo” assumptions, long-term fiscal projections are not predictions. In particular, the projections in this annex assume sustained growth in economic activity and, as such, do not take into account the possibility that Canada could be hit by other recessions that would have long-lasting effects. They also do not include any new spending or tax measures beyond those previously announced.
The Government’s commitment to sound and sustainable public finances is intimately related to its fundamental belief that the private sector is the engine of growth and wealth creation. The role of government is to provide the framework policies, programs and services for a prosperous economy and society at levels of taxation that are competitive and sustainable for the long term.
Since 2006, the Government has taken action to create jobs and economic growth by keeping taxes low for Canadians and Canadian businesses, equipping Canadians with the skills and training they need to succeed, supporting advanced research and innovation, reducing red tape and delivering the largest and longest federal investment in public infrastructure through the New Building Canada Plan.
Over the past year, building on actions taken since 2006, the Government has continued to create an environment for Canadians to succeed by strengthening policies to connect Canadians with available jobs and improve their skills. For example:
- Implemented the Canada Job Grant—To better align training with labour market needs, the Government has continued to work closely with provinces toward the implementation of the Canada Job Grant and the renewal of the Labour Market Agreements.
- Created the Canada Apprentice Loan—To support the training and employment of Canada’s next generation, the Government introduced in Economic Action Plan 2014 the Canada Apprentice Loan, which will be available in January 2015, providing apprentices registered in Red Seal trades with access to over $100 million in interest-free loans each year.
- Connecting Canadians With Available Jobs—To make sure Canadians are given the first chance at available jobs that match their skills in their local area, $11.8 million will be invested over two years, and $3.3 million per year on an ongoing basis, to launch an enhanced Job Matching Service.
The Government has also announced and implemented a number of targeted, affordable measures that support advanced research and innovation, reduce red tape, support long-term economic growth and help Canadian businesses become more competitive here and around the world. For example:
- Supporting Research and Innovation—To help Canadian post-secondary institutions excel globally in research areas that create long-term economic advantages for Canada, a new Canada First Research Excellence Fund with $1.5 billion in new funding over the next decade was created.
- Assisting the Manufacturing Sector and Entrepreneurs—To support significant new strategic research and development projects and long-term investments in the Canadian automotive sector, an additional $500 million over two years was provided to the Automotive Innovation Fund. To further help entrepreneurs create new companies and realize the potential of their ideas, the Canada Accelerator and Incubator Program was provided with an additional $40 million over four years, starting in 2015–16, increasing its total funding to $100 million. The funding will be used by recipient organizations to provide entrepreneurs with intensive mentoring and other resources to develop their business.
- Cutting Red Tape—To further reduce the tax compliance burden, the maximum number of required payments on account of source deductions was reduced for more than 50,000 small and medium-sized employers.
- New Building Canada Plan—To ensure safe and efficient transportation for commuters, public transit users and commercial vehicles, the Government announced funding of $70 billion, including the $53-billion New Building Canada Plan announced in Economic Action Plan 2013, for public infrastructure over the next decade. This is the largest and longest infrastructure program in Canada’s history. In addition, the Government also announced, in Economic Action Plan 2014, funding to advance the construction of a new bridge for the St. Lawrence and funding of $470 million over two years for a new Windsor-Detroit International Crossing, in recognition that an efficient and secure Windsor-Detroit trade corridor is essential to the competitiveness of the manufacturing sector and Canada’s economy more broadly.
- Supporting Small Businesses—To recognize the important contribution that small businesses across the country make to job creation and economic growth, the Government recently introduced the new Small Business Job Credit, which is expected to save small businesses more than $550 million by effectively reducing their Employment Insurance premiums over 2015 and 2016.
On the international stage, the Government continues to pursue an ambitious trade agenda to better position Canada as a strong competitor in the global economy. During the past year, negotiations were successfully concluded on the historic Canada-European Union Comprehensive Economic and Trade Agreement (CETA), Canada’s most ambitious trade initiative. The CETA will unlock opportunities across all manufacturing, agriculture and service sectors in a market of 500 million consumers across 28 countries. Canada also recently signed the Canada-Korea Free Trade Agreement. This landmark agreement constitutes Canada’s first trade agreement in Asia and will increase commercial opportunities in this fast-growing market of 50 million consumers. Altogether since 2006, Canada has reached free trade agreements with 38 countries and continues to negotiate with many more.
Together, actions taken by the Government since 2006 have helped the Canadian economy enjoy one of the best economic performances among G-7 countries over the recovery and can be expected to continue to improve Canada’s economic and labour market performance over the longer term. Ultimately, the resilience of the Canadian economy, and its ability to thrive in the 21st century global economy, must be underpinned by a strong fiscal position. In this context, recent Government actions to ensure the sustainability of Canada’s public finances, combined with affordable and targeted actions that foster growth and job creation now and in the future, improve the environment for investment by keeping taxes and interest rates low, reduce the burden placed on future generations of Canadians, and maintain the ability of the Government to respond to unexpected economic shocks.
Methodology and Key Assumptions
Demographic Projections
The demographic projections used in this annex are based on medium-growth scenario projections produced by Statistics Canada.4 Statistics Canada projects the structure of the population by age and sex from one year to the next by adding births and net migrants and subtracting deaths. The demographic assumptions behind these projections are outlined in Population Projections for Canada, Provinces and Territories—2009 to 2036, published in 2010. The main assumptions are:
- Life expectancy at birth for females is expected to increase from 82.9 years in 2006 to 87.3 years in 2036. For males, the life expectancy at birth is expected to rise from 78.2 years in 2006 to 84.0 years in 2036.
- The fertility rate for Canada used for the entire projection period is 1.70 children per woman.
- Except for the first three years, where data used are drawn from the immigration plan as formulated by Citizenship and Immigration Canada, the annual immigration rate is assumed to represent 0.75 per cent of the total population. When accounting for emigration and returning emigrants, the net immigration rate for Canada is assumed to range between 0.60 and 0.66 per cent over the projection period.
For the purposes of this annex, the population projections produced by Statistics Canada have been adjusted to reflect recent population estimates.
Economic Projections
Over the first six years of the projection (2014–2019), key economic indicators (e.g. real GDP growth and interest rates) are taken from the Department of Finance September 2014 survey of private sector economists, which forms the basis for the fiscal forecast presented in this Update.
These results are benchmarked to the Department of Finance long-term projection model. In this model, real GDP growth is assumed to depend on labour productivity growth and labour input growth. Labour input growth is determined by age- and gender-specific labour force participation and average hours worked using population projections from Statistics Canada by age and gender.
Labour productivity is expected to grow at about its historical average over the 2014–2050 period. The unemployment rate over the 2014–2019 period is taken from the private sector forecast, which projects a gradual decline to 6.3 per cent by 2019, near its level prior to the 2008–2009 recession.
Over the medium term (2014–2019), growth in labour supply is projected to continue to contribute significantly to overall GDP growth, albeit somewhat less than over the last four decades. This in part reflects the positive effect of the ongoing recovery in labour markets from the 2008–2009 recession, translating into a falling unemployment rate (which contributes positively to labour supply growth). However, both labour force participation and average hours worked are projected to decline slightly each year (-0.2 percentage points for both) over the medium term, dampening labour supply growth (Table A.1).
Beyond 2019, the positive impacts of the current labour market recovery on labour supply are expected to disappear, while the unemployment rate is assumed to stabilize and average hours worked are projected to continue their trend decline. At the same time, an increasing rate of retirement among the baby boom generation is expected to result in a decline in labour force participation and the rate of growth of the working-age population. Combined, these factors suggest that the contribution of labour supply to real GDP growth will decline significantly to an average of just 0.5 percentage points per year over the 2020–2050 period. Given assumed trend productivity growth of 1.2 per cent per year, growth in real GDP would average 1.7 per cent per year over the same period.
| 1970-2013 | 2014-2019 | 2020-2030 | 2031-2050 | |
|---|---|---|---|---|
| Real GDP growth | 2.8 | 2.3 | 1.6 | 1.8 |
| Contributions of (percentage points): | ||||
| Labour supply growth | 1.6 | 0.8 | 0.4 | 0.6 |
| Working-age population | 1.6 | 1.0 | 1.0 | 0.8 |
| Labour force participation | 0.3 | -0.2 | -0.5 | -0.1 |
| Unemployment rate | -0.1 | 0.1 | 0.0 | 0.0 |
| Average hours per worker | -0.2 | -0.2 | -0.1 | -0.1 |
| Labour productivity growth | 1.2 | 1.5 | 1.3 | 1.2 |
| Note: Contributions may not add due to rounding. Sources: Statistics Canada; Department of Finance calculations. |
||||
Fiscal Projections
Using the fiscal projections up to 2019–20 presented in this Updateas the starting point, the fiscal projections contained in this annex are obtained through an accounting model in which each revenue and expense category is determined independently and is modelled as a function of the underlying demographic and economic projections, with the relationships defined either by current and already announced future government policies or assumptions. The model provides a detailed examination of the fiscal implications of population aging on government revenues and expenditures and provides an assessment of long-run fiscal sustainability by simulating long-run debt and deficit paths.
The principal assumptions underlying the fiscal projections from 2019–20 through 2050–51 are:
- The Canada Social Transfer increases by 3 per cent annually, and the Canada Health Transfer and fiscal transfers (i.e. primarily Equalization and Territorial Formula Financing) payments grow in line with nominal GDP.
- Old Age Security program benefits grow with the targeted population (which is assumed to gradually change from 65 years old and over before 2023 to 67 years old and over in 2029) and inflation to reflect increases in the cost of living.
- Children’s benefits grow with the targeted population (less than 18 years old) and inflation to reflect increases in the cost of living.
- Direct program spending is linked to nominal GDP growth.
- Employment Insurance (EI) benefits grow in line with the projected number of beneficiaries and the projected growth in average weekly earnings.
- The EI premium rate grows according to current program parameters, i.e. EI revenues and expenditures (benefits and administration costs) break even over time.
- All tax revenues, including personal income tax, corporate income tax and Goods and Services Tax revenues, as well as other revenues, are assumed to grow in line with nominal GDP.
- With respect to federal debt charges, the initial stock of debt is subject to an average interest rate that is assumed to gradually increase from about 4 per cent in 2019–20 to 5 per cent by 2028–29 (to account for the fact that maturing debt will have to be renewed at increasingly higher rates) and remain constant thereafter. Any additional stock of debt (net assets) resulting from the accumulation of projected deficits (surpluses) is assumed to bear a 5-per-cent effective interest rate. Investment returns on financial assets (which are included in other revenues) are assumed to equal the borrowing costs (which are included in public debt charges) associated with their purchase.
Detailed Fiscal Projections
| 2019–20 | 2021–22 | 2025–26 | 2030–31 | 2035–36 | 2040–41 | 2045–46 | 2050–51 | |
|---|---|---|---|---|---|---|---|---|
| Revenues | 347.9 | 376.2 | 432.7 | 518.0 | 624.1 | 754.9 | 910.6 | 1,093.7 |
| Program expenditures | 299.6 | 325.1 | 375.2 | 446.9 | 537.0 | 641.8 | 763.9 | 908.7 |
| Public debt charges | 35.2 | 38.6 | 42.2 | 43.1 | 37.4 | 25.3 | 2.6 | -35.4 |
| Budgetary balance | 13.1 | 12.4 | 15.2 | 27.9 | 49.6 | 87.8 | 144.1 | 220.4 |
| Federal debt | 584.5 | 559.9 | 506.3 | 394.7 | 197.1 | -158.5 | -758.9 | -1,700.1 |
| Nominal GDP1 | 2,406.0 | 2,601.5 | 2,991.6 | 3,580.1 | 4,320.9 | 5,228.6 | 6,308.5 | 7,579.1 |
| 1 On a calendar-year basis. | ||||||||
| 2019–20 | 2021–22 | 2025–26 | 2030–31 | 2035–36 | 2040–41 | 2045–46 | 2050–51 | |
|---|---|---|---|---|---|---|---|---|
| Revenues | 14.5 | 14.5 | 14.5 | 14.5 | 14.5 | 14.5 | 14.5 | 14.5 |
| Program expenditures | 12.5 | 12.5 | 12.5 | 12.5 | 12.4 | 12.3 | 12.1 | 12.0 |
| Public debt charges | 1.5 | 1.5 | 1.4 | 1.2 | 0.9 | 0.5 | 0.0 | -0.5 |
| Budgetary balance | 0.5 | 0.5 | 0.5 | 0.8 | 1.1 | 1.7 | 2.3 | 2.9 |
| Federal debt | 24.3 | 21.5 | 16.9 | 11.0 | 4.6 | -3.0 | -12.0 | -22.4 |
| 2019–20 | 2021–22 | 2025–26 | 2030–31 | 2035–36 | 2040–41 | 2045–46 | 2050–51 | |
|---|---|---|---|---|---|---|---|---|
| Revenues | 4.5 | 3.8 | 3.6 | 3.7 | 3.9 | 3.9 | 3.8 | 3.7 |
| Program expenditures | 2.5 | 4.1 | 3.5 | 3.8 | 3.7 | 3.6 | 3.5 | 3.6 |
| Nominal GDP1 | 4.2 | 3.8 | 3.6 | 3.7 | 3.9 | 3.9 | 3.8 | 3.7 |
| 1 On a calendar-year basis. | ||||||||
Sensitivity Analysis
Because long-term projections and the range of possible results are inherently uncertain, the baseline projections presented in this annex are not intended to be exact forecasts. Rather, they provide a plausible baseline that follows from a reasonable set of demographic, economic and fiscal assumptions, which, as this sensitivity analysis shows, is fairly robust to a number of small changes to individual assumptions. On the other hand, larger changes or a combination of changes to some of these assumptions, a large change in the expected evolution of the medium-term economic and fiscal outlook, or a significant permanent shock to the Government’s revenue or spending would have more significant implications for the long-term economic and fiscal outlooks.
| High | Low | |
|---|---|---|
| Demographic: | ||
| Fertility rate (average births per woman) | +0.2 births | -0.2 births |
| Net immigration (per cent of population) | +0.1 p.p. | -0.1 p.p. |
| Life expectancy at 65 | +3 years | -3 years |
| Economic: | ||
| Total labour force participation rate (per cent) | +1.0 p.p. | -1.0 p.p. |
| Average weekly hours worked | +0.5 hours | -0.5 hours |
| Unemployment rate (per cent) | +0.5 p.p. | -0.5 p.p. |
| Labour productivity (per cent) | +0.1 p.p. | -0.1 p.p. |
| Interest rates (per cent) | +0.5 p.p. | -0.5 p.p. |
| Note: p.p. = percentage point. 1 These alternative assumptions are applied starting in 2020 except for changes in life expectancy, which are gradually applied over the projection horizon. |
||
| Baseline | High | Low | ||||
|---|---|---|---|---|---|---|
| Nominal GDP |
Real Per Capita GDP |
Nominal GDP |
Real Per Capita GDP |
Nominal GDP |
Real Per Capita GDP |
|
| Demographic: | ||||||
| Fertility rate | 3.8 | 0.9 | 3.8 | 0.8 | 3.7 | 0.9 |
| Net immigration | 3.8 | 0.9 | 3.9 | 0.9 | 3.6 | 0.9 |
| Life expectancy at 65 | 3.8 | 0.9 | 3.8 | 0.8 | 3.7 | 1.0 |
| Economic: | ||||||
| Total labour force participation rate | 3.8 | 0.9 | 3.8 | 0.9 | 3.7 | 0.8 |
| Average weekly hours worked | 3.8 | 0.9 | 3.8 | 0.9 | 3.7 | 0.8 |
| Unemployment rate | 3.8 | 0.9 | 3.8 | 0.9 | 3.8 | 0.9 |
| Labour productivity | 3.8 | 0.9 | 3.9 | 1.0 | 3.7 | 0.8 |
| High | Low | |||
|---|---|---|---|---|
| Nominal GDP |
Real Per Capita GDP |
Nominal GDP |
Real Per Capita GDP |
|
| Demographic: | ||||
| Fertility rate | 2.0 | -1.3 | -2.0 | 1.4 |
| Net immigration | 4.0 | 0.5 | -4.0 | -0.6 |
| Life expectancy at 65 | 0.5 | -2.0 | -0.5 | 2.1 |
| Economic: | ||||
| Total labour force participation rate | 1.6 | 1.6 | -1.6 | -1.6 |
| Average weekly hours worked | 1.5 | 1.5 | -1.5 | -1.5 |
| Unemployment rate | -0.5 | -0.5 | 0.5 | 0.5 |
| Labour productivity | 3.1 | 3.1 | -3.0 | -3.0 |
| Baseline | High | Low | ||||
|---|---|---|---|---|---|---|
| Deficit | Debt | Deficit | Debt | Deficit | Debt | |
| Demographic: | ||||||
| Fertility rate | -2.9 | -22.4 | -2.9 | -21.1 | -3.0 | -23.8 |
| Net immigration | -2.9 | -22.4 | -3.1 | -24.7 | -2.7 | -20.0 |
| Life expectancy at 65 | -2.9 | -22.4 | -2.5 | -18.2 | -3.3 | -26.3 |
| Economic: | ||||||
| Total labour force participation rate | -2.9 | -22.4 | -3.1 | -25.3 | -2.7 | -19.4 |
| Average weekly hours worked | -2.9 | -22.4 | -3.1 | -25.2 | -2.7 | -19.6 |
| Unemployment rate | -2.9 | -22.4 | -2.8 | -21.4 | -3.0 | -23.4 |
| Labour productivity | -2.9 | -22.4 | -3.1 | -24.9 | -2.7 | -19.9 |
| Interest rates | -2.9 | -22.4 | -3.0 | -21.6 | -2.8 | -23.0 |
1 The fertility rate in Canada rapidly decreased from a high of 3.9 children per woman in 1959 to 1.7 in 1979, and has stayed close to this level ever since. Canadians have seen their life expectancy at birth increase by about 20 years since the 1920s.
2 The labour force includes non-institutionalized individuals aged 15 and over who are either working or actively seeking a job. Labour force participation rates are low when individuals are young (ages 15 to 24), reach peak levels between the ages of 25 and 54 and begin to decline starting at age 55. While participation rates of older individuals are expected to continue to increase, they are expected to remain well below rates seen among younger age groups.
3 Average annual hours worked by Canadians have gradually declined over the last four decades. This decline reflects several factors, including: rising post-secondary school enrolment, which limits the number of hours that younger individuals can work; the rise in part-time work, which is related to the increasing share of the service sector in the overall economy, characterized by a shorter and more flexible work week; and rising incomes, which have enabled the substitution of some work hours for some increased leisure time.
4 Statistics Canada produces three long-term population projections based on low-, medium- and high-growth scenarios.