
Archived - Statement and Impacts Report on Gender, Diversity, and Quality of Life

Statement and Impacts Report on Gender, Diversity, and Quality of life(PDF, 3,114 KB)
Statement on Gender Equality and Diversity in Canada
Canada’s efforts towards gender equality span a long period in our country’s history, punctuated with key moments of significant progress. Strategic investments such as the first-ever 2SLGBTQI+ Action Plan and ongoing efforts to reinforce the collection, analysis, and research of disaggregated data will ensure that the government has an improved understanding of the needs of diverse communities of women, Indigenous Peoples, Black and racialized people, persons with disabilities, and 2SLGBTQI+ people. Generations of Canadian women fought for the equal rights that so much of our progress is built on today. The establishment of an affordable Canada-Wide Early Learning and Child Care System, signed across all 13 provinces and territories and backed by an historic $30-billion investment in Budget 2021, is one of these key moments.
Affordable, high-quality child care, from coast-to-coast-to-coast, will allow more women to choose to enter the workforce or return to the careers they love. This means that record investments in Budget 2023 to build Canada’s clean economy will create opportunities for women like never before in Canada’s history.
Looking ahead, the government remains committed to ensuring that gender equality and fairness and inclusion considerations remain a core focus of the annual federal budget, supported by the Canadian Gender Budgeting Act. The government implemented the Act in 2018 to ensure gender and diversity are accounted for in all taxation and resource allocation decisions.
Diversity is a key component of high performing societies. Greater outcomes emerge when people come together regardless of race, lineage, religion, or gender. Canada and the world's future success will be increasingly tied to our capacity to harness different backgrounds, skills, attitudes, experiences, and perspectives. The advantages this brings are limitless.
Gender budgeting is an approach to inform policy actions that address the needs of Canadians in their different life stages and circumstances. To achieve this, gender budgeting is supported by its underlying tools—namely Gender-based Analysis Plus (GBA Plus) and the Gender Results Framework—which are core to Canada’s approach.
- GBA Plus recognizes that many identity factors such as gender, income, age, disability, and geography can affect access to opportunities. Through this intersectional approach GBA Plus deepens our understanding of how policies uniquely affect people with diverse experiences, to create policies that are inclusive of these experiences.
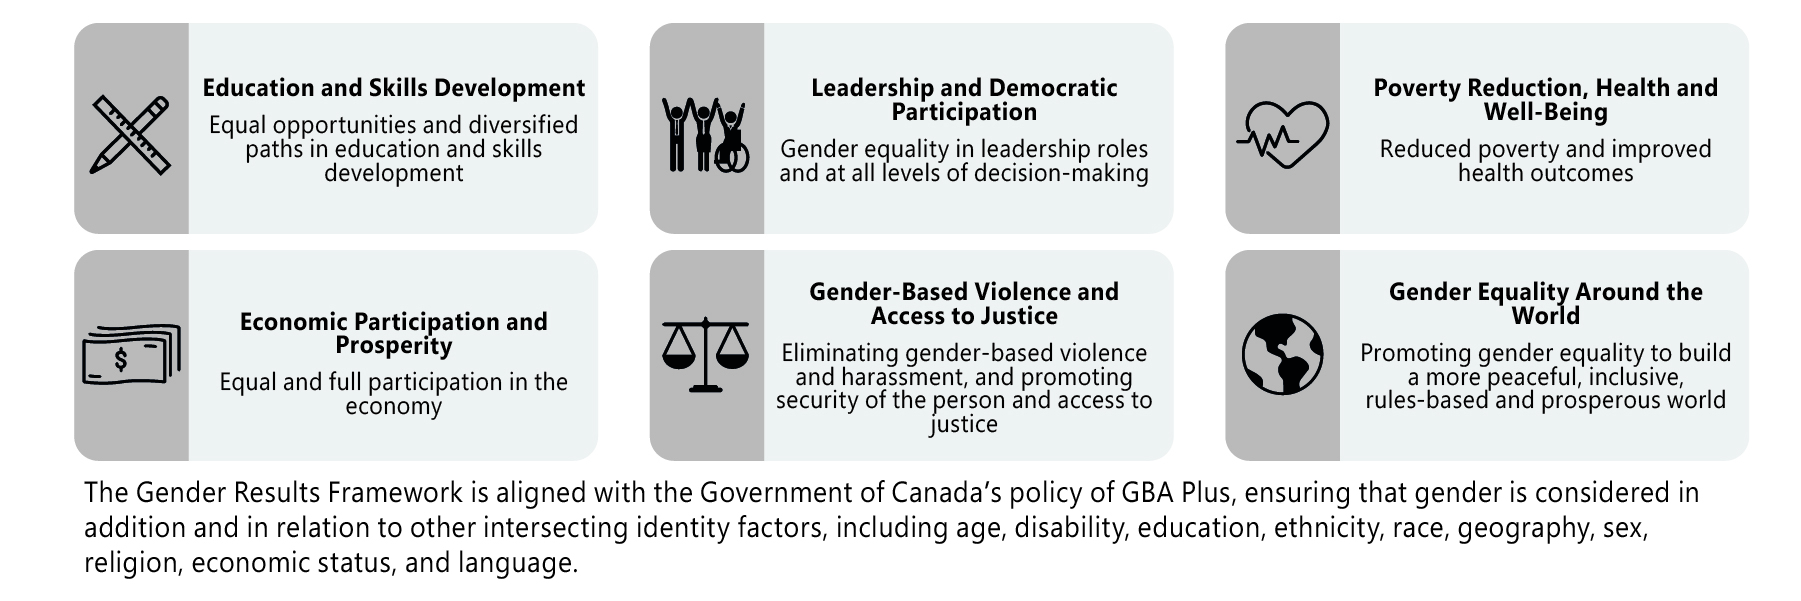
- The Gender Results Framework (GRF) takes a whole-of-government approach to advancing Canada’s gender equality priorities by informing decision-making and tracking progress. These priorities are represented across six pillars and measured against a set of key indicators. Where notable, intersecting identity factors are also represented.
Disaggregated data represent a crucial element of Canada’s ability to perform credible gender budgeting. In Budget 2021, the government announced significant funding for investments in disaggregated data to inform better decision-making. Detailed data can help identify and address gender gaps, and other systemic barriers facing specific population groups, such as women, Indigenous Peoples, Black and racialized people, and persons with disabilities. The Impacts Report, which follows this Statement, demonstrates efforts to use disaggregated data in reporting on the impacts of measures in this budget.
Gender Equality Goals for Canada
Note on Methodology
Building on the recent investments in disaggregated data, particularly in Budget 2021, this year’s Statement puts an emphasis on an intersectional approach to reporting data. In doing so it recognizes that combined identity factors contribute to varying outcomes and experiences between people.
The terminology used in this Statement is largely dictated by the data collection process, which, until recently, continued to reflect binary norms of gender and did not consider differences between sex at birth and gender identity. However, future iterations of this report should allow us to paint a more comprehensive picture, as new data sources emerge.
That said, it is not always possible to report on the indicators for each group individually, due to concerns around small population sizes and protecting privacy. This is the case for statistics on sexual orientation for example, which are now more frequently available in Canada.
Time periods reflected in the dashboards vary, as not all Statistics Canada surveys are conducted across a consistent time series. Where possible, efforts have been made to reflect the most recently available data.
This year’s Statement is built on newly strengthened data, thanks to a collaboration with Statistics Canada to develop specific analysis based on GRF indicators. The indicators presented in this dashboard mirror the indicators outlined in the GRF as closely as possible, to ensure consistent reporting practices. However, disaggregated datasets not previously reported on, but which support interpretation of the indicators, are a key opportunity to showcase tangible outcomes of the Disaggregated Data Action Plan, and how it is being leveraged in gender budgeting.
As Statistics Canada advances its work on disaggregated data, the government expects that data will continue to be strengthened in future iterations of this Statement.

Gender Results Framework
Pillar: Education and Skills Development
Goal: Equal opportunities and diversified paths in education and skills
development
An educated and skills-based workforce bolsters economic development. Fair access to educational opportunities enhances individual capabilities, supporting people to choose, define, and succeed in their own career paths.
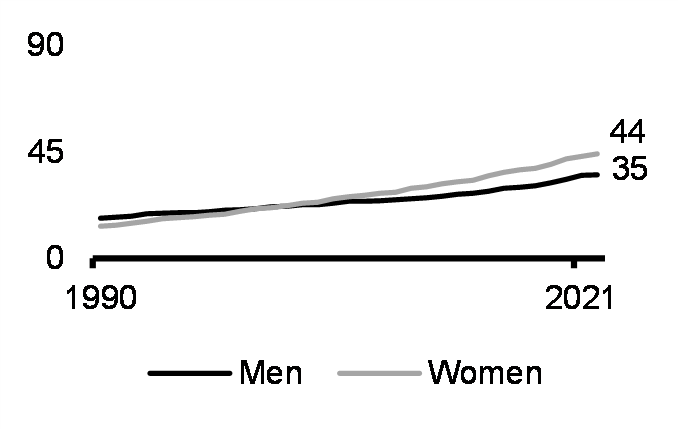
Educational attainment
(highest education, 25-54 yrs, %, 1990-2021)
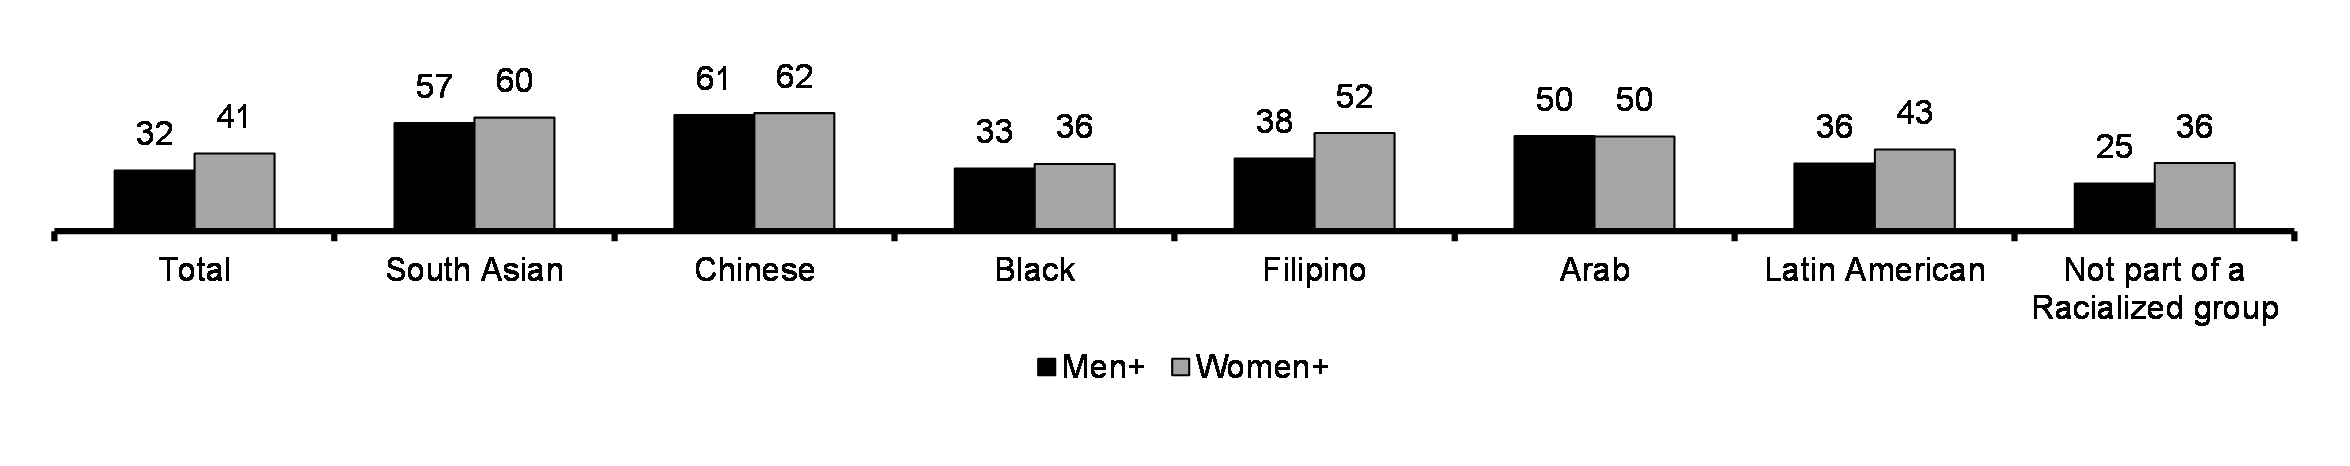
(highest education, 25-54 yrs, %, 2021)*
Tradespeople
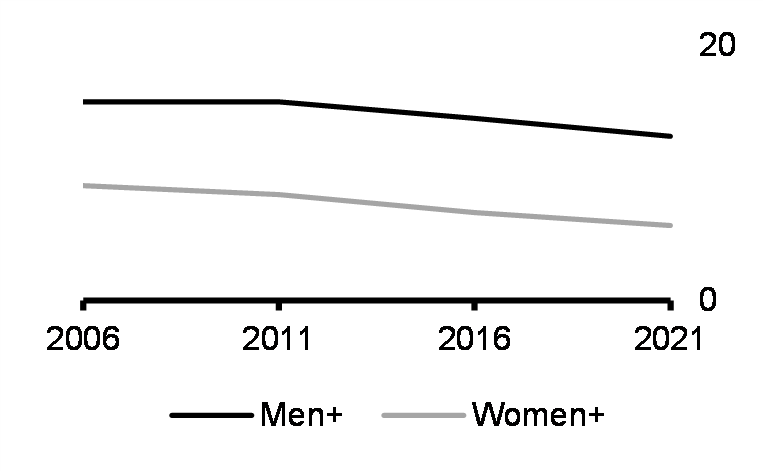
(highest education, 25-54 yrs, %, 2006-2021)*
granted to women (%, 2021)
| Total | 10 |
|---|---|
| Early childhood educators and assistants | 96 |
| Hairstylists and estheticians | 87 |
| Community and social service workers | 87 |
| Plumbers, pipefitters and steamfitters | 2 |
| Heavy duty equipment mechanics | 1 |
| Refrigeration and air conditioning mechanics | 1 |
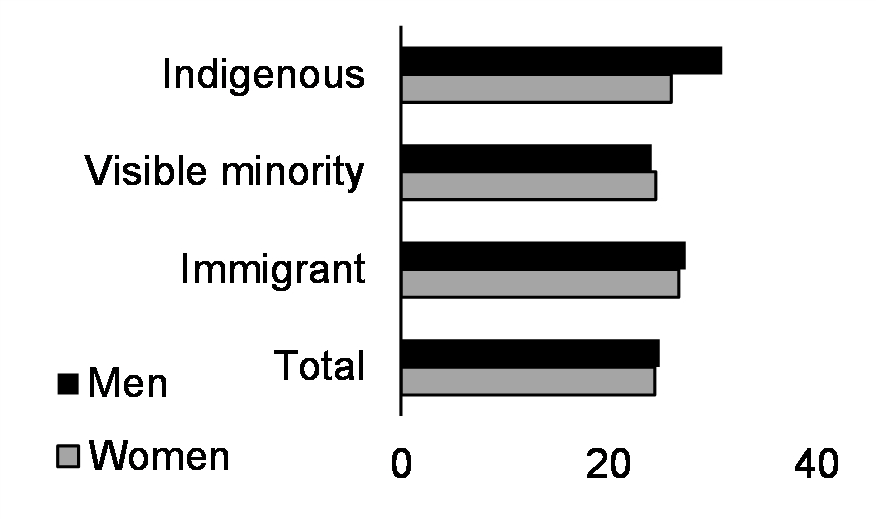
Postsecondary school attendance
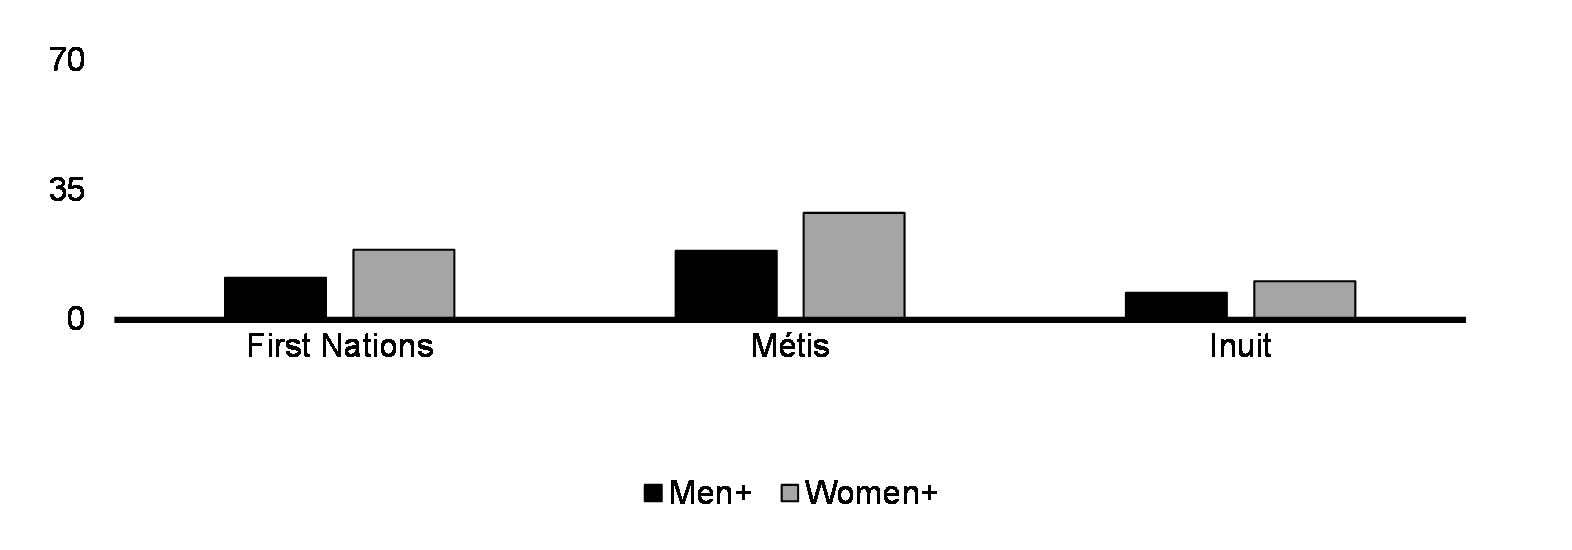 by Indigenous identity
 (15-24 yrs, %, 2021)*
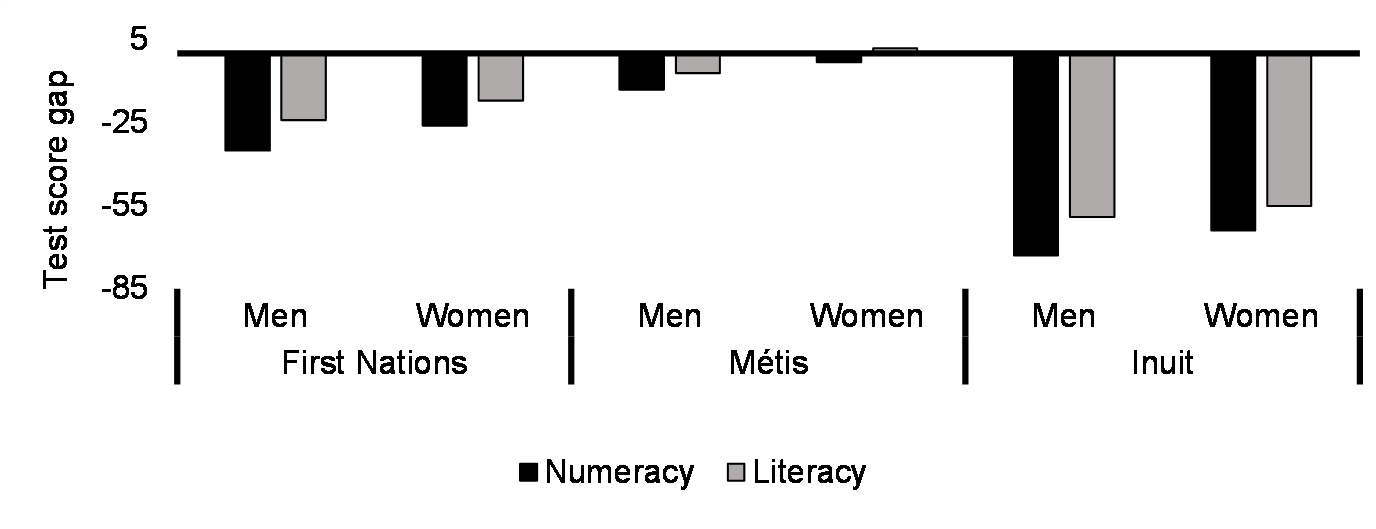
Test score gap relative to non-Indigenous people
(mean score around 270 pts, 16-65 yrs, 2012)
Proportion of bachelor's students
who were women (%, 2019-20)
| Total | 56 |
|---|---|
| Health care | 79 |
| Education and teaching | 77 |
| Social and behavioural sciences | 71 |
| Mathematics and computer and information sciences | 28 |
| Engineering and engineering technology | 22 |
Note: * As the non-binary population is small, data aggregation to a two-category gender protects confidentiality. People in the category “non-binary persons” are distributed into the other two gender categories and denoted by the “+” symbol.
Sources: Labour Force Survey, Census of Population, Programme for the International Assessment of Adult Competencies, Postsecondary Student Information System.
While women tend to be underrepresented in some educational fields, the dashboard above presents a picture of meaningful progress overall towards educational attainment for women, Indigenous Peoples, and Black and racialized people in Canada.
- Women in Canada are among the most educated in the world, and education levels have been rising in Canada overall, with a little over one in three working-age people in Canada holding a bachelor’s degree or higher in 2021.
- Working-age women were more likely to have completed a degree than men as of 2021. Women in this age group were also more likely to have completed an education beyond the bachelor level compared to men and have consistently had higher rates of education at this level since 2010.
- The education gender gap among Black and racialized people tended to be lower than among the non-racialized population, though women still tended to have higher education rates. The share of non-racialized women who held a bachelor’s degree or higher was 11 percentage points higher than that of non-racialized men in 2021.
- Among all the Red Seal trades from 2017 to 2021, the number of women apprentices increased the most significantly in carpentry, construction electrical work, and plumbing.
- Although Indigenous people continue to face gaps in terms of high school completion and post-secondary attainment, there were significant improvements in educational outcomes for Indigenous people between 2016 and 2021.
To provide financial stability to students from low- and middle-income households during their post-secondary education, the government will provide enhanced student grants and student loans for the upcoming school year. Government investments allow Canadians not only to choose their own educational and career paths but also to learn in their own official language, and to benefit from second-language learning. Knowledge of official languages will increase the level of bilingualism among young Canadians and support educational institutions in official language minority communities across the country.
Actions to Support Education and Skills Development
- Between the 2016 and 2020 school years, an average of 716,800 students annually received Canada Student Financial Assistance, including grants and loans. The average level of support per student grew from $5,800 in 2016 to $9,500 in 2020.
- A total of $495.7 million of Canada Student Grants for Students with Disabilities has been awarded to approximately 51,000 students with permanent disabilities each year since 2017. In Budget 2021, the government expanded this support.
- To promote our official languages,13 bilateral agreements were signed with the provinces and territories to help facilitate and enrich minority-language education and second-language learning. In 2020-21, there were 1,746,096 young Canadians enrolled in French as a second language programs at the elementary and secondary levels outside of Quebec, while 482,769 students were in French immersion.
- Over $4.1 billion has been invested since 2015 in elementary and secondary education for First Nations children living on reserve, and nine regional education agreements have been concluded to support First Nations-led education systems.
- Enhanced Canada Student Grants and Loans for the 2023-24 school year will benefit post-secondary students from low- and middle-income households.
- Additional funding through the next five-year Action Plan for Official Languages, 2023-2028, will help ensure the availability of high-quality minority-language education, and opportunities for second-language learning across Canada.
* Please refer to the Impacts Report to see other Budget 2023 investments that are expected to advance this pillar.

Gender Results Framework
Pillar: Economic Participation and Prosperity
Goal: Equal and full participation in the economy
An economy that advances equal and meaningful opportunities for participation strengthens economic growth for the benefit of all Canadians.
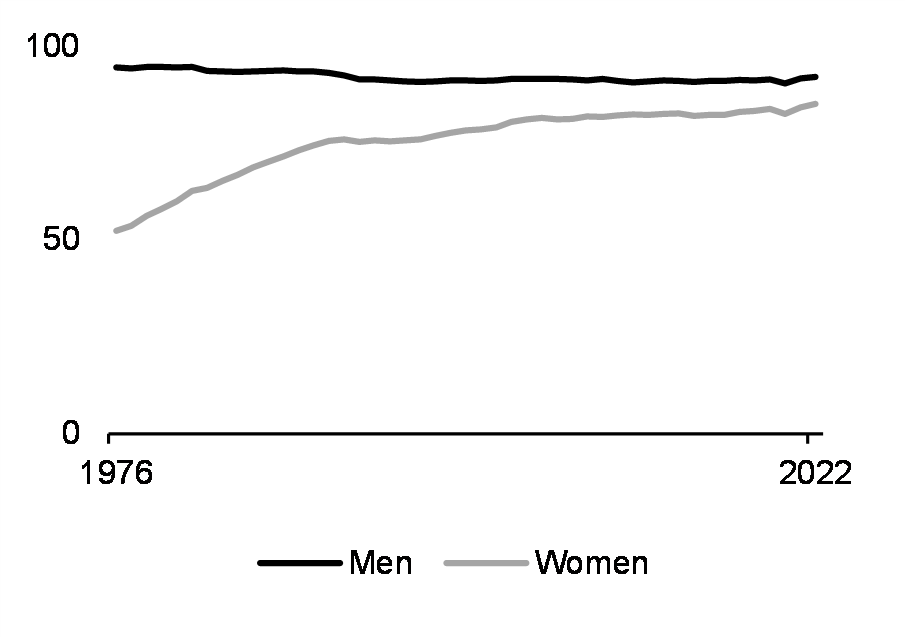
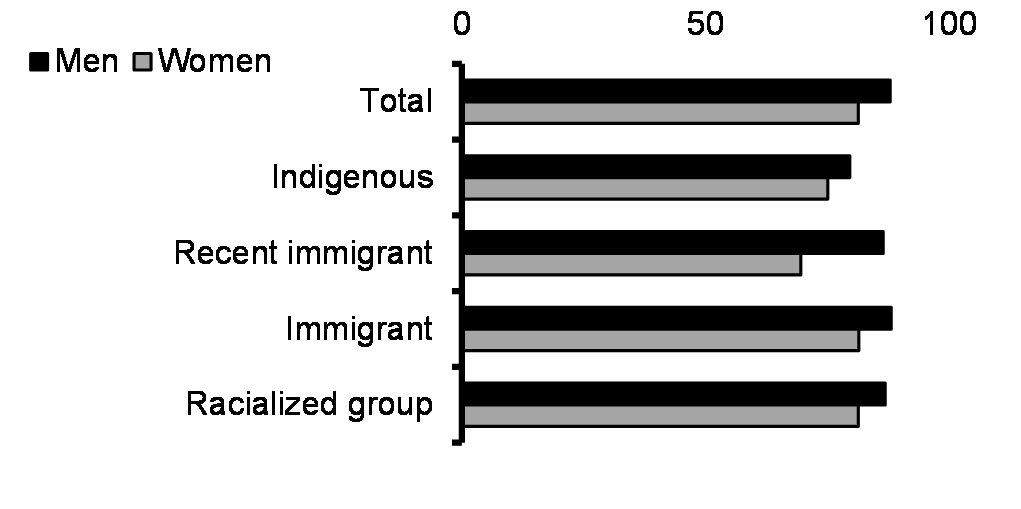
Labour force
Earnings
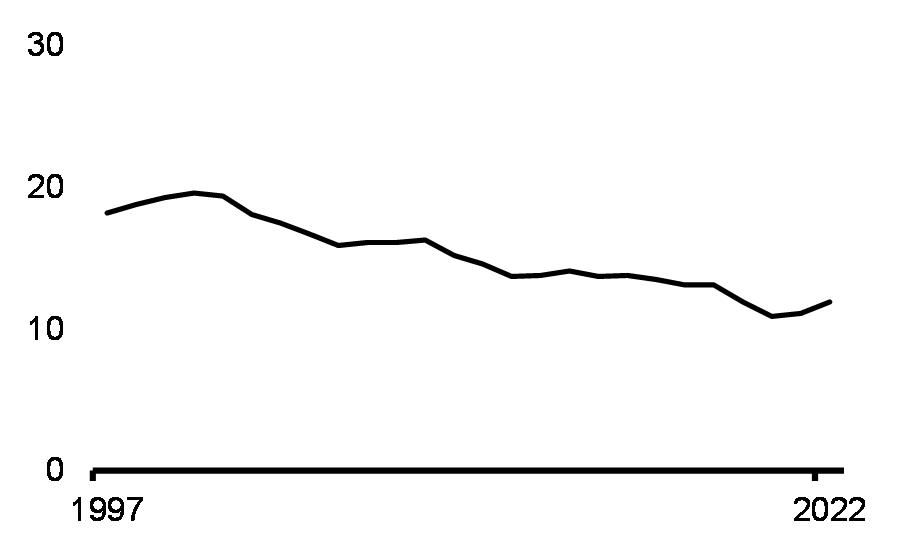
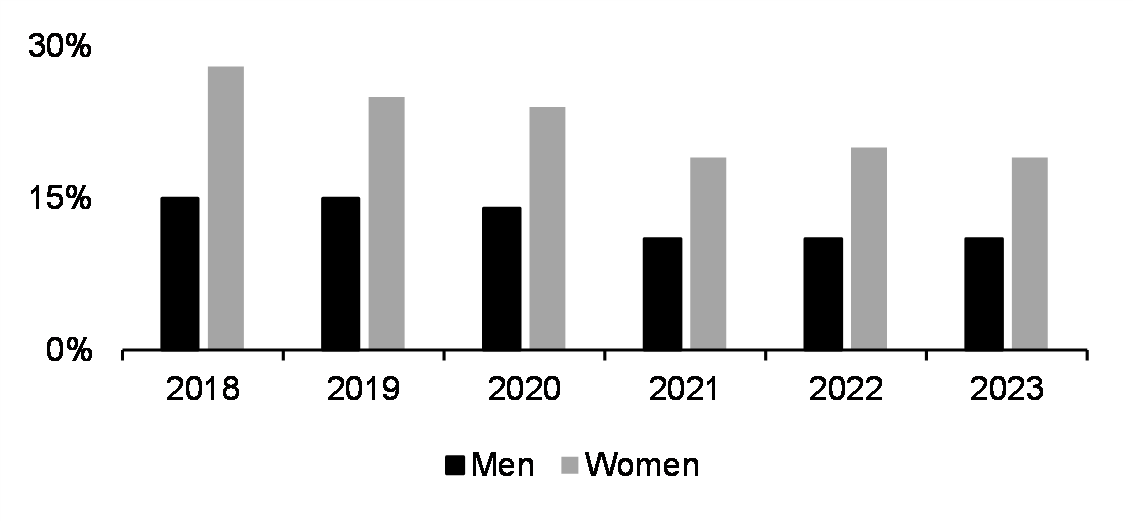
Type and hours of work
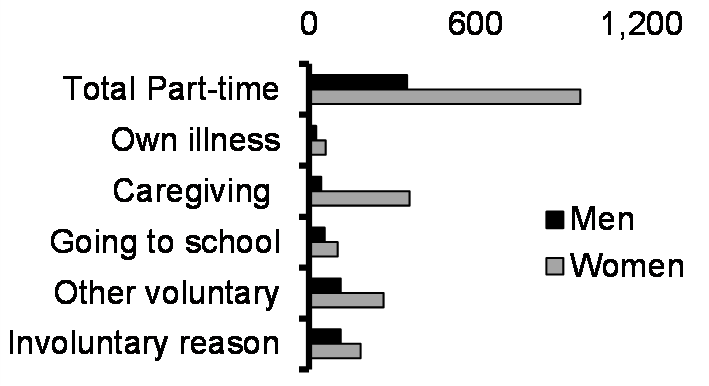
(25-54 yrs, %, 2022)
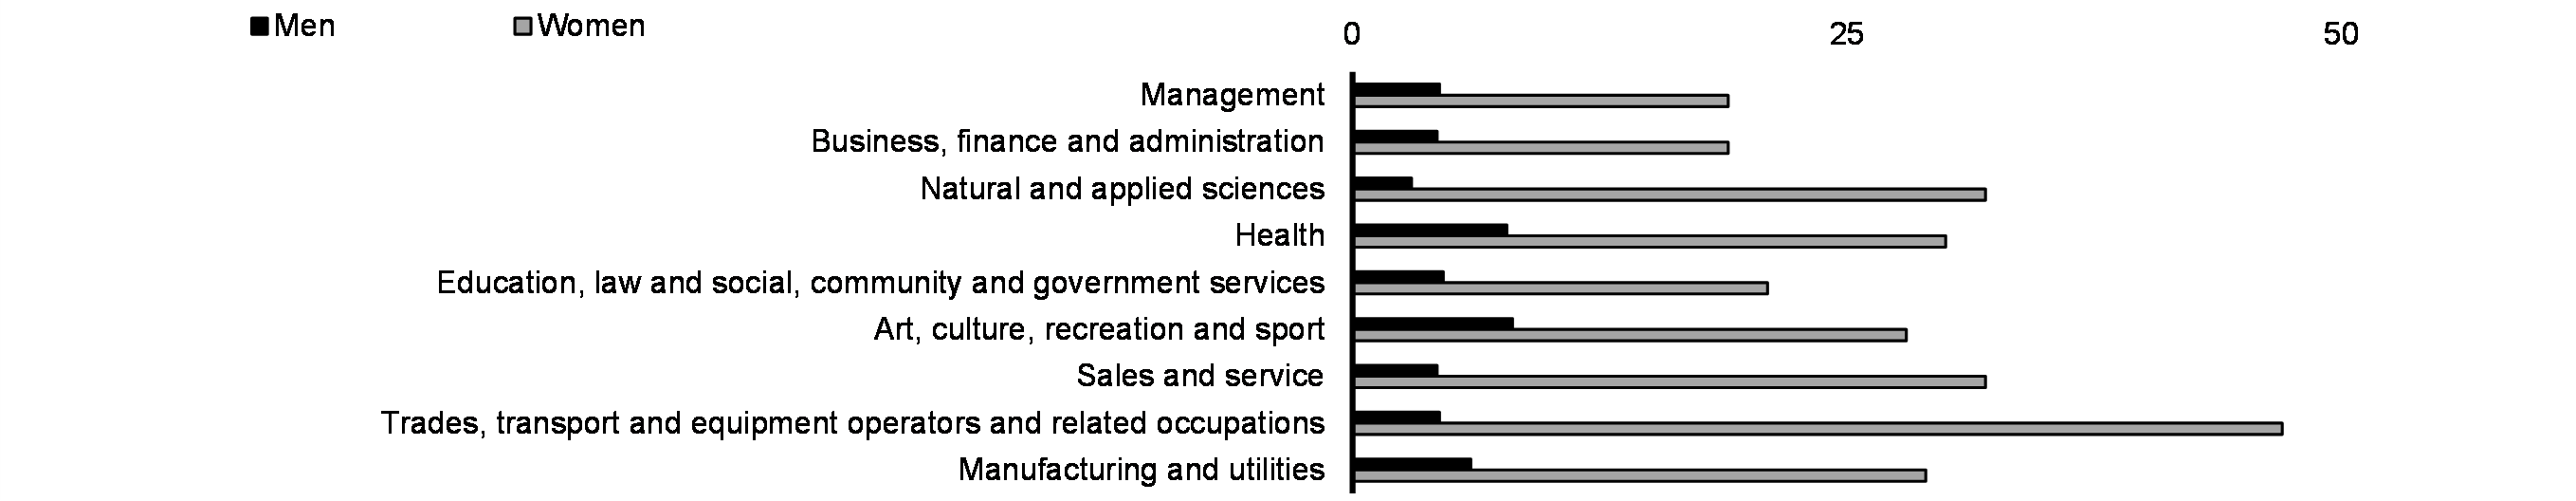
Proportion of women in selected occupations
(%, 2022)
| Natural and applied sciences | 24 |
|---|---|
| Health | 79 |
| Education, law and social, community and government services | 69 |
| Trades, transport and equipment operators | 7 |
| Natural resources, agriculture and related production | 18 |
| Manufacturing and utilities | 28 |
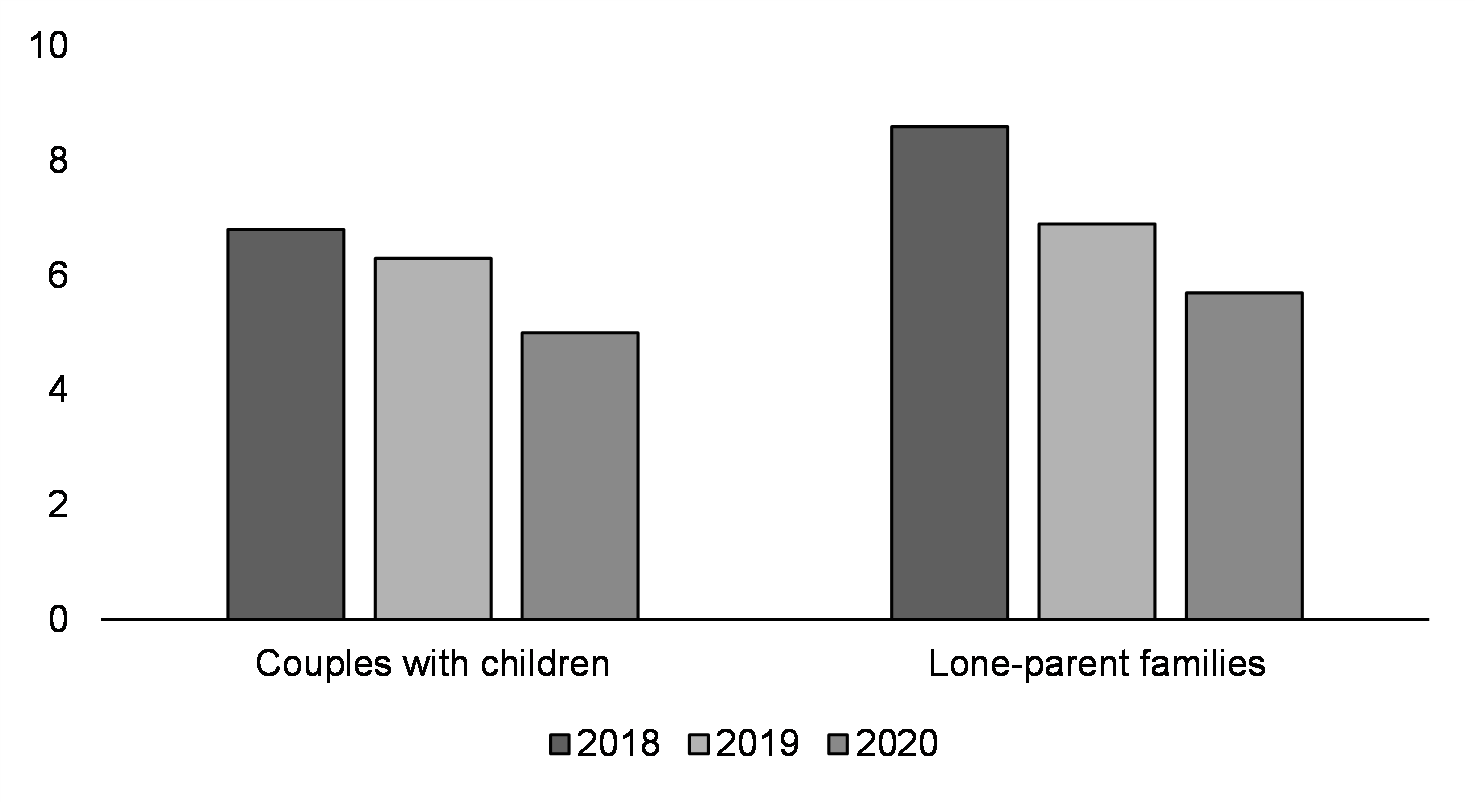
Proportion of after-tax family income spent on child care (%, youngest child aged 5 yrs or less, 2018-2020)
Sources: Labour Force Survey, Canadian Social Survey, Canadian Income Survey.
For women in particular, data suggest significant gains in employment have been realized since 2021. However, a more comprehensive analysis indicates that significant imbalances still exist for women in pay parity and unpaid care responsibilities. Investments in affordable child care and personal support workers are crucial to empowering women to seize economic opportunity.
- Working-age women saw record employment rates in February 2023, reaching 85.7 per cent. The employment rate for working-age immigrant women remains lower than the average for women, but it increased by almost 10 percentage points from 2019 to 2022, reaching 69 per cent, reflecting—in part—recent federal government investments in early learning and child care.
- Although the gender pay gap among working-age Canadians fell by almost 3 percentage points for hourly earnings from 2015 to 2021, with women making gains in fields like law, education, business, and finance, it did not disappear. Men continued to have higher earnings than women in 2021.
- Even at the top one per cent of income levels, the gender pay gap persisted (median income of $362,300 for women in 2015 compared to $393,200 for men). This gap varied across population groups; for example, the pay gap between women and men executives was greater among immigrants (29 per cent) than those Canadian-born (25 per cent).
- Black and racialized people were underrepresented among the highest earners for both genders; only one in seven women in the top one per cent of income was part of a racialized group, compared to one in five women in the overall working population.
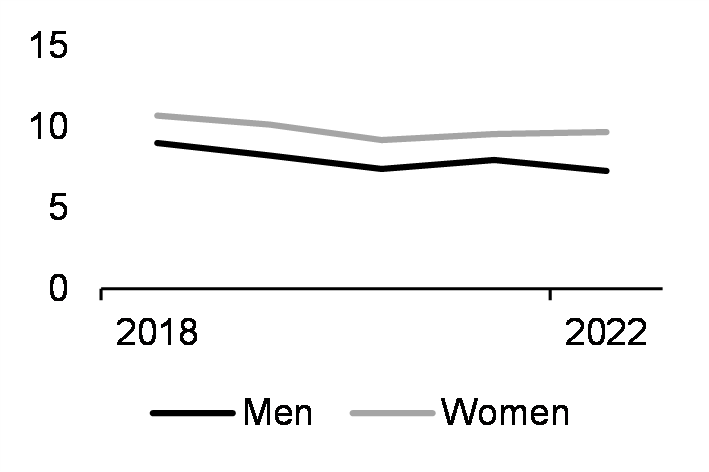
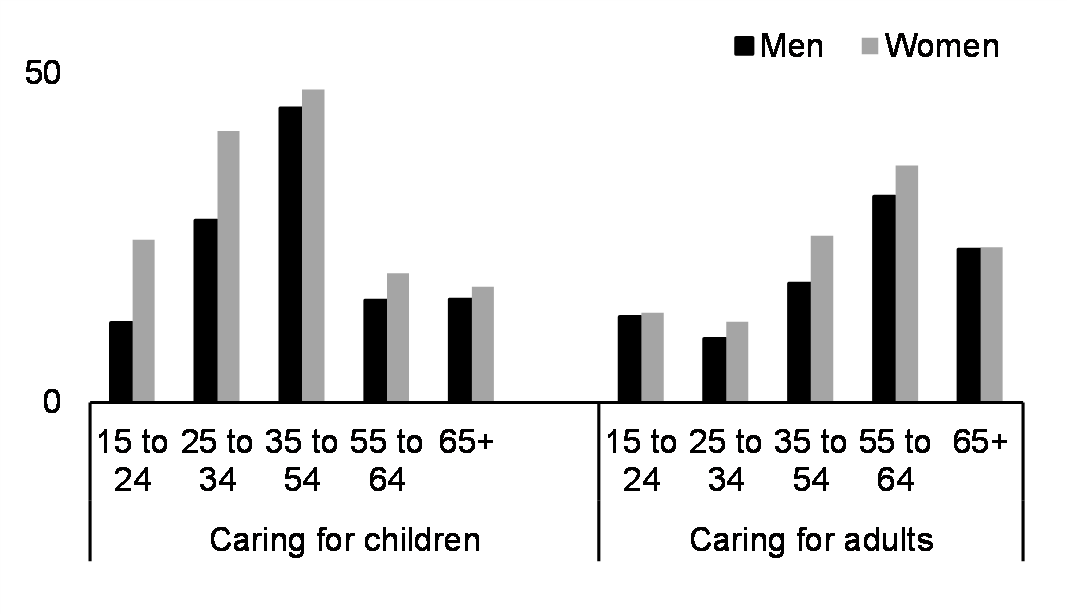
- In addition to paid work, nearly a third of women provided unpaid care to children and almost one-quarter provided unpaid care to adults with long-term conditions or disabilities—proportions that were higher than those of men.
Investments in this budget recognize that sustained economic growth requires opportunities for all Canadians. New measures to support a thriving net-zero Canadian economy will generate good jobs and broad-based prosperity—bolstered by supports for early learning and child care which help women to participate in the workforce and earn their fair share of increased economic growth. This is especially true for Indigenous women, for whom working in the natural resource sector is one of the highest paying occupations. Initiatives will improve the economic participation of Indigenous Peoples including a commitment to continued support for First Nation Land Management.
Actions to Support Economic Participation and Prosperity
- The first eight months of engagement on the National Benefits-Sharing Framework consisted of over 30 meetings with Indigenous organizations, two roundtable discussions with Indigenous industry representatives, over 15 meetings with industry associations, and over 35 meetings with provinces and territories.
- By April 2, 2023, six provinces and territories will be providing regulated child care for an average of just $10-a-day or less—significantly ahead of the federal target. All other provinces and territories remain on track to achieve $10-a-day child care by 2026.
- Over $4.5 billion has been invested since 2015 to build an early learning and child care system to meet the needs of Indigenous families, wherever they live.
- As of March 17, 2019, the Employment Insurance Parental Sharing Benefit provides additional weeks of benefits to parents who share parental benefits, supporting greater gender equality in the home and in the workplace.
- Additional funding for engagements to support the further development of the National Benefits-Sharing Framework, including exploration of additional federal supports to increase access to capital for Indigenous people to invest in major resource projects.
- Loans through the Canada Infrastructure Bank to Indigenous communities to support them in purchasing equity stakes in infrastructure projects in which the Bank is also investing.
- Budget 2023 affirms the government’s commitment to negotiate a renewed operating funding formula with the Lands Advisory Board that will ensure continued growth and success of First Nation Land Management.
- Additional funding to the Women’s Program will strengthen women’s organizations that help women access economic opportunities.
- Supporting the TV5MONDEplus Platform will help ensure that French-speaking Canadian audiovisual producers have access to new markets.
* Please refer to the Impacts Report to see other Budget 2023 investments that are expected to advance this pillar.

Gender Results Framework
Pillar: Leadership and Democratic Participation
Goal: Gender equality in leadership roles and at all levels of
decision-making
Having diverse voices participate in all aspects of decision-making and leadership fosters creativity, collaboration, and better outcomes for all Canadians.
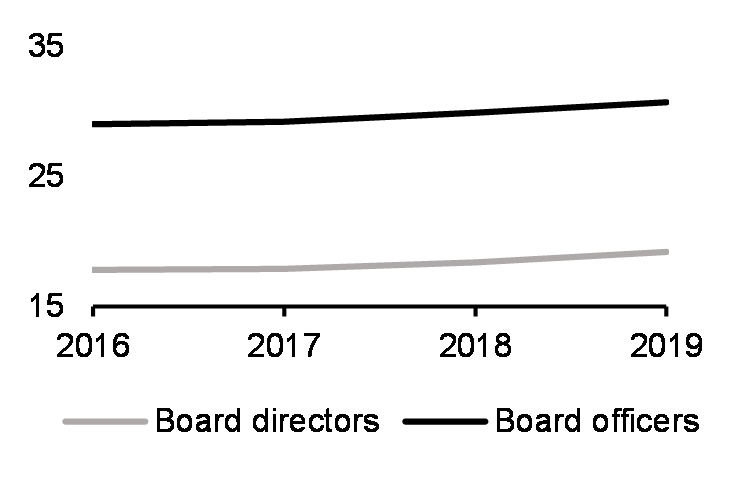
Economic leadership
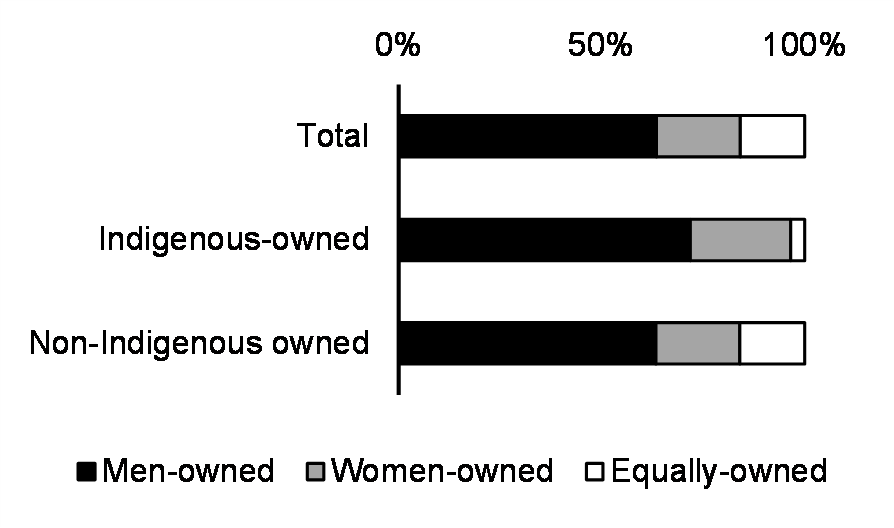
(%, 2016-2019)
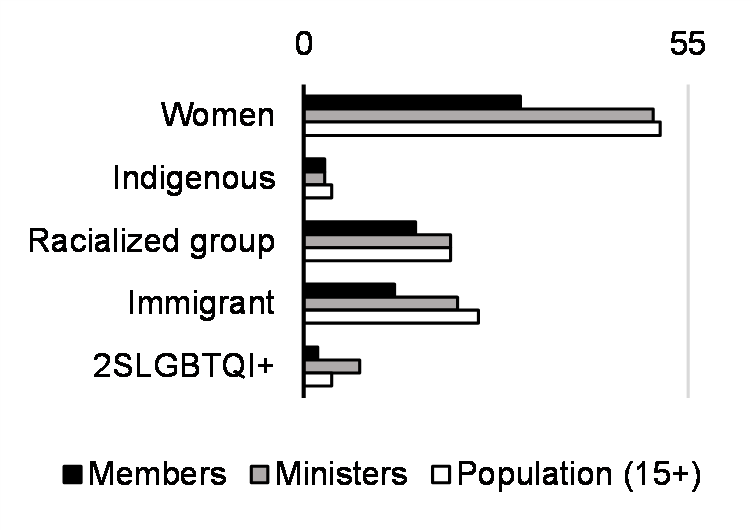
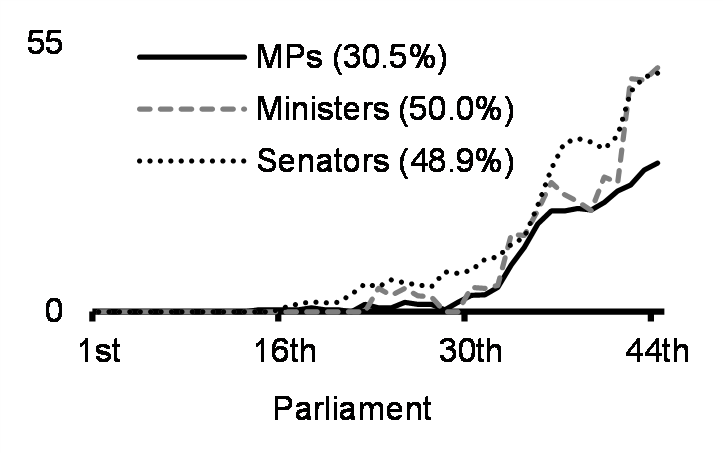
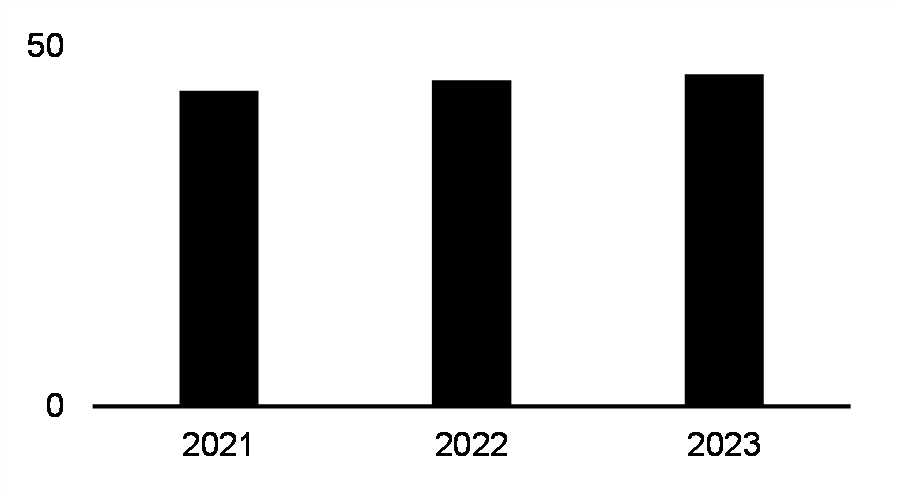
Political leadership
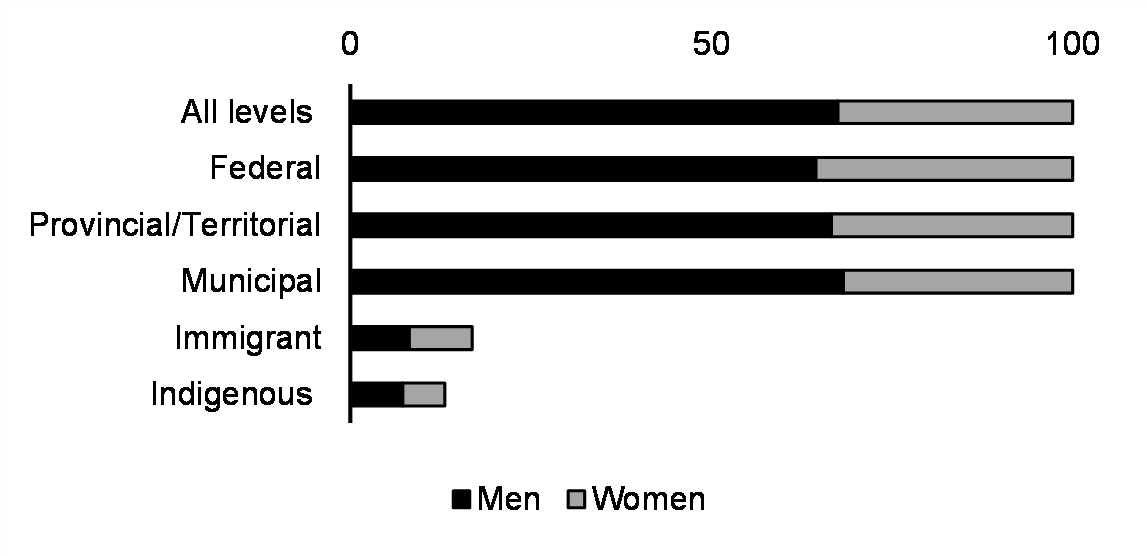
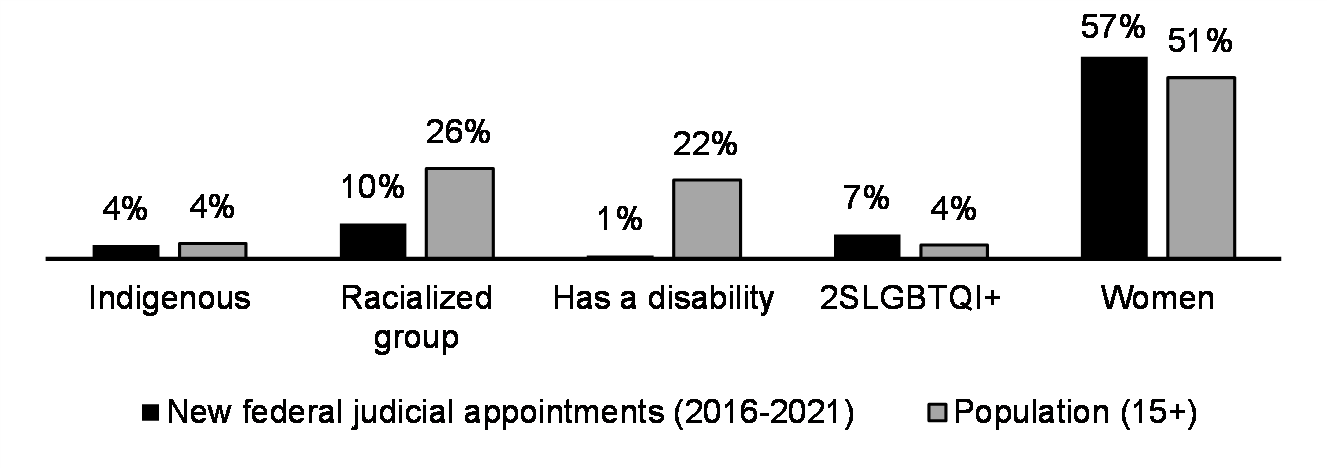
Judicial representation
women (%, 2021-2023)
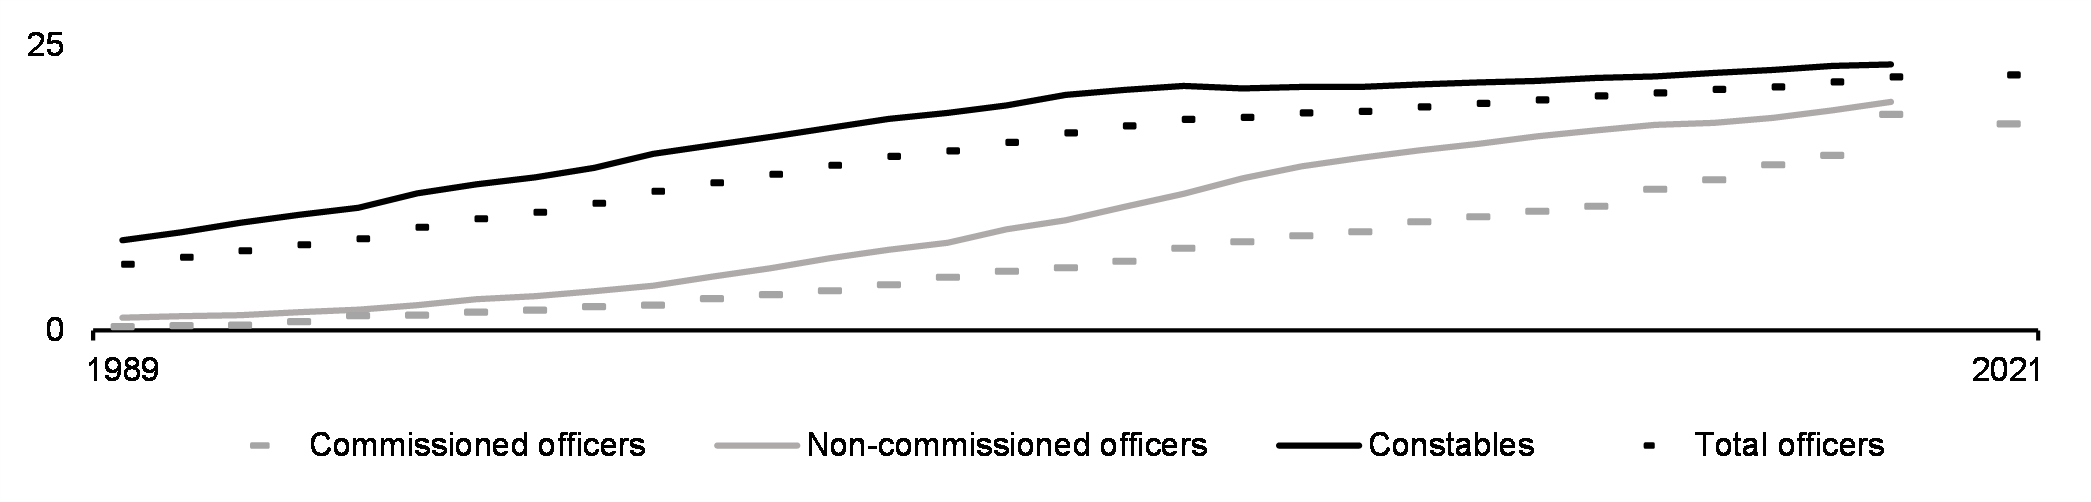
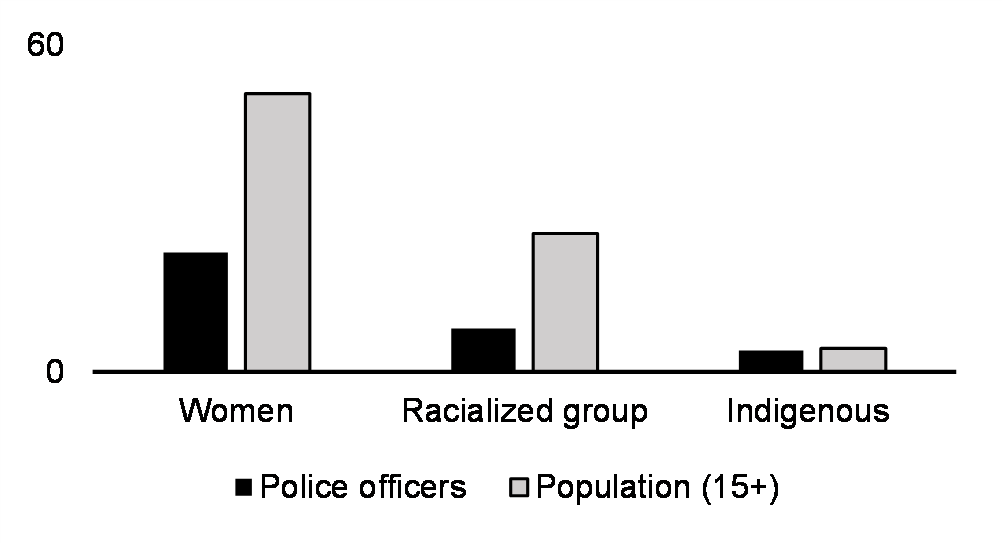
Law enforcement
Note: * Indicates that estimates of population shares are from a different year (i.e., 2016).
Sources: Labour Force Survey, Canadian Employer-Employee Dynamics Database, Business Register – Corporations Returns Act, Library of Parliament, Policy Options, Department of Finance Canada internal analysis, Census of Population, Police Administration Survey.
Efforts to increase the inclusion of women in top leadership positions across all sectors have been steady but still too slow. Women account for just a third of leadership positions in Parliament, business, justice, and law.
- In general, women have seen increasing representation in leadership positions over time. This includes representation at various levels of government, in senior management, in policing, and in the justice system.
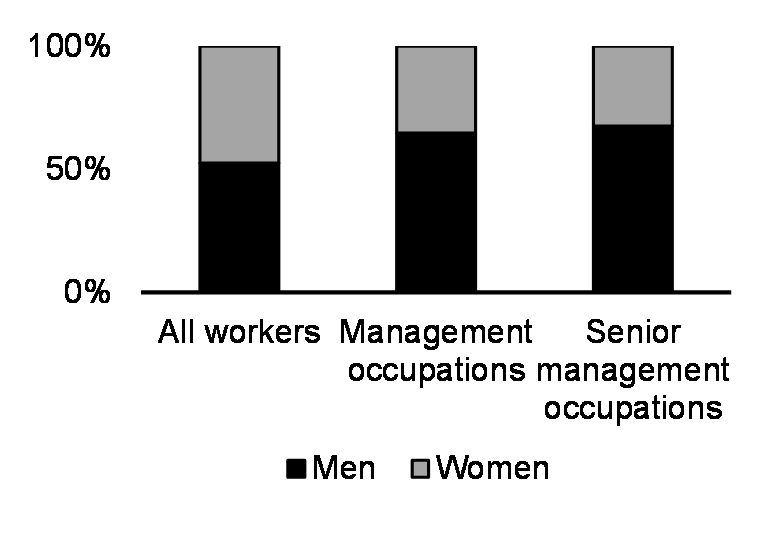
- The proportion of senior management positions held by women increased steadily between 2001 and 2022, but they were still mostly held by men. Only 33 per cent of senior managers were women in 2022, an increase of nine percentage points from 2001.
- Over the last four years, the number of women elected to Parliament has steadily grown. In 2022, women made up 31 per cent of Members of Parliament, a share that grew each year since 2018. Since 2015, Canada has had a gender-balanced Cabinet, and that proportion remained at a stable level through to 2023.
- Among legislators working in public administration across all levels of government in 2016, about one-third were women, with slightly higher representation at the federal level (36 per cent) than the provincial and territorial (33 per cent) or local (32 per cent) levels.
- In 2023, 46 per cent of federally appointed judges were women. This proportion varied across provinces and territories but was generally between 40 per cent and 50 per cent. Yukon and the Northwest Territories had fewer judges, but all of them were women. However, only about one-third of federal court judges were women.
The government recognizes that investments in promoting diversity in leadership roles is needed in all sectors of the economy. Legislative amendments introduced through Budget 2023 will ensure that diversity disclosures for federally regulated financial institutions will promote equal access to economic opportunities in the financial sector for all Canadians, while other investments will seek to advance career opportunities for Black employees in the public service.
Actions to Support Leadership and Democratic Participation
- As of February 2023, there are 1,884 organizations participating in the 50-30 Challenge, committing to having representation of 50 per cent women and 30 per cent other underrepresented groups in senior management and on boards. Participants in the 50-30 challenge include large corporations, small- and medium-sized enterprises, post-secondary institutions, not-for-profits, and charities.
- Introduced in 2021, Public Service Employment Act amendments included changes to the preamble of the legislation to include a specific commitment to diversity in the public service.
- In June 2022, the Indigenous Growth Fund, under the management of the National Aboriginal Capital Corporations Association, secured its first private investment of $3 million from Block, a technology company with a focus on financial services. This will increase overall financing available to Indigenous entrepreneurs who require capital to start or expand their businesses.
- Legislative amendments to adapt and apply the Canada Business Corporations Act diversity disclosure requirements to federally regulated financial institutions will promote greater gender, racial, and Indigenous diversity among senior ranks of the financial sector and ensure more Canadians have access to these opportunities.
- Building on amendments to the Public Service Employment Act to remove bias and barriers in the staffing process, investments will support Black employees in the public service in providing targeted career development opportunities and supporting a healthy and safe work environment.
- Funding for the Northern Participant Funding Program will support Northern Indigenous communities and organizations’ engagement on major infrastructure and resource projects which impact their lands, lives, and livelihoods.
* Please refer to the Impacts Report to see other Budget 2023 investments that are expected to advance this pillar.

Gender Results Framework
Pillar: Gender-Based Violence and Access to Justice
Goal: Eliminating gender-based violence and harassment, and promoting
security of the person and access to justice
All Canadians deserve to live free from violence regardless of their identity.
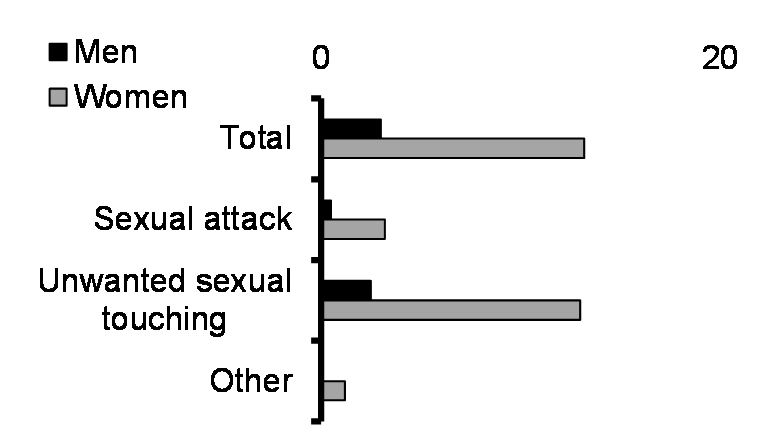
Workplace harassment
Experienced a work-related sexual assault (%, 2020)
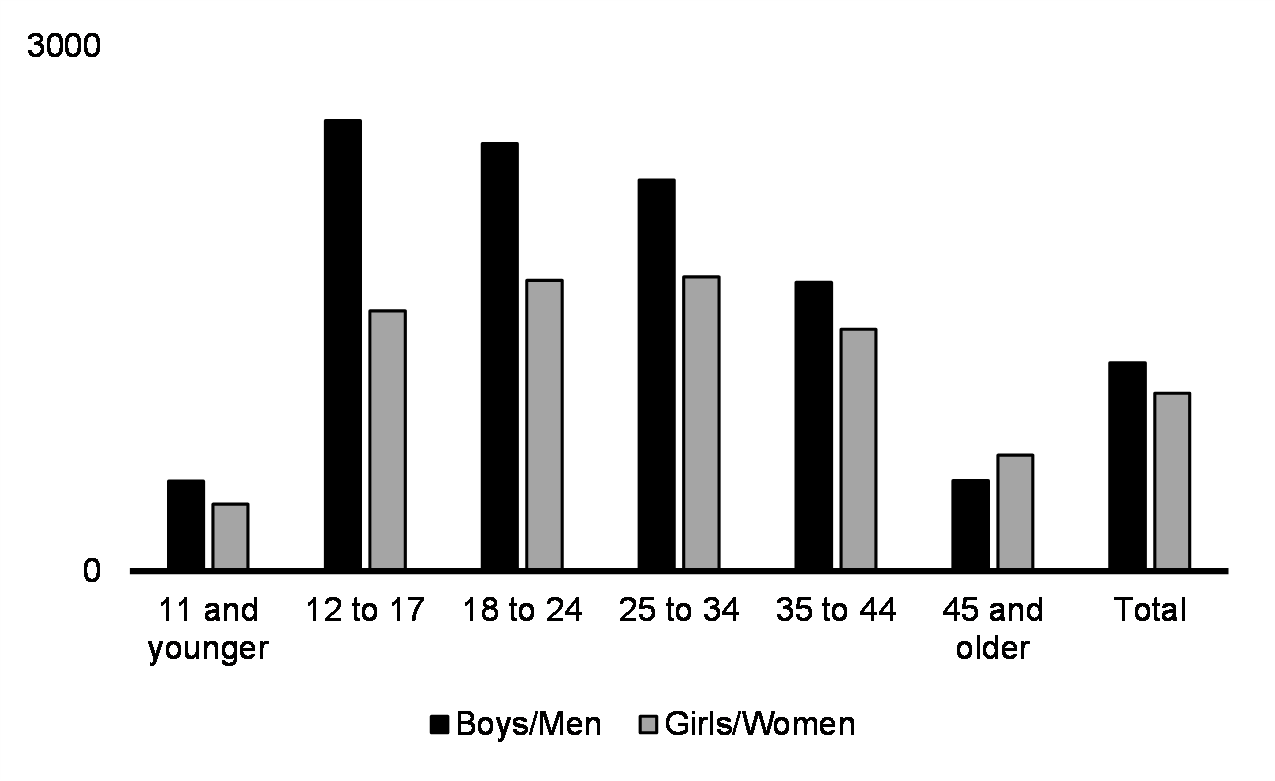
Rate of police-reported violent crime (number, 2020)
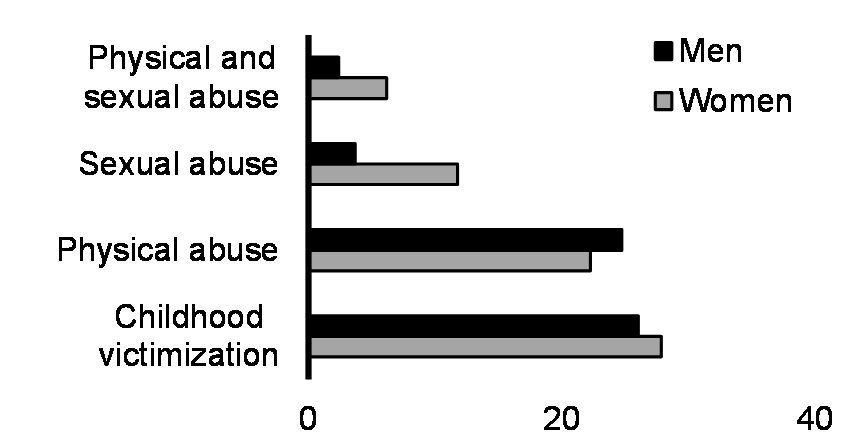
Experience of childhood victimization (%, 2018)
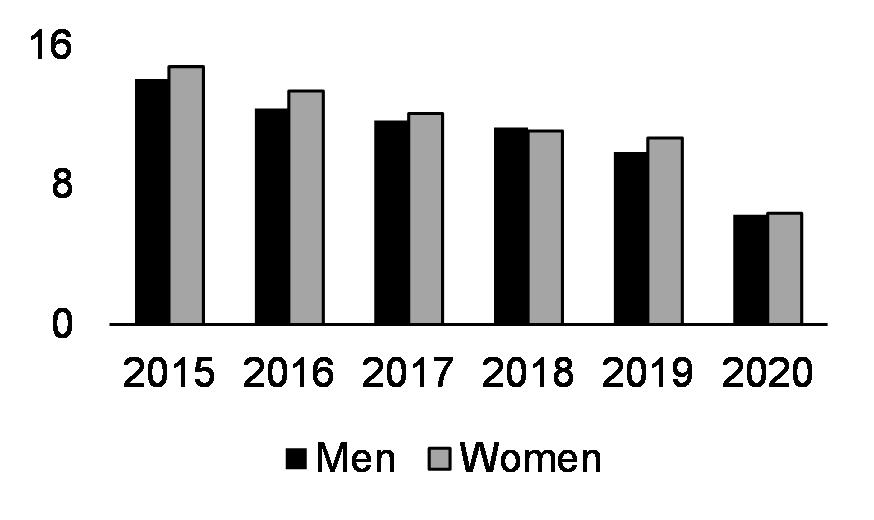
Intimate partner violence (IPV)
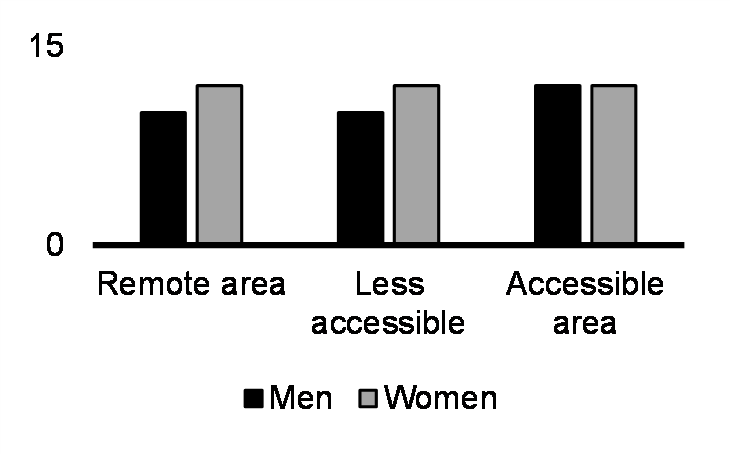
(since age 15, %, 2018)
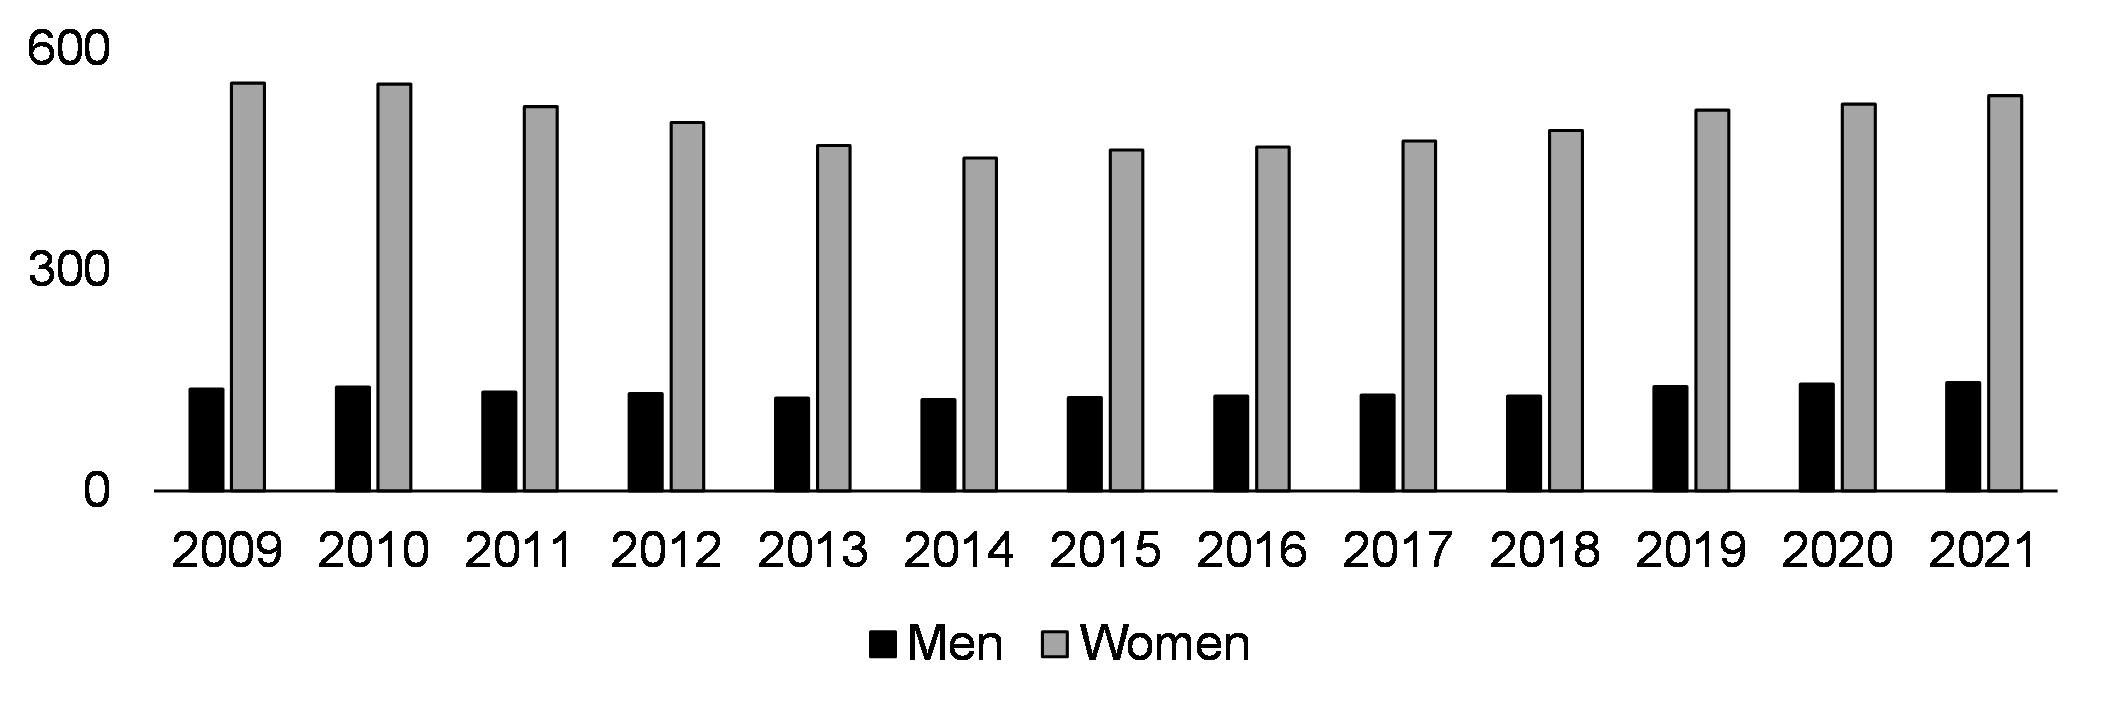
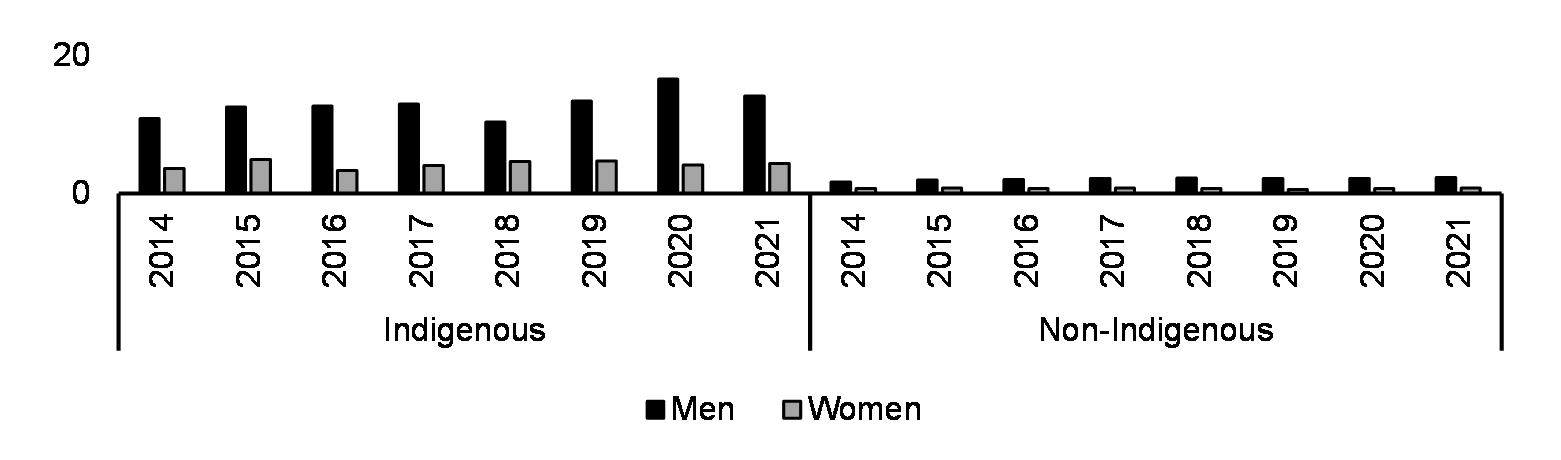
Homicide
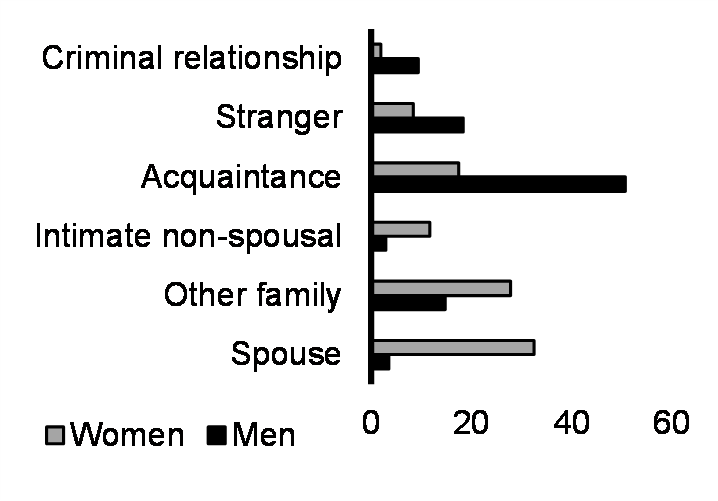
Sources: Sexual Misconduct at Work Survey, Incident-based Uniform Crime Reporting Survey, Survey of Safety in Public and Private Spaces and Remoteness Index, Homicide Survey.
Violence against women increased to record levels during the COVID-19 pandemic. When combined with other factors such as sexual orientation, race, and geography, the statistics are even more staggering. The federal government has taken action to combat this crisis, and work with the provinces is necessary to respond to this cross-jurisdictional issue.
- The rate of police-reported family violence continued to increase year-over-year into 2021. Women and girls were the victims in over two-thirds of family violence reports. Since 2009, police-reported family violence against children and youth has increased by 25 per cent, and against seniors by 37 per cent.
- The pandemic and challenges to social cohesion have also highlighted discrimination in Canada, including an alarming increase in hate crime. The number of police-reported hate crimes rose by 27 per cent in 2021, following an increase of 36 per cent in the previous year.
- Women were slightly more likely (28 per cent) than men (26 per cent) to report childhood victimization in 2018. Physical abuse was more common than sexual abuse, but women were also more likely than men to report sexual abuse (12 per cent vs. four per cent). Childhood victimization was more commonly reported among Indigenous people, older adults, and 2SLGBTQI+ people.
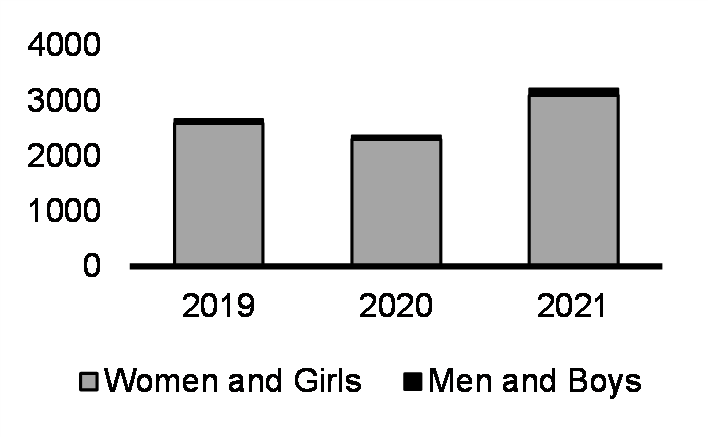
- Intimate partner violence in Canada increased for seven consecutive years leading up to 2021. The observed increases in intimate partner violence over the past decade have been largely driven by an increase in reported cases against men and boys, but 79 per cent of victims identified as women and girls, and the rate of intimate partner violence against women steadily increased between 2014 and 2021.
- In 2021, 586 victims of homicide were men or boys, compared with 197 women or girls (75 per cent and 25 per cent respectively). The proportion of women killed by their spouse or partner was about seven times greater than for men, and three in four of the victims of spousal or intimate partner homicides were women.
- Indigenous people and Black people are overrepresented in the criminal justice system. Indigenous people represent 27 per cent of federal inmates, but only comprise five per cent of the Canadian population, and Black Canadians account for nine per cent of federal offenders but comprise four per cent of the Canadian population.
In tackling gender-based violence, government investments will help to ensure that the federal prison and justice system do not perpetuate systemic inequalities for marginalized groups.
Actions to Support Gender-Based Violence and Access to Justice
- On November 9, 2022, Federal, Provincial, and Territorial Ministers Responsible for the Status of Women endorsed the National Action Plan to End Gender-Based Violence,which will help address the social and economic factors that contribute to gender-based violence.
- As part of the reforms to Canada’s pardon process, the Parole Board of Canada reduced record suspension application fees by over 90 per cent, which contributed to a 20 per cent increase in applications. A record suspension helps remove the stigma of a criminal record for people who have served their sentence.
- In support of work to address systemic racism in public safety institutions, the Royal Canadian Mounted Police launched the RCMP-Indigenous Collaboration, Co-development and Accountability office in May 2021 to co-develop policing solutions with Indigenous communities.
- Federal funding for criminal legal aid promotes access to a fair justice process. In 2020-21, over 183,000 Canadians accessed criminal legal aid, of which 79 per cent were men.
- Additional funding to enhance the capacity of the Office of the Correctional Investigator to review inmate complaints and perform in-depth investigations of systemic issues in federal prisons.
- Establishment of an Independent Commission to review potential wrongful convictions. The commission will aim to reduce barriers for Indigenous Peoples, Black persons, and other marginalized communities that are overrepresented in the criminal justice system.
- Advancing the establishment of a restorative engagement program in the public service. Once established, employees will have the opportunity to share their personal accounts and lived experiences of harassment, discrimination and violence in a safe, confidential space.
* Please refer to the Impacts Report to see other Budget 2023 investments that are expected to advance this pillar.

Gender Results Framework
Pillar: Poverty Reduction, Health, and Well-Being
Goal: Reduced poverty and improved health outcomes
Freedom from poverty entails access to basic services and social protection measures that enable all Canadians to have a good quality of life.
Official poverty rate (%)
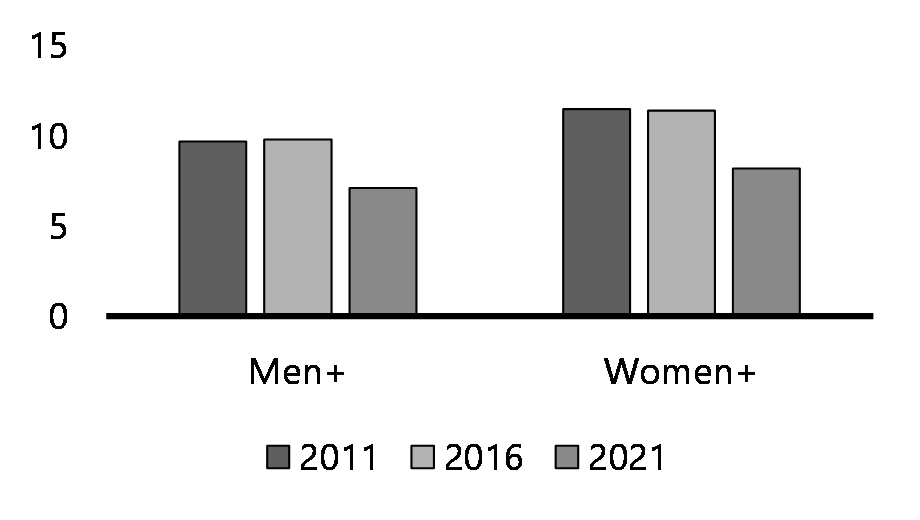
Core housing need (%, 2011, 2016 and 2021)*
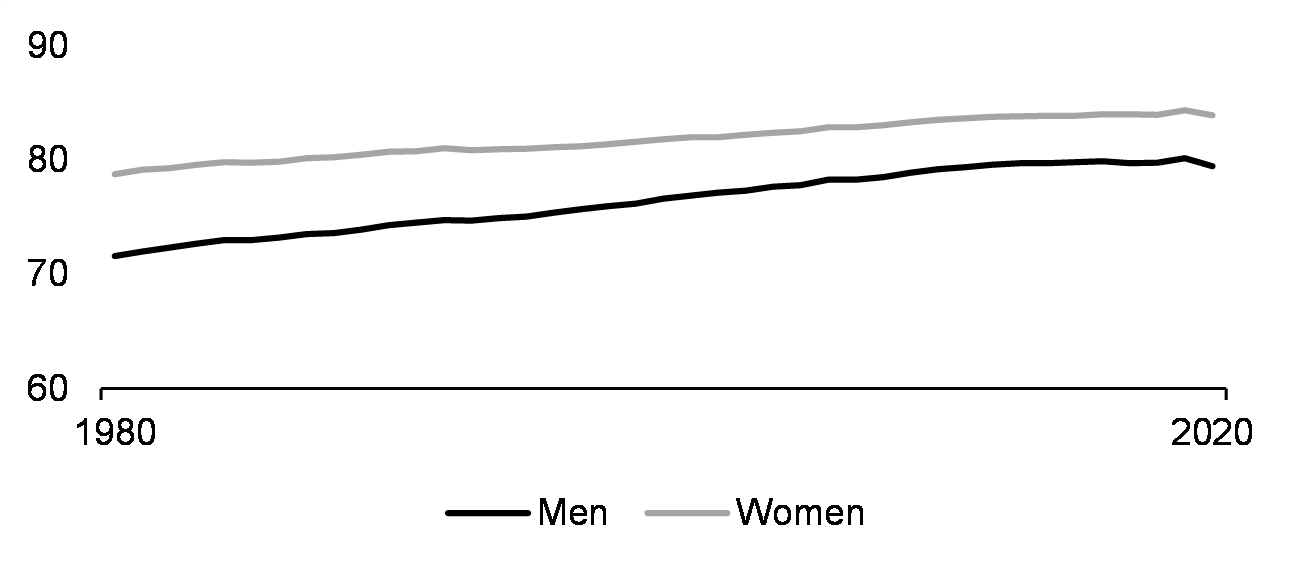
Life expectancy at birth, based on single year estimates (yrs, 1980-2020)
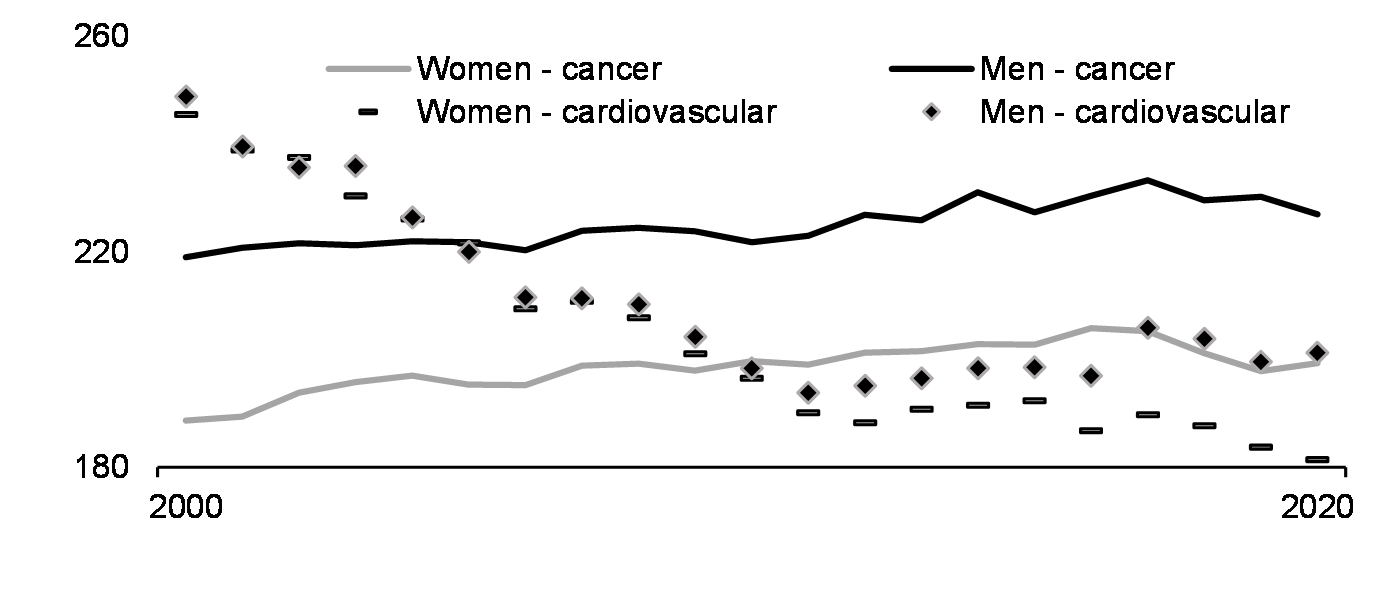
Age-specific mortality rate, by gender, for cardiovascular disease and cancers (per 100,000, 2000-2020)
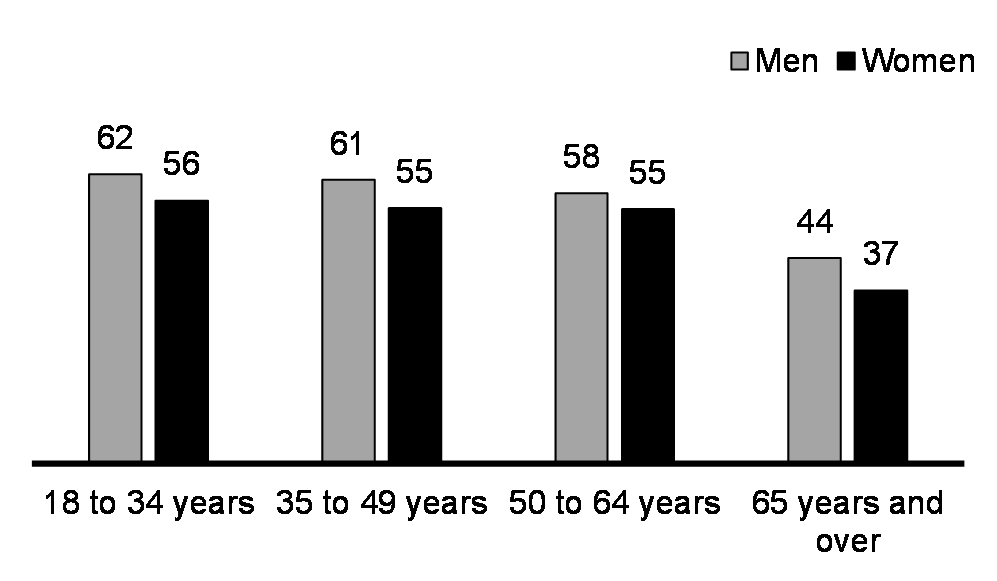
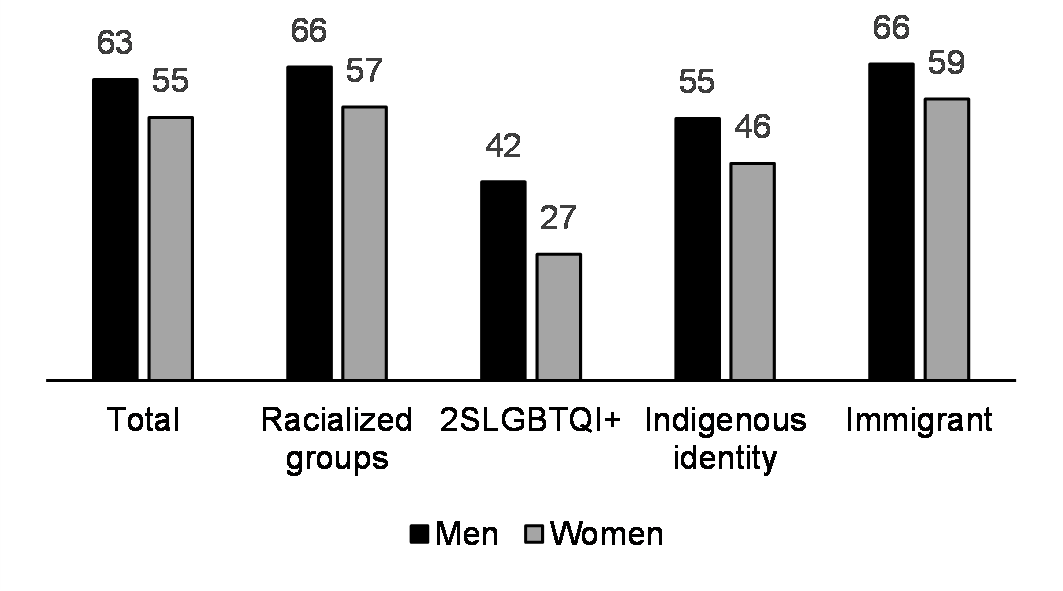
Percentage of adults meeting physical activity guidelines (%, 2021)
Self-perceived mental health: excellent or very good (12+ yrs, %, 2021)
Sexually active and not using
contraception (15-49 yrs, %, 2015-16)
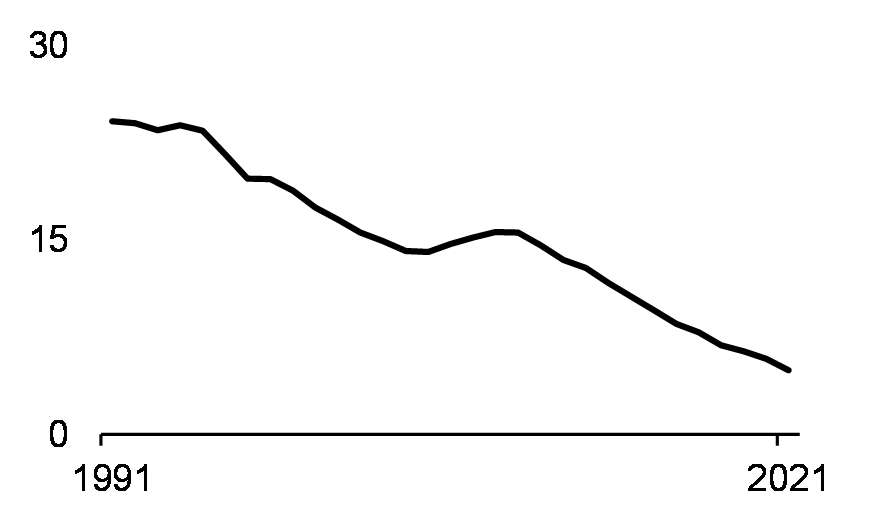
Early motherhood: live births (rate per 1,000, women aged 15-19 yrs)
Note: * Given that the non-binary population is small, data aggregation to a two-category gender variable is sometimes necessary to protect the confidentiality of responses provided. In these cases, people in the category “non-binary persons” are distributed into the other two gender categories and are denoted by the “+” symbol.
Sources: Canadian Income Survey, Census of Population, Canadian Community Health Survey, Vital Statistics Death Database, General Social Survey, Vital Statistics Birth Database.
The opioid crisis and elevated mental health stressors continue to pose challenges for Canadians, alongside important gaps in access to safe and affordable housing.
- The poverty rate for children in 2020 was less than half the 2015 level, in large part due to the introduction of the Canada Child Benefit. Some populations remain more vulnerable than others, however: almost one-third of one-parent families with young children (aged zero to five) live in poverty, as do over one in ten Indigenous people.
- Almost half (44 per cent) of Canadians felt very concerned over their ability to afford housing or rent in 2022. One-parent households were particularly affected by housing issues, with almost one in five in core housing need in 2021. Women were slightly more likely to be in core housing need than men, and more than one in eight Indigenous people were in core housing need in the same year.
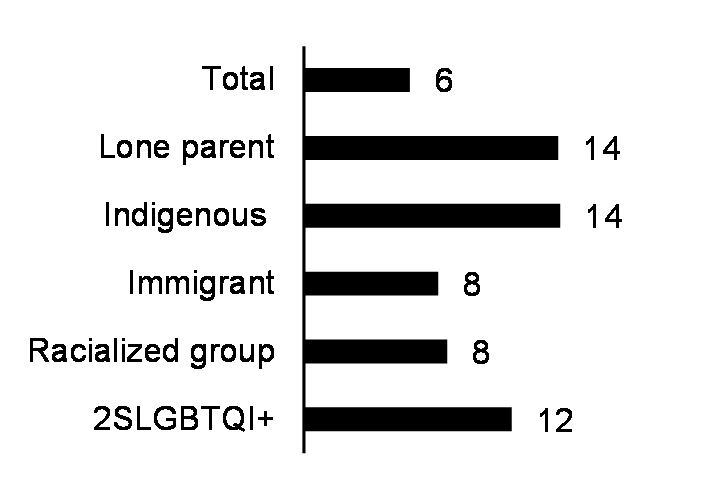
- Financial disparities have a major impact on food security. In 2022, Canadians in the bottom household income quintile were three times more likely than those in the highest income quintile to report feeling very concerned about food price increases. Other population groups particularly affected include lone parents (14 per cent), Indigenous people (14 per cent), and 2SLGBTQI+ people (12 per cent), who reported more concern than the national average of six per cent.
- Canadians are grappling with the lingering physical health effects of the pandemic, but the prevalence of mental health disorders remains a challenge. One in four (25 per cent) adults screened positive for symptoms of depression, anxiety, or post-traumatic stress disorder, up from 21 per cent in fall 2020, with greater increases in prevalence among youth and young adults. In 2021, women reported lower self-perceived mental health across all population groups, but self-perceived mental health was particularly low among 2SLGBTQI+ women and Indigenous women.
- The overdose crisis continues to have a devastating impact. There were over 3,200 opioid overdose deaths in the first half of 2022 alone (January to June), equivalent to approximately 20 per day. 76 per cent of those who died were men, and the majority of deaths occurred in British Columbia, Alberta, and Ontario.
Recognizing that poverty is multidimensional, the government will continue to make investments in a range of core priorities over the medium term, including further funding for combatting the overdose crisis through evidence-based health interventions.
Actions to Support Poverty Reduction, Health, and Well-Being
- In November 2022, the third round of the Rapid Housing Initiative was launched, to support the creation of at least 4,500 more affordable housing units for Canadians in severe housing need across the country, with 25 per cent of investments going towards women-focused housing projects.
- Since 2017, the government has committed funding to directly address the opioid crisis and problematic substance use to help save lives, by supporting increased access to evidence-based treatment and prescriber-led safer supply projects, increasing access to naloxone, and authorizing supervised consumption sites.
- To date, over 240,000 children under 12 have received the Canada Dental Benefit, helping ensure they can access the dental care they need.
- The government launched the Disability Inclusion Action Plan—a comprehensive, whole-of-government approach to improving the quality of life for persons with disabilities. This plan includes measures to support persons with disabilities by fostering financial security, employment opportunities, and accessible and inclusive communities.
- As of February 3, 2023, the government has lifted 138 long-term drinking water advisories since November 2015, and is actively working to address the remaining 32 to ensure First Nations communities have reliable access to safe drinking water.
- The new federal health plan will improve health care for Canadians through new funding to provinces and territories to strengthen the public health care system and deliver results for Canadians.
- The plan also announced an Indigenous Health Equity Fund to support Indigenous health priorities,to provide health benefits coverage and increase access to health care services to improve the immediate and future health and well-being of Indigenous Peoples.
- Funding to continue to combat the overdose crisis through evidence-based health interventions and further action to tackle drug trafficking.
- The new Canadian Dental Care Plan will help improve the oral health of Canadians by providing dental coverage for uninsured Canadians with family incomes of less than $90,000 annually, with no co-pays for those with family incomes under $70,000.
- Supporting the implementation of 988, a three-digit suicide prevention line that Canadians can call or text for immediate suicide prevention intervention and mental health crisis support.
* Please refer to the Impacts Report to see other Budget 2023 investments that are expected to advance this pillar.

Gender Results Framework
Pillar: Gender Equality Around the World
Goal: Promoting gender equality to build a more peaceful, inclusive,
rules-based, and prosperous world
Canada is a leader and champion for gender equality, and will continue to advance efforts that empower women, girls, and gender-diverse people both domestically and abroad.
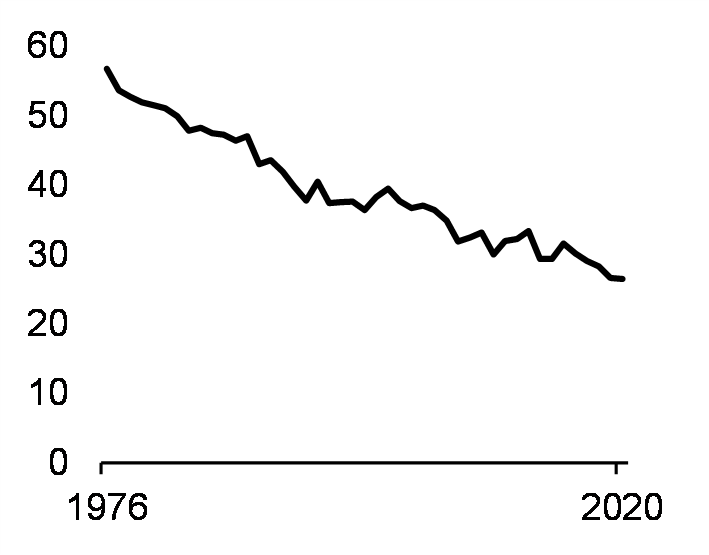
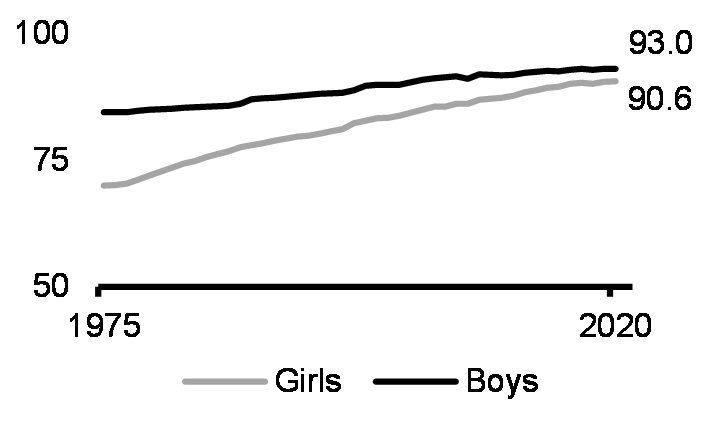
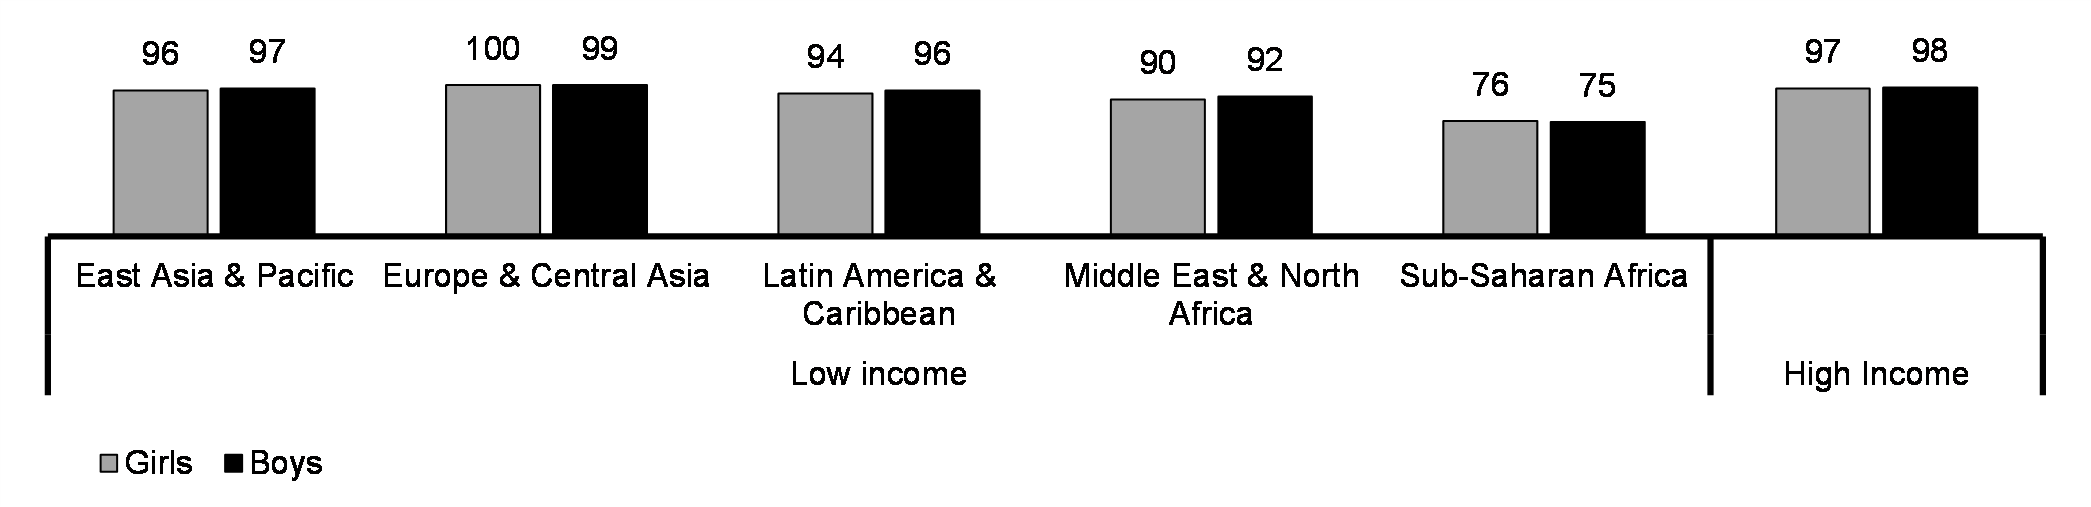
Education and skills
(15-24 yrs, %, 1975-2020)
Economic participation and prosperity
Leadership and democratic participation
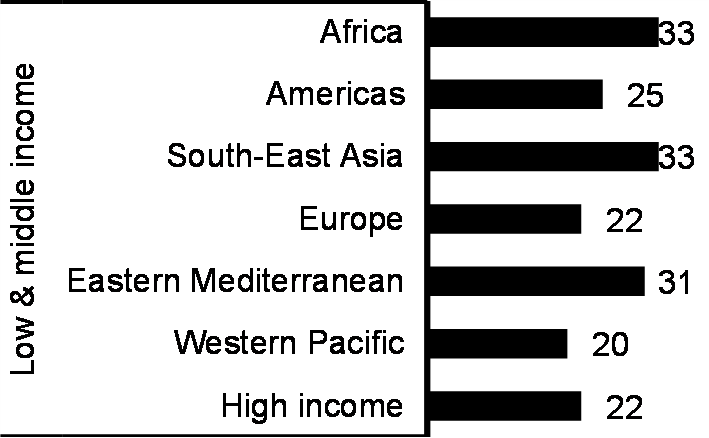
Prevalence of intimate partner violence (15-49 yrs, %, 2018)
Number of reported cases of conflict-related sexual violence (2019-2021)
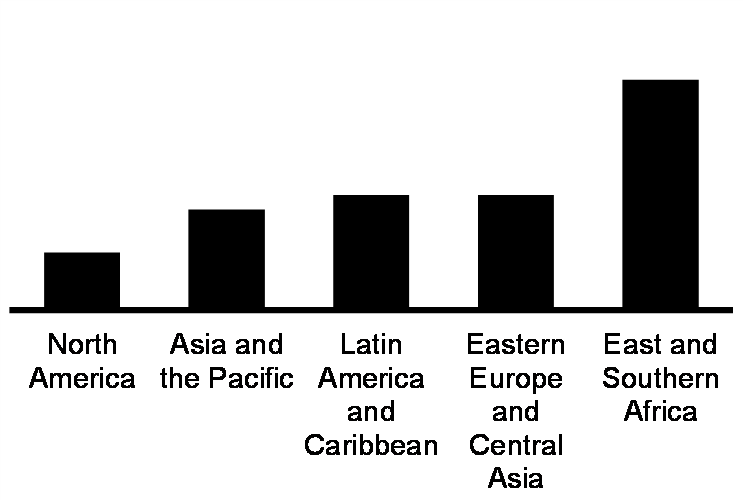
Women with unmet needs for family planning
(15-49 yrs, %, 2022)
Note: *In the areas of Economic Prosperity, Education, Health, and Political Leadership.
Sources: World Bank, Women, Business and the Law (World Bank), World Economic Forum, United Nations (UN) Department of Peacekeeping Operations, UN, World Health Organization, UN Development Fund, UN Population Fund.
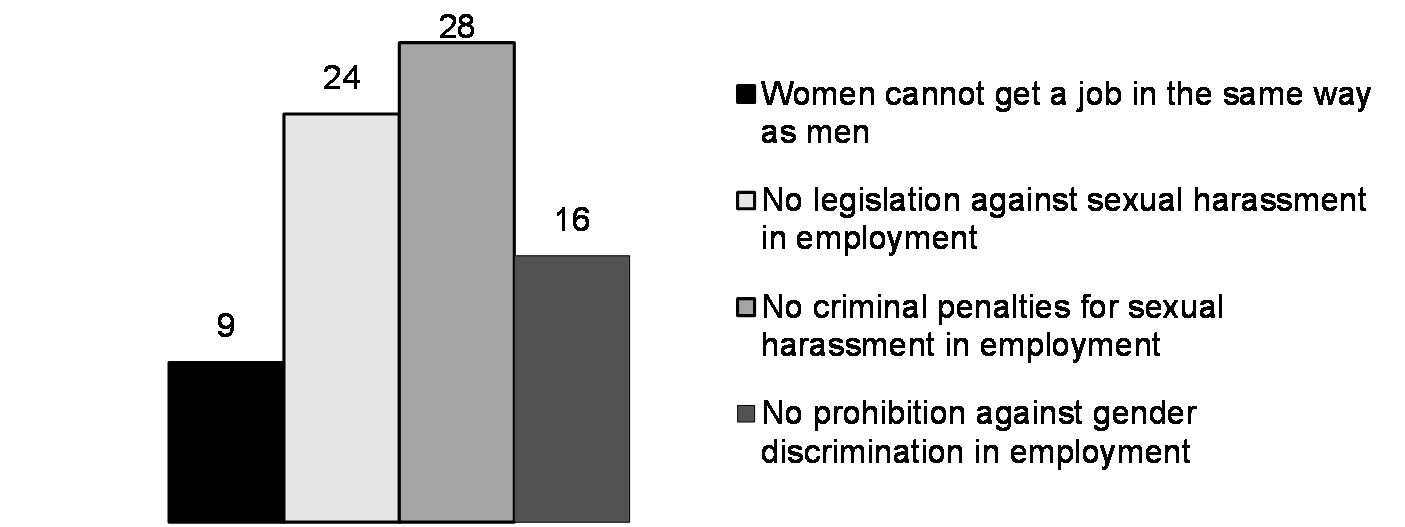
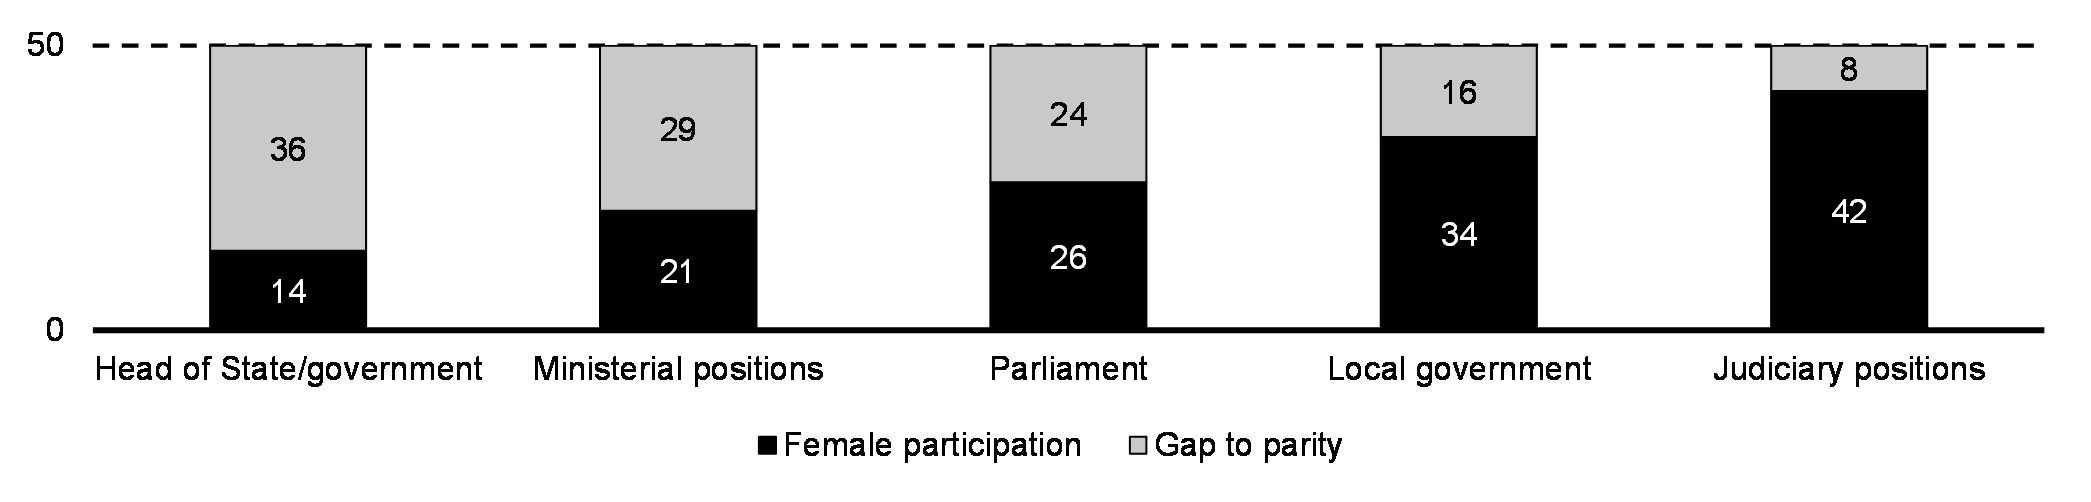
Although international gender equality metrics have improved in key areas such as literacy and access to education, gaps remain in legislation around workplace and sexual rights, and women continue to be underrepresented in political leadership positions worldwide.
- While the global literacy rate now stands at 87 per cent and has increased remarkably in the last two centuries, strong regional inequalities remain and, in some regions, literacy rates have fallen in recent years due to the disruptions caused by conflict. In countries affected by crisis and conflict, women’s literacy rates are far behind those of men, as girls are all too often the first ones pulled out of school.
- Women continue to face constraints on their ability to acquire or maintain employment. In many countries, there is a lack of legislation and criminal penalties for sexual harassment in the workplace, as well as unaddressed inequalities in job prospects between women and men.
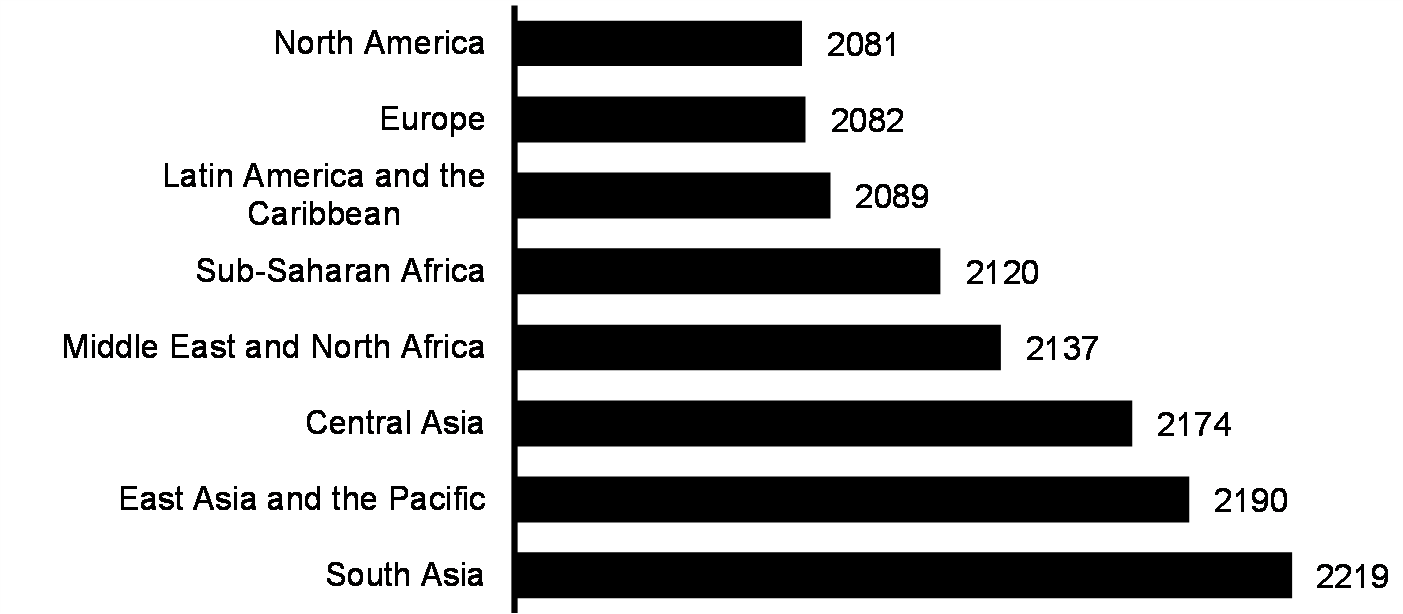
- According to the World Health Organization, globally one in three women experience physical and/or sexual violence in their lifetime, mostly by an intimate partner. Intimate partner violence is most prevalent in low-income regions within Africa and South-East Asia. Lower levels of education are a major risk factor for both perpetrating and experiencing intimate partner violence. Regions where women face barriers to securing paid employment and where there is less gender equality are more likely to have higher rates of intimate partner violence.
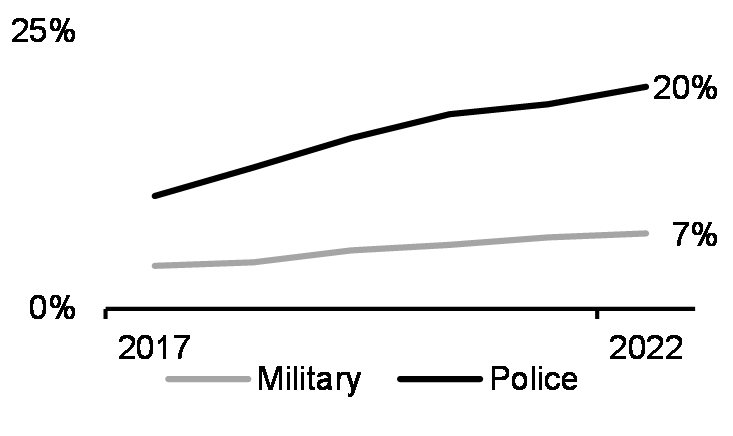
- Women and girls are disproportionately targeted as victims of sexual violence in conflict settings, especially women peacebuilders and human rights defenders according to the United Nations.
- In regions with stronger protections of a woman’s right to reproductive health care, women are more likely to have improved agency over the decision to have more children or not, although work still remains to ensure all women can exercise their reproductive rights.
In recognition of the effects of war on vulnerable groups such as women and girls, Canada’s support to Ukraine will ensure that humanitarian assistance reaches those who need it most and build on efforts in 2022-23 to strengthen accountability for conflict-related sexual violence. Other commitments will also reinforce sexual and reproductive health and rights for women and girls.
Actions to Support Gender Equality Around the World
- Canada has committed over $5.4 billion in economic, military, humanitarian, and other support to Ukraine since February 2022, which has helped address food insecurity and provided emergency health and other governmental services for vulnerable populations affected by war.
- Resources announced in Budget 2022 contributed to Canada’s $1.21 billion commitment to support the Global Fund to fight HIV/AIDS, Tuberculosis and Malaria, which promotes sexual and reproductive health and rights and enhances equitable access to health services.
- Canada provided $100 million over five years, starting in 2021-22, toward care work. This contribution will address unpaid and paid care work in low- and middle-income countries to support a more equal distribution of care responsibilities.
- In 2021-22, 99 per cent of Canada’s bilateral international development assistance either directly targeted or integrated gender equality results, exceeding the 95 per cent target set in the Feminist International Assistance Policy.
- Canada will continue to support the Ukrainian people to defend their territorial integrity and provide economic, humanitarian, development, and security and stabilization assistance to support the resilience of Ukrainian government and civil society organizations, including by providing Ukraine with additional financial assistance for 2023.
- Under the Thrive Agenda, Canada committed and is on track to raise its global health funding to reach $1.4 billion each year, starting in 2023, of which $700 million will be dedicated to sexual and reproductive health and rights.
* Please refer to the Impacts Report to see other Budget 2023 investments that are expected to advance this pillar.
Summary of Budget 2023’s Gender and Diversity Impacts
Gender-based Analysis Plus (GBA Plus) ensures that the federal government considers Canada’s diversity in the policy-making process, understands who is impacted by its policies, and mitigates unintended consequences that perpetuate existing inequities. This section provides an aggregated picture of the analysis presented in the Impacts Report for the new measures in this budget.
Timing of GBA Plus
Timing of GBA Plus
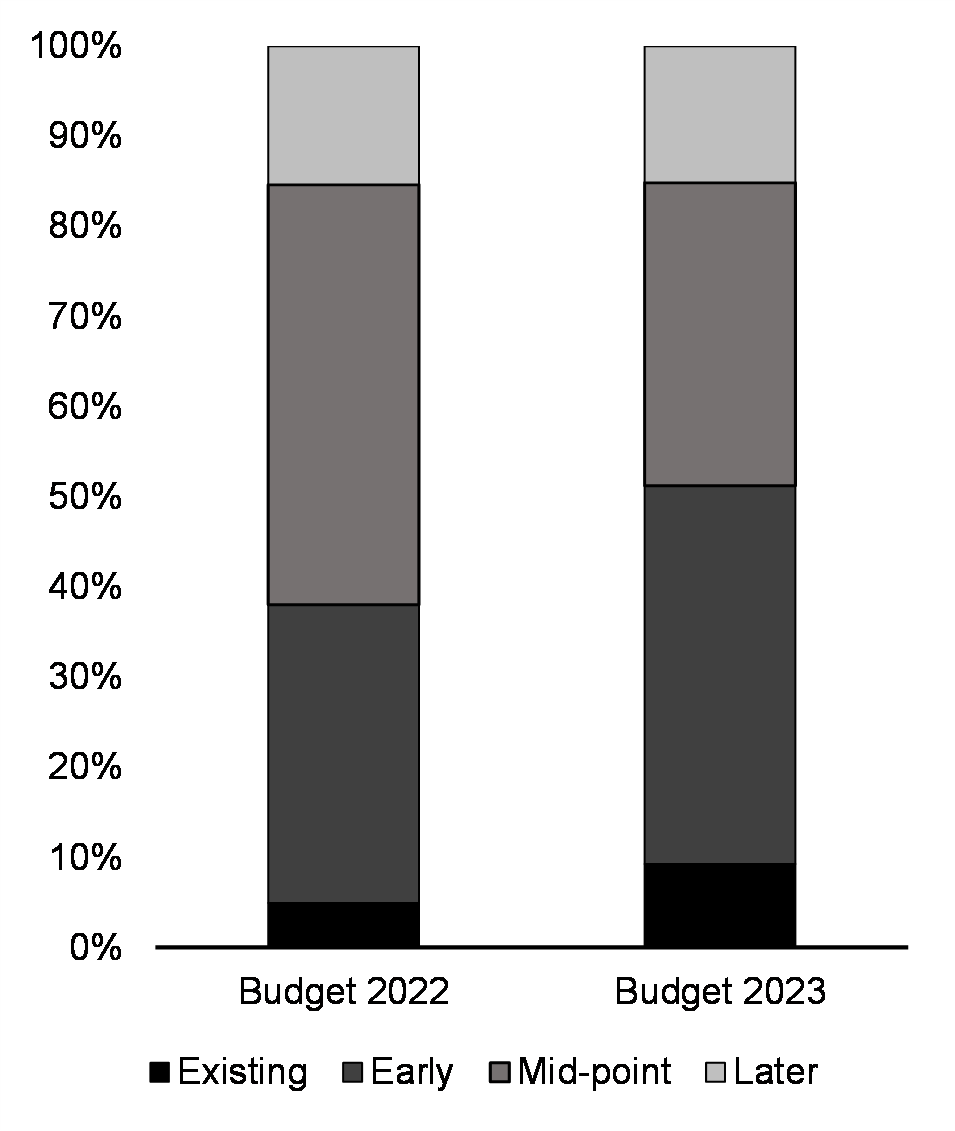
In Budget 2023, close to 40 per cent of measures included GBA Plus analysis at an early stage compared to only 25 per cent of measures in 2019. This result reflects an increasing awareness of GBA Plus and the availability of disaggregated data, which have supported efforts to embed GBA Plus as a whole-of-government approach, with analysis well integrated in the policy development process. In this regard, Women and Gender Equality Canada (WAGE) has been an integral partner in establishing GBA Plus as a key tool for gender budgeting in Canada. For Budget 2023, the scope of these supports has included working with departments and agencies advancing key priorities. This is to ensure that initiatives consider equality, fairness, and inclusion in their design and leverage data to better track the impact of such initiatives over time. These collaborative efforts will continue to strengthen GBA Plus across all aspects of government policy development and decision-making processes, consistent with the recommendations of the Auditor General of Canada in 2022.
There is an increase in the number of measures that rely on existing GBA Plus analysis in Budget 2023—this is partially attributable to the extension of existing government programs. In some instances, existing analysis was also strengthened through the inclusion of new data, such as more recent numbers on the take-up of Canada Student Grants, and inland asylum applications.
Overall, the number of budget measures that consider GBA Plus at a later stage remains relatively unchanged from previously reported trends. The federal government remains committed to embedding GBA Plus at all stages of the policy-making process.
GBA Plus Responsive Approaches
Responsive Approaches
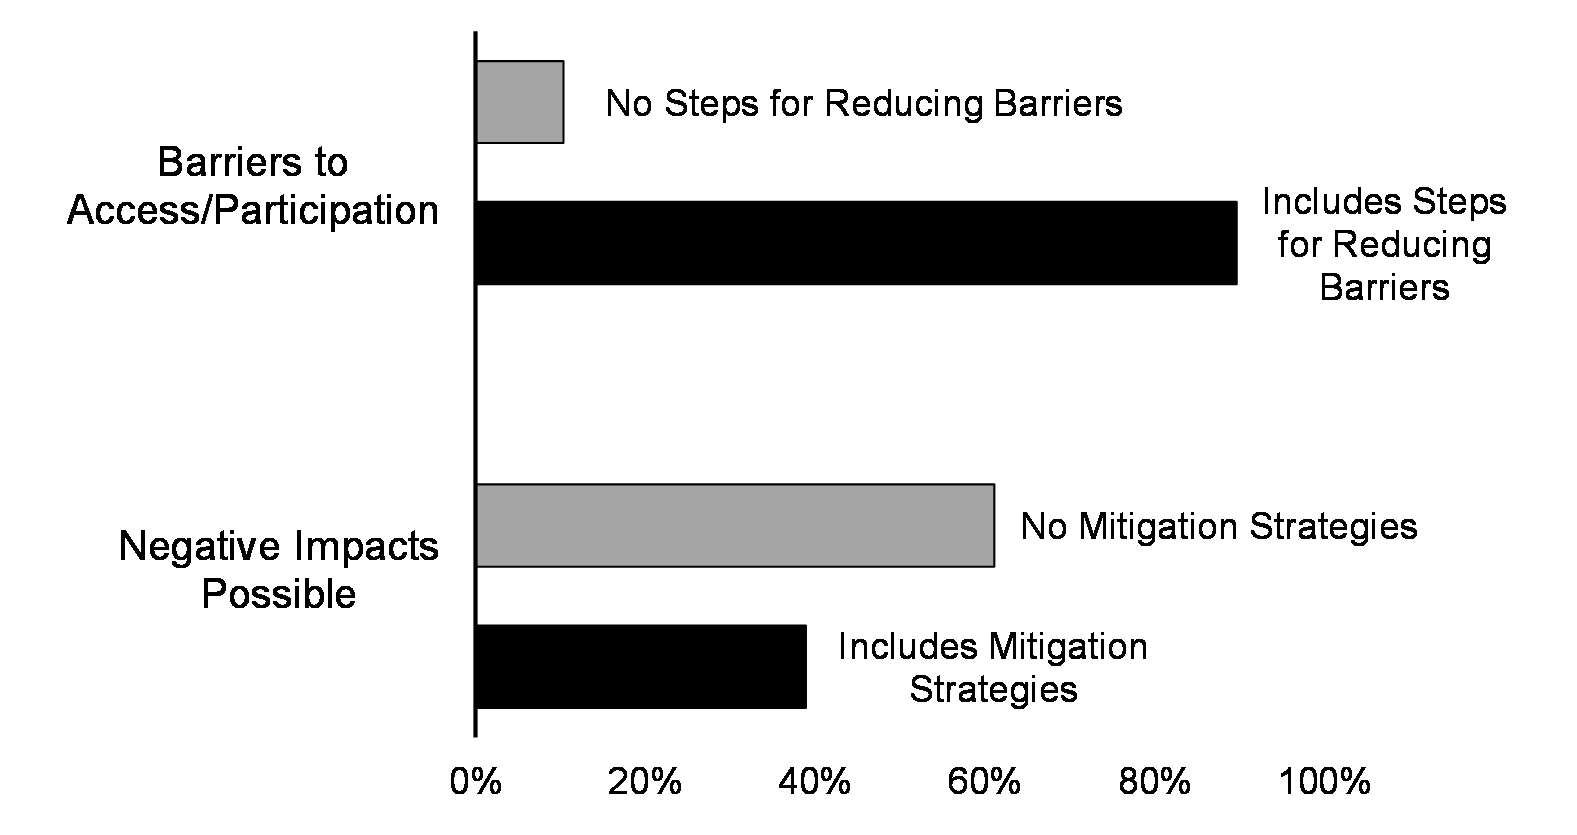
In Budget 2023, 14 per cent of measures identified a potential barrier to access or participation for a specific demographic group. Barriers were more pronounced for some groups, particularly Indigenous people, (especially Indigenous women), and persons with disabilities. Geography, especially for those in remote areas, can also function as a barrier to participation. For most measures (90 per cent) where a barrier was identified, a proposed approach to removing obstacles for groups experiencing these barriers was included.
In proposals related to natural resources and the environment, there were explicit efforts to remove barriers for Indigenous business owners—as an example, Canada’s Forest Economy will enhance outreach activities and capacity building to support Indigenous participation in forest sector activities, given that over 70 per cent of Indigenous communities are in forested areas. Similarly, the Whales Initiatives will seek to minimize disruption to Indigenous commercial and recreational fisheries due to fishing closures that protect whale habitat. To address the negative impacts that project development in natural resource sectors can have for Indigenous people, as more workers move closer to these communities, initiatives such as the Fish and Fish Habitat Protection Program will provide support to Indigenous communities to engage in consultations on project decisions.
In support of efforts to increase Indigenous and women’s economic engagement and sectoral representation, the Vessel Remediation Fund, to be created and funded through proposed amendments to the Wrecked, Abandoned or Hazardous Vessels Act, will include equity, diversity, and inclusion factors in the evaluation criteria to select firms to undertake remediation or removal of problem vessels.
Beyond economic participation, Indigenous women and girls face other inequalities, especially gender-based violence, which they disproportionately experience compared to other non-Indigenous women. The federal government is making investments to reduce violence through the Federal Pathway to Address Missing and Murdered Indigenous Women, Girls, and 2SLGBTQQIA+ People. The experiences of Indigenous women continue to be a priority in the government’s work to end gender-based violence.
Considerations are also given to the diversity of the language profiles in the Canadian population. In this regard, measures such the Census of Population, Census of Agriculture and Implementing the 988 Suicide Prevention Line have explicit responsive approaches that expand language availability beyond English and French. Digital divides also function as significant barriers for those groups with low levels of digital literacy and poor access to the internet, and those with disabilities. In response, the government balances its need to modernize and expand its services, while ensuring that accessibility accommodations are made for all groups facing barriers. As an example, the Citizenship Act Modernization recognizes that not all applicants are able to submit applications electronically, so options to submit paper-based applications would still be maintained.
Target Population
Share of Budget Investments by Target Population
($ value of measures*)
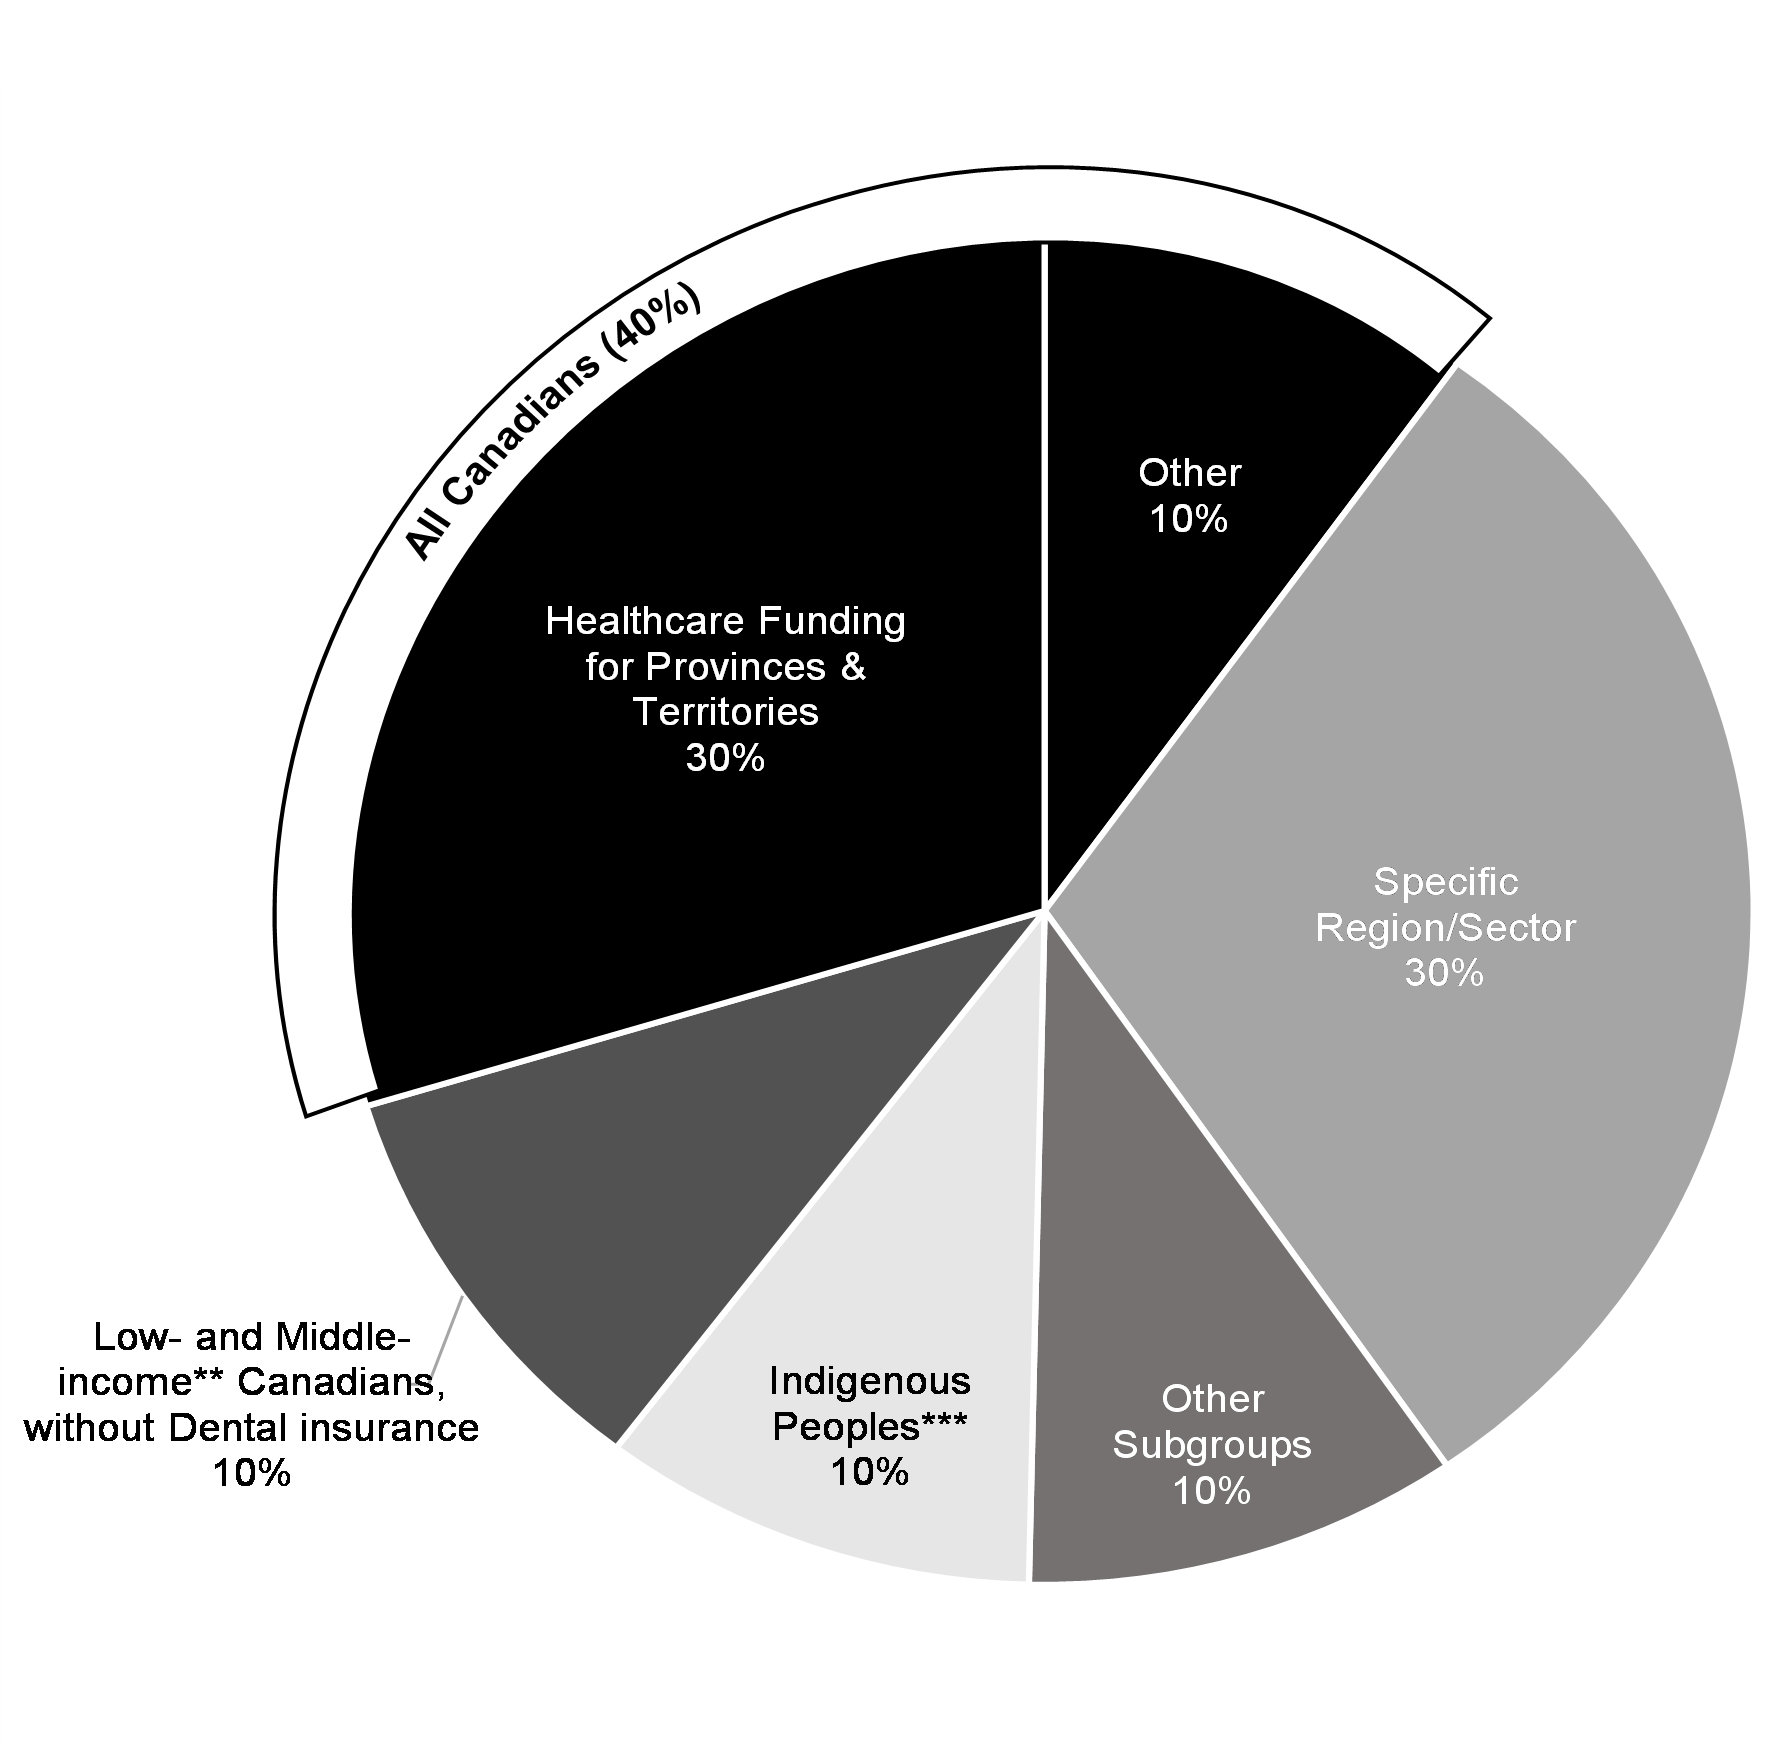
Targeted investments support equity, by taking into account the needs of specific populations. While a sizable share of Budget 2023 investments (40 per cent) target all Canadians, several investments focus on specific regions and sectors, or specific populations, such as Indigenous people, Black and racialized people, and persons with disabilities. People that are most likely to experience inequities accessing oral health care will benefit in particular from the Canadian Dental Care Plan and the Oral Health Access Fund. These populations include lower-income people, people living in rural and remote areas, seniors, and persons with disabilities.
Budgetary investments in specific sectors or regions (30 per cent) include Investment Tax Credits for Clean Energy, Clean Technology Manufacturing, Clean Hydrogen and Carbon Capture, Utilization, and Storage to support Canada’s commitment to achieve net-zero emissions by 2050. To contribute to a cleaner and healthier environment, investments such as the Renewal of the Fisheries and Aquaculture Clean Technology Adoption Program help fisheries, aquaculture, and seafood processors to adopt clean technology in order to reduce their environmental impacts and develop more sustainable business practices.
Given the vulnerability of oceans to climate change, the Marine Spatial Planning Program will benefit the marine sector and coastal communities, where 6.5 million people or 17.5 per cent of the Canadian population live, by providing clarity over where and when sustainable marine economic activities (e.g. marine shipping, renewable energy production, etc.) can take place. All Canadians benefit from investments in the clean economy and environmental protection, especially those most vulnerable to climate change including women, Indigenous people, and people in rural and coastal communities.
Overall investments that target Indigenous people account for ten per cent of Budget 2023. This includes a significant new investment to implement a co-developed and Indigenous-led Urban, Rural, and Northern Indigenous Housing Strategy that will support communities experiencing elevated incidences of core housing need.
Black and racialized people will also benefit from budget investments. The Action Plan for Black Employees in the Public Service will provide targeted supports for Black federal public servants who have disproportionately experienced harassment, racism, and discrimination in the workplace. Investments in the Anti-Racism Strategy will also benefit Black and racialized people.
Expected Benefits: Gender
Share of Budget Investments by Gender
($ value of measures*)
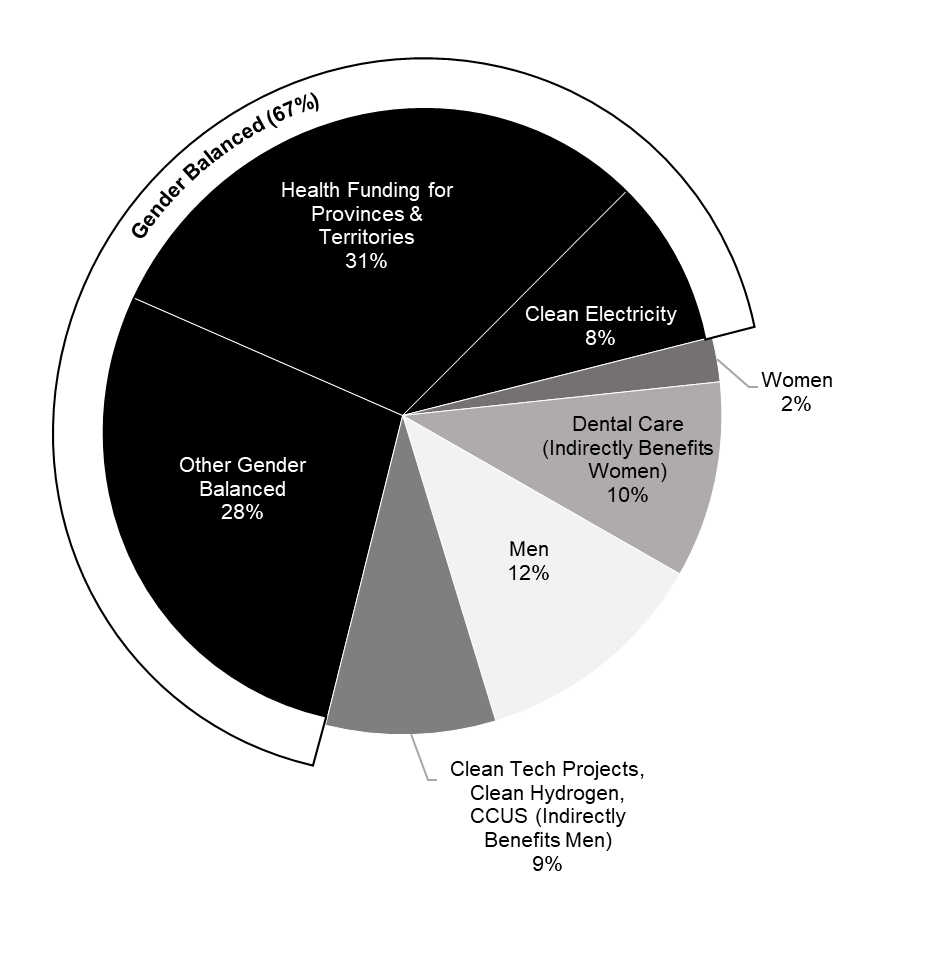
A significant share of measures (67 per cent) in Budget 2023 are “gender balanced”—that is, they are not expected to disproportionately benefit either men or women. For instance, all Canadians, regardless of gender, would benefit from improvements in the health care system resulting from health transfers to provinces and territories. Health care workers, who are disproportionately women, will especially benefit.
Investments in health care also tend to benefit women as a result of their greater likelihood of taking on informal caregiver roles, when health and social services fail. Women, who are already paid less on average due to the gender pay gap, feel the pinch from inflation more, making programs like $10-a-day child care all the more important.
Women are often the ones to take on additional household labour to make things work in their families. For example, in 2022, women were significantly more likely than men to provide care for a child or care-dependent adult (52 per cent vs 42 per cent).
A significant share of Budget 2023 measures (about 19 per cent) are expected to primarily have benefits that skew towards men, while 12 per cent of investments will primarily benefit women. This relative difference is reflective of gender imbalances in key sectors of focus in this budget, notably the areas supporting the transition to clean growth and construction, which are currently dominated by men. The federal government is working to increase gender balance in these sectors. For example, since 2018, federal investments in apprenticeship training have promoted inclusion of and accessibility for women (as well as persons with disabilities, Black and racialized people, and Indigenous people). Further examples of targeted interventions are highlighted in the section on responsive approaches and individual measures are discussed in detail in the Impacts Report.
Moreover, these investments —in building a clean economy for the 21st century— will ultimately create economic opportunities and improved quality of life that benefit all Canadians, including women. Economic opportunity is key to women’s prosperity, especially their ability to find safety from intimate partner violence. Women are also especially vulnerable to climate change and will particularly benefit from a clean economy.
The share of Budget 2023 measures that skew towards benefitting men is also a function of gender representation in the areas targeted for additional support. For example, the Substance Use and the Overdose Crisis measure will directly benefit men, as data show that men, and disproportionately Indigenous men, are most impacted by substance use-related harms and opioid-related deaths. These measures will also indirectly improve the lives of women. For example, substance abuse can play a role in intimate partner violence. In addition, women represent a significant portion of the health care workforce, which delivers substance use programs and services. Similarly, men are overrepresented in the criminal justice system (over 95 per cent), with higher incidence of incarceration for Black and Indigenous people, who are therefore expected to benefit from the Creation of a Miscarriage of Justice Review Commission. Men of working age, with less education, including those who are racialized, are also more likely to engage in precarious work in the gig sector and thus to benefit from job protections in this sector.
In addition to the share of investments that predominantly benefit women in the near to medium term, over the longer term an even greater number of measures have significant scope to directly and indirectly advance gender equality for women. In aggregate, Budget 2023 sustains the government’s approach to investments that support gender equality and reinforces previous investments that continue to reduce gender inequalities. Measures such as corporate governance diversity disclosures will directly benefit designated employment equity groups including women, Indigenous Peoples, persons with disabilities, and Black and racialized people. The introduction of labour protection mechanisms related to workers experiencing a pregnancy loss, and improvements in access to abortion and other sexual and reproductive health care, will specifically benefit women and improve their health and well-being over the immediate and longer term.
Expected Benefits: Additional Characteristics
Direct and Indirect Benefits by Subgroup, Number of Measures
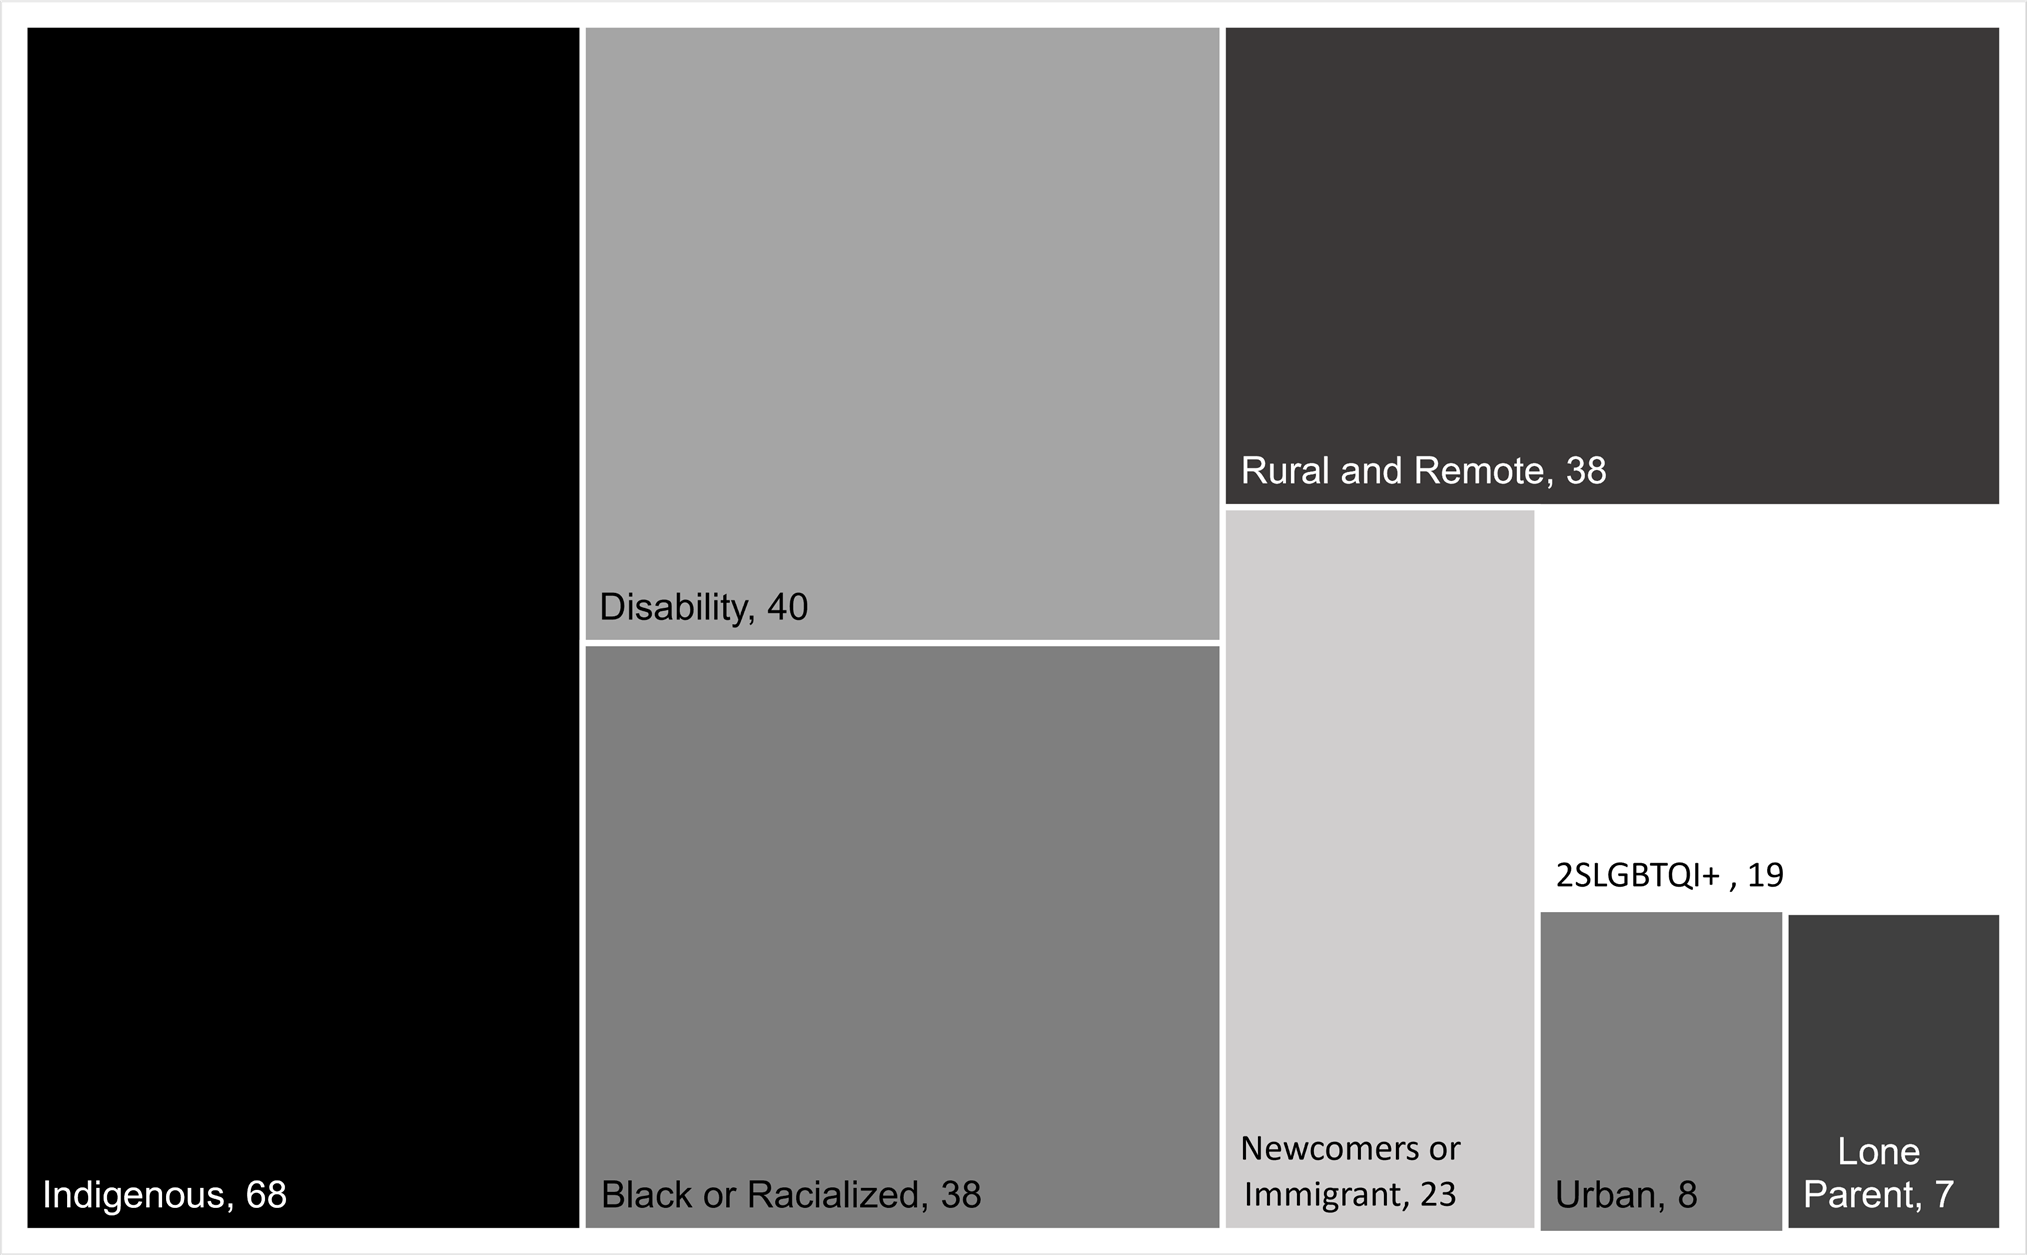
Through an assessment of direct and indirect impacts, a number of Budget 2023 measures will benefit Indigenous people, Black and racialized people, people living in rural and remote areas, and persons with disabilities.
For persons with disabilities, investments such as Extending the Qualifying Family Members Provision for the Registered Disability Savings Plan and Improving Canada Student Grants and Loans will help encourage and enable full participation in the opportunities that can tangibly advance their economic livelihoods.
Households in the North have unequal access to housing compared to the rest of Canadians. To reduce this inequality, particular attention to the vulnerabilities facing Northern communities is highlighted in investments supporting an Urban, Rural, and Northern Indigenous Housing Strategy. In 2021 Census data, while ten per cent of households in Canada were in core housing need, the share of households in core housing need was as high as 32 per cent in Nunavut. Furthermore, Indigenous people were almost three times more likely to live in a dwelling in need of major repairs compared to the non-Indigenous population. In addition to lack of acceptable housing, Northern, Indigenous, and remote communities also face unique challenges when it comes to food security. Through the Local Food Infrastructure Fund Top-Up, the government is helping support community-led efforts to build the infrastructure needed to produce, store, and deliver locally sourced food in a sustainable manner. Furthermore, investments in housing mean Northerners will not have to choose between paying for rent or buying groceries.
Other Indigenous-focused investments that also benefit populations in rural and remote areas include the National Benefits-Sharing Framework, which is aimed at improving the quality and consistency of benefits that Indigenous communities derive from major natural resource projects in their territories. The Canada Infrastructure Bank will also provide loans to Indigenous communities across the country, including rural and remote communities, to support them in purchasing equity stakes in infrastructure projects in which the Bank is also investing, which will provide economic benefits and opportunities for self-determination.
Intergenerational and Income Distribution Impacts
Expected Intergenerational Benefits
Share of Budget 2023 Investments ($ value of measures*)
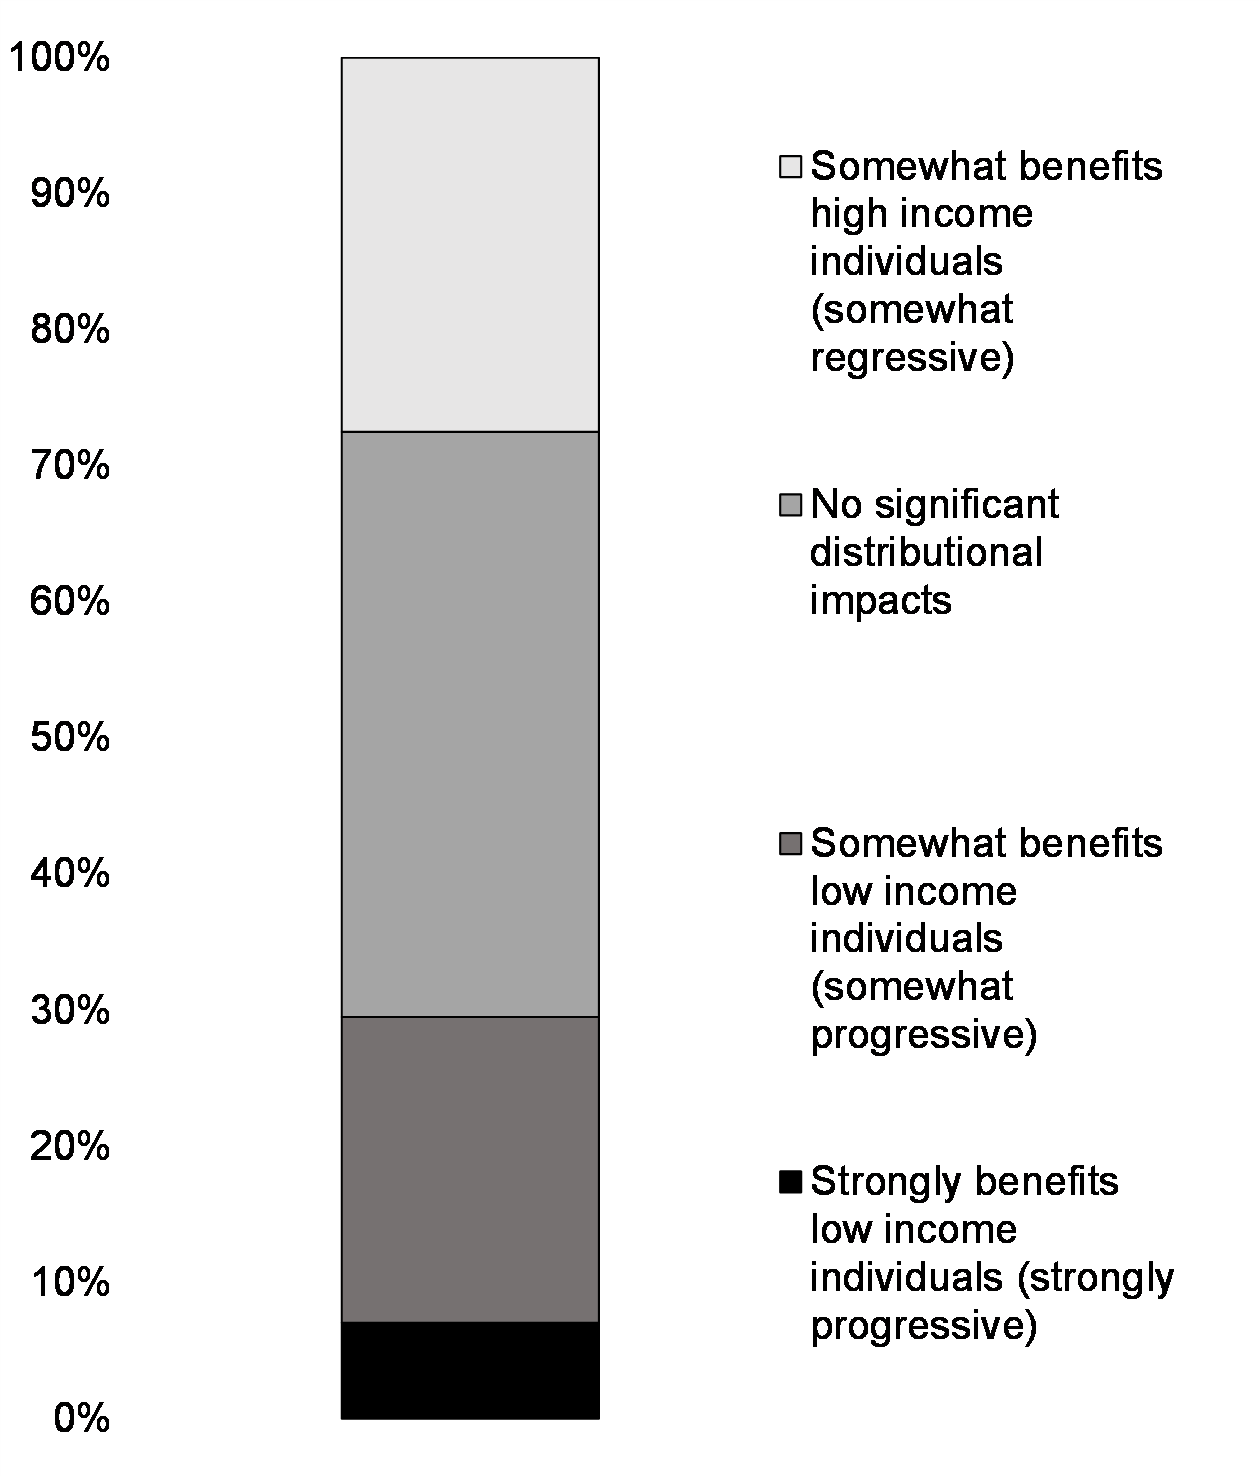
A substantial proportion of the budget measures will benefit lower-income Canadians, and particularly those at risk of extreme vulnerability. The Grocery Rebate will benefit low- and modest-income people and families, with disproportionate positive impacts for single parents, and in particular single mothers. Data shows that single households and single-parent families are more likely to have lower incomes than couples. Another example is amendments to the Criminal Code to lower the criminal rate of interest will allow Canadians who use very high interest loans and payday loans—including low-income Canadians, Indigenous people, recent immigrants, and women—to benefit from a lower cost of borrowing. The remainder of investments are not expected to have significant distributional impacts.
The majority of new Budget 2023 investments will carry benefits across all age categories, reflective of this budget’s focus on transformative investments in a low carbon economy and in health, which are expected to bring long-term and broad-based benefits to all Canadians. Young people and future generations in particular will benefit from action to improve the environment, grow the economy and maintain a sustainable fiscal posture, but these investments will benefit working age Canadians and seniors as well.
Over the longer term, investments in Official Languages and to fight Systemic Racism, Discrimination, and Hate will also help future generations benefit from a society that is diverse and inclusive. For seniors, intersectional factors such as living in a one-person household or having a disability may worsen their vulnerability to health and financial challenges, such that they benefit from affordability measures like the Grocery Rebate that are intended to benefit Canadians of all ages. The new budget measures that are identified as uniquely benefitting seniors are in addition to existing spending decisions, that already benefit seniors. Table A1.7 shows that federal spending on senior benefits is projected to grow by $6.8 billion in 2023-24 relative to 2022-23 levels, none of which is accounted for as “new” budget measures, but all of which represents new spending that will benefit seniors.
Page details
- Date modified: