
Archived - Annex 1:
Details of Economic and Fiscal Projections
On this page:
Economic Projections
The average of private sector forecasts has been used as the basis for economic and fiscal planning since 1994. This helps ensure objectivity and transparency, and introduces an element of independence into the government's economic and fiscal forecast. The economic forecast presented in this section is based on a survey conducted in February 2023. The survey average has been adjusted to incorporate the actual results of the National Accounts for the fourth quarter of 2022 and the historical revisions released on February 28, 2023.
The February survey includes the views of 13 private sector economists:
- BMO Capital Markets,
- Caisse de dépôt et placement du Québec,
- CIBC World Markets,
- The Conference Board of Canada,
- Desjardins,
- IHS Markit,
- Industrial Alliance Insurance and Financial Services Inc.,
- Laurentian Bank Securities,
- National Bank Financial Markets,
- Royal Bank of Canada,
- Scotiabank,
- TD Bank Financial Group, and
- The University of Toronto (Policy and Economic Analysis Program).
Since the survey was conducted in early February, developments in financial markets have raised the odds of a more pronounced slowdown in the global economy. However, outcomes that are better or worse than the survey are both plausible. The macroeconomic inputs of the February 2023 survey continue to provide a reasonable basis for fiscal planning. To facilitate prudent economic and fiscal planning, the Department of Finance has developed two scenarios that consider faster or slower growth tracks relative to the February survey (see below for details).
Private sector economists expect Canada's economy to slow more than was projected in the 2022 Fall Economic Statement (FES 2022) (Table A1.1). Real gross domestic product (GDP) growth is projected to slow from a strong 3.4 per cent in 2022 (slightly better than the 3.2 per cent expected in FES 2022) to 0.3 per cent in 2023, before rebounding to 1.5 per cent in 2024 (previously 0.7 per cent and 1.9 per cent, respectively). Overall, the revisions leave the level of real GDP about 0.6 per cent lower by 2024 compared to FES 2022. Annual real GDP growth is expected to strengthen to about 2 per cent on average for the rest of the forecast horizon, reflecting a return to trend for long-run growth rates.
Comparisons of the February survey average to real GDP growth forecasts from other institutions can be found in Table A1.2.
With the full force of monetary tightening yet to be felt, the survey average points to a shallow recession this year with a peak-to-trough decline in real GDP of 0.4 per cent. This would represent a very mild downturn compared to the peak-to-trough decline of 4.4 per cent in the 2008-09 recession, and even to the 1.6 per cent decline in the downside scenario considered in FES 2022.
Consistent with the expected slowdown in real GDP growth, Canada's unemployment rate is expected to rise from near record-low levels to a peak of 6.3 per cent by the end of 2023. On an annual basis, the unemployment rate is expected to increase from 5.3 per cent in 2022 to a still low 5.8 per cent in 2023 and 6.2 per cent in 2024 before gradually declining to 5.7 per cent by 2026, broadly in line with FES 2022 and reflecting the resilience of the Canadian labour market.
The forecast for short-term interest rates in Canada was revised up by 0.4 percentage points, on average per year, compared to FES 2022. The February survey average for short-term interest rates is consistent with the Bank of Canada's benchmark rate remaining at 4.5 per cent until the fall of this year, before gradually declining to below 3 per cent by the end of 2024.
Consistent with recent trends, private sector economists expect Consumer Price Index (CPI) inflation to fall below 3 per cent in the third quarter of 2023 and to reach about 2 per cent, the Bank of Canada's target, in the second quarter of 2024. On an annual basis, CPI inflation is expected to ease from 6.8 per cent in 2022 to 3.5 per cent in 2023 and to normalize to around 2 per cent over the remainder of the forecast horizon, the same as in FES 2022 and consistent with the average rate of inflation in Canada over the last 30 years.
After surging following Russia's illegal invasion of Ukraine, commodity prices fell sharply in the second half of 2022. The negative impact on GDP inflation (the broadest measure of economy-wide price inflation) in the last two quarters of 2022 was much larger than expected by private sector economists in FES 2022. As a result, GDP inflation was 7.3 per cent in 2022, well below the 8.2 per cent expected in FES 2022.
Commodity prices are also expected to remain lower in future years. The February 2023 survey expects crude oil prices to decline from an average of US$94 per barrel in 2022 to US$81 per barrel in both 2023 and 2024, below the FES 2022 outlook. As a result, GDP inflation is also revised down to 0.6 per cent in 2023, compared to 1.8 per cent in FES 2022. Further ahead, GDP inflation is expected to remain broadly in line with FES 2022. The federal government is closely monitoring current fluctuations in the price of oil.
Together, the downward revisions to GDP inflation and, to a lesser extent, real GDP have weighed considerably on nominal GDP projections. On an annual basis, nominal GDP increased by 11.0 per cent in 2022 (below the 11.6 per cent projected in FES 2022) and is projected to slow to 0.9 per cent in 2023 (previously 2.6 per cent). As a result, the level of nominal GDP (the broadest measure of the tax base) is expected to be $60 billion lower, on average per year, compared to the private sector economists' projections in FES 2022. It is also $16 billion lower, on average per year, compared to the downside scenario considered in FES 2022.
As the broadest measure of the tax base, the downward revision to nominal GDP is having an impact on tax receipts and the government revenue outlook. Slowing growth in nominal GDP in 2023 will push up the debt-to-GDP ratio in 2023-24 before it continues trending down (see below for details).
| 2022 | 2023 | 2024 | 2025 | 2026 | 2027 | 2022-2027 | |
|---|---|---|---|---|---|---|---|
| Real GDP growth1 | |||||||
2022 Fall Economic Statement |
3.2 | 0.7 | 1.9 | 2.3 | 2.1 | 1.9 | 2.0 |
Budget 2023 |
3.4 | 0.3 | 1.5 | 2.3 | 2.2 | 1.9 | 2.0 |
| GDP inflation1 | |||||||
2022 Fall Economic Statement |
8.2 | 1.8 | 1.8 | 1.9 | 1.9 | 1.9 | 2.9 |
Budget 2023 |
7.3 | 0.6 | 2.0 | 1.9 | 1.9 | 1.9 | 2.6 |
| Nominal GDP growth1 | |||||||
2022 Fall Economic Statement |
11.6 | 2.6 | 3.7 | 4.2 | 4.1 | 3.9 | 5.0 |
Budget 2023 |
11.0 | 0.9 | 3.6 | 4.3 | 4.1 | 3.9 | 4.6 |
| Nominal GDP level (billions of dollars)1 | |||||||
2022 Fall Economic Statement |
2,801 | 2,873 | 2,979 | 3,105 | 3,233 | 3,358 | |
Budget 2023 |
2,785 | 2,810 | 2,910 | 3,037 | 3,162 | 3,285 | |
Difference between FES 2022 and Budget 2023 |
-16 | -63 | -69 | -69 | -70 | -73 | -60 |
| 3-month treasury bill rate | |||||||
2022 Fall Economic Statement |
2.2 | 3.6 | 2.8 | 2.3 | 2.1 | 2.1 | 2.5 |
Budget 2023 |
2.4 | 4.4 | 3.3 | 2.6 | 2.4 | 2.4 | 2.9 |
| 10-year government bond rate | |||||||
2022 Fall Economic Statement |
2.8 | 3.1 | 2.8 | 2.8 | 2.9 | 3.0 | 2.9 |
Budget 2023 |
2.8 | 3.0 | 2.9 | 3.0 | 3.1 | 3.1 | 3.0 |
| Exchange rate (US cents/C$) | |||||||
2022 Fall Economic Statement |
77.9 | 77.1 | 77.9 | 78.8 | 79.2 | 79.7 | 78.4 |
Budget 2023 |
76.9 | 74.7 | 76.8 | 78.3 | 79.0 | 79.3 | 77.5 |
| Unemployment rate | |||||||
2022 Fall Economic Statement |
5.4 | 6.1 | 6.2 | 6.0 | 5.8 | 5.7 | 5.9 |
Budget 2023 |
5.3 | 5.8 | 6.2 | 6.0 | 5.7 | 5.7 | 5.8 |
| Consumer Price Index inflation | |||||||
2022 Fall Economic Statement |
6.8 | 3.5 | 2.1 | 2.1 | 2.1 | 2.1 | 3.1 |
Budget 2023 |
6.8 | 3.5 | 2.1 | 2.1 | 2.1 | 2.1 | 3.1 |
| U.S. real GDP growth | |||||||
2022 Fall Economic Statement |
1.7 | 0.6 | 1.7 | 2.2 | 2.1 | 2.0 | 1.7 |
Budget 2023 |
2.1 | 0.8 | 1.4 | 2.1 | 2.0 | 1.9 | 1.7 |
| West Texas Intermediate crude oil price ($US per barrel) | |||||||
2022 Fall Economic Statement |
97 | 88 | 85 | 82 | 81 | 81 | 86 |
Budget 2023 |
94 | 81 | 81 | 79 | 77 | 78 | 82 |
|
Note: Forecast averages may not equal average of years due to rounding. Numbers may not add due to rounding. 1 Previously published figures have been restated to reflect the historical revisions in the Canadian System of National Accounts. Sources: Statistics Canada; for the 2022 Fall Economic Statement, Department of Finance Canada September 2022 survey of private sector economists; for Budget 2023, Department of Finance Canada February 2023 survey of private sector economists, which has been adjusted to incorporate the actual results of the National Accounts for the fourth quarter of 2022 released on February 28, 2023. |
|||||||
| 2022 | 2023 | 2024 | 2025 | 2026 | 2027 | |
|---|---|---|---|---|---|---|
| Budget 2023 | 3.4 | 0.3 | 1.5 | 2.3 | 2.2 | 1.9 |
| Organisation for Economic Co-operation and Development (OECD) | 3.4 | 1.1 | 1.4 | .. | .. | .. |
| Parliamentary Budget Officer (PBO) | 3.6 | 1.0 | 1.6 | 2.2 | 2.1 | 2.0 |
| International Monetary Fund (IMF) | 3.5 | 1.5 | 1.5 | .. | .. | .. |
| Bank of Canada | 3.6 | 1.0 | 1.8 | .. | .. | .. |
|
Sources: Statistics Canada; for Budget 2023, see Table A1.1; OECD Economic Outlook, Interim Report March 2023; PBO, Economic and Fiscal Outlook – March 2023; IMF, World Economic Outlook Update – January 2023, Bank of Canada, Monetary Policy Report – January 2023. |
||||||
Changes to Fiscal Projections since FES 2022
The fiscal outlook presented in this budget is centered on the economic projections provided by the February 2023 survey of private sector economists. The tables that follow present changes to the fiscal outlook since FES 2022, including the impact of government policy actions taken since FES 2022, measures in this budget, and year-to-date financial results.
Changes to the Fiscal Outlook since FES 2022
| Projection | ||||||
|---|---|---|---|---|---|---|
| 2022–2023 | 2023–2024 | 2024–2025 | 2025–2026 | 2026–2027 | 2027–2028 | |
| Budgetary balance – 2022 Fall Economic Statement (FES 2022) | -36.4 | -30.6 | -25.4 | -14.5 | -3.4 | 4.5 |
| Economic and fiscal developments since FES 2022 | 6.4 | -4.7 | -4.9 | -5.1 | -7.5 | -10.3 |
| Budgetary balance before policy actions and measures | -30.0 | -35.3 | -30.3 | -19.5 | -10.9 | -5.8 |
| Policy actions since FES 2022 | -5.4 | 0.7 | 3.2 | 2.6 | 1.7 | 0.1 |
| Budget 2023 measures (by chapter) | ||||||
| 1. Making Life More Affordable and Supporting the Middle Class | -2.5 | -0.8 | -0.3 | -0.5 | -0.5 | -0.6 |
| 2. Investing in Public Health Care and Affordable Dental Care | -2.0 | -3.6 | -4.6 | -6.4 | -6.8 | -7.9 |
| 3. A Made in Canada Plan: Affordable Energy, Good Jobs, and a Growing Clean Economy | 0.0 | -1.2 | -3.1 | -4.4 | -5.9 | -6.3 |
| 4. Advancing Reconciliation and Building a Canada That Works for Everyone | -3.1 | -2.5 | -1.3 | -1.0 | -0.6 | -0.6 |
| 5. Canada's Leadership in the World | -0.1 | -0.2 | -0.1 | -0.1 | -0.1 | -0.1 |
| 6a. Effective Government and Improving Services to Canadians | 0.1 | 2.8 | 0.1 | 0.8 | 2.9 | 3.2 |
| 6b. A Fair Tax System | 0.0 | 0.2 | 1.5 | 1.6 | 4.4 | 4.0 |
| Total – Actions Since FES 2022 and Budget 2023 Measures | -13.0 | -4.8 | -4.7 | -7.3 | -4.9 | -8.3 |
| Budgetary Balance | -43.0 | -40.1 | -35.0 | -26.8 | -15.8 | -14.0 |
| Budgetary Balance (per cent of GDP) | -1.5 | -1.4 | -1.2 | -0.9 | -0.5 | -0.4 |
| Federal debt (per cent of GDP) | 42.4 | 43.5 | 43.2 | 42.2 | 41.1 | 39.9 |
A negative number implies a deterioration in the budgetary balance (lower revenue or higher expenses). A positive number implies an improvement in the budgetary balance (higher revenue or lower expenses). |
||||||
Economic and Fiscal Developments Since FES 2022
| Projection | ||||||
|---|---|---|---|---|---|---|
| 2022–2023 | 2023–2024 | 2024–2025 | 2025–2026 | 2026–2027 | 2027–2028 | |
| Economic and fiscal developments by component1 | ||||||
| Change in budgetary revenues | ||||||
| (1.1) Income taxes | -5.9 | -3.7 | -3.3 | -5.4 | -4.5 | -5.9 |
| (1.2) Excise taxes/duties | -0.2 | -0.9 | -1.0 | -1.0 | -1.2 | -1.3 |
| (1.3) Proceeds from the pollution pricing framework | -0.1 | 0.3 | 0.5 | 0.6 | 0.7 | 0.8 |
| (1.4) Employment insurance premiums | 0.1 | 0.0 | -0.8 | -1.0 | -0.9 | -0.9 |
| (1.5) Other revenues2 | -0.1 | -1.9 | 0.3 | 0.6 | 0.6 | 1.1 |
| (1) Total budgetary revenues | -6.2 | -6.2 | -4.3 | -6.2 | -5.3 | -6.2 |
| Change in program expenses | ||||||
| (2.1) Major transfers to persons | 5.7 | 1.8 | 1.1 | 0.8 | 0.7 | 0.8 |
| (2.2) Major transfers to other levels of government | 0.0 | -0.3 | 0.4 | 0.9 | 0.9 | 0.8 |
| (2.3) Proceeds from the pollution pricing framework returned | 0.8 | 0.0 | -1.6 | -0.6 | -0.7 | -0.8 |
| (2.4) Direct program expenses | 5.8 | 0.9 | 2.6 | 3.2 | 0.6 | 0.4 |
| (2) Total program expenses, excluding net actuarial losses | 12.3 | 2.4 | 2.5 | 4.3 | 1.5 | 1.2 |
| (3) Public debt charges | 0.3 | -0.5 | -3.4 | -3.8 | -4.3 | -5.3 |
| (4) Net actuarial losses (gains) | 0.0 | -0.4 | 0.4 | 0.5 | 0.6 | 0.0 |
| (5) Total economic and fiscal developments | 6.4 | -4.7 | -4.9 | -5.1 | -7.5 | -10.3 |
|
1 A negative number implies a deterioration in the budgetary balance (lower revenues or higher spending). A positive number implies an improvement in the budgetary balance (higher revenues or lower spending). 2 Includes Pillar One tax, and Underused Housing Tax in this table only for presentation purposes. |
||||||
- The outlook for budgetary revenues has been revised down relative to FES 2022 by $5.7 billion on average, reflecting lower nominal GDP projections and the associated implications on the projections of corporate profitability and personal income (particularly slower growth in employment and wages). As a result, income tax revenues are expected to be lower by approximately $4.8 billion on average over the forecast horizon.
- The outlook for excise taxes/duties has been revised down to reflect lower-than-expected monthly results this year as well as the impact of a weaker economy and higher borrowing costs on projected taxable consumption.
- Proceeds from the federal pollution pricing framework that arise from the provinces and territories that are a part of the federal backstop are projected to be higher starting July 1, 2023 because of the addition of Nova Scotia, Prince Edward Island, and Newfoundland and Labrador to the framework for the fuel charge. Direct proceeds will continue to be fully returned in the provinces and territories where they are generated.
- Employment insurance premium revenues are projected to be slightly higher in 2022-23 due to better-than-expected labour market outcomes, then lower starting in 2024-25 as a result of a lower premium rate required relative to FES 2022 under the existing break-even rate mechanism.
- Other revenues have been revised down in the near-term largely because of a downward revision to expected earnings of the Bank of Canada, owing to higher deposit interest rates and deposit balances on which the Bank pays interest. This is offset over the remainder of the forecast horizon due to greater projected interest revenue on lending to Crown corporations, tax debt, and net foreign exchange.
The outlook for program expenses has been revised down relative to FES 2022, reflecting lower major transfers to persons, major transfers to other levels of government, and direct program spending.
- With respect to major transfers to persons, the decrease in 2022-23 reflects lower-than-expected monthly results for Employment Insurance (EI) benefits and children's benefits, as well as a $3.2 billion increase in expected repayments from benefit overpayments of COVID-19 support for workers.
- In later years, lower expected expenses reflect slightly lower projected elderly benefits, owing to revisions to the projected number of beneficiaries, which is offset in part by higher projected CPI inflation, to which the benefits are indexed; lower projected EI benefits resulting from lower projected unemployment and earnings, consistent with the revised outlook; and the carry-forward of lower-than-expected 2022-23 results to date for children's benefits.
- Projected major transfers to other levels of government have increased slightly in 2023-24, but are lower across the remainder of the outlook, reflecting lower nominal GDP growth to which transfer programs such as Equalization are indexed. The outlook for Territorial Formula Financing has been revised downward slightly due to stronger-than-forecasted fiscal capacity in all three territories. These decreases are partially offset by a slight decline in recoveries with respect to the Quebec Abatement.
- Proceeds from the pollution pricing framework returned are lower in 2022-23 and then higher across the horizon, reflecting revised timing of returning pollution pricing fuel charge proceeds to small and medium-sized businesses and Indigenous groups in the jurisdiction where they are generated. Moreover, the addition of Nova Scotia, Prince Edward Island, and Newfoundland and Labrador to the framework for the fuel charge, as discussed above, results in incremental proceeds to be returned.
- The outlook for direct program spending has been revised down across the forecast horizon relative to the FES 2022 forecast.
- Lower expenses in 2022-23 reflect slower-than-anticipated spending, notably for COVID-related procurements of vaccines, therapeutics, and rapid testing kits, in addition to revised provisions for disaster assistance. Partially offsetting lower spending is an increase in provisions for contingent liabilities and allowances.
- Across the horizon, lower expenses reflect revised timing and spending against previously announced measures. In the later years, lower expenses are expected due to the impact of lower projected incomes on refundable corporate investment tax credits and bad debt expenses on tax receivables, reflecting the weaker revenue outlook relative to FES 2022 discussed above.
Public debt charges are expected to decrease slightly in 2022-23 relative to FES 2022 projections to $34.5 billion due to lower near-term borrowing requirements, partially offset by increases in short- and long-term interest rates as forecast by private sector economists. Over the remainder of the forecast horizon, higher projected short- and long-term interest rates and higher borrowing requirements are expected to progressively increase public debt charges relative to FES 2022 by an incremental $0.5 billion in 2023-24 rising to $5.3 billion by 2027-28.
Net actuarial losses, which represent the amortization of changes in the value of the government's accrued obligations for pensions and other employee future benefits and pension fund assets, are expected to be higher in 2023-24 and lower in subsequent years. The increase in 2023-24 is largely a result of lower expected long-term interest rates used to measure the present value of the obligations at the end of 2022-23, which reduces actuarial gains to be amortized starting in 2023-24. Thereafter, net actuarial losses are lower than forecast in FES 2022, due to higher projected long-term interest rates.
Summary Statement of Transactions
| Projection | |||||||
|---|---|---|---|---|---|---|---|
| 2021–2022 | 2022–2023 | 2023–2024 | 2024–2025 | 2025–2026 | 2026–2027 | 2027–2028 | |
| Budgetary revenues | 413.3 | 437.3 | 456.8 | 478.5 | 498.4 | 521.8 | 542.8 |
| Program expenses, excluding net actuarial losses | 468.8 | 435.9 | 446.6 | 463.3 | 475.9 | 489.2 | 505.4 |
| Public debt charges | 24.5 | 34.5 | 43.9 | 46.0 | 46.6 | 48.3 | 50.3 |
| Total expenses, excluding net actuarial losses | 493.3 | 470.4 | 490.5 | 509.3 | 522.5 | 537.6 | 555.7 |
| Budgetary balance before net actuarial losses | -80.0 | -33.2 | -33.7 | -30.8 | -24.1 | -15.7 | -12.9 |
| Net actuarial losses | -10.2 | -9.8 | -6.4 | -4.2 | -2.8 | 0.0 | -1.1 |
| Budgetary balance | -90.2 | -43.0 | -40.1 | -35.0 | -26.8 | -15.8 | -14.0 |
| Financial Position | |||||||
| Total liabilities | 1,838.7 | 1,870.0 | 1,912.0 | 1,978.5 | 2,037.1 | 2,084.3 | 2,127.6 |
| Financial assets | 600.3 | 578.9 | 578.4 | 606.9 | 635.5 | 665.5 | 694.2 |
| Net debt | 1,238.4 | 1,291.0 | 1,333.6 | 1,371.6 | 1,401.7 | 1,418.8 | 1,433.4 |
| Non-financial assets | 103.9 | 110.3 | 112.7 | 115.8 | 119.0 | 120.4 | 121.0 |
| Federal debt1,2 | 1,134.5 | 1,180.7 | 1,220.8 | 1,255.8 | 1,282.7 | 1,298.4 | 1,312.5 |
| Per cent of GDP | |||||||
| Budgetary revenues | 16.5 | 15.7 | 16.3 | 16.4 | 16.4 | 16.5 | 16.5 |
| Program expenses, excluding net actuarial losses | 18.7 | 15.7 | 15.9 | 15.9 | 15.7 | 15.5 | 15.4 |
| Public debt charges | 1.0 | 1.2 | 1.6 | 1.6 | 1.5 | 1.5 | 1.5 |
| Budgetary balance | -3.6 | -1.5 | -1.4 | -1.2 | -0.9 | -0.5 | -0.4 |
| Federal debt | 45.2 | 42.4 | 43.5 | 43.2 | 42.2 | 41.1 | 39.9 |
|
1 The opening financial position for 2022-23 has been adjusted from the closing position shown in the Public Accounts of Canada 2022 to reflect the impact of two new accounting standards for financial instruments and asset retirement obligations that came into effect in 2022-23. For further details regarding these adjustments, see Note 8 in The Fiscal Monitor – August 2022, available on the Department of Finance website. 2 The projected level of federal debt for 2022-23 includes an estimate of other comprehensive income of $1.1 billion for enterprise Crown corporations and other government business enterprises, and an estimate of $2.9 billion for net remeasurement gains on swap agreements and foreign exchange forward agreements. |
|||||||
Outlook for Budgetary Revenues
| Projection | |||||||
|---|---|---|---|---|---|---|---|
| 2021–2022 | 2022–2023 | 2023–2024 | 2024–2025 | 2025–2026 | 2026–2027 | 2027–2028 | |
| Income tax revenues | |||||||
Personal income tax |
198.4 | 206.8 | 213.7 | 224.5 | 235.7 | 246.5 | 257.9 |
Corporate income tax |
78.8 | 88.0 | 85.5 | 86.3 | 87.8 | 90.1 | 93.1 |
Non-resident income tax |
10.8 | 13.6 | 13.7 | 13.1 | 12.7 | 13.0 | 13.6 |
Total |
288.0 | 308.3 | 312.9 | 323.9 | 336.3 | 349.6 | 364.6 |
| Excise tax and duty revenues | |||||||
Goods and Services Tax |
46.2 | 45.4 | 51.4 | 53.5 | 55.5 | 57.4 | 59.4 |
Customs import duties |
5.2 | 6.2 | 6.5 | 6.9 | 7.1 | 7.4 | 7.7 |
Other excise taxes/duties |
11.3 | 11.4 | 11.9 | 12.4 | 12.5 | 12.6 | 12.7 |
Total |
62.7 | 63.0 | 69.9 | 72.8 | 75.1 | 77.4 | 79.8 |
| Other taxes | 0.0 | 0.2 | 0.9 | 0.9 | 1.0 | 3.8 | 3.4 |
| Total tax revenues | 350.7 | 371.6 | 383.7 | 397.6 | 412.4 | 430.8 | 447.8 |
| Proceeds from the pollution pricing framework | 6.3 | 7.7 | 10.1 | 12.3 | 14.0 | 15.7 | 17.1 |
| Employment Insurance premium revenues | 23.9 | 26.8 | 28.2 | 29.0 | 29.9 | 31.0 | 32.1 |
| Other revenues | |||||||
Enterprise Crown corporations |
12.8 | 5.9 | 5.6 | 10.1 | 12.4 | 13.8 | 14.3 |
Other programs |
18.7 | 24.3 | 26.6 | 26.7 | 26.4 | 27.1 | 27.9 |
Net foreign exchange |
0.9 | 1.0 | 2.5 | 3.0 | 3.3 | 3.4 | 3.5 |
Total |
32.4 | 31.3 | 34.7 | 39.7 | 42.1 | 44.3 | 45.8 |
| Total budgetary revenues | 413.3 | 437.3 | 456.8 | 478.5 | 498.4 | 521.8 | 542.8 |
| Per cent of GDP | |||||||
| Total tax revenues | 14.0 | 13.3 | 13.7 | 13.7 | 13.6 | 13.6 | 13.6 |
| Proceeds from the pollution pricing framework | 0.3 | 0.3 | 0.4 | 0.4 | 0.5 | 0.5 | 0.5 |
| Employment Insurance premium revenues | 1.0 | 1.0 | 1.0 | 1.0 | 1.0 | 1.0 | 1.0 |
| Other revenues | 1.3 | 1.1 | 1.2 | 1.4 | 1.4 | 1.4 | 1.4 |
| Total budgetary revenues | 16.5 | 15.7 | 16.3 | 16.4 | 16.4 | 16.5 | 16.5 |
|
Note: Totals may not add due to rounding. |
|||||||
Table A1.6 above provides an overview of projected budgetary revenues by major component.
Income Tax Revenues
Personal income tax revenues are projected to increase by 4.2 per cent to $206.8 billion in 2022-23, reflecting year-to-date results. After an expected slowing in 2023-24, personal income tax revenue growth is projected to average 4.8 per cent, reflecting steady growth in employment and investment income.
Corporate income tax revenues are projected to increase by 11.7 per cent, to $88 billion in 2022-23, based on year-to-date growth that has been propelled by broad-based gains across industry sectors. Beyond this, corporate income tax revenues are expected to retreat by 2.9 per cent in 2023-24 due to the projected slowdown in economic growth and then grow at an average rate of 2.2 per cent per year for the remainder of the forecast horizon.
Income taxes paid by non-residents on Canadian-sourced income, notably dividends and interest payments, are expected to grow by 25.7 per cent to $13.6 billion in 2022-23. Non-resident income tax revenue growth is then expected to be roughly flat.
Excise Tax and Duty Revenues
Goods and Services Tax (GST) revenues are forecast to fall 1.6 per cent to $45.4 billion in 2022-23. Over the remainder of the forecast period, GST revenues are expected to gain on average 5.5 per cent per year, in line with the outlook for taxable consumption trends.
Customs and import duties are projected to increase 18.8 per cent in 2022-23, based on year-to-date results that have been driven by the repeal of remission of duties on personal protective equipment and other medical goods, and strong growth in imports. Over the remainder of the forecast horizon, projected growth averages 4.4 per cent.
Other excise taxes and duties are expected to increase to $11.4 billion in 2022-23, or 1.1 per cent, reflecting year-to-date data. Revenues from these taxes are then projected to grow to $12.7 billion by 2027-28. This primarily reflects the outlook for the consumption of motive fuels and alcohol products.
Other taxes include revenues from the Underused Housing Tax announced in the 2021 Economic and Fiscal Update and from the two-pillar international tax reform plan agreed by 138 members of the OECD/G20 Inclusive Framework on Base Erosion and Profit Shifting. Revenues from these taxes are projected to grow to $3.4 billion in 2027-28, primarily reflecting the projected new revenues from Pillar Two of the international tax reform.
Proceeds from the Pollution Pricing Framework
Proceeds from the pollution pricing framework are forecast to increase primarily due to the increase in the price on pollution.Footnote 1 Moreover, starting July 1, 2023, the implementation of the federal fuel charge in Nova Scotia, Prince Edward Island, and Newfoundland and Labrador will contribute to higher pollution pricing proceeds. Direct proceeds will continue to be fully returned in the provinces or territories where they are generated.
Employment Insurance Premium Revenues
EI premium revenues are projected to grow at 12.3 per cent in 2022-23 due to continued strength in the labour market. For the remainder of the forecast, EI premium revenues are projected to grow at an average of 3.7 per cent, reflecting steady earnings growth (see Box A1.1 for details of the outlook for the EI Operating Account). Holding steady at $1.63 in 2024, the EI premium rate will be 15 cents lower than it was between 2013 and 2016 ($1.88). The EI premium rate reached its lowest levels in the last twenty-five years in 2019, 2020, and 2021 ($1.58).
Box A1.1 Employment Insurance Operating Account
| 2021-2022 | 2022-2023 | 2023-2024 | 2024-2025 | 2025-2026 | 2026-2027 | 2027-2028 | ||
|---|---|---|---|---|---|---|---|---|
| EI premium revenues | 23.9 | 26.8 | 28.2 | 29.0 | 29.9 | 31.0 | 32.1 | |
| EI benefits1 | 38.9 | 22.6 | 24.2 | 25.5 | 26.2 | 26.6 | 27.3 | |
| EI administration and other expenses2 | 2.6 | 2.6 | 2.1 | 2.0 | 2.0 | 2.0 | 2.0 | |
| 20213 | 2022 | 2023 | 2024 | 2025 | 2026 | (…) | 2030 | |
| EI Operating Account annual balance | -24.6 | 1.9 | 2.8 | 2.0 | 2.0 | 2.9 | 4.0 | |
| EI Operating Account cumulative balance | -25.9 | -24.0 | -21.1 | -19.2 | -17.2 | -14.2 | 0.74 | |
| Projected premium rate | ||||||||
| (per $100 of insurable earnings) | 1.58 | 1.58 | 1.63 | 1.63 | 1.63 | 1.63 | 1.63 | |
|
1 EI benefits include regular EI benefits, sickness, maternity, parental, compassionate care, fishing and work-sharing benefits, and employment benefits and support measures. EI benefits exclude EI-Emergency Response Benefit costs in line with the government's commitment to credit the EI Operating Account. 2 The remaining EI costs relate mainly to administration and are included in direct program expenses. 3 Values for 2021 are actual data. Values for 2022 and future years are a projection. 4 The EI Operating Account cumulative balance does not reach exactly zero at the end of the seven-year period as projected EI rates are rounded to the nearest whole cent per $100 of insurable earnings, in accordance with the Employment Insurance Act. |
||||||||
The Employment Insurance (EI) Operating Account operates within the Consolidated Revenue Fund. As such, EI-related revenues and expenses that are credited and charged to the Account, respectively, in accordance with the Employment Insurance Act, are consolidated with those of the government, and impact the budgetary balance. For consistency with the EI premium rate, which is set on a calendar-year basis with the objective of having the Account break even over time, the annual and cumulative balances of the Account are also presented on a calendar-year basis.
The EI Operating Account is expected to record annual surpluses throughout the forecast in order to reach cumulative balance in 2030 in line with the break-even rate-setting mechanism that started with the setting of the 2017 premium rate.
Other Revenues
Other revenues consist of three broad components: net income from enterprise Crown corporations; other program revenues from returns on investments, proceeds from the sales of goods and services, and other miscellaneous revenues; and net foreign exchange revenues.
- Enterprise Crown corporation revenues are projected to be lower temporarily in 2022-23 and 2023-24, largely reflecting the Bank of Canada's forecast of net losses, as interest expense paid on deposits held by the Bank at variable interest rates is growing faster than revenues on the Bank's fixed-rate investments in the rising interest rate environment. Beyond this, growth is in line with the outlook of the Bank and other enterprise Crown corporation profits, as well as increased interest revenues from lending to enterprise Crown corporations.
- Other program revenues are affected by consolidated Crown corporation revenues, interest rates, inflation, and exchange rate movements (which affect the Canadian-dollar value of foreign-denominated assets). These revenues are projected to increase by an average of 19.1 per cent in 2022-23 and 2023-24 primarily due to an increase in interest and penalty revenue on tax debt as a result of higher interest rates, additional spectrum auction revenue, and the rebound in sales of goods and services (e.g. fees for passports and visas, VIA Rail revenue). Over the remainder of the forecast horizon, other program revenue is projected to continue to grow by 1.3 per cent on average.
- Net foreign exchange revenues, which consist mainly of returns on Canada's official international reserves held in the Exchange Fund Account, are volatile and sensitive to fluctuations in foreign exchange rates and foreign interest rates. Assets in the Exchange Fund Account are mainly invested in debt securities of sovereigns and their agencies. They are held to aid in the control and protection of the external value of the Canadian dollar and to provide a source of liquidity for the government, if required. These revenues are projected to increase, as losses on sales of securities into a rising interest rate environment ease, and higher interest rates act on growing reserves.
Outlook for Expenses
| Projection | |||||||
|---|---|---|---|---|---|---|---|
| 2021–2022 | 2022–2023 | 2023–2024 | 2024–2025 | 2025–2026 | 2026–2027 | 2027–2028 | |
| Major transfers to persons | |||||||
| Elderly benefits | 60.8 | 69.1 | 75.9 | 81.2 | 86.3 | 91.4 | 96.3 |
| Employment Insurance benefits1 | 38.9 | 22.6 | 24.2 | 25.5 | 26.2 | 26.6 | 27.3 |
| COVID-19 Income Support for Workers2 | 15.6 | -3.0 | 0.0 | 0.0 | 0.0 | 0.0 | 0.0 |
| Canada Child Benefit3 | 26.2 | 24.5 | 25.6 | 27.4 | 28.5 | 29.3 | 30.0 |
| Total | 141.5 | 113.3 | 125.7 | 134.1 | 141.1 | 147.3 | 153.6 |
| Major transfers to other levels of government | |||||||
| Canada Health Transfer4 | 45.1 | 47.1 | 49.4 | 52.0 | 54.6 | 57.3 | 60.2 |
| Canada Social Transfer | 15.5 | 15.9 | 16.4 | 16.9 | 17.4 | 17.9 | 18.5 |
| Equalization | 20.9 | 21.9 | 24.0 | 25.2 | 25.9 | 27.0 | 28.1 |
| Territorial Formula Financing | 4.4 | 4.6 | 4.8 | 5.1 | 5.3 | 5.4 | 5.7 |
| Health agreements with provinces and territories5 | 2.5 | 1.2 | 3.7 | 3.7 | 3.7 | 3.7 | 2.5 |
| Canada-wide early learning and child care6 | 2.9 | 4.5 | 5.6 | 6.6 | 7.9 | 7.9 | 7.7 |
| Canada Community-Building Fund | 2.3 | 2.3 | 2.4 | 2.4 | 2.5 | 2.5 | 2.6 |
| Other fiscal arrangements7 | -5.3 | -6.5 | -6.8 | -7.2 | -7.5 | -7.8 | -8.2 |
| Total | 88.4 | 91.0 | 99.5 | 104.7 | 109.8 | 113.9 | 117.0 |
| Proceeds from the pollution pricing framework returned | 3.8 | 6.9 | 11.2 | 13.5 | 14.0 | 15.8 | 17.1 |
| Direct program expenses | |||||||
| Canada Emergency Wage Subsidy | 22.3 | -0.2 | 0.0 | 0.0 | 0.0 | 0.0 | 0.0 |
| Other transfer payments | 88.5 | 93.6 | 86.4 | 90.8 | 91.1 | 91.2 | 94.0 |
| Operating expenses8 | 124.3 | 131.4 | 123.7 | 120.2 | 119.9 | 121.1 | 123.7 |
| Total | 235.1 | 224.8 | 210.2 | 211.0 | 211.0 | 212.3 | 217.7 |
| Total program expenses, excluding net actuarial losses | 468.8 | 435.9 | 446.6 | 463.3 | 475.9 | 489.2 | 505.4 |
| Public debt charges | 24.5 | 34.5 | 43.9 | 46.0 | 46.6 | 48.3 | 50.3 |
| Total expenses, excluding net actuarial losses | 493.3 | 470.4 | 490.5 | 509.3 | 522.5 | 537.6 | 555.7 |
| Net actuarial losses (gains) | 10.2 | 9.8 | 6.4 | 4.2 | 2.8 | 0.0 | 1.1 |
| Total expenses | 503.5 | 480.2 | 496.9 | 513.5 | 525.2 | 537.6 | 556.9 |
| Per cent of GDP | |||||||
| Major transfers to persons | 5.6 | 4.1 | 4.5 | 4.6 | 4.6 | 4.7 | 4.7 |
| Major transfers to other levels of government | 3.5 | 3.3 | 3.5 | 3.6 | 3.6 | 3.6 | 3.6 |
| Direct program expenses | 9.4 | 8.1 | 7.5 | 7.3 | 6.9 | 6.7 | 6.6 |
| Total program expenses, excluding net actuarial losses | 18.7 | 15.7 | 15.9 | 15.9 | 15.7 | 15.5 | 15.4 |
| Total expenses | 20.1 | 17.2 | 17.7 | 17.6 | 17.3 | 17.0 | 17.0 |
|
Note: Totals may not add due to rounding. 1 EI benefits include regular EI benefits, sickness, maternity, parental, compassionate care, fishing and work-sharing benefits, and employment benefits and support measures. Remaining EI costs relate mainly to administration and are part of direct program expenses. 2 Includes the Canada Emergency Response Benefit, the Canada Recovery Benefit, the Canada Recovery Caregiving Benefit, the Canada Recovery Sickness Benefit, and the Canada Worker Lockdown Benefit. 3 Includes the Child Disability Benefit. 4 Includes the one-time top-up of $2 billion in 2022-23 and 5 per cent guarantee until 2027-28. 5 Includes Home and Community Care and Mental Health and Addictions Services Agreements, and the new Tailored Bilateral Agreements, but excludes $3 billion for long-term care, $1.7 billion for personal support worker's wage increases, and the Territorial Health Investment Fund which are under direct program expenses. 6 Canada-wide early learning and child care transfer payments to provinces and territories exclude funding for Indigenous early learning and child care, which are included in the other transfer payments line. 7 Other fiscal arrangements include the Quebec Abatement (offsetting amounts to reflect the reduction in federal tax collected for the Youth Allowances Recovery and Alternative Payments for Standing Programs); statutory subsidies; payments under the Canada-Nova Scotia Arrangement on Offshore Revenues; payments for the Transfer of Hibernia Net Profits Interest and Incidental Net Profits Interest Net Revenues to Newfoundland and Labrador; and potential Fiscal Stabilization payments. 8 This includes capital amortization expenses. |
|||||||
Table A1.7, above, provides an overview of the projection for program expenses by major component.
Major Transfers to Persons
Major transfers to persons consist of elderly benefits, Employment Insurance (EI) benefits, the Canada Child Benefit (CCB), and the COVID-19 income supports for workers (2022-23 only).
Elderly benefits are projected to reach $69.1 billion in 2022-23, up 13.7 per cent. Over the forecast horizon, elderly benefits are forecast to increase by 6.9 per cent on average, annually. Growth in elderly benefits is due to the increasing population of seniors and projected consumer price inflation, to which benefits are fully indexed, as well as the 10 per cent increase to Old Age Security payments for pensioners 75 and over on an ongoing basis as of July 2022, announced in Budget 2021.
EI benefits are projected to decrease to $22.6 billion in 2022-23, largely reflecting the expiry of temporary measures to facilitate access and a lower unemployment rate. EI benefits are then expected to grow at an average annual rate of 6.2 per cent throughout 2023-24 and 2024-25, due to the projected deterioration in labour market conditions, before returning to an average 2.3 per cent annual growth rate for the remainder of the forecast horizon.
During the pandemic, the government provided support to Canadians through the Canada Emergency Response Benefit, Canada Recovery Benefits and the Canada Worker Lockdown Benefit. These temporary programs are now closed, with forecasted amounts in 2022-23 mainly reflecting expected repayments of benefit overpayments.
CCB payments are projected to decrease 6.6 per cent to $24.5 billion in 2022-23, largely reflecting the end of the COVID-19 temporary supplement for families with young children. CCB payments are then expected to grow by 4.5 per cent in 2023-24 and 7.0 in 2024-25 due to consumer price inflation, to which benefits are indexed, before returning to an average 3.1 per cent growth over the remainder of the forecast.
Major Transfers to Other Levels of Government
Major transfers to other levels of government include the Canada Health Transfer (CHT), the Canada Social Transfer (CST), Equalization Territorial Formula Financing, the Canada Community-Building Fund, health agreements with provinces and territories, Canada-wide early learning and child care, and other fiscal arrangements.
In 2022-23, these transfers are expected to increase by 2.9 per cent to $91.0 billion, reflecting the $2 billion CHT top-up as part of the government's ten-year federal health plan to work with provinces and territories as announced on February 7, 2023. The immediate top-up will help to address urgent pressures in emergency rooms, operating rooms, and pediatric hospitals and, together with the new CHT growth guarantee of 5 per cent per year for 5 years, will see CHT support increase from $49.4 billion in 2023-24 to $60.2 billion in 2027-28. Compared to the outlook in FES 2022, provinces and territories are expected to receive an additional $4.6 billion through the CHT for the 2022-23 to 2027-28 period.
The CST is legislated to grow at 3 per cent per year. Equalization payments are indexed to the three-year average of nominal GDP growth. Canada Community-Building Fund payments are indexed at 2 per cent per year, with increases applied in $100 million increments. Health agreements with provinces and territories, which include Home and Community Care and Mental Health and Addictions Services Agreements, and the new Tailored Bilateral Agreements will provide $3.7 billion per year until the expiry of the home care and mental health agreements in 2026-27 and $2.5 billion in 2027-28. Canada-wide early learning and child care transfer payments are expected to increase from $4.5 billion in 2022-23 to $7.7 billion in 2027-28, which includes $625 million over four years, beginning in 2023-24, for the Early Learning and Child Care Infrastructure Fund.
Proceeds from the Pollution Pricing Framework Returned
Proceeds from the pollution pricing framework returned represent the return of all direct proceeds from the federal fuel charge and Output Based Pricing System to the jurisdiction from which they were collected. Proceeds from the pollution pricing framework returned are projected to be $6.9 billion in 2022-23, increasing to $17.1 billion by 2027-28, reflecting a higher price on carbon pollution and the application of the federal fuel charge in Nova Scotia, Prince Edward Island, and Newfoundland and Labrador beginning on July 1, 2023.
Direct Program Expenses
Direct program expenses consist of the Canada Emergency Wage Subsidy, other transfer payments administered by departments, and operating expenses. Overall, direct program expenses are projected to decrease from $224.8 billion in 2022-23 to $210.2 billion in 2023-24 before growing to $217.7 billion in 2027-28.
Other transfer payments administered by departments are projected to reach $93.6 billion in 2022-23, and then decline to $86.4 billion in 2023-24 before growing at 2.1 per cent to $94.0 billion in 2027-28. The projected initial decline in other transfer payments is due in part to the expiry of measures, such as the end of remaining COVID-19 related rent and wage supports including the Tourism and Hospitality Recovery Program and Local Lockdown Program. The projected increase in other transfer payments in 2027-28 reflects Budget 2023 measures with growing profiles, including incentives for clean energy technologies, and refundable tax credits for clean fuels and clean technology manufacturing.
Operating expenses reflect the cost of doing business for more than 100 government departments, agencies, and Crown corporations. Operating expenses are projected to reach $131.4 billion in 2022-23, and decline to $119.9 billion in 2025-26, due in part to tapering of COVID-19 related spending, such as for procurement of vaccines, therapeutics, and test kits. Growth in operating expenses over the outer years of the horizon is driven in part by wages for federal employees and capital amortization expenses, which is offset in part by the results of expenditure reduction actions announced in Budget 2022 and in this budget.
Public Debt Charges
Public debt charges are expected to increase from $34.5 billion in 2022-23 to $50.3 in 2027-28 due to increases in short- and long-term interest rates as forecast by private sector economists and higher borrowing requirements. As a share of GDP, public debt charges are projected to rise to 1.6 per cent until 2024-25 before falling to 1.5 per cent for the remainder of the forecast horizon, a level that is low by historical standards.
Net Actuarial Losses
Net actuarial losses, which represent changes in the value of the government's obligations for pensions and other employee future benefits, are expected to gradually decline over the forecast horizon, from a projected loss of $9.8 billion in 2022-23 to $1.1 billion in 2027-28, reflecting higher expected interest rates used to measure the present value of the obligations.
Financial Source/Requirement
The financial source / requirement measures the difference between cash coming into the government and cash going out. In contrast, the budgetary balance is presented on a full accrual basis of accounting, meaning that government revenues and expenses are recorded when they are earned or incurred, regardless of when the cash is received or paid.
Table A1.8 provides a reconciliation of the two measures, starting with the budgetary balance. Non-budgetary transactions shown in the table reflect the reversal of certain revenues and expenses included in the budgetary balance that have no impact on cash flows in the year, such as the amortization of non-financial assets. They also include the addition of changes in asset and liability balances that have no accrual impact in a year but do result in the inflow or outflow of cash, such as the payment of accounts payable. An increase in a liability or decrease in an asset represents a financial source, whereas a decrease in a liability or increase in an asset represents a financial requirement. The sum of the budgetary balance and changes in asset and liability balances reflected under non-budgetary transactions is equal to the government's net source of (+), or requirement for (-), cash.
| Projection | |||||||
|---|---|---|---|---|---|---|---|
| 2021–2022 | 2022–2023 | 2023–2024 | 2024–2025 | 2025–2026 | 2026–2027 | 2027–2028 | |
| Budgetary balance | -90.2 | -43.0 | -40.1 | -35.0 | -26.8 | -15.8 | -14.0 |
| Non-budgetary transactions | |||||||
Pensions and other accounts |
12.5 | 11.4 | 9.5 | 4.9 | 3.2 | -0.2 | 0.5 |
Non-financial assets |
-2.8 | -5.0 | -2.5 | -3.0 | -3.2 | -1.4 | -0.6 |
Loans, investments, and advances |
|||||||
Enterprise Crown corporations |
-19.3 | -6.9 | -9.7 | -10.6 | -12.9 | -15.2 | -13.9 |
Other |
-4.0 | -2.4 | 21.2 | -4.8 | -4.6 | -4.0 | -3.4 |
Total |
-23.3 | -9.3 | 11.5 | -15.4 | -17.5 | -19.2 | -17.3 |
Other transactions |
|||||||
Accounts payable, receivable, accruals, and allowances |
33.8 | -10.0 | -31.6 | -16.1 | -9.2 | -10.5 | -8.4 |
Foreign exchange activities and derivatives |
-11.4 | -4.3 | -9.6 | -8.1 | -4.2 | -3.9 | -3.9 |
Total |
22.4 | -14.3 | -41.3 | -24.2 | -13.4 | -14.3 | -12.3 |
| Total non-budgetary transactions | 8.8 | -17.3 | -22.8 | -37.8 | -31.0 | -35.2 | -29.8 |
| Financial source (requirement) | -81.4 | -60.2 | -62.9 | -72.7 | -57.8 | -50.9 | -43.8 |
As shown in Table A1.8, a financial requirement is projected in each year over the forecast horizon, reflecting financial requirements associated with the projected budgetary deficits, as well as forecast requirements from non-budgetary activities.
A financial source is projected for pensions and other accounts for most years over the forecast horizon. Pensions and other accounts include the activities of the Government of Canada's employee pension plans and those of federally appointed judges and Members of Parliament, as well as a variety of other employee future benefit plans, such as health care and dental plans, and disability and other benefits for veterans and others. A financial source for pensions and other accounts reflects the difference between non-cash pension and benefit expenses recorded as part of the budgetary balance to reflect the value of benefits earned by employees during a fiscal year and the annual cash outflows for benefit payments.
Financial requirements for non-financial assets mainly reflect the difference between cash outlays for the acquisition of new tangible capital assets and the amortization of capital assets included in the budgetary balance. They also include disposals of tangible capital assets and changes in inventories and prepaid expenses. Financial requirements are projected in each year over the forecast horizon, reflecting forecast net growth in non-financial assets.
Loans, investments, and advances include the government's investments in enterprise Crown corporations, including Canada Mortgage and Housing Corporation, Export Development Canada, the Business Development Bank of Canada, and Farm Credit Canada. They also include loans, investments, and advances to national and provincial governments and international organizations, and under government programs, including the Canada Emergency Business Account (CEBA). The projected financial source for other loans, investments, and advances in 2023-24 is due to the expected repayment of CEBA loans, reflecting the extension of the forgiveness repayment date from December 31, 2022, to December 31, 2023.
In general, loans, investments, and advances are expected to generate additional revenues for the government in the form of interest or additional net profits of enterprise Crown corporations, which partly offset debt charges associated with these borrowing requirements. These revenues are reflected in the budgetary balance projections.
Other transactions include the payment of tax refunds and other accounts payable, the collection of taxes and other accounts receivable, the conversion of other accrual adjustments included in the budgetary balance into cash, as well as foreign exchange activities and derivatives. Projected cash requirements over the forecast horizon mainly reflect the payment of accounts payable and forecast increases in the government's official international reserves held in the Exchange Fund Account.
Economic Scenario Analysis
As discussed in the Economic Overview, the macroeconomic inputs of the February 2023 survey continue to provide a reasonable basis for fiscal planning. However, to facilitate prudent economic and fiscal planning, and in light of elevated global uncertainty and recent developments in financial markets, the Department of Finance has developed two scenarios that consider faster or slower growth tracks relative to the February survey (Table A1.9).
Downside Scenario
The Downside Scenario considers the economic repercussions if high inflation were more persistent than expected, in Canada and globally, leading central banks to raise interest rates by more than anticipated. This is exacerbated by stresses in the global financial system associated with the sharp rise in interest rates, which tighten global financial conditions and negatively impact confidence. The overall result is a sharper slowdown in the global economy, as well as a steeper housing correction and more pronounced recession in Canada.
- CPI inflation is 0.3 percentage points above the February survey, on average, in 2023 and 2024. CPI inflation stays above 2.5 per cent until the third quarter of 2024—about three quarters longer than in the survey—reaching 2 per cent in 2026.
- In response to higher CPI inflation, short-term interest rates reach 4.75 per cent in the second quarter of 2023 before declining to 3 per cent in the first quarter of 2025 – about three months later than in the survey. Overall, short-term interest rates are up by 0.2 percentage points, on average, in 2023 and 2024.
- As a result of higher interest rates, tightened financial conditions and weaker global activity, the Canadian economy enters a somewhat more severe recession in the second quarter of 2023. Real GDP contracts by 1.9 per cent from peak to trough, compared to 0.4 per cent in the survey but significantly smaller than in the 2008-09 recession (-4.4 per cent). On an annual basis, real GDP growth is negative in 2023 and slower than anticipated in 2024, before picking up in 2025.
- Consistent with weaker economic activity, the unemployment rate rises to a peak of 6.9 per cent in the first quarter of 2024 and is 0.4 percentage points higher than the survey, on average, in 2024.
- Despite higher CPI inflation, GDP inflation is lower than in the survey as weaker global growth expectations and uncertainties weigh on commodity prices. Crude oil prices decline from US$94 per barrel in 2022 to US$69 per barrel in 2023 (down from US$81 per barrel in the survey) and remain US$3 per barrel below the survey over the rest of the forecast horizon.
- Together, slower real GDP growth and lower GDP inflation reduce the level of nominal GDP by $41 billion, on average per year, compared to the survey.
Upside Scenario
In the Upside Scenario, the Canadian economy manages to avoid a shallow recession as continued easing of supply challenges, in Canada and globally, helps to bring down inflation even as economies remain stronger than anticipated. In Canada, this improved global economic backdrop is also supported by a larger boost from our rapidly growing population, expanding Canada's growth potential. A faster rebound in China's economy provides a boost to global growth and commodity prices.
- As a result of improved supply conditions and resilient demand, the Canadian economy continues to expand at a modest pace over the course of 2023. On an annual basis, real GDP growth is 1.6 per cent in 2023 (up 1.3 percentage point from the February survey) and 1.7 per cent in 2024 (up 0.2 percentage points).
- With a stronger economy, the unemployment rate rises by less than expected, averaging 5.6 per cent in 2024 (down 0.6 percentage points from the survey).
- Despite stronger growth, CPI inflation eases somewhat faster than expected in 2023 due to a rapid improvement in supply constraints, averaging 0.2 percentage points below the survey in 2023.
- In response to lower CPI inflation, short-term interest rates start to decline in the second quarter of 2023—about one quarter sooner than in the survey—and are 0.1 percentage points below the survey, on average, in 2023 and 2024.
- Despite slightly lower CPI inflation, GDP inflation is higher than in the survey as stronger global activity and dissipation in risk aversion from heightened financial sector stress result in higher commodity prices. After averaging US$94 per barrel in 2022, crude oil prices average US$85 per barrel in 2023 (up from US$81 per barrel in the survey) and remain US$8 per barrel above the survey over the rest of the forecast horizon.
- Together, faster real GDP growth and higher GDP inflation raise the level of nominal GDP by $41 billion, on average per year, compared to the survey.
| 2023 | 2024 | 2025 | 2026 | 2027 | 2023-2027 | |
|---|---|---|---|---|---|---|
| Real GDP growth | ||||||
Budget 2023 |
0.3 | 1.5 | 2.3 | 2.2 | 1.9 | 1.7 |
Downside Scenario |
-0.2 | 1.0 | 2.7 | 2.3 | 2.0 | 1.6 |
Upside Scenario |
1.6 | 1.7 | 1.9 | 1.9 | 1.8 | 1.8 |
| GDP inflation | ||||||
Budget 2023 |
0.6 | 2.0 | 1.9 | 1.9 | 1.9 | 1.7 |
Downside Scenario |
-0.2 | 1.9 | 2.1 | 1.9 | 1.9 | 1.5 |
Upside Scenario |
1.0 | 2.0 | 1.9 | 1.9 | 1.9 | 1.7 |
| Nominal GDP growth | ||||||
Budget 2023 |
0.9 | 3.6 | 4.3 | 4.1 | 3.9 | 3.4 |
Downside Scenario |
-0.4 | 3.0 | 4.8 | 4.3 | 3.9 | 3.1 |
Upside Scenario |
2.6 | 3.8 | 3.9 | 3.8 | 3.7 | 3.5 |
| Nominal GDP level (billions of dollars) | ||||||
Budget 2023 |
2,810 | 2,910 | 3,037 | 3,162 | 3,285 | |
Downside Scenario |
2,774 | 2,858 | 2,996 | 3,124 | 3,246 | |
Upside Scenario |
2,856 | 2,964 | 3,079 | 3,196 | 3,314 | |
Difference between Budget 2023 and Downside Scenario |
-35 | -53 | -41 | -39 | -39 | -41 |
Difference between Budget 2023 and Upside Scenario |
47 | 53 | 43 | 34 | 29 | 41 |
| 3-month treasury bill rate | ||||||
Budget 2023 |
4.4 | 3.3 | 2.6 | 2.4 | 2.4 | 3.0 |
Downside Scenario |
4.6 | 3.6 | 2.6 | 2.4 | 2.3 | 3.1 |
Upside Scenario |
4.3 | 3.2 | 2.6 | 2.4 | 2.4 | 3.0 |
| Unemployment rate | ||||||
Budget 2023 |
5.8 | 6.2 | 6.0 | 5.7 | 5.7 | 5.9 |
Downside Scenario |
6.0 | 6.7 | 6.3 | 6.0 | 5.9 | 6.2 |
Upside Scenario |
5.4 | 5.6 | 5.5 | 5.5 | 5.5 | 5.5 |
| Consumer Price Index inflation | ||||||
Budget 2023 |
3.5 | 2.1 | 2.1 | 2.1 | 2.1 | 2.4 |
Downside Scenario |
3.7 | 2.4 | 2.2 | 2.0 | 2.0 | 2.5 |
Upside Scenario |
3.4 | 2.0 | 2.0 | 2.0 | 2.0 | 2.3 |
| West Texas Intermediate crude oil price ($US per barrel) | ||||||
Budget 2023 |
81 | 81 | 79 | 77 | 78 | 79 |
Downside Scenario |
69 | 72 | 76 | 77 | 78 | 74 |
Upside Scenario |
85 | 86 | 87 | 87 | 88 | 87 |
|
Note: Forecast averages may not equal average of years due to rounding. Numbers may not add due to rounding. Sources: Statistics Canada; Department of Finance Canada February 2023 survey of private sector economists, which has been adjusted to incorporate the actual results of the National Accounts for the fourth quarter of 2022 released on February 28, 2023; Department of Finance Canada calculations. |
||||||
Fiscal Impacts of Economic Scenarios
The potential impact of the two economic scenarios on the projected federal deficit and debt-to-GDP ratio are depicted in Charts A1.1 and A1.2 below.
Deficit Under Economic Scenarios
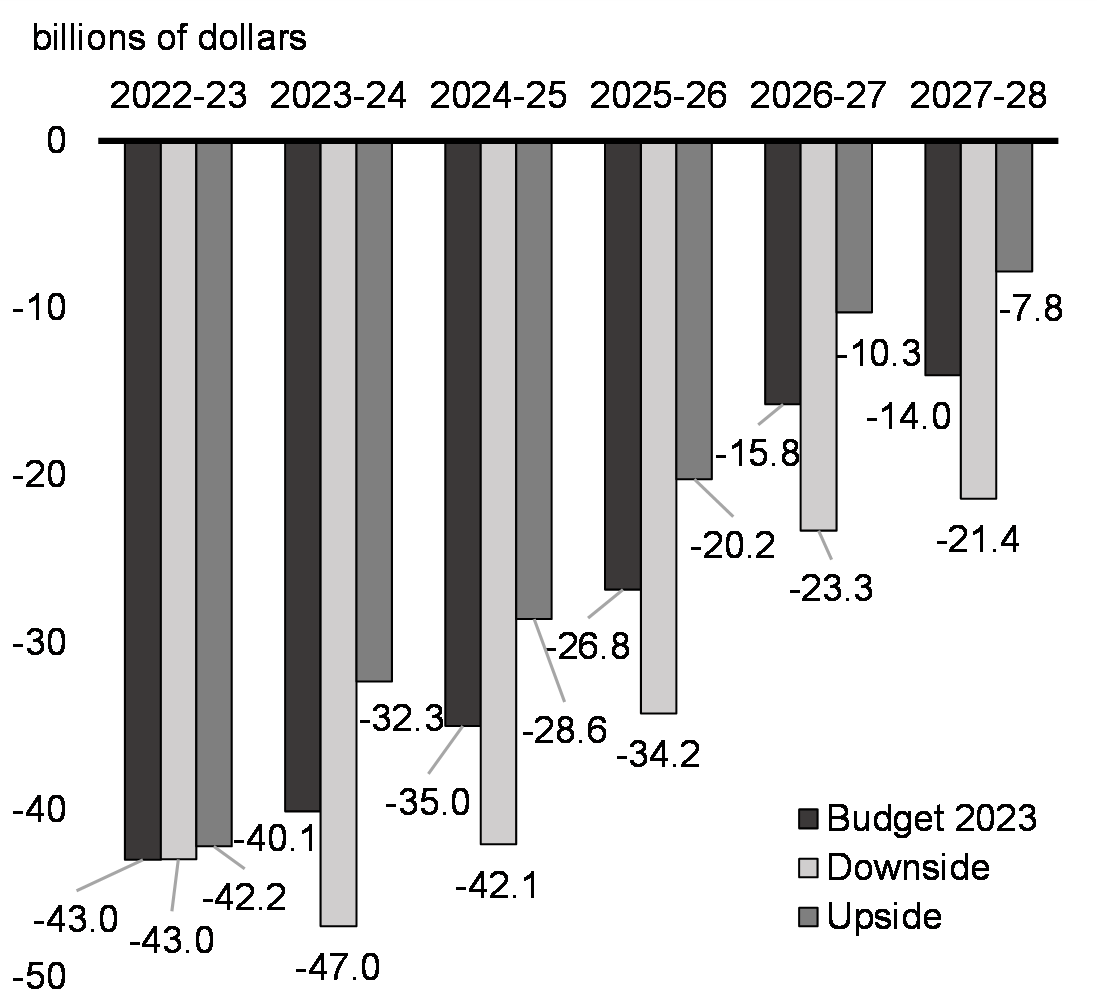
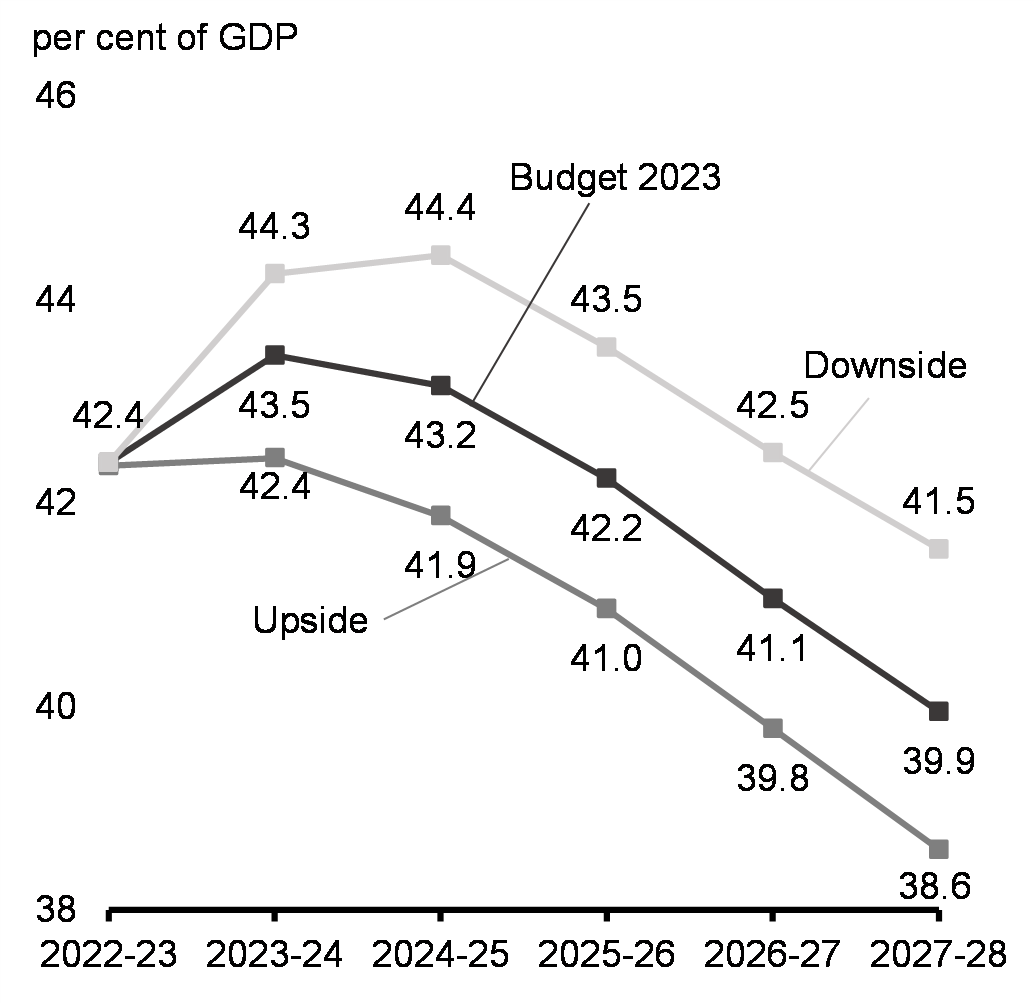
Chart A1.2
Federal Debt-to-GDP Ratio Under Economic Scenarios
Downside Scenario
In the Downside Scenario, the deficit would increase by about $7.2 billion annually on average over the planning horizon. The weakened outlook for nominal GDP would entail somewhat weaker revenues (down on average by just over $5.6 billion annually), and higher CPI inflation and interest rates lead to higher costs stemming from inflation-indexed programs (up on average by about $0.9 billion annually) and higher public debt charges (up by about $0.8 billion on average), respectively. As a result of the higher deficits and weaker nominal GDP growth, the federal debt-to-GDP ratio would be expected to rise to 44.4 per cent by 2024-25, before declining to 41.5 per cent by 2027-28.
Upside Scenario
In the Upside Scenario, the deficit would improve by an average of $6.5 billion per year. Stronger nominal GDP growth results in higher income tax revenues and the improved outlook for consumption results in higher projected GST revenues. Overall, revenues are projected to be $5.0 billion higher annually, on average, in this scenario. On the expense side, the lower projected CPI inflation means lower expenses for CPI-indexed programs. Lower interest rates mean that public debt charges would also be lower by $0.9 billion under this scenario. The reduction in these projected expenses is partially offset by higher projected CHT and Equalization transfers spurred by higher nominal GDP growth to which they are indexed. Overall, expenses would be $1.5 billion lower annually, on average, in this scenario.
As a result of the lower deficits and stronger nominal GDP growth, the federal debt-to-GDP ratio would fall to 38.6 per cent by 2027-28.
Long-Term Debt Projections
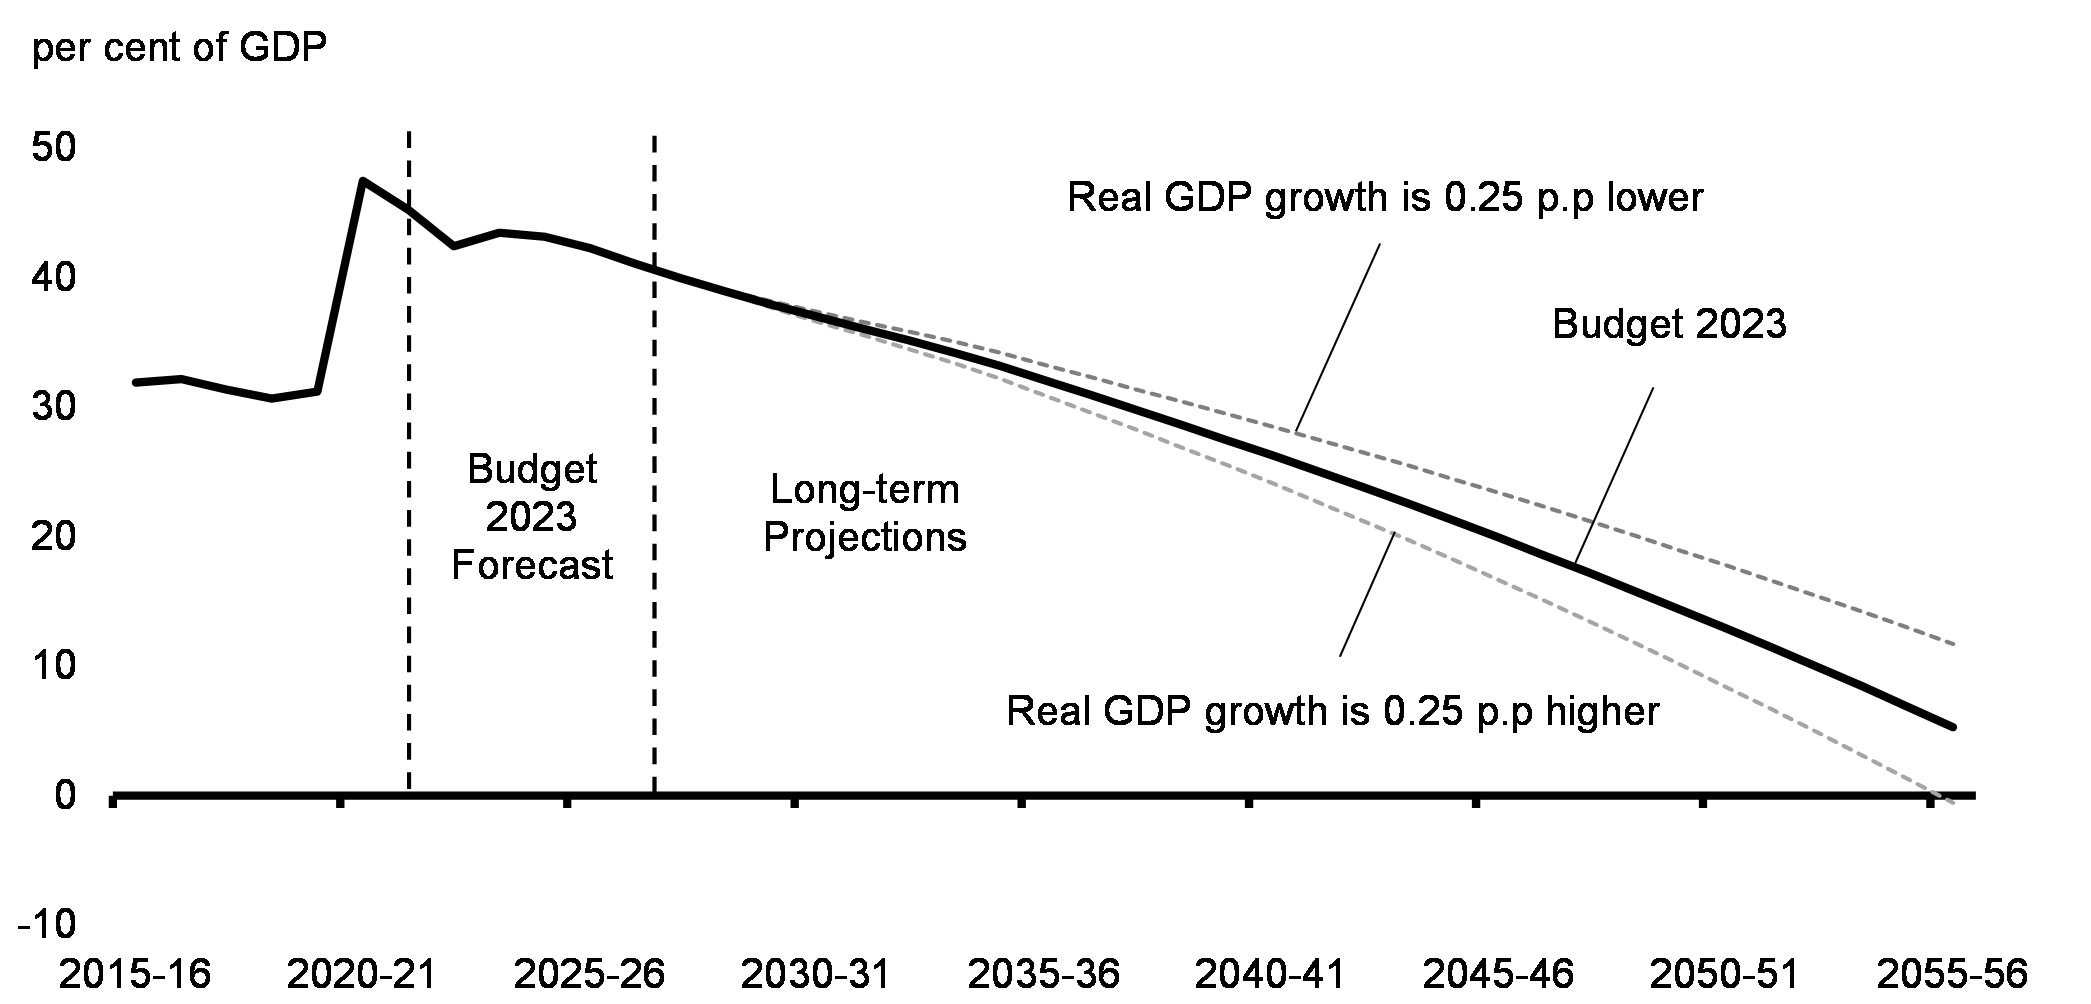
As with any projection that extends over several decades, the long-term debt-to-GDP ratio projections presented in Budget 2023 are subject to a high degree of uncertainty and are sensitive to assumptions. They should not be viewed as predictions of the future, but instead as modelling scenarios based on a set of reasonable economic and demographic assumptions, assuming no future changes in policies.
Building on the Budget 2023 forecast, long-term fiscal projections continue to indicate that federal public finances are sustainable beyond the usual forecast horizon (Chart A1.3). This is despite adverse demographic trends, including an aging population, assumed modest future productivity growth rates, and projected increases in interest rates. As discussed in more detail below, this conclusion is also robust to changes in assumptions, including, for example, the projected growth rate of real GDP.
Long-Term Projections of the Federal Debt
Keeping the federal debt-to-GDP ratio on a downward trend over the medium and longer term will help ensure that future generations are not burdened with debt and that fiscal room remains available to face future challenges and risks that are not accounted for in this projection. These include recessions, new pandemics, geopolitical risk, climate change and the transition to net-zero.
Overall, combined with improving fiscal positions at the provincial-territorial level and Canada's well-funded pension plans (see Box A1.2), keeping federal public finances on a sustainable path will further help ensure Canada's enviable international fiscal position excellent credit ratings are preserved.
Box A1.2 Canada's Pension Plans Are Well Funded
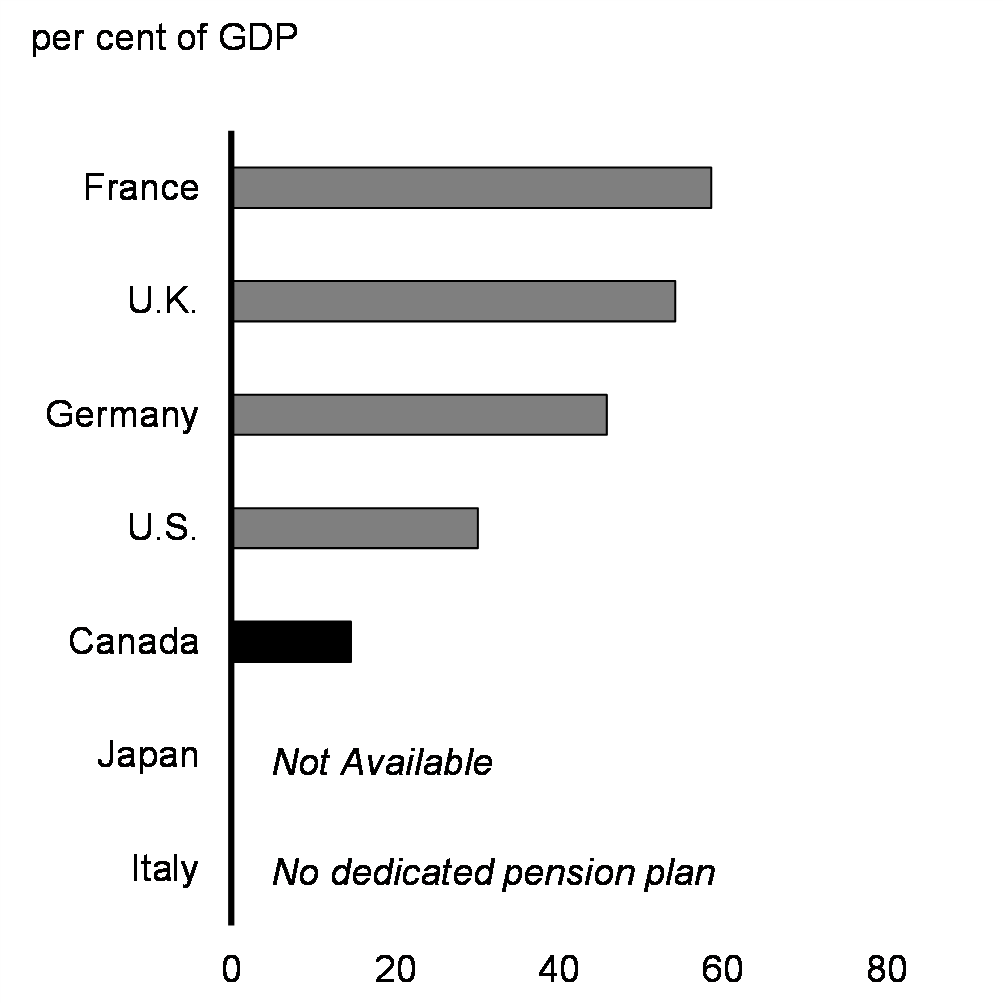
Official debt statistics published by international organizations such as the International Monetary Fund (IMF) and the Organisation for Economic Co-operation and Development (OECD) overstate Canada's public debt relative to that of most other countries—including most G7 countries. This is due to the slow adoption by other countries of international accounting standards that require the recognition of unfunded liabilities for public sector employee pension plans. Canada implements these standards, and the latest available data suggest that Canada's net debt would be, on average, more than 20 percentage points of GDP lower than that of other G7 countries for which this information is available, if they adopted the same standards (Chart A1.4).
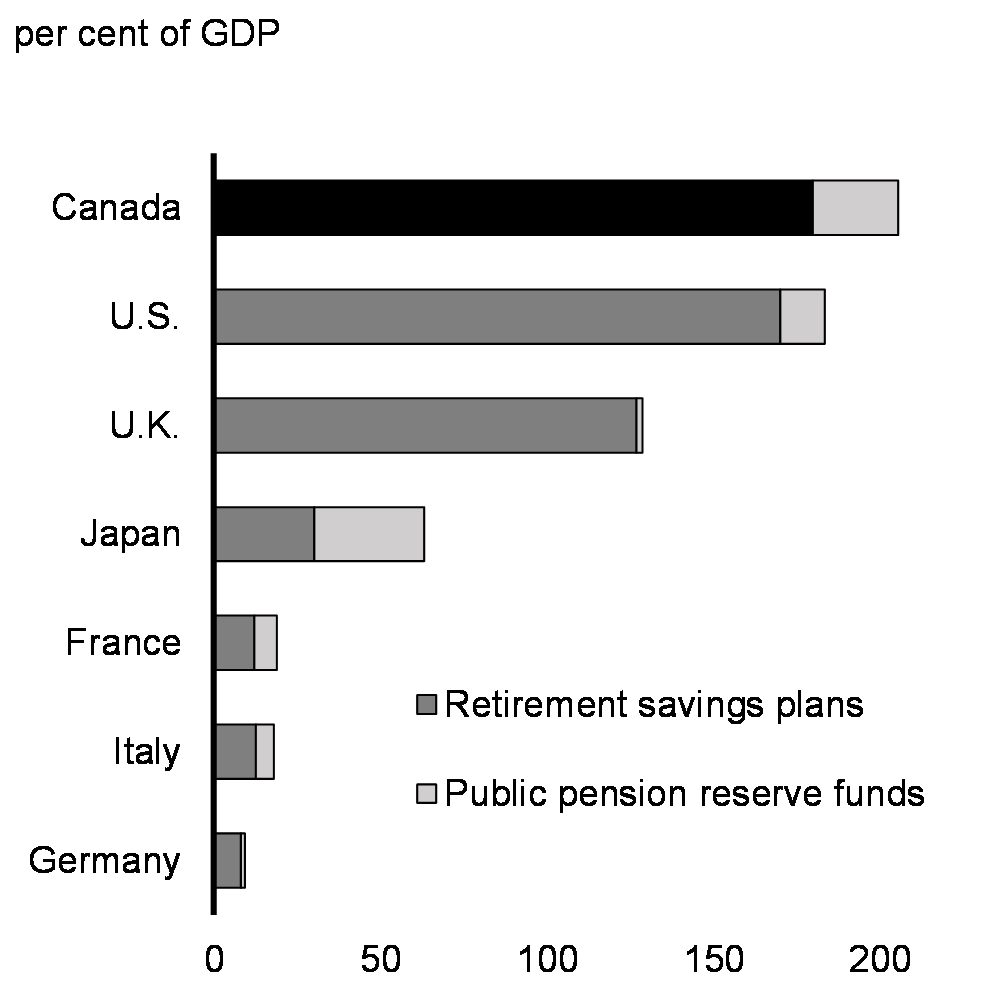
Also, Canada has accumulated more assets in public pension funds (e.g., the Canada Pension Plan) than all other G7 countries but Japan, and significantly more private retirement plan assets than other G7 countries save for the U.S. where our levels are roughly on par (Chart A1.5). Combined with well-funded public sector employee pension plans, these significant retirement assets mean Canada is better equipped than its G7 peers to deal with fiscal risks associated with long-term liabilities from population aging—further supporting Canada's fiscal advantage over the longer term.
Unfunded Government Employee Pension Plan Liabilities, G7 Countries, 2018
Private Retirement Plan Assets and Public Pension Funds, G7 Countries, 2020 or Latest Year Available
To form the long-term economic projections, the medium-term (2022 to 2027) economic forecasts presented in Budget 2023 are extended to 2055 using the Department of Finance Canada's long-term economic projection model. In this model, annual real GDP growth depends on labour productivity growth (1 per cent per year), which is calibrated over its 1974-2019 historical average, and labour supply growth (average of 0.6 per cent per year), which is based on demographic projections produced by Statistics Canada and projections for the labour force participation rate and average hours worked using econometric models developed by the Department. Assuming a constant 2 per cent annual rate for GDP inflation, nominal GDP is projected to grow by an average of 3.6 per cent per year from 2028 to 2055 (Table A1.10).
| 1970–2021 | 2022–2027 | 2028–2055 | ||||||||||||||||||||||||||||||||||||||
|---|---|---|---|---|---|---|---|---|---|---|---|---|---|---|---|---|---|---|---|---|---|---|---|---|---|---|---|---|---|---|---|---|---|---|---|---|---|---|---|---|
| Real GDP growth | 2.6 | 2.0 | 1.6 | |||||||||||||||||||||||||||||||||||||
| Contributions of (percentage points): | ||||||||||||||||||||||||||||||||||||||||
Labour supply growth |
1.5 | 1.3 | 0.6 | |||||||||||||||||||||||||||||||||||||
Working-age population |
1.5 | 1.4 | 0.8 | |||||||||||||||||||||||||||||||||||||
Labour force participation |
0.2 | -0.6 | -0.2 | |||||||||||||||||||||||||||||||||||||
Unemployment rate |
-0.1 | 0.3 | 0.0 | |||||||||||||||||||||||||||||||||||||
Average hours worked |
-0.2 | 0.1 | 0.0 | |||||||||||||||||||||||||||||||||||||
Labour productivity growth |
1.2 | 0.8 | 1.0 | |||||||||||||||||||||||||||||||||||||
| Nominal GDP growth | 6.8 | 4.8 | 3.6 | |||||||||||||||||||||||||||||||||||||
|
Note: Contributions may not add up due to rounding. Sources: Statistics Canada; Department of Finance Canada calculations. |
||||||||||||||||||||||||||||||||||||||||
The long-term federal debt projections are obtained through an accounting model in which each revenue and expense category is modelled as a function of its underlying demographic and economic variables, with the relationships defined by a mix of current government policies and assumptions. The key assumptions underlying fiscal projections from 2028-29 through 2055-56 are the following:
- All tax revenues as well as direct program expenses grow broadly with nominal GDP, with the exceptions of a number of measures that will no longer be available after a certain date (e.g. the clean electricity, clean technology and clean hydrogen investment tax credits and funding to support clean electricity projects) which are incorporated based on their projected costs.
- The Canada Health Transfer, Canada Social Transfer, and Equalization grow with their respective legislated escalators. The remaining federal transfers to other levels of government, depending on the transfer, grow with nominal GDP, the targeted populations and inflation, current legislation or agreements.
- The Old Age Security program and children's benefits grow with the targeted populations and inflation. Employment Insurance (EI) benefits grow in line with the number of beneficiaries and the growth in average weekly earnings. The EI premium rate grows according to current program parameters.
- The effective interest rate on interest-bearing federal debt is assumed, under the baseline scenario, to gradually increase from about 2.7 per cent in 2027–28 to 3.4 per cent by 2055-56.
Sensitivity analysis shows that the long-term fiscal projections are robust to some changes to key assumptions (Tables A1.11 and A1.12).
| Baseline2 | High | Low | |
|---|---|---|---|
| Demographic: | |||
Fertility rate (average births per woman) |
1.5 births | +0.5 births | -0.5 births |
Immigration (per cent of population) |
0.9 | +0.25 p.p. | -0.25 p.p. |
Life expectancy at 65 |
23.1 years | +3 years | -3 years |
| Economic: | |||
Total labour force participation rate (per cent) |
61.4 | +2.0 p.p. | -2.0 p.p. |
Average weekly hours worked (hours) |
33.3 | +1.0 hour | -1.0 hour |
Unemployment rate (per cent) |
5.7 | +1.0 p.p. | -1.0 p.p. |
Labour productivity (per cent) |
1.0 | +0.25 p.p. | -0.25 p.p. |
Interest rates (per cent) |
3.2 | +1.0 p.p. | -1.0 p.p. |
|
Note: p.p. = percentage point. 1 These alternative assumptions are applied starting in 2028 except for changes in life expectancy, which are gradually applied over the projection horizon. 2 Baseline shown as the average over the period 2028 to 2055. |
|||
| Baseline | High | Low | ||||
|---|---|---|---|---|---|---|
| Budgetary Balance | Debt | Budgetary Balance | Debt | Budgetary Balance | Debt | |
| Demographic: | ||||||
Fertility rate |
1.3 | 5.3 | 1.1 | 9.2 | 1.5 | 1.4 |
Immigration |
1.3 | 5.3 | 1.7 | -0.1 | 0.9 | 11.7 |
Life expectancy at 65 |
1.3 | 5.3 | 1.0 | 9.1 | 1.5 | 3.2 |
| Economic: | ||||||
Total labour force participation rate |
1.3 | 5.3 | 1.6 | 0.4 | 1.0 | 10.9 |
Average weekly hours worked |
1.3 | 5.3 | 1.6 | 0.8 | 1.0 | 10.4 |
Unemployment rate |
1.3 | 5.3 | 1.2 | 7.0 | 1.4 | 3.7 |
Labour productivity |
1.3 | 5.3 | 1.8 | -0.6 | 0.8 | 11.8 |
Interest rates |
1.3 | 5.3 | 0.9 | 12.7 | 1.6 | -0.3 |
Supplementary Information
Sensitivity of Fiscal Projections to Economic Shocks
Changes in economic assumptions affect the projections for revenues and expenses. The following tables illustrate the sensitivity of the budgetary balance to a number of economic shocks relative to the baseline Budget 2023 projections, which already incorporate forecast changes in levels to these components over the budget horizon:
- A one-year, 1-percentage-point decrease in real GDP growth driven equally by lower productivity and employment growth.
- A decrease in nominal GDP growth resulting solely from a one-year, 1-percentage-point decrease in the rate of GDP inflation (assuming that the Consumer Price Index moves in line with GDP inflation).
- A sustained 100-basis-point increase in all interest rates.
These sensitivities are estimates that assume any decrease in economic activity is proportional across income and expenditure components, and are meant to provide a broad illustration of the impact of economic shocks on the outlook for the budgetary balance. The sensitivity analysis conducted in this section has been presented routinely in budgets since 1994 and is separate from the scenarios for a faster or slower recovery presented earlier in this annex. Actual economic shocks may have different fiscal impacts. For example, they may be concentrated in specific sectors of the economy or cause different responses in key economic variables (e.g., GDP inflation and CPI inflation may have different responses to a given shock).
| Year 1 | Year 2 | Year 5 | |
|---|---|---|---|
| Federal revenues | |||
Tax revenues |
|||
Personal income tax |
-2.8 | -3.0 | -3.4 |
Corporate income tax |
-0.8 | -0.8 | -0.9 |
Goods and Services Tax |
-0.5 | -0.5 | -0.6 |
Other |
-0.2 | -0.2 | -0.2 |
Total tax revenues |
-4.3 | -4.5 | -5.0 |
Employment Insurance premiums |
0.2 | 1.0 | 1.0 |
Other revenues |
-0.1 | -0.1 | -0.1 |
| Total budgetary revenues | -4.2 | -3.6 | -4.1 |
| Federal expenses | |||
Major transfers to persons |
|||
Elderly benefits |
0.0 | 0.0 | 0.0 |
Employment Insurance benefits |
1.0 | 1.0 | 1.1 |
Canada Child Benefit |
0.0 | 0.1 | 0.2 |
Total major transfers to persons |
0.9 | 1.1 | 1.2 |
Other program expenses |
-0.3 | -0.1 | -0.2 |
Public debt charges |
0.1 | 0.2 | 0.6 |
| Total expenses | 0.7 | 1.2 | 1.6 |
| Budgetary balance | -4.9 | -4.8 | -5.7 |
A 1-percentage-point decrease in real GDP growth proportional across income and expenditure components reduces the budgetary balance by $4.9 billion in the first year, $4.8 billion in the second year, and $5.7 billion in the fifth year (Table A1.13).
- Tax revenues from all sources fall by a total of $4.3 billion in the first year. Personal income tax revenues decrease as employment and the underlying tax base fall. Corporate income tax revenues fall as output and profits decrease. GST revenues decrease because of lower consumer spending associated with the fall in employment and personal income.
- EI premium revenues increase as a result of an increase in the EI premium rate, which, under the seven-year break-even mechanism, adjusts to offset the increase in benefits due to the higher number of unemployed, such that the EI Operating Account balances over time.
- Expenses rise, mainly reflecting higher EI benefits (due to an increase in the number of unemployed) and higher public debt charges (reflecting a higher stock of debt due to the lower budgetary balance). This rise is partially offset by lower other program expenses, like Equalization, as the decline in real GDP is reflected in nominal GDP, to which these payments are indexed.
| Year 1 | Year 2 | Year 5 | |
|---|---|---|---|
| Federal revenues | |||
Tax revenues |
|||
Personal income tax |
-2.7 | -2.5 | -2.8 |
Corporate income tax |
-0.8 | -0.8 | -0.9 |
Goods and Services Tax |
-0.5 | -0.5 | -0.6 |
Other |
-0.2 | -0.2 | -0.2 |
Total tax revenues |
-4.2 | -4.0 | -4.4 |
Employment Insurance premiums |
0.0 | -0.1 | -0.2 |
Other revenues |
-0.2 | -0.2 | -0.2 |
| Total budgetary revenues | -4.4 | -4.3 | -4.8 |
| Federal expenses | |||
Major transfers to persons |
|||
Elderly benefits |
-0.5 | -0.8 | -0.9 |
Employment Insurance benefits |
-0.1 | -0.1 | -0.2 |
Canada Child Benefit |
0.0 | -0.1 | -0.3 |
Total major transfers to persons |
-0.5 | -1.0 | -1.5 |
Other program expenses |
-0.8 | -0.7 | -1.6 |
Public debt charges |
-0.7 | 0.1 | 0.2 |
| Total expenses | -2.1 | -1.6 | -2.8 |
| Budgetary balance | -2.3 | -2.6 | -2.0 |
A 1-percentage-point decrease in nominal GDP growth proportional across income and expenditure components, resulting solely from lower GDP inflation (assuming that the CPI moves in line with GDP inflation), lowers the budgetary balance by $2.3 billion in the first year, $2.6 billion in the second year, and $2.0 billion in the fifth year (Table A1.14).
- Lower prices result in lower nominal income and, as a result, personal income tax revenues decrease. As the parameters of the personal income tax system are indexed to inflation, the fiscal impact is smaller than under the real shock. For the other sources of tax revenue, the negative impacts are similar under the real and nominal GDP shocks.
- EI premium revenues decrease in response to lower earnings.
- Other revenues decline slightly as lower prices lead to lower revenues from the sales of goods and services, and lower growth in tax revenue results in slightly lower interest and penalty revenue.
- Partly offsetting lower revenues are the declines in the cost of statutory programs that are indexed to CPI inflation, such as elderly benefit payments, which puts downward pressure on federal program expenses. In addition, other program expenses are also lower as certain programs are linked directly to growth in nominal GDP, such as Equalization.
- Public debt charges decline in the first year due to lower costs associated with Real Return Bonds.
| Year 1 | Year 2 | Year 5 | |
|---|---|---|---|
| Federal revenues | -0.2 | 1.1 | 3.4 |
| Federal expenses | 3.8 | 6.2 | 10.3 |
| Budgetary balance | -4.0 | -5.1 | -6.9 |
A 1 per cent increase in interest rates decreases the budgetary balance by $4.0 billion in the first year, $5.1 billion in the second year, and $6.9 billion in the fifth year (Table A1.15). Higher interest rates directly impact estimated public debt charges on marketable debt in two ways. First, interest costs increase as existing debt matures and is refinanced at higher rates. Second, rising rates increase the expected cost of future borrowing needs. Public debt charges are estimated based on the current expectations for future changes in interest rates, which are subject to change based on economic conditions.
It is important to note that interest rates also directly affect other government revenues and expenses and that they typically do not change in isolation. That is, with higher interest rates, the government would realize some offsetting benefits, including:
- Higher revenues from the government's interest-bearing assets, and interest and penalty revenue on tax debt, which are recorded as part of other revenues;
- Corresponding downward adjustments that reduce the valuations of public sector pensions and employee benefits obligations, which are not incorporated in the table above; and,
- Higher government tax revenues if interest rate increases were due to stronger economic growth (also not included in the table above).
Even with a 1 per cent increase in interest rates, public debt charges are sustainable and would remain near historic lows as a proportion of GDP.
Policy Actions Taken Since the 2022 Fall Economic Statement
Since 2016, the government has provided a transparent overview of all policy actions taken between budgets and updates. These measures, listed in Table A1.16, ensure that Canadians are continually well served by the programs they rely on.
| Dept. | 2022-2023 | 2023-2024 | 2024-2025 | 2025-2026 | 2026-2027 | 2027-2028 | |
|---|---|---|---|---|---|---|---|
| Clean Growth, Innovation and Infrastructure | |||||||
| Critical Minerals Infrastructure Fund1 | NRCan | 0 | 100 | 120 | 150 | 190 | 214 |
Less: Previously Provisioned in the Fiscal Framework |
0 | -214 | -214 | -214 | -214 | -214 | |
| National Adaptation Strategy2 | Multiple | 0 | 638 | 225 | 274 | 261 | 282 |
| Oil-to-Heat Pumps Affordability Grant | NRCan | 4 | 54 | 64 | 64 | 64 | 0 |
| Re-Aligning Strategic Innovation Fund Resources | ISED | -609 | -398 | -250 | 135 | -500 | -300 |
| Housing Accelerator Fund Administration3 | CMHC | 24 | 76 | 0 | 0 | 0 | 0 |
Less: Funds Previously Provisioned in the Fiscal Framework |
-12 | -38 | 0 | 0 | 0 | 0 | |
| Membership in the Square Kilometre Array Observatory | NRC | 0 | 41 | 41 | 37 | 36 | 35 |
| Support for the Praxis Spinal Cord Institute | ISED | 6 | 6 | 0 | 0 | 0 | 0 |
Less: Previously Provisioned in the Fiscal Framework |
-6 | -1 | 0 | 0 | 0 | 0 | |
| Reconciliation and Communities | |||||||
| Commemorative Initiatives to Honour Queen Elizabeth II | PCH | 1 | 0 | 0 | 0 | 0 | 0 |
Less: Funds Sourced from the Treasury Board Management Reserve |
-1 | 0 | 0 | 0 | 0 | 0 | |
| Preserving the Commemorative Integrity of the Juno Beach Centre | VAC | 4 | 0 | 0 | 0 | 0 | 0 |
| Supporting Essential Goods and Services within Federal Correctional Facilities | CSC | 0 | 42 | 42 | 42 | 42 | 42 |
| Supporting the RCMP's Contract Policing Program | RCMP | 89 | 4 | 4 | 0 | 0 | 0 |
| Temporary Lodgings for Asylum Seekers in Need of Shelter | IRCC | 109 | 368 | 0 | 0 | 0 | 0 |
Less: Funds Sourced From Existing Departmental Resources |
-20 | 0 | 0 | 0 | 0 | 0 | |
| Veterans Affairs Canada Adjustments for Non-Discretionary Cost Fluctuations | VAC | 0 | 1 | 1 | 1 | 1 | 1 |
| Accelerating Funding Toward Housing in Urban, Rural and Northern Indigenous Communities | ISC, CMHC | 0 | 197 | 85 | 0 | 0 | 0 |
Less: Funds Previously Provisioned in the Fiscal Framework |
-4 | -6 | -52 | -110 | -110 | 0 | |
| Supporting Indigenous Communities during Emergencies | ISC | 160 | 0 | 0 | 0 | 0 | 0 |
| Canada in the World | |||||||
| Additional Demining Assistance to Ukraine | GAC | 15 | 0 | 0 | 0 | 0 | 0 |
Less: Funds Previously Provisioned in the International Assistance Envelope |
-15 | 0 | 0 | 0 | 0 | 0 | |
| Additional Military Aid for Ukraine | DND | 500 | 0 | 0 | 0 | 0 | 0 |
| Continuing to Provide Financial Assistance for Ukrainians | IRCC | 200 | 118 | 0 | 0 | 0 | 0 |
Less: Funds Sourced From Existing Departmental Resources |
-30 | 0 | 0 | 0 | 0 | 0 | |
| Extending Canada's Middle East Strategy | GAC, DND, CSE, CSIS | 288 | 208 | 208 | 1 | 1 | 0 |
Less: Funds Sourced From Existing Departmental Resources |
-91 | -94 | -94 | 0 | 0 | 0 | |
| Indo-Pacific Strategy4 | Multiple | 0 | 256 | 312 | 321 | 324 | 309 |
Less: Funds Sourced From Existing Departmental Resources |
0 | -52 | -53 | -53 | -53 | -53 | |
| Project Finance for Permanence and Support for Developing Countries' Conservation Efforts | ECCC, GAC | 0 | 217 | 238 | 238 | 115 | 115 |
Less: Funds Sourced From Existing Departmental Resources |
0 | -2 | 0 | 0 | 0 | 0 | |
| Support for Türkiye and Syria | GAC | 40 | 0 | 0 | 0 | 0 | 0 |
Less: Funds Previously Provisioned in the International Assistance Envelope |
-40 | 0 | 0 | 0 | 0 | 0 | |
| Supporting the Democracy in La Francophonie Initiative | GAC | 0 | 5 | 5 | 0 | 0 | 0 |
Less: Funds Previously Provisioned in the International Assistance Envelope |
0 | -5 | -5 | 0 | 0 | 0 | |
| Using Tariff Revenue to Support Ukraine's Power Grid | FIN | 115 | 0 | 0 | 0 | 0 | 0 |
Less: Projected Revenues |
-115 | 0 | 0 | 0 | 0 | 0 | |
| Immediate Support to Haiti | DND, GAC | 0 | 100 | 0 | 0 | 0 | 0 |
Less: Funds Previously Provisioned in the International Assistance Envelope |
0 | -95 | 0 | 0 | 0 | 0 | |
Less: Funds Sourced From Existing Departmental Resources |
0 | -5 | 0 | 0 | 0 | 0 | |
| Effective Government, Tax Fairness, and Financial Sector Policy | |||||||
| 2022-23 Adjustment to the Grant for the Canada-Quebec Accord on Immigration | IRCC | 30 | 0 | 0 | 0 | 0 | 0 |
| Additional Support for the Public Order Emergency Commission | PCO | 3 | 0 | 0 | 0 | 0 | 0 |
| Employment and Social Development Canada Rent Price Adjustment | ESDC | 0 | 11 | 11 | 11 | 11 | 11 |
Less: Funds From CPP Account |
0 | -2 | -2 | -2 | -2 | -2 | |
| Marine and Aviation Fuel Cost Pressures | DFO | 52 | 0 | 0 | 0 | 0 | 0 |
| Canadian Coast Guard Arctic and Offshore Patrol Ships5 | DFO | 0 | 0 | 0 | 0 | 0 | 5 |
Less: Funds Sourced From Existing Departmental Resources |
0 | 0 | 0 | 0 | 0 | -10 | |
| Price and Volume Protection for Federal Real Property | PSPC | 1 | 55 | 55 | 55 | 55 | 55 |
| Obligations for Federal Public Sector Employee Benefit Plans | TBS | 50 | 0 | 0 | 0 | 0 | 0 |
| Changes to Automobile Deduction Limits | - | 0 | 7 | 7 | 7 | 7 | 7 |
| Standing up a public registry of corporate beneficial ownership | ISED | 3 | 13 | 11 | 7 | 7 | 7 |
Less: Funds Sourced From Existing Departmental Resources |
-2 | -7 | -4 | -3 | -3 | -4 | |
| 2022 Fall Economic Statement Provision for Anticipated Near-Term Pressures | -1,000 | -1,000 | -2,000 | -1,500 | -1,500 | -1,500 | |
| (Net) Fiscal Impact of Non-Announced Measure6 | 5,689 | -1,293 | -1,936 | -2,101 | -473 | 912 | |
| Net Fiscal Impact – Total Policy Actions Since Fall Economic Statement 2022 | 5,438 | -695 | -3,181 | -2,641 | -1,742 | -76 | |
|
Totals may not add due to rounding. 1 Total funding adds to $1.5 billion over seven years, starting in 2023-24, as announced in Budget 2022. The funding profile has been revised. 2 This includes funding for Environment and Climate Change Canada; Natural Resources Canada; Infrastructure Canada; Public Safety Canada; Crown-Indigenous Relations and Northern Affairs Canada; Health Canada; National Research Council Canada; Innovation, Science and Economic Development Canada and Indigenous Services Canada. 3 Funding profile has since been revised to $41 million in 2023-24; $21 million in 2024-25; $17 million in 2025-26; $16 million in 2026-27; and $7 million in 2027-28. 4 This includes funding for Global Affairs Canada; National Defence; Fisheries and Oceans Canada; Immigration; Refugees and Citizenship Canada; Canadian Security Intelligence Service; Communications Security Establishment; Employment and Social Development Canada; Canadian Food Inspection Agency; Royal Canadian Mounted Police; National Research Council Canada; Agriculture and Agri-Food Canada; Canada Border Services Agency; Natural Resources Canada; Export Development Canada; the Privy Council Office; Innovation, Science and Economic Development; and Public Safety Canada. The Indo-Pacific Strategy also announced $750 million to enhance the capacity of FinDev Canada to expand its operations into the Indo-Pacific and accelerate its work in priority markets to support high-quality, sustainable infrastructure. Funding will be transferred from Export Development Canada. 5 Total funding includes an additional $510 million in remaining amortization between 2028-29 to 2063-64. 6 The net fiscal impact of measures that are not announced is presented at the aggregate level and would include provisions for anticipated Cabinet decisions not yet made (including the use of such provisions from previous budgets and updates) and funding decisions related to national security, commercial sensitivity, contract negotiations and litigation issues. |
|||||||
| AAFC | Agriculture and Agri-Food Canada |
|---|---|
| ACOA | Atlantic Canada Opportunities Agency |
| CanNor | Canadian Northern Economic Development Agency |
| CATSA | Canadian Air Transport Security Authority |
| CBSA | Canada Border Services Agency |
| CED | Canada Economic Development for Quebec Regions |
| CFIA | Canadian Food Inspection Agency |
| CIRNAC | Crown-Indigenous Relations and Northern Affairs Canada |
| CMHC | Canada Mortgage and Housing Corporation |
| CRA | Canada Revenue Agency |
| CSA | Canadian Space Agency |
| CSC | Correctional Service of Canada |
| CSE | Communications Security Establishment |
| CSIS | Canadian Security Intelligence Service |
| DFO | Fisheries and Oceans Canada |
| DND | National Defence |
| ECCC | Environment and Climate Change Canada |
| ESDC | Employment and Social Development Canada |
| FedDev | Federal Economic Development Agency for Southern Ontario |
| FedNor | Federal Economic Development Agency for Northern Ontario |
| FIN | Department of Finance Canada |
| GAC | Global Affairs Canada |
| HC | Health Canada |
| INFC | Infrastructure Canada |
| IRB | Immigration and Refugee Board of Canada |
| IRCC | Immigration, Refugees and Citizenship Canada |
| ISC | Indigenous Services Canada |
| ISED | Innovation, Science and Economic Development Canada |
| JUS | Justice Canada |
| NAC | National Arts Centre |
| NFB | National Film Board |
| NRCan | Natural Resources Canada |
| NRCC | National Research Council Canada |
| NSICOP | National Security and Intelligence Committee of Parliamentarians |
| NSIRA | National Security and Intelligence Review Agency |
| OCI | Correctional Investigator Canada |
| OPC | Office of the Privacy Commissioner |
| PacifiCan | Pacific Economic Development Canada |
| PCA | Parks Canada Agency |
| PCH | Canadian Heritage |
| PCO | Privy Council Office |
| PHAC | Public Health Agency of Canada |
| PrairiesCan | Prairies Economic Development Canada |
| PS | Public Safety Canada |
| PSC | Public Service Commission |
| PSPC | Public Services and Procurement Canada |
| RCMP | Royal Canadian Mounted Police |
| SCC-CCN | Standards Council of Canada |
| SSC | Shared Services Canada |
| StatCan | Statistics Canada |
| TBS | Treasury Board of Canada Secretariat |
| TC | Transport Canada |
| TSB | Transportation Safety Board |
| VAC | Veterans Affairs Canada |
Page details
- Date modified: