
Archived - Overview:
Economic Context
The Canadian economy has staged a strong recovery from the pandemic. Our workers and businesses have displayed remarkable resilience as the world endured multiple waves of COVID-19. Real GDP returned to pre-pandemic levels earlier than expected. Canada’s jobs recovery has outperformed its G7 peers and surpassed even the most optimistic expectations. Economic scarring from the pandemic has largely been avoided.
The impacts of the pandemic are still being felt by workers and businesses, whether from the ongoing rebalancing of consumer demand and related supply chain issues, or new realities such as increased remote work and the accelerating digitalization of our economy. Federal emergency supports managed to stabilize household finances, support millions of jobs, and keep small businesses afloat. And now, unemployment is lower than it was when the pandemic started.
However, the global economy remains fragile and any potential setbacks could have a major impact on Canada. The illegal and barbaric Russian invasion of Ukraine has led to the loss of thousands of lives and the exodus of millions of Ukrainians. For those watching from afar, the invasion is a major new source of uncertainty. The ramifications are being felt worldwide.
The invasion of Ukraine and the resulting sanctions against Russia have weighed on markets and confidence; led to a surge in commodity prices; and resulted in a deterioration of the global economic outlook. Higher commodity prices and additional supply disruptions will exacerbate the inflationary pressures already seen across the world.
As an open economy and a trading nation, Canada has to confront, head-on, longstanding challenges and new global economic dynamics. The world is changing, and Canada cannot be left behind.
We need to invest in an economy that is innovative and growth-friendly. We need to navigate a global green transition that is accelerating every day. We need to ensure that all Canadian workers, Canadian businesses, and all regions of the country benefit from it. We need to build more affordable housing to meet the growing needs of a growing workforce. We need to invest in skills and immigration to ensure that the workforce is prepared for the economy of today, and tomorrow.
The government is focused on positioning Canada to thrive in an uncertain world. Budget 2022 takes needed steps to create an environment that spurs the investments we need to grow our economy, create new, good-paying jobs for Canadians, and grow the middle class.
1. A Strong Recovery Path
Canada’s Performance Has Exceeded Expectations
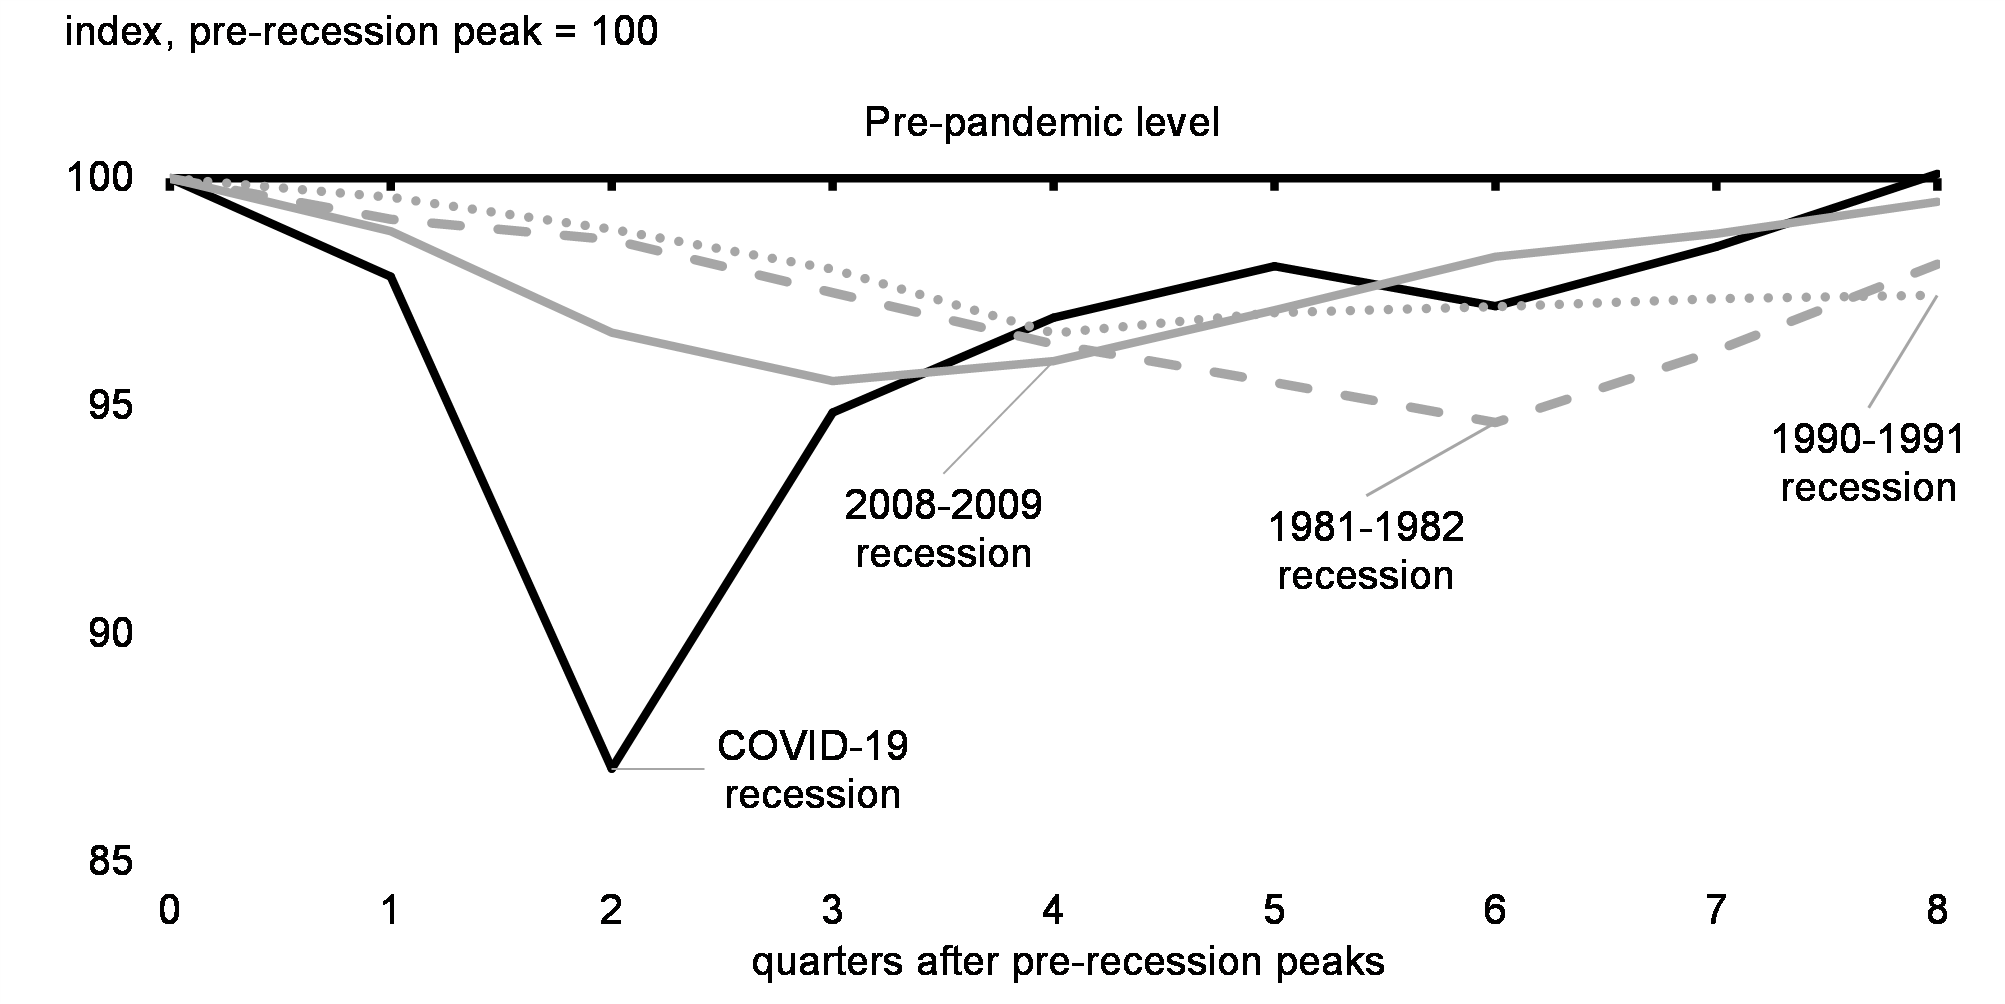
The Canadian economy returned to its pre-pandemic level of activity in the fourth quarter of 2021, marking the fastest recovery of the last three recessions (Chart 1). Real GDP also grew 6.7 per cent at an annual rate in the last quarter of 2021—the second-strongest pace of growth in the G7.
The scale of the government’s emergency economic support has fostered a strong recovery, and has helped Canadians and Canadian businesses weather the pandemic.
However, the effects of economic uncertainty are evident in measures of consumer and business confidence. The Conference Board of Canada’s Index of Business Confidence was 10 per cent below its long-term average in the fourth quarter of 2021. Consumer confidence was also below its historical average as of March 2022, weighed down by concerns about inflation.
Real GDP Change During COVID-19 and Previous Recessions
Canada’s Jobs Recovery Has Been Exceptionally Strong
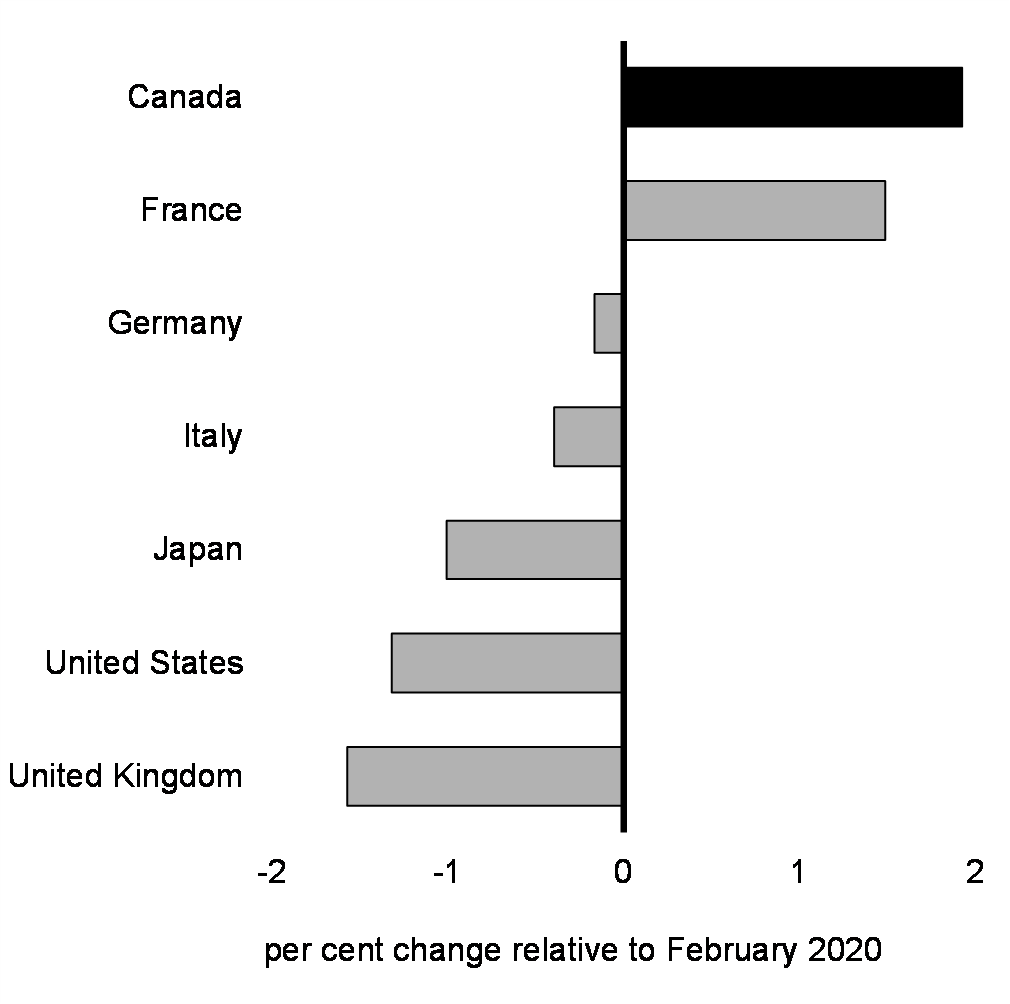
Canada’s labour market is emerging strongly from the fifth wave of the pandemic, with the economy adding nearly 340,000 new jobs in February—more than making up for January’s loss (Chart 2). Canada has seen the fastest jobs recovery in the G7 (Chart 3)—recouping 112 per cent of the jobs lost at the outset of the pandemic, compared with 90 per cent in the U.S.
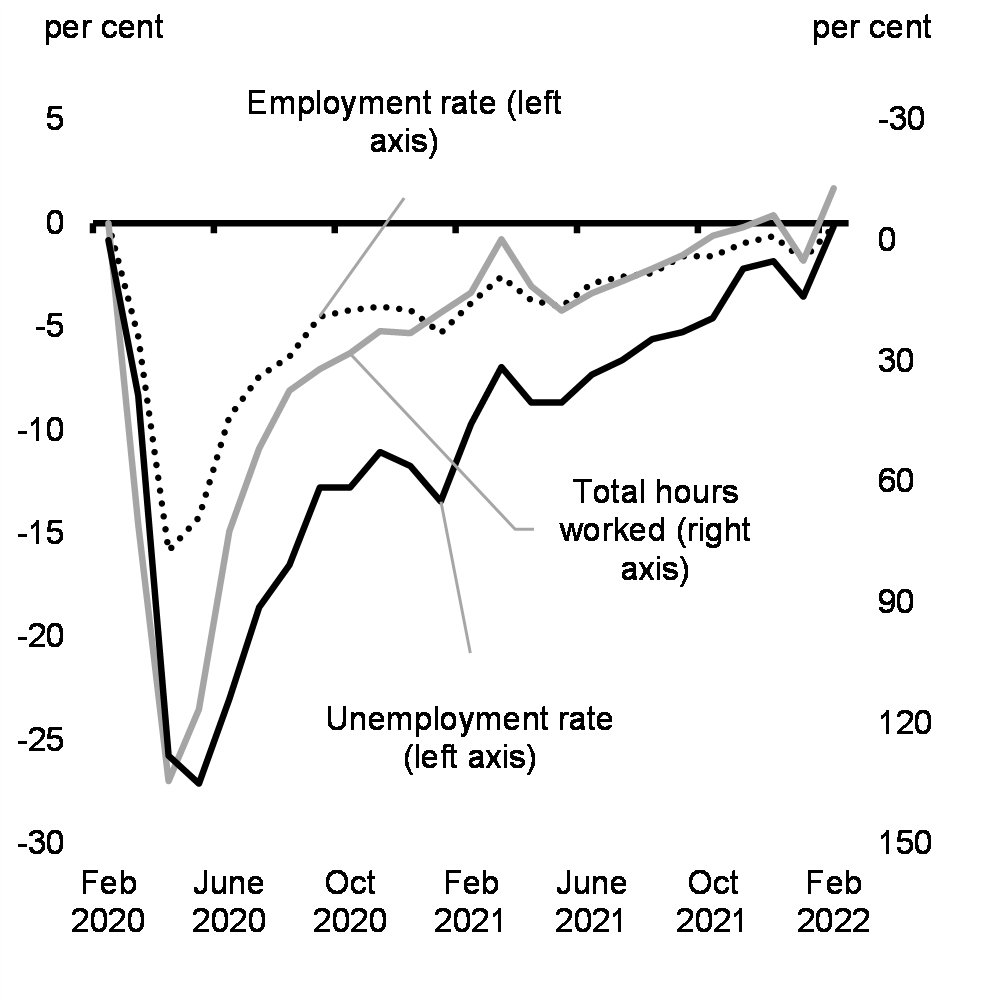
Employment in Canada

Change in Employment Across G7 Countries Relative to February 2020
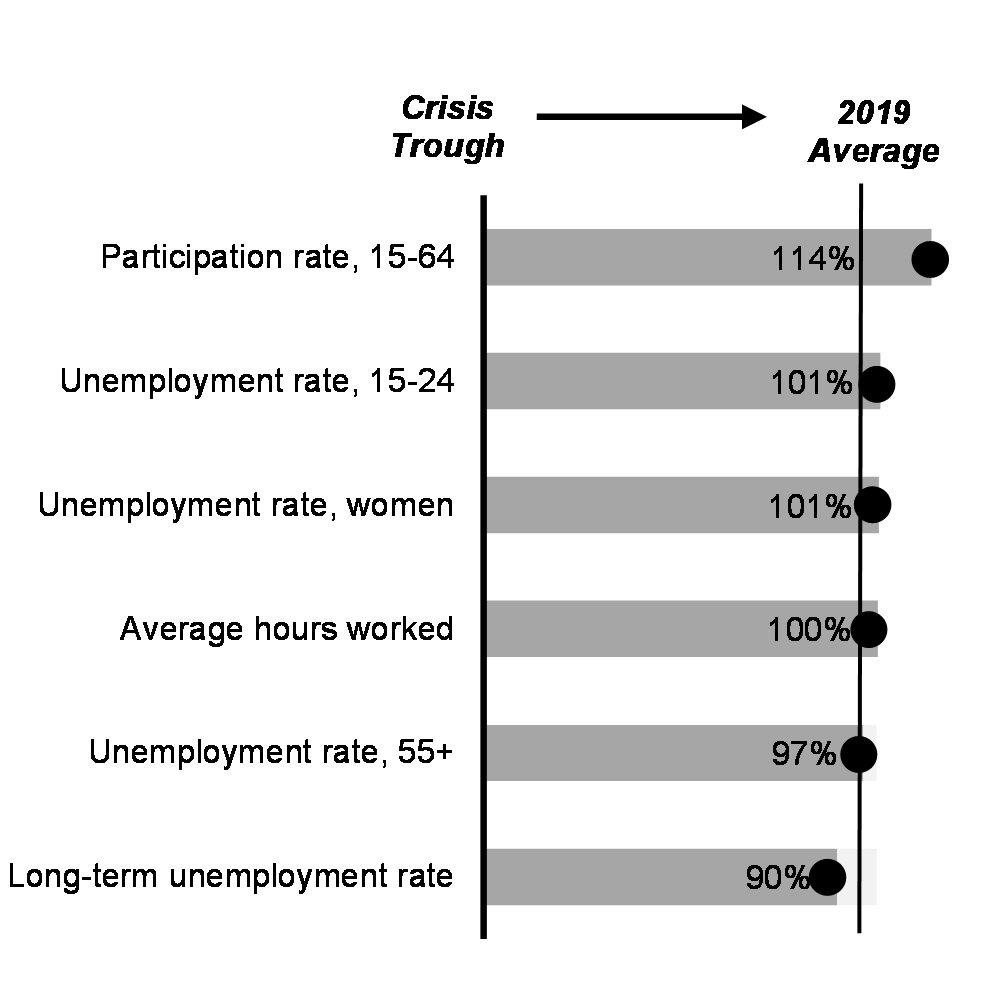
The February jobs report also means that all of Canada’s fiscal guardrails—from the unemployment rate, to employment rate, to actual hours worked—have effectively recovered to their pre-pandemic levels (Chart 4). Significant progress along many other labour market dimensions has also been made (Chart 5).
Change in Fiscal Guardrails Relative to February 2020
Progress in Other Key Labour Market Metrics Through February 2022
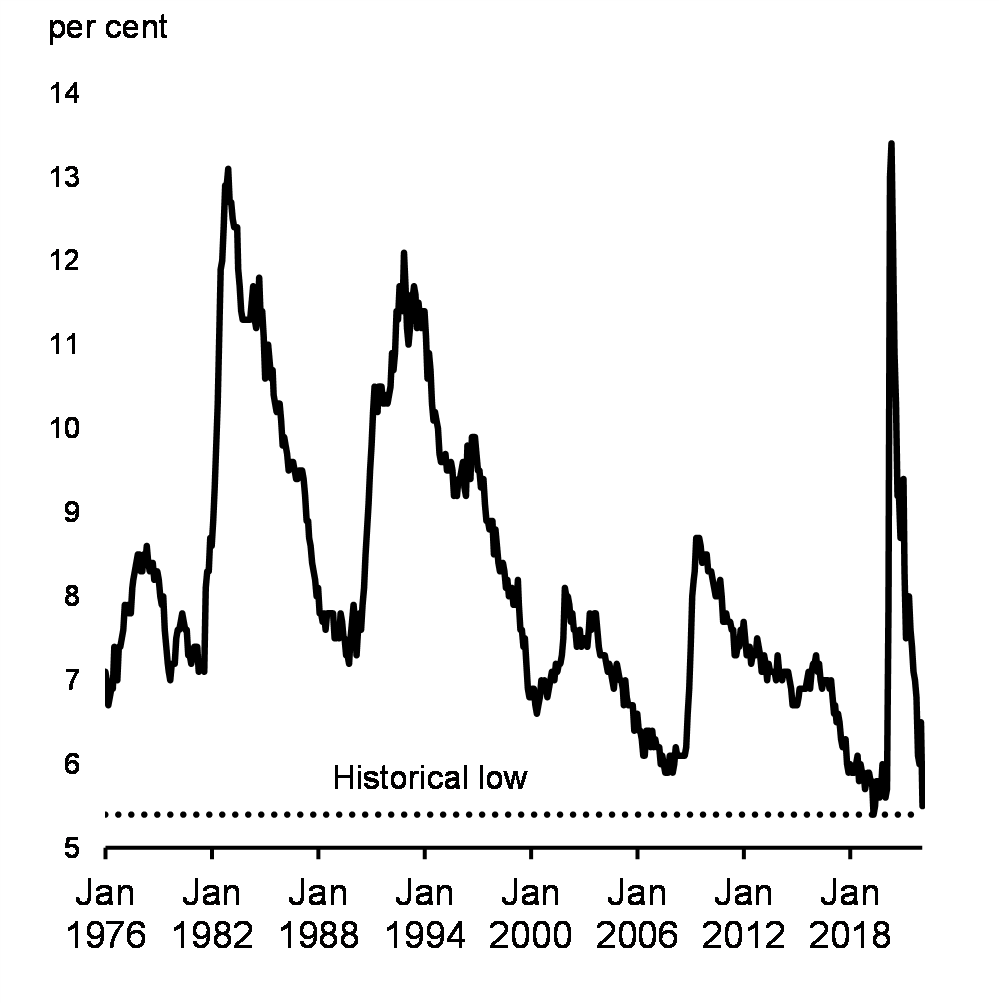
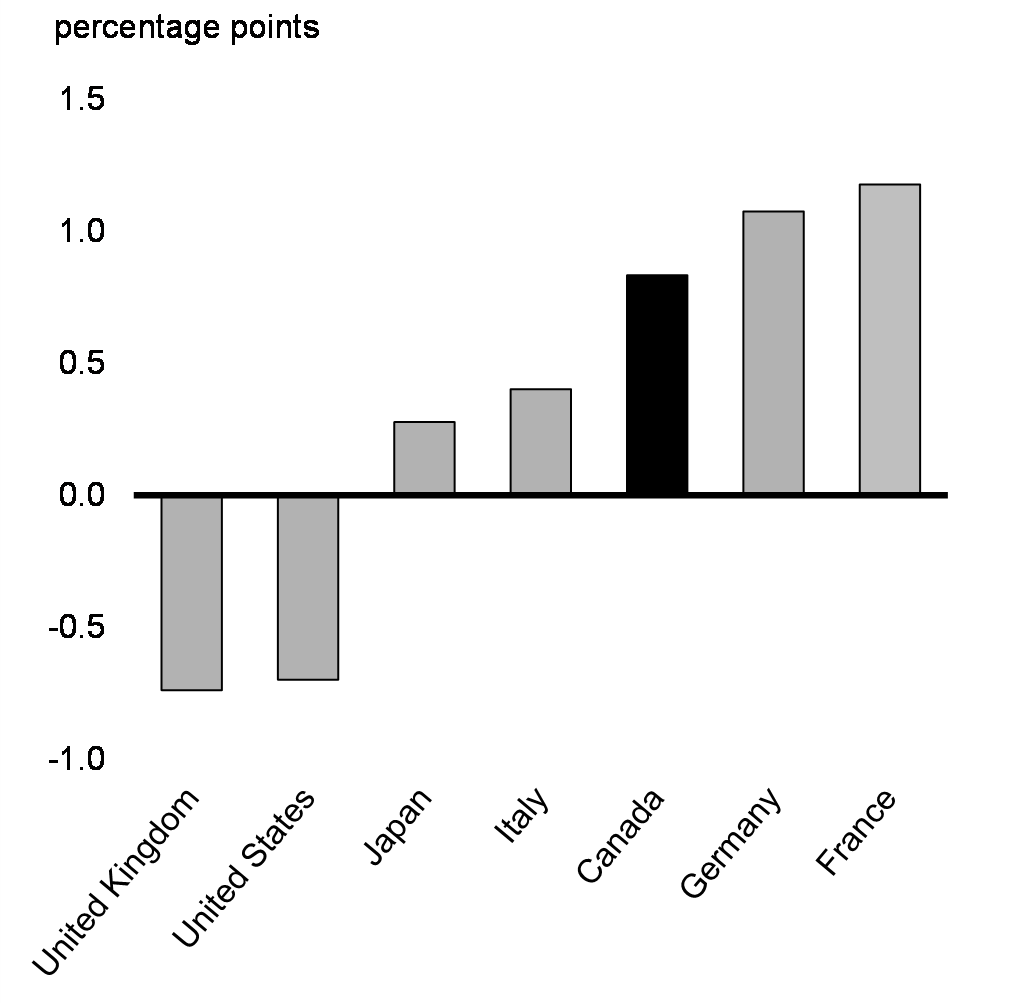
With February’s job gains, Canada’s unemployment rate dropped to 5.5 per cent, falling below its pre-pandemic level for the first time, and near the 50-year low of 5.4 per cent reached in May 2019 (Chart 6). While many advanced economies have seen significant declines in their unemployment rate, few have also experienced an increase in labour force participation to the extent Canada has (Chart 7).
Unemployment Rate
Change in the Labour Force Participation Rate Across G7 Countries Relative to 2019Q4
While tight labour markets are leading to improved opportunities for workers, it also creates significant and pressing challenges for businesses looking to hire more workers. Employers were actively recruiting for more than 900,000 jobs in the fourth quarter of 2021, pointing to continued strong labour demand and the potential for wage growth to increase further.
2. From Pandemic to Conflict
Russia’s Invasion Is Dragging Down Global Growth
The unprovoked and unjustified Russian invasion of Ukraine is a significant headwind for the global economic outlook. The economic damage risks becoming increasingly severe and long-lasting and the economic shockwaves from the war will be felt by consumers around the world through higher energy and food prices. These effects—along with disruptions to trade, tighter financial conditions, and fragile confidence—will contribute to a meaningful weakening of global economic growth if the conflict persists.
While Russia and Ukraine account for less than 2 per cent of global GDP, they are major suppliers of key commodities such as wheat, energy, potash, palladium, and nickel. As a result, the invasion of Ukraine—and the significant sanctions imposed on Russia’s economy—have jolted commodity markets with a surge in prices (Chart 8). With sanctions likely to remain for some time and a longer-term strategic shift away from Russian resources in some parts of the world, certain commodity prices are poised to remain elevated and volatile. Though higher commodity prices are leading to a surge in Canada’s terms of trade (the ratio of export prices to import prices), sharply higher prices risk causing hardship for many households and disrupting the production of goods and services worldwide (Chart 9). Europe in particular is highly dependent on Russian natural gas and crude oil.
Change in Selected Commodity Prices Since January 3, 2022

Commodity Prices and Canada’s Terms of Trade

The heightened level of uncertainty, along with deterioration of the global economic outlook, is also affecting investor and business confidence globally. This has translated into significant weakness in equity markets worldwide, with most major global stock market indices—especially those in Europe—still down from their peaks. The longer the Russia-Ukraine conflict lasts, the greater the downside will be.
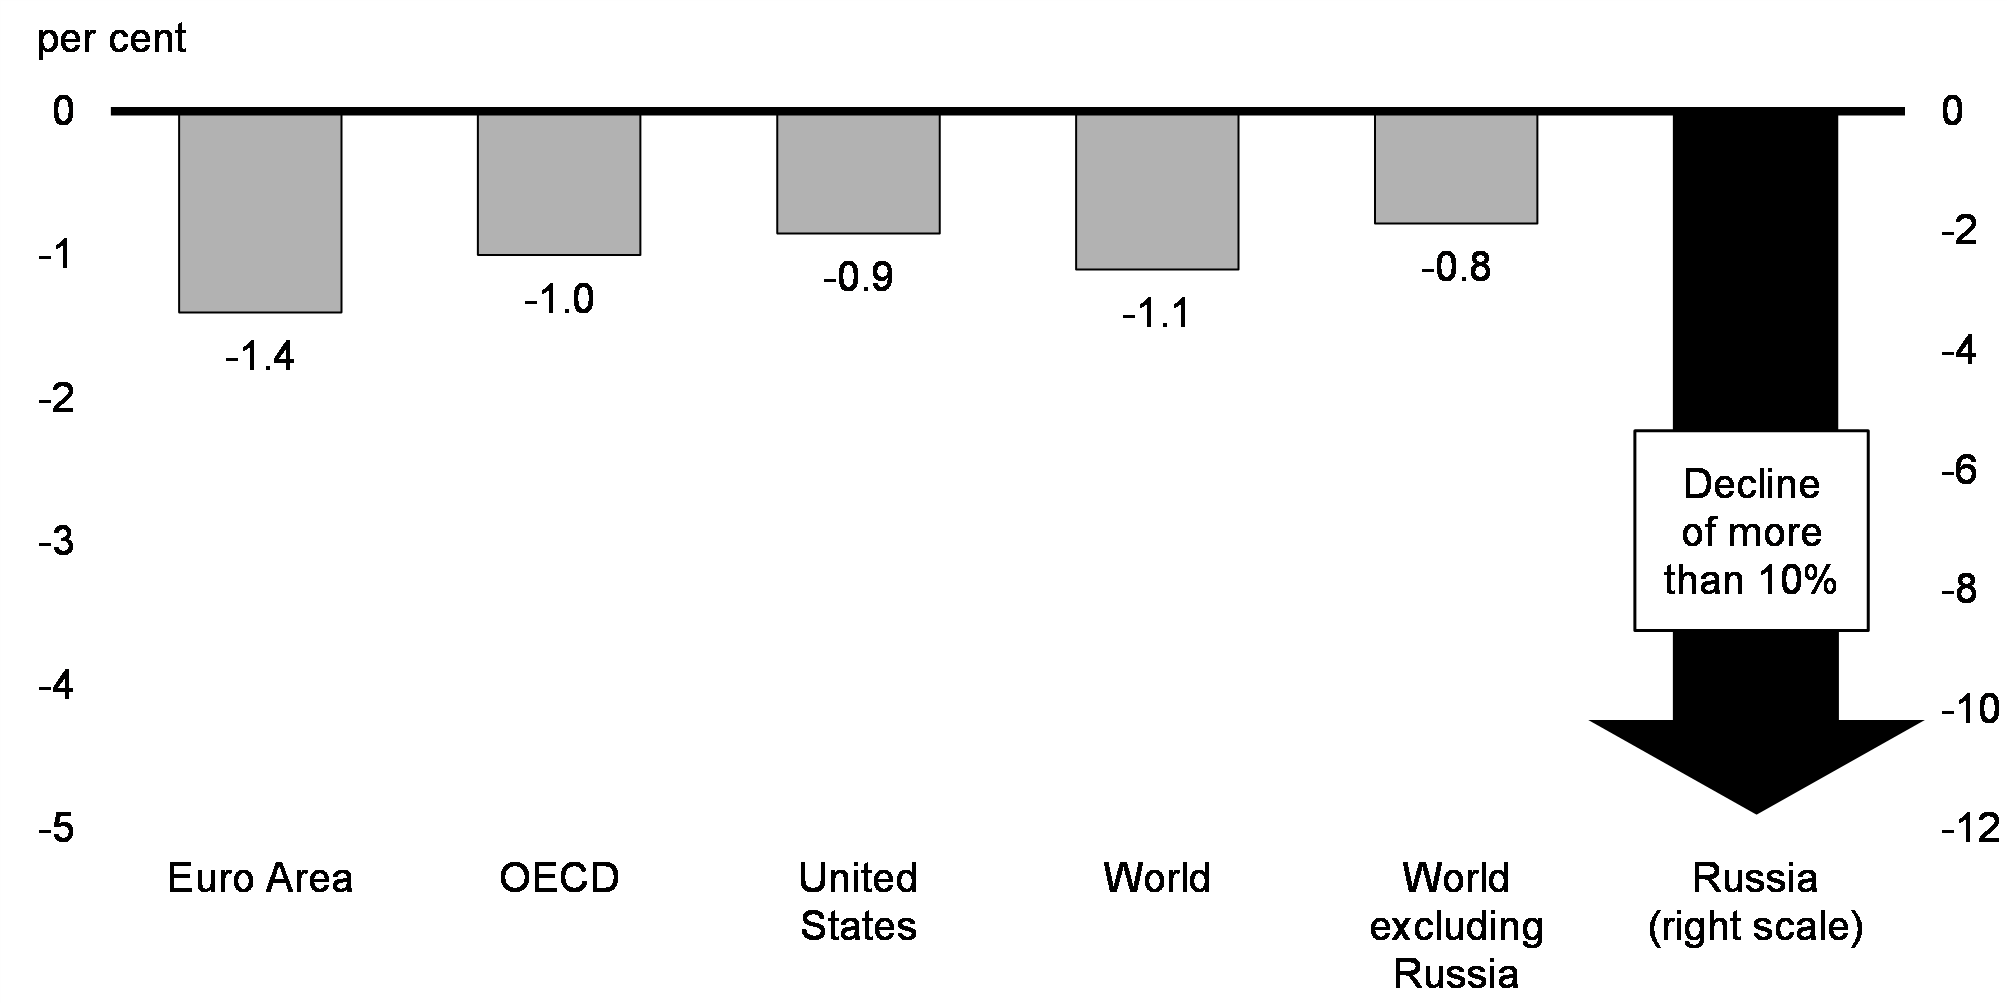
If recent moves in commodity prices and financial markets were to persist for a year, the Organisation for Economic Co-operation and Development (OECD) estimates that it could reduce global growth by more than 1 percentage point in the first year (Chart 10), while global inflation could be at least 2.5 percentage points higher. The economic impact will vary heavily by region. In Russia, the conflict along with the direct blow from significant economic and financial sanctions, could lead the economy to suffer a severe recession. Given close trade ties and financial links to Russia and Ukraine, the euro area is likely to be one of the most affected regions, with its real GDP expected to be reduced by 1.4 per cent over the first full year after the start of the conflict.
As a commodity producer with limited economic ties to Russia, Canada is more insulated from the crisis than other countries. While weaker global growth and much higher commodity prices will reduce consumers’ purchasing power and push up costs for businesses, Canada also stands to benefit from the positive impact on Canada’s terms of trade and from being able to export commodities now in short supply. The impact of the conflict on economic activity in Canada cannot be definitively predicted, but deep uncertainty emanating from the conflict points to risks tilted to the downside.
Impact on Real GDP in a First Full Year of the Russian Invasion of Ukraine
High Global Inflation and the Outlook for Canada
While inflation is a global challenge, the impacts on Canadians are real. The majority of Canadians remain concerned about the cost of living. As a first line of defence, many of the direct income supports that financially vulnerable Canadians rely on are automatically adjusted to inflation. Further, the government is taking crucial steps to help make life more affordable for more Canadians, while investing to grow the economy and create jobs – the best sustainable route to rising living standards in the long-run.
Making Life More Affordable
Making life more affordable is one of the government’s primary goals in Budget 2022. In the long run, this will require addressing long-standing, structural challenges to deliver meaningful improvements in living standards for more Canadians.
In the near term, Canadians can be confident that they have access to support when they need it most. Since 2015, the government has delivered real improvements to make Canadians’ lives more affordable, including:
- Making an historic investment of $30 billion over five years to build a Canada-wide early learning and child care system in collaboration with provinces, territories, and Indigenous partners. By the end of 2022, child care fees will have been reduced by an average of 50 per cent, and by 2025-26, the average child care fee for all regulated child care spaces across Canada will be $10 a day;
- Introducing the Canada Child Benefit, which will provide up to $6,833 per child to Canadian families this year, and has helped 435,000 children out of poverty since 2015;
- Expanding the Canada Workers Benefit to support an estimated one million additional Canadians, which could mean 1,000 more per year for a full-time, minimum-wage worker;
- Increasing the federal minimum wage to $15.55 per hour;
- Implementing a ten per cent increase to the maximum GIS benefit for single seniors, and reversing the announced increase to the eligibility for OAS and GIS back to age 65 from 67;
- Providing ten days of paid sick leave for all federally regulated private sector employees;
- Increasing Climate Action Incentive payments, which puts more money in the pockets of eight out of every ten people in the provinces where the federal system applies, and means a family of four in will receive, for 2022-2023, $745 in Ontario, $832 in Manitoba, $1,101 in Saskatchewan and $1,079 in Alberta; and,
- Making post-secondary education more affordable by waiving interest on Canada Student Loans until March 2023 and enhancing repayment assistance to ensure that no person making $40,000 or less will need to make payments on their federal student loans going forward.
Budget 2022 also includes a range of measures that will help to bring down the cost of living, including:
- $5.3 billion to provide dental care for Canadians with family incomes of less than $90,000 annually, starting with under 12 years-olds in 2022, expanding to under 18 years-olds, seniors and persons living with a disability in 2023, with full implementation by 2025;
- Doubling support provided through the First Time Home Buyers’ Tax Credit from $750 to $1,500;
- Introducing a Multigenerational Home Renovation Tax Credit, which provides up to $7,500 in support for constructing a secondary suite; and,
- $475 million in 2022-23 to provide a one-time, $500 payment to those facing housing affordability challenges.
Budget 2022 also includes a comprehensive plan to make housing more affordable, focused on doubling the rate of new builds over the next decade, while introducing measures to help Canadians buy their first home, protect buyers and renters, and curb foreign investment and speculation.
Key government benefits are also adjusted for inflation over time, including, among others, Old Age Security (OAS), the Guaranteed Income Supplement (GIS), the Canada Child Benefit, and the GST Credit.
Looking ahead, Budget 2022 redoubles the government’s focus on expanding Canada’s economic capacity with investments to create jobs and boost growth through innovation and skills development; facilitate the transition to a low-carbon economy by encouraging private sector investments and targeting major sources of emissions; drive innovation and business growth; and make our cities more competitive by expanding the supply of housing. These investments will provide the foundation for boosting Canada’s long-term growth and creating good-paying jobs— the best way to make life affordable for years to come.
Even before the invasion of Ukraine, elevated inflation was undermining consumer and business confidence around the world. Economists have had to repeatedly revise their forecasts as global inflation has proven to be stronger and more persistent than anticipated. In advanced economies, inflation has now reached levels not seen in decades. This is creating uncertainty about how quickly—and at what cost—central banks can rein in inflation.
The current global concern over inflation comes after decades during which inflation was very low. Several factors have driven inflation up, including higher food and energy prices, supply constraints associated with the pandemic, and unprecedented demand for goods. In many advanced economies, inflation pressures have started to broaden as wage pressures build in a context marked by tight labour markets.
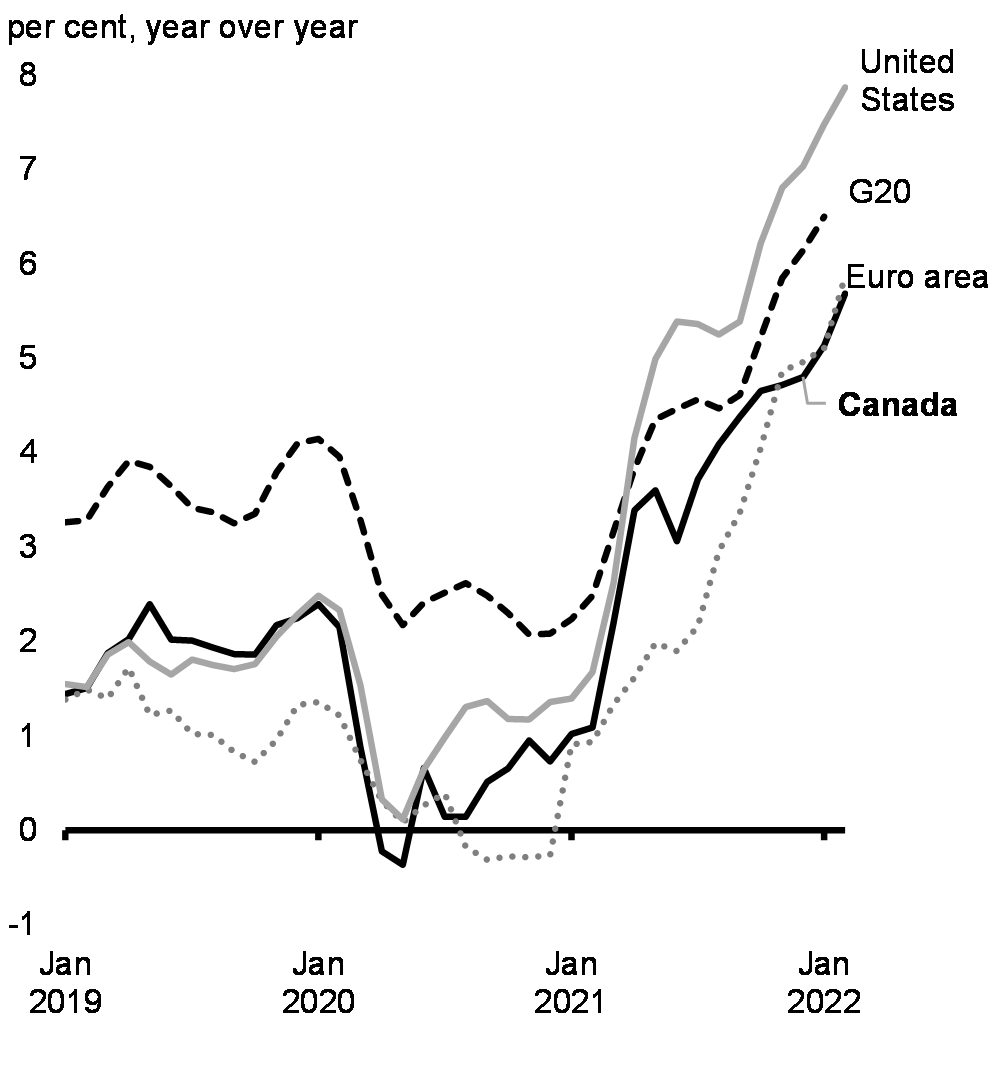
While inflation in Canada is more moderate than in some other countries, total consumer price inflation reached 5.7 per cent year-over-year in February—the highest level since August 1991 (Chart 11). In addition to global pressures on the prices of goods, strong demand for housing—combined with limited supply—has also led to surging house prices (Chart 12). Canadians are facing higher-than-expected costs of living which is putting the squeeze on household finances across the country—and could lead to lower economic activity and confidence over time.
Consumer Price Inflation in Select Economies
Deviation of Consumer Price Inflation From Its Long-Term Average, Canada

A rebalancing of global demand towards services—after pandemic-related public health measures saw people redirect their spending heavily towards goods—along with the easing of supply bottlenecks should help to reduce global inflationary pressures over the course of the year. However, the Russian invasion of Ukraine is causing higher prices for food, energy, and other key commodities. In addition, a resurgence of COVID-19 in China has led to lockdowns that are disrupting global manufacturing supply chains once again. As a result, uncertainty remains about the outlook for inflation.
In response to these pressures, central banks—including the Bank of Canada and the U.S. Federal Reserve—have begun to withdraw monetary stimulus. The Bank of Canada has been clear that it will use its monetary policy tools to return inflation to the 2 per cent target and keep inflation expectations well-anchored. Inflation is expected to be broadly in line with the Bank of Canada’s 2 per cent inflation target in 2023.
Housing Supply Challenges and Affordability
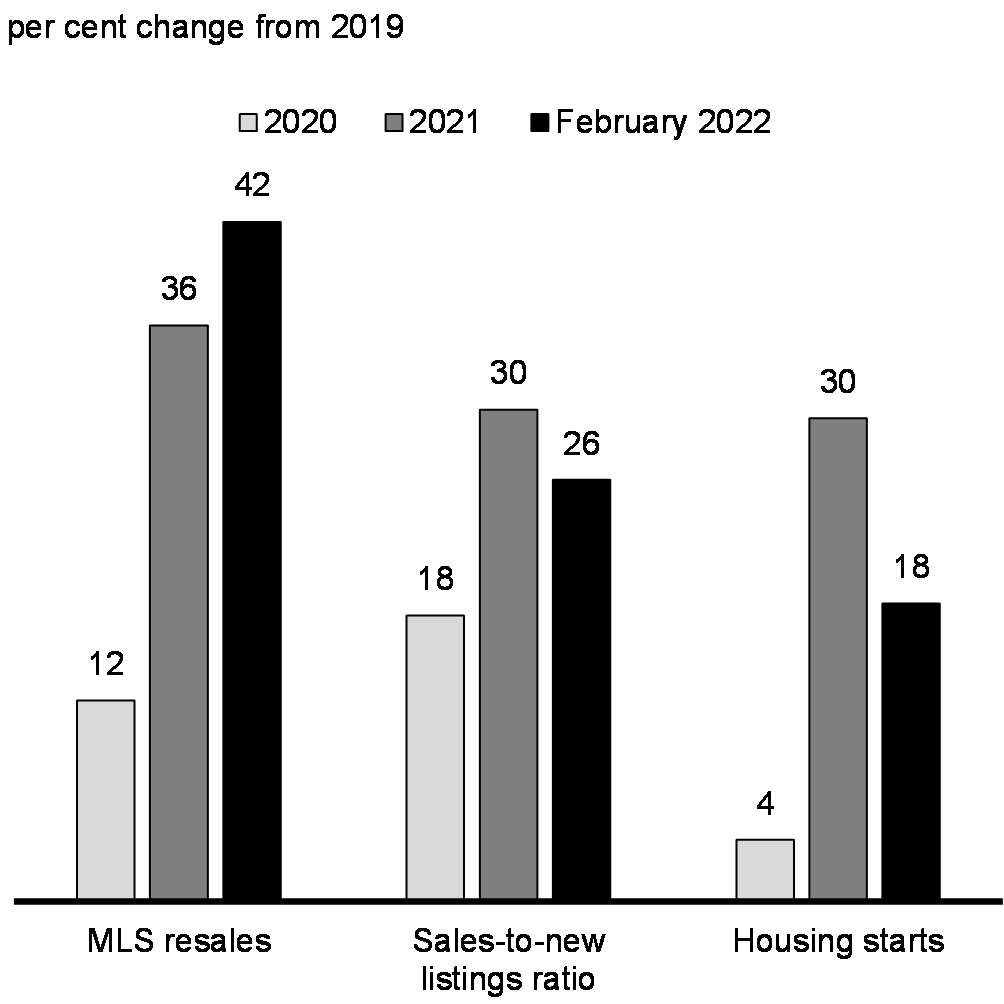
Housing demand has been very strong during the pandemic, which was the result of low borrowing costs combined with people’s desire for more space as they worked from home. Though builders have responded with new residential construction rising well above pre-pandemic levels, housing supply has been unable to keep up with demand (Chart 13).
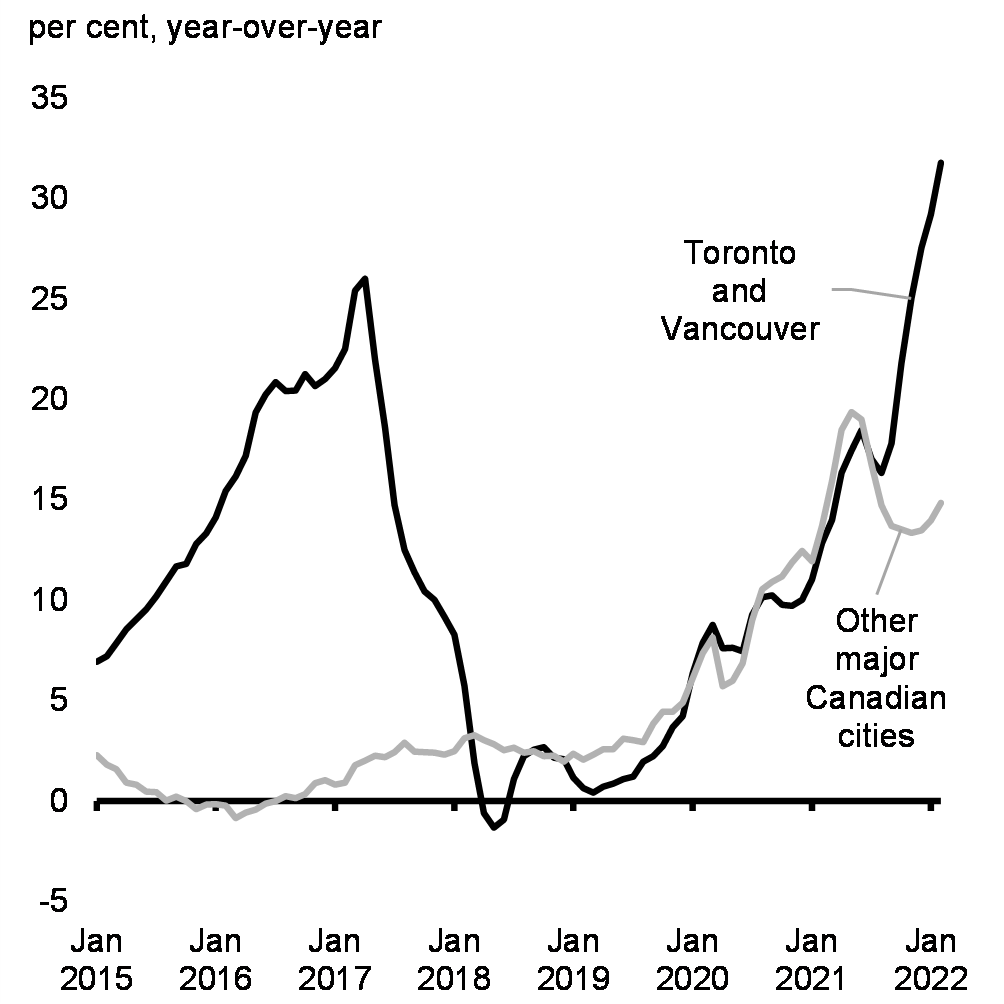
With inventories at record lows, house prices have rapidly increased across the country (Chart 14), making affordability a real concern. British Columbia and Ontario have endured longstanding supply constraints and prospective home buyers in those markets are facing the most acute affordability challenges; Toronto in particular has recently seen the largest increases in house prices since 2015. Rental markets are facing similar challenges with constrained supply putting pressure on rents.
Looking ahead, housing demand is expected to ease as interest rates rise and the pandemic-related boost in demand fades. In combination with the increase in new construction, this will help to slow house price growth. However, it will take years of strong supply growth to address the very real affordability challenges Canadians in many regions are facing. The federal government is working with all orders of government to increase supply and address the issues of housing affordability. As outlined in Chapter 1, Budget 2022 makes a series of significant investments to help jump start the construction of more affordable homes.
Changes in Key Measures of Housing Activity
House Price Growth
3. Budget 2022 Economic Environment
Survey of Private Sector Economists
The Department of Finance Canada surveyed the group of private sector economists in early February 2022. The average of private sector forecasts has been used as the basis for economic and fiscal planning since 1994, helping to ensure objectivity and transparency, and introducing an element of independence into the government’s economic and fiscal forecast.
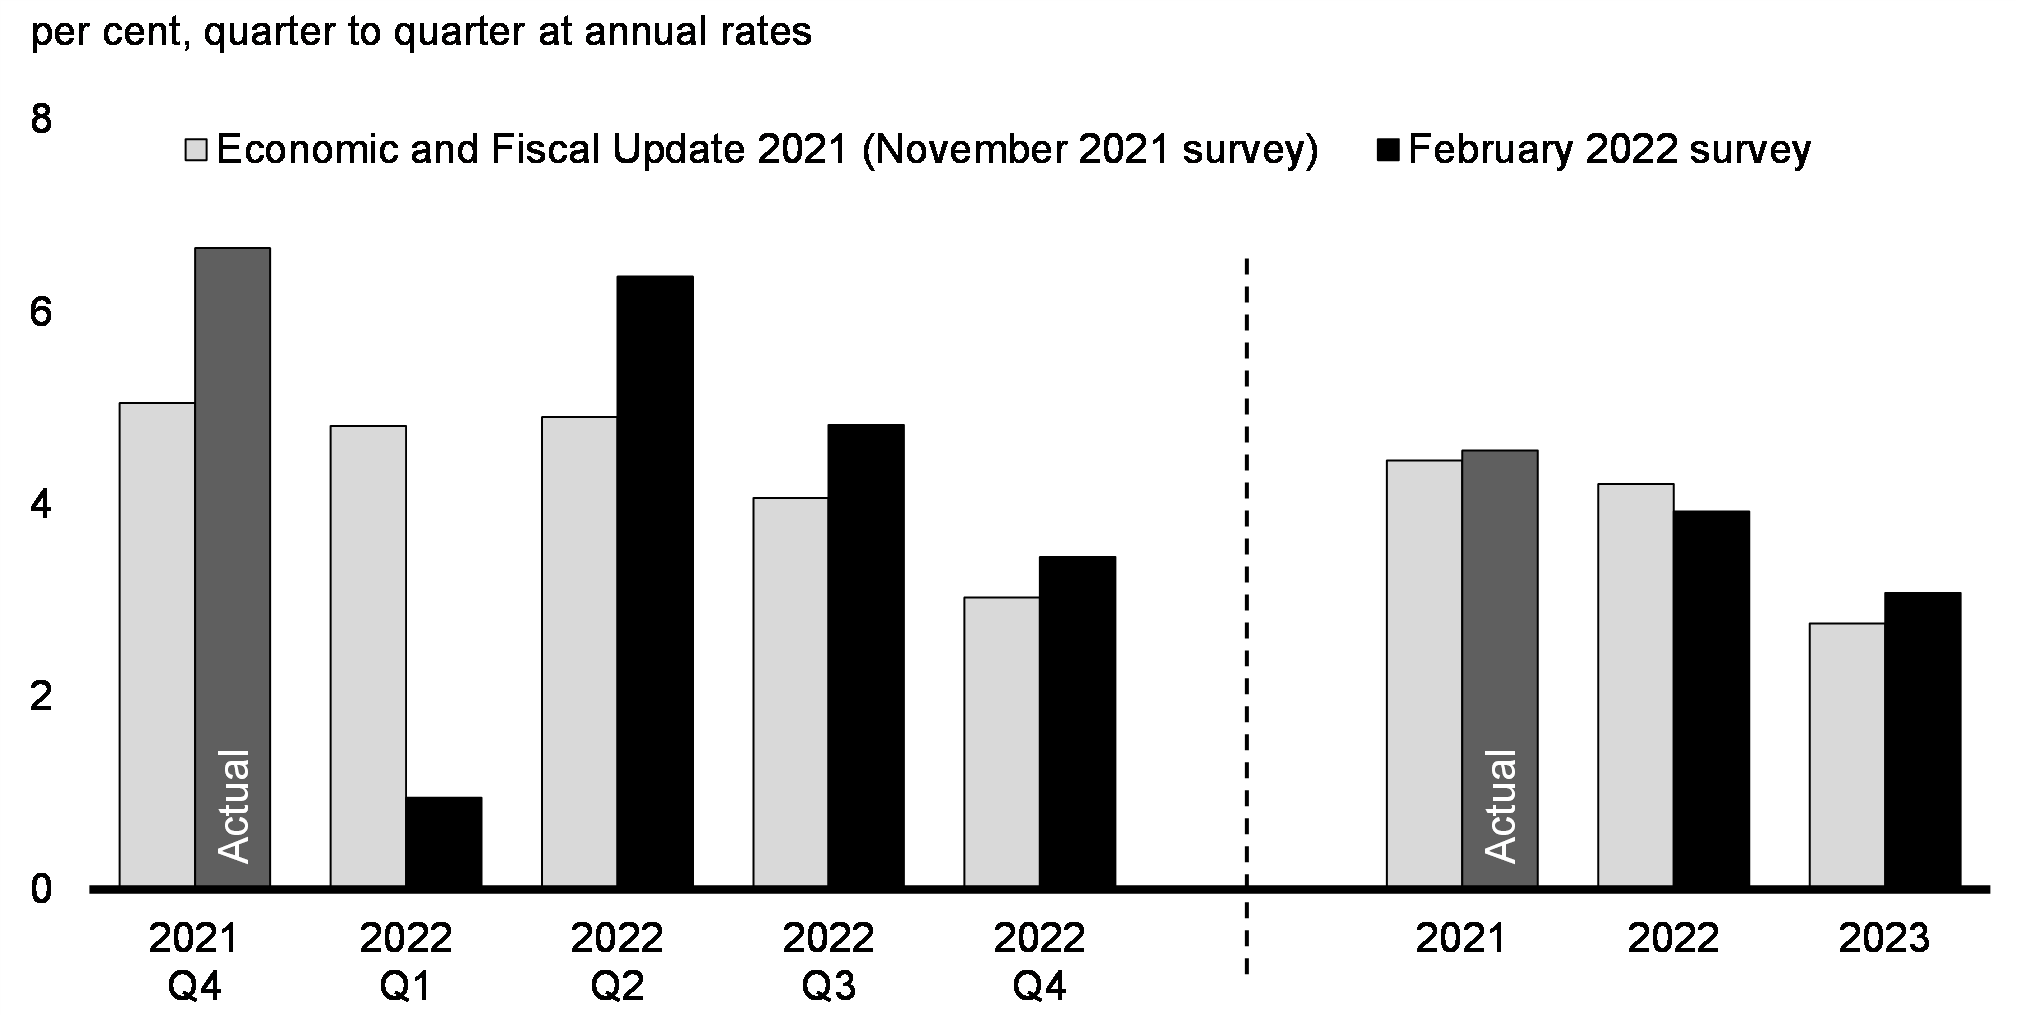
Following a strong rebound of 4.6 per cent in 2021, real GDP was expected to grow by a still solid 3.9 per cent in 2022 (down from 4.2 per cent in the 2021 Economic and Fiscal Update) and by 3.1 per cent in 2023 (up from 2.8 per cent in the 2021 Economic and Fiscal Update) (Chart 15 and Chart 16).
Real GDP Growth Projections
Significantly stronger-than-expected GDP inflation—driven by consumer price inflation and commodity prices—provided a material boost to the expected level of nominal GDP (the broadest measure of the tax base), which was up by an average of roughly $41 billion per year over the forecast horizon in the February 2022 survey compared to the 2021 Economic and Fiscal Update (Chart 17). Importantly, Canada’s nominal GDP continues to outperform expectations, as it has over the course of the recovery from the pandemic.
Real GDP Projections

Nominal GDP Projections

Budget 2022 Economic Scenario Analysis
The macroeconomic inputs of the February 2022 survey continue to provide a reasonable basis for fiscal planning (see Annex 1 for details of the economic and fiscal planning framework). However, the outlook is clouded by a number of key uncertainties, including the impact of Russia’s illegal invasion of Ukraine; the impact on supply chains due to the COVID-19 resurgence in China; the effects of supply and labour shortages on inflation; and the impact of rising interest rates on the Canadian economy.
The Department of Finance actively engages with external economists to assess risks and uncertainties to the outlook. Throughout March, the Department closely tracked evolving external views and forecasts. This information was used to inform two alternative economic scenarios that illustrate the effects of unusually high uncertainty around the illegal Russian invasion of Ukraine and its spillovers:
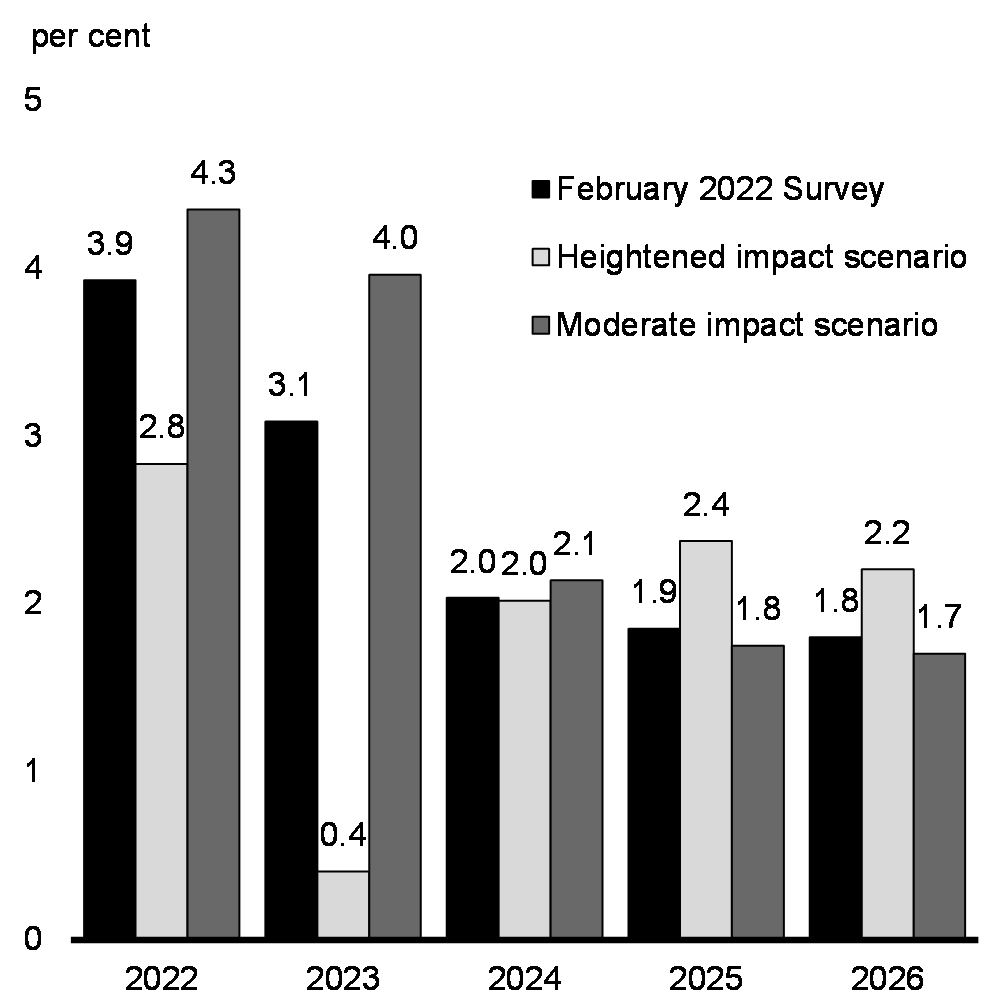
Heightened Impact Scenario – considers the economic repercussions of a drawn-out crisis in Ukraine with elevated commodity prices, prolonged supply-chain disruptions, and more rapid monetary policy tightening. A reduction in Russian energy exports leads to a spike in commodity prices, while pandemic-related lockdowns in parts of the world exacerbate supply-chain issues, leading to temporarily stronger inflation. In response to higher inflation, global interest rates rise higher and more quickly than expected, with Canada’s three-month treasury bill rate up by almost 50 basis points on average per year compared to the February 2022 survey. Higher energy bills and weaker confidence substantially reduce consumption while supply shortages and trade disruptions hold back activity, leading to a sharp slowdown in global economic growth and a subsequent moderation in global crude oil prices.
Overall, real GDP growth in Canada is 0.6 percentage point lower on average per year (Chart 18), and the unemployment rate is 0.5 percentage point higher on average as a result of adverse effects on confidence and sharply lower global demand.
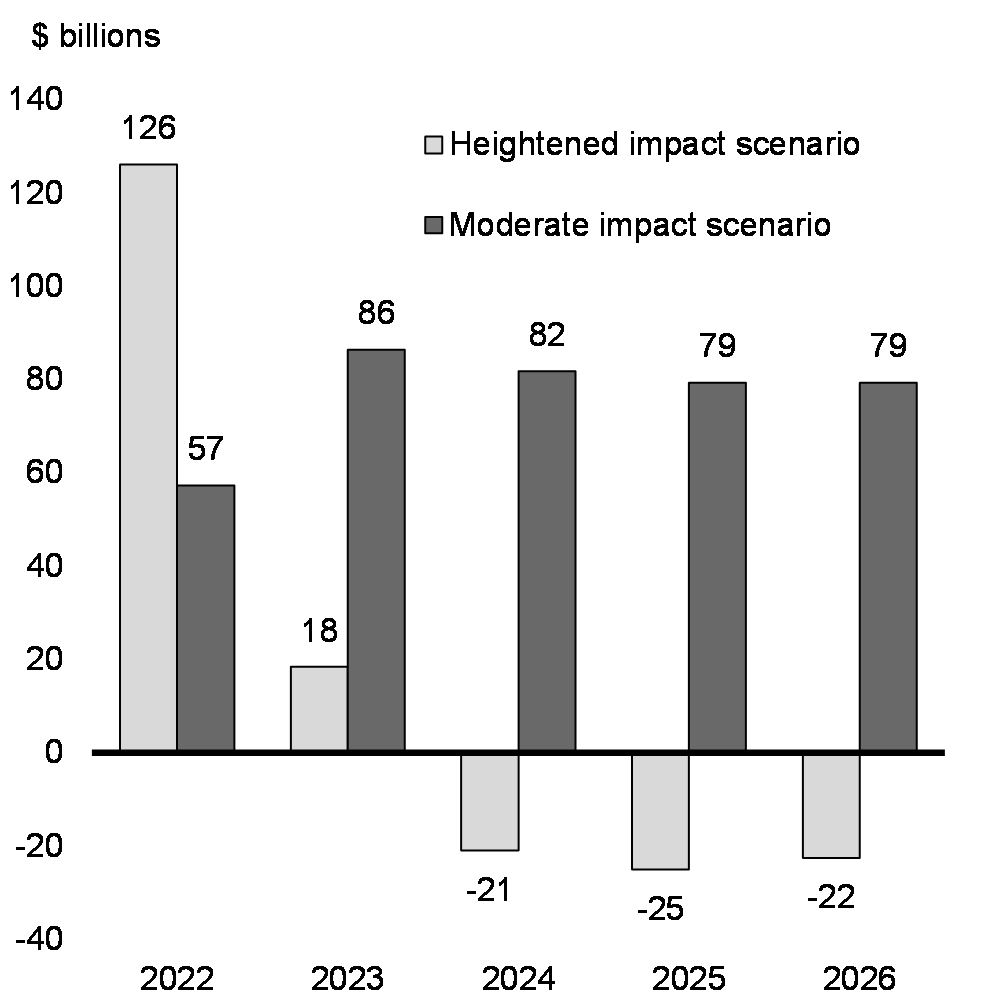
Higher inflation pushes up nominal GDP in the near term before falling below the February survey in 2024 amid easing commodity prices and much weaker growth.Initially, nominal GDP is $126 billion higher than the February survey in 2022, but this improvement shrinks to $18 billion in 2023 and falls below the February survey level by $23 billion on average over the last three years of the forecast horizon as inflation falls (Chart 19).
Moderate Impact Scenario – considers a de-escalation of tensions in Ukraine and a world in which supply disruptions from the war and pandemic are smaller than expected while global demand remains resilient along with an easing of geopolitical tensions. The global economy successfully adapts to COVID-19 risks and pivots to more secure commodity suppliers, reducing global inflationary pressures. At the same time, Canadian commodity producers make full use of current spare capacity and increase investment, albeit not commensurate to the rise in energy prices. This provides a boost to economic growth. Higher interest rates (up by 20 basis points on average per year compared to the February 2022 survey), combined with easing of supply-chain pressures, bring inflation closer to the 2 per cent target without derailing the economic expansion.
Altogether, the recovery is stronger than the February survey, supported by Canada’s strong fundamentals. While commodity prices and inflation are below the downside scenario, they remain well above the February survey, especially in the near term. With higher commodity prices and better economic prospects, nominal GDP is $77 billion higher than the February survey on average per year over the forecast horizon.
Real GDP Growth
Nominal GDP Level Difference With February 2022 Survey Outlook
Details on these scenarios are outlined in Annex 1. Estimated fiscal impacts associated with these scenarios are illustrated below.
4. Budget 2022 Fiscal Framework
A Responsible Fiscal Plan
Over the course of the pandemic, the federal government deployed one of the most effective response plans in the world to protect Canadian workers and businesses. Approximately eight out of every ten dollars invested to support Canadians and fight COVID-19 has come from the federal government.
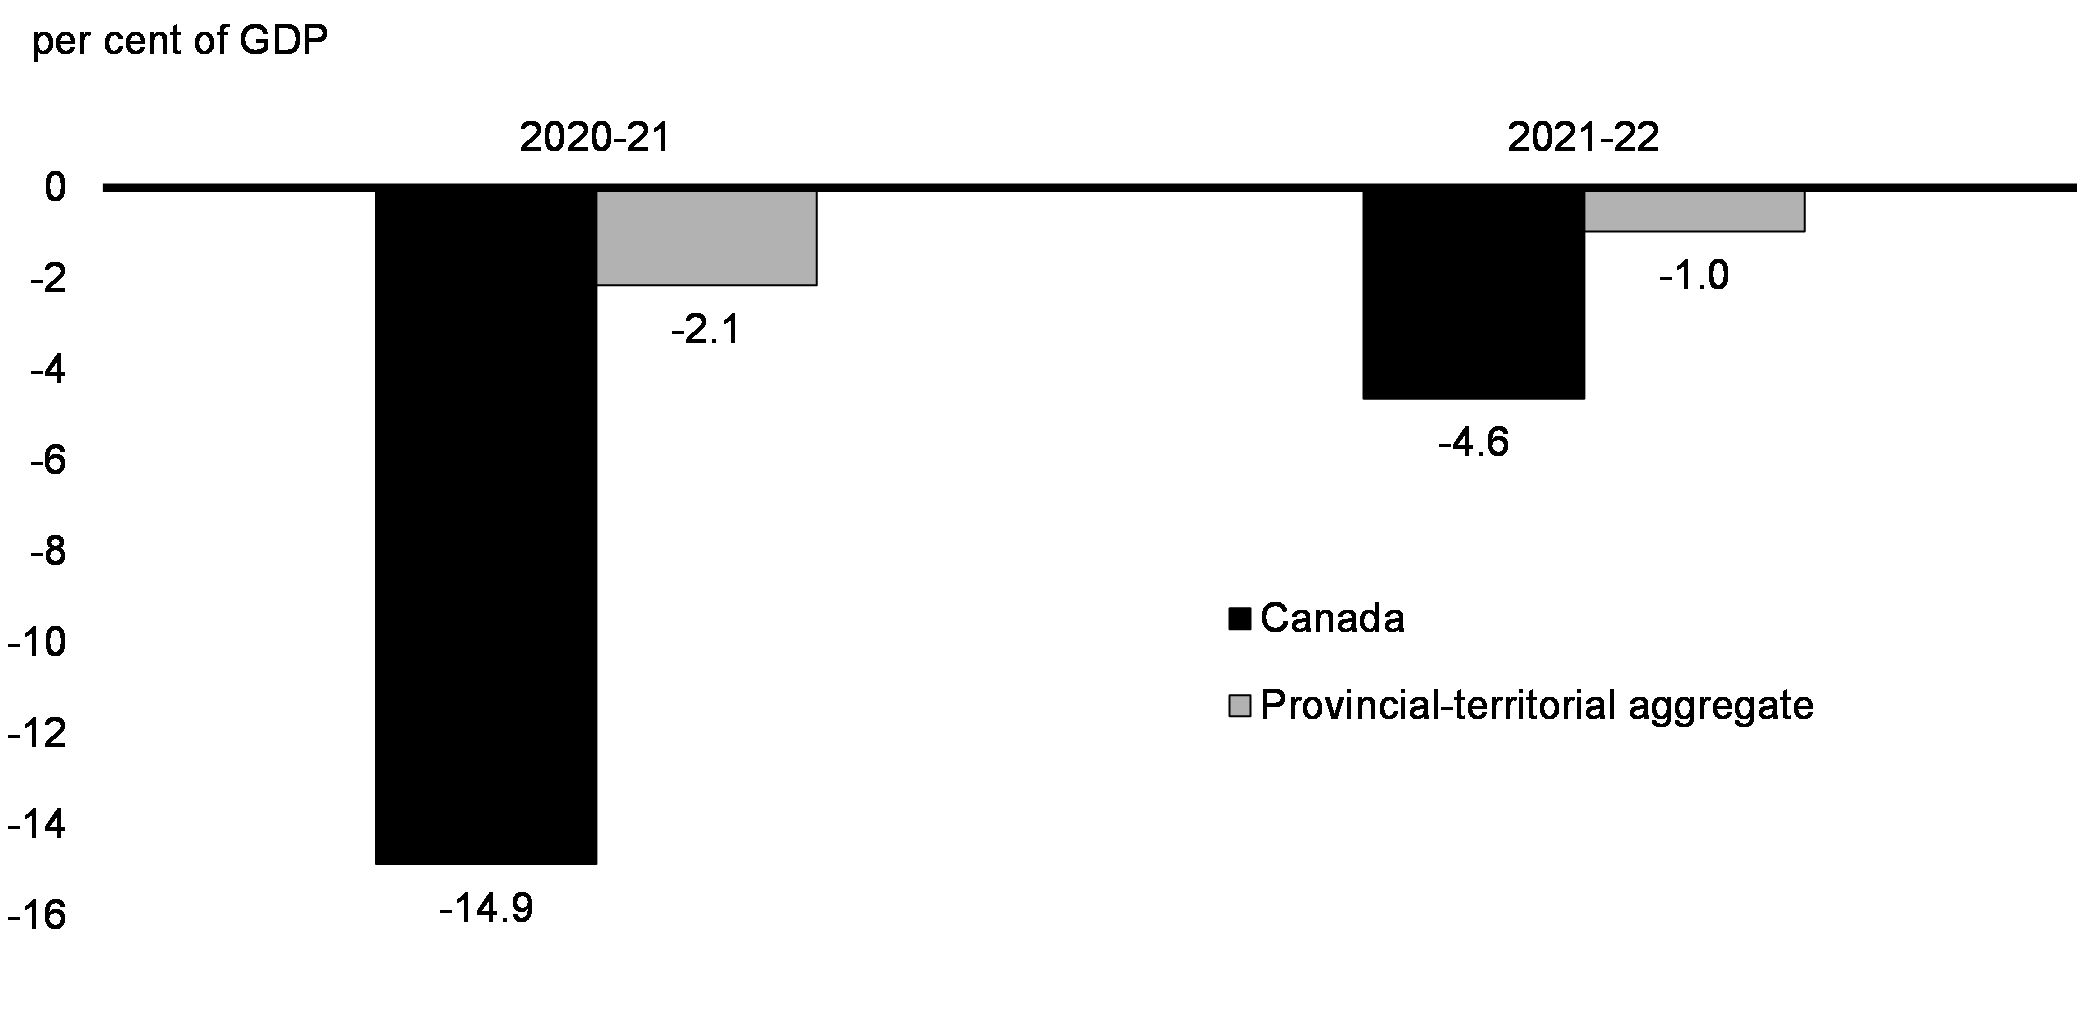
This response saved lives and kept Canada’s economy afloat—while also limiting the debt and deficits of Canada’s provinces and territories. Provincial and territorial governments continued to significantly outperform fiscal projections for 2021-22. Fiscal results to date show that the aggregate provincial-territorial deficit was less than one-third of what was expected at the time of 2021 budgets, a much larger improvement than at the federal level. As a result, the aggregate provincial-territorial balance is expected to have declined to just 1 per cent of GDP in 2021-22 (Chart 20).
Budgetary Balances, Canada and Provincial-Territorial Aggregate
The significant investments the federal government made have worked. And the Canadian economy’s recovery has been swift and strong. But these were, and must remain, emergency measures. Budget 2022 firmly pivots the government’s focus from broad-based emergency COVID-19 expenditures—and towards targeted investments that will build Canada’s economic capacity, prosperity, resilience, and security in two ways:
- First, it reinvests significantly in areas that will expand our economic capacity and productivity to drive long-term growth. These include housing, early learning and child care, skills, immigration, fighting climate change, supply chains, business innovation and research and development (R&D).
- Second, it takes responsible steps to review government spending, with the intention of finding opportunities for both savings and reallocation to other post-pandemic priorities that will support long-term growth and prosperity without creating inflationary pressures, as described in Chapter 9.
| Projection | ||||||
|---|---|---|---|---|---|---|
| 2021– 2022 |
2022– 2023 |
2023– 2024 |
2024– 2025 |
2025– 2026 |
2026– 2027 |
|
| Budgetary balance – EFU 2021 | -144.5 | -58.4 | -43.9 | -29.1 | -22.7 | -13.1 |
| Economic and fiscal developments since EFU 2021 |
36.1 | 14.3 | 11.7 | 7.5 | 8.5 | 7.4 |
| Budgetary balance before policy actions and measures |
-108.5 | -44.1 | -32.3 | -21.6 | -14.2 | -5.8 |
| Policy actions since EFU 2021 | -3.1 | -1.3 | -0.6 | 0.6 | 0.4 | 0.3 |
| Budget 2022 measures (by chapter) |
||||||
| 1. Making Housing More Affordable | -0.7 | -2.0 | -2.2 | -2.1 | -2.2 | -1.0 |
| 2. A Strong, Growing, and Resilient Economy |
0.0 | -0.3 | -1.4 | -1.2 | -1.3 | -1.3 |
reprofiling infrastructure investments |
0.1 | 0.2 | 0.8 | 1.2 | 2.0 | 2.1 |
| 3. Clean Air and Strong Economy | 0.0 | -1.3 | -2.2 | -3.0 | -2.9 | -3.0 |
| 4. Creating Good Middle Class Jobs | 0.0 | -0.8 | -1.3 | -1.4 | -1.2 | -1.2 |
| 5. Canada’s Leadership in the World | 0.0 | -1.7 | -1.5 | -1.9 | -2.0 | -2.3 |
| 6. Strong Public Health Care | -1.3 | -0.7 | -0.8 | -1.3 | -1.4 | -1.6 |
| 7. Moving Forward on Reconciliation | -0.2 | -2.5 | -2.0 | -1.9 | -1.9 | -2.0 |
| 8. Safe and Inclusive Communities | 0.0 | -0.2 | -0.4 | -0.4 | -0.3 | -0.3 |
| 9.1 Tax Fairness | 0.0 | 2.0 | 3.3 | 3.6 | 3.7 | 3.9 |
| 9.2 Effective Government | 0.0 | 0.0 | 0.7 | 1.7 | 2.7 | 3.7 |
| Total – Budget 2022 measures | -2.2 | -7.4 | -7.1 | -6.7 | -4.8 | -3.0 |
| Budgetary balance | -113.8 | -52.8 | -39.9 | -27.8 | -18.6 | -8.4 |
| Budgetary balance (% of GDP) | -4.6 | -2.0 | -1.4 | -0.9 | -0.6 | -0.3 |
| Federal debt (% of GDP) | 46.5 | 45.1 | 44.5 | 43.8 | 42.8 | 41.5 |
| Heightened Impact Scenario | -113.8 | -39.5 | -43.7 | -41.1 | -32.2 | -21.1 |
| Budgetary Balance (%GDP) | -4.6 | -1.4 | -1.5 | -1.4 | -1.1 | -0.7 |
| Federal debt (%GDP) | 46.5 | 42.6 | 43.9 | 44.2 | 43.7 | 42.8 |
| Moderate Impact Scenario | -113.8 | -48.2 | -31.3 | -21.6 | -13.2 | -2.7 |
| Budgetary Balance (%GDP) | -4.6 | -1.8 | -1.1 | -0.7 | -0.4 | -0.1 |
| Federal debt (%GDP) | 46.5 | 44.0 | 42.7 | 41.9 | 40.9 | 39.5 |
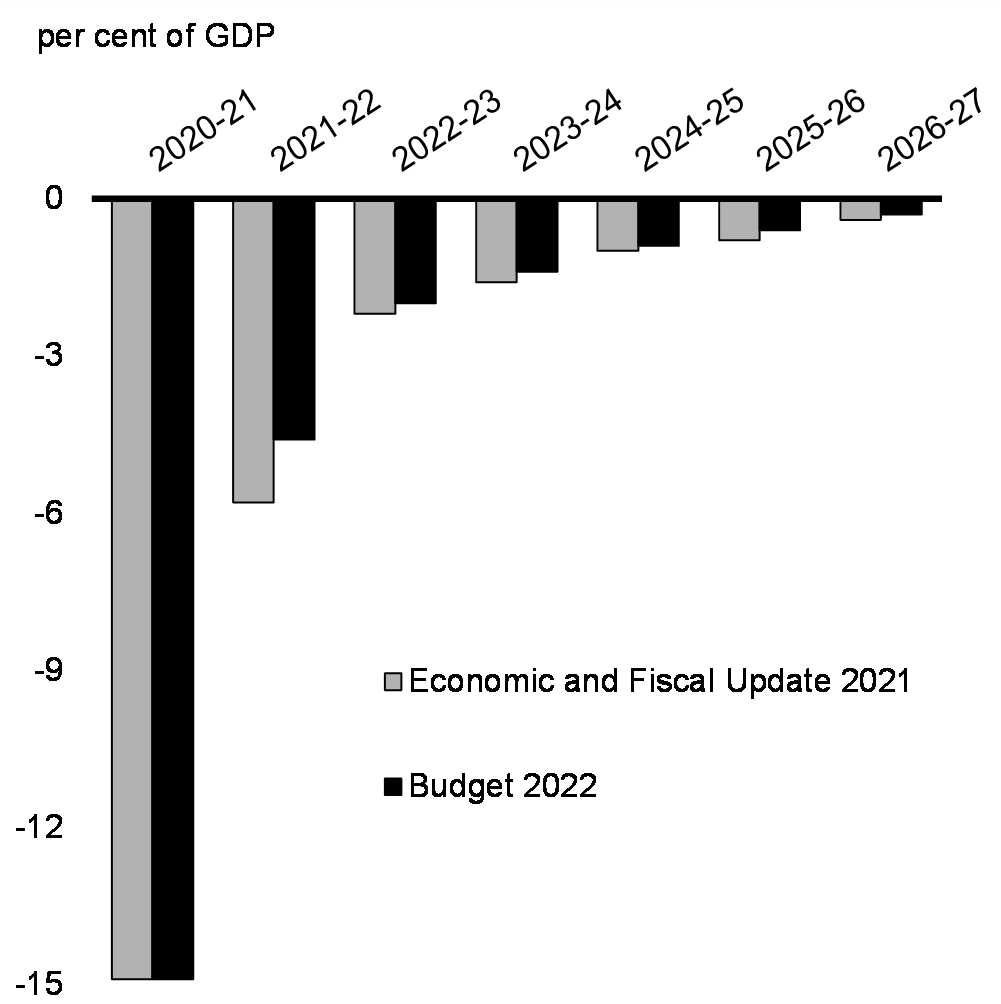
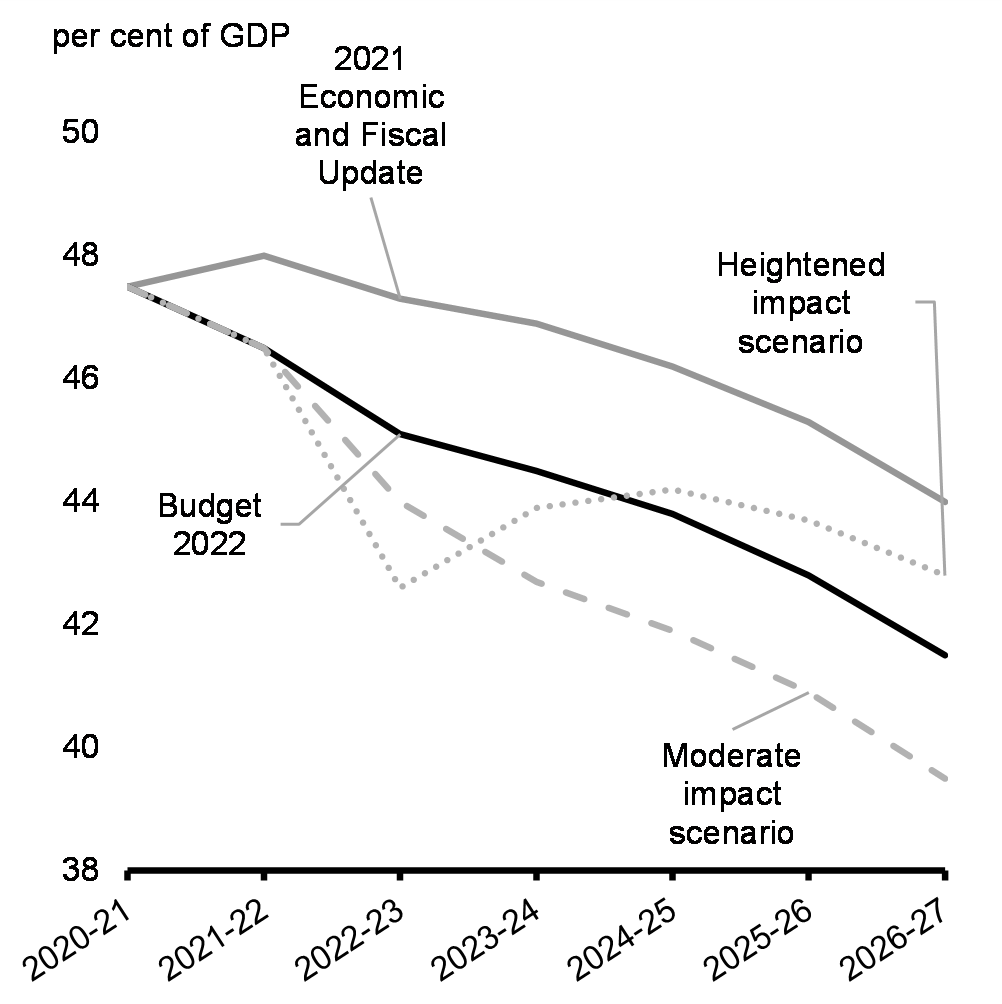
After accounting for Budget 2022 measures and incremental policy actions since the 2021 Economic and Fiscal Update, the budgetary balance is expected to remain below that projected in the 2021 Economic and Fiscal Update, with a $113.8 billion expected deficit in 2021-22, improving to a projected deficit of $8.4 billion in 2026-27, or about 0.3 per cent of GDP. The federal debt is expected to decline from 46.5 per cent of GDP in 2021-22 to 41.5 per cent of GDP in 2026-27. Looking out over the next five years, the federal deficit (Chart 21) and debt as a share of the economy (Chart 22) are both expected to decline each year.
Budgetary Balance
Federal Debt
The fiscal outlook presented in Budget 2022 respects a number of important fiscal sustainability metrics, including:
- The deficit is projected to fall to 0.9 per cent of GDP by 2024-25 before reaching 0.3 per cent of GDP by the end of the budget planning horizon (Chart 21), a level in 2026-27 that is lower than the 2013-14 deficit of 0.4 per cent of GDP which the government recorded six years from the onset of the 2008-09 financial crisis.
- The federal debt-to-GDP ratio is projected to be on a steeper downward track than originally anticipated several months ago—even under the heightened impact economic scenario presented in Section 1.3, the debt-to-GDP ratio remains below that of the 2021 Economic and Fiscal Update by 2026-27 (Chart 22).
- Public debt charges are forecast to remain at historically low levels, even after accounting for the expected rise in interest rates by private sector forecasters (see the box entitled “Projected Public Debt Charges”).
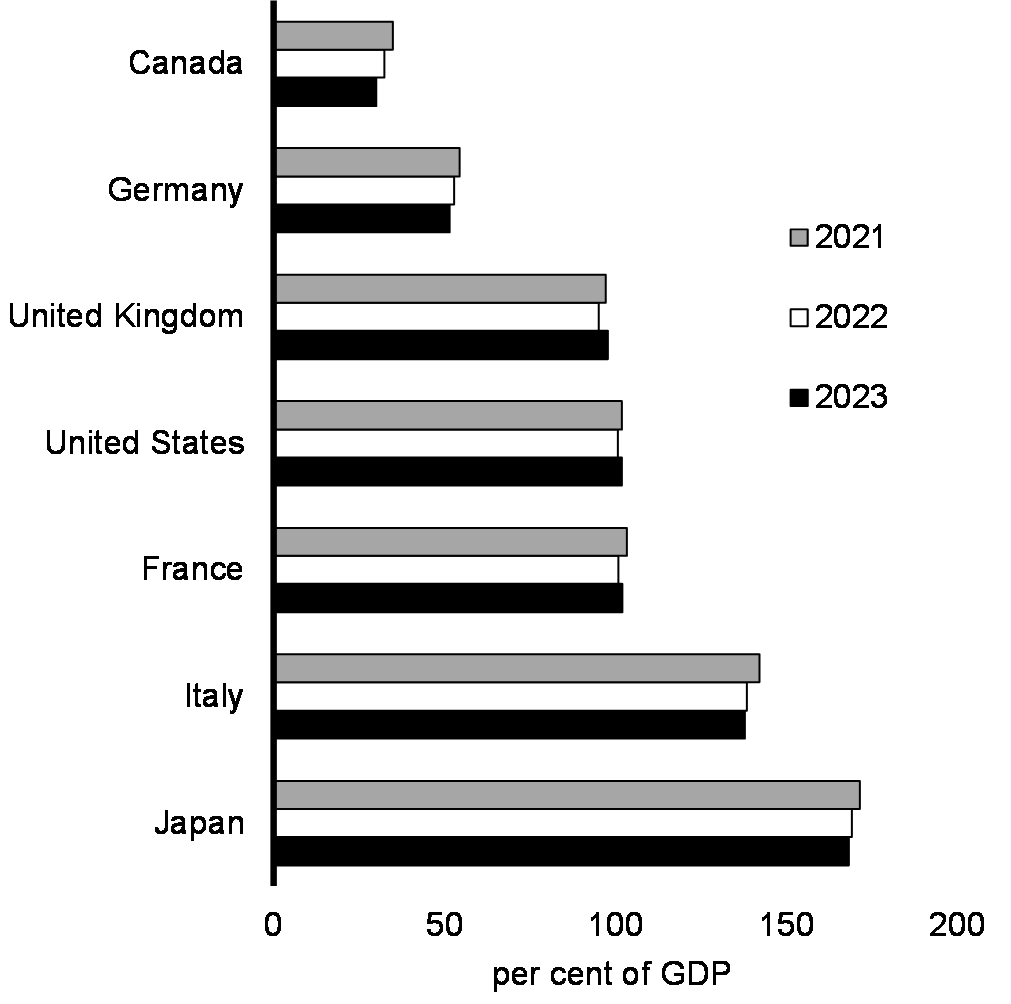
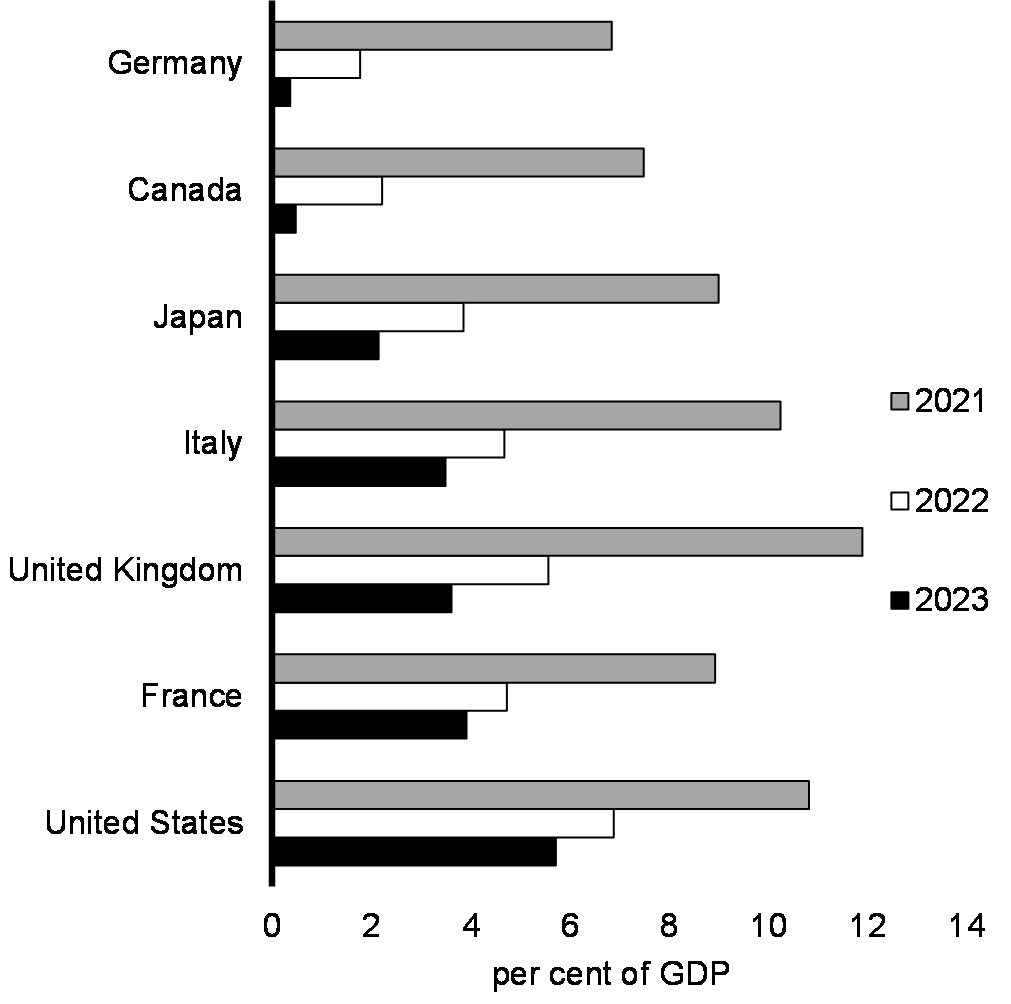
Compared to our international peers, the federal fiscal outlook and the better-than-expected provincial-territorial fiscal results position Canada to continue to have the lowest net debt-to-GDP ratio in the G7 (Chart 23), and the second-lowest deficit as a per cent of GDP among these same countries (Chart 24).
General Government Net Debt Forecasts, G7 Countries
General Government Deficit Forecasts, G7 Countries
Preserving Canada’s Low Debt Advantage: The Fiscal Anchor
The government’s fiscal anchor is unchanged: the federal government remains committed to unwinding COVID-19-related deficits and reducing the federal debt-to-GDP ratio over the medium term.
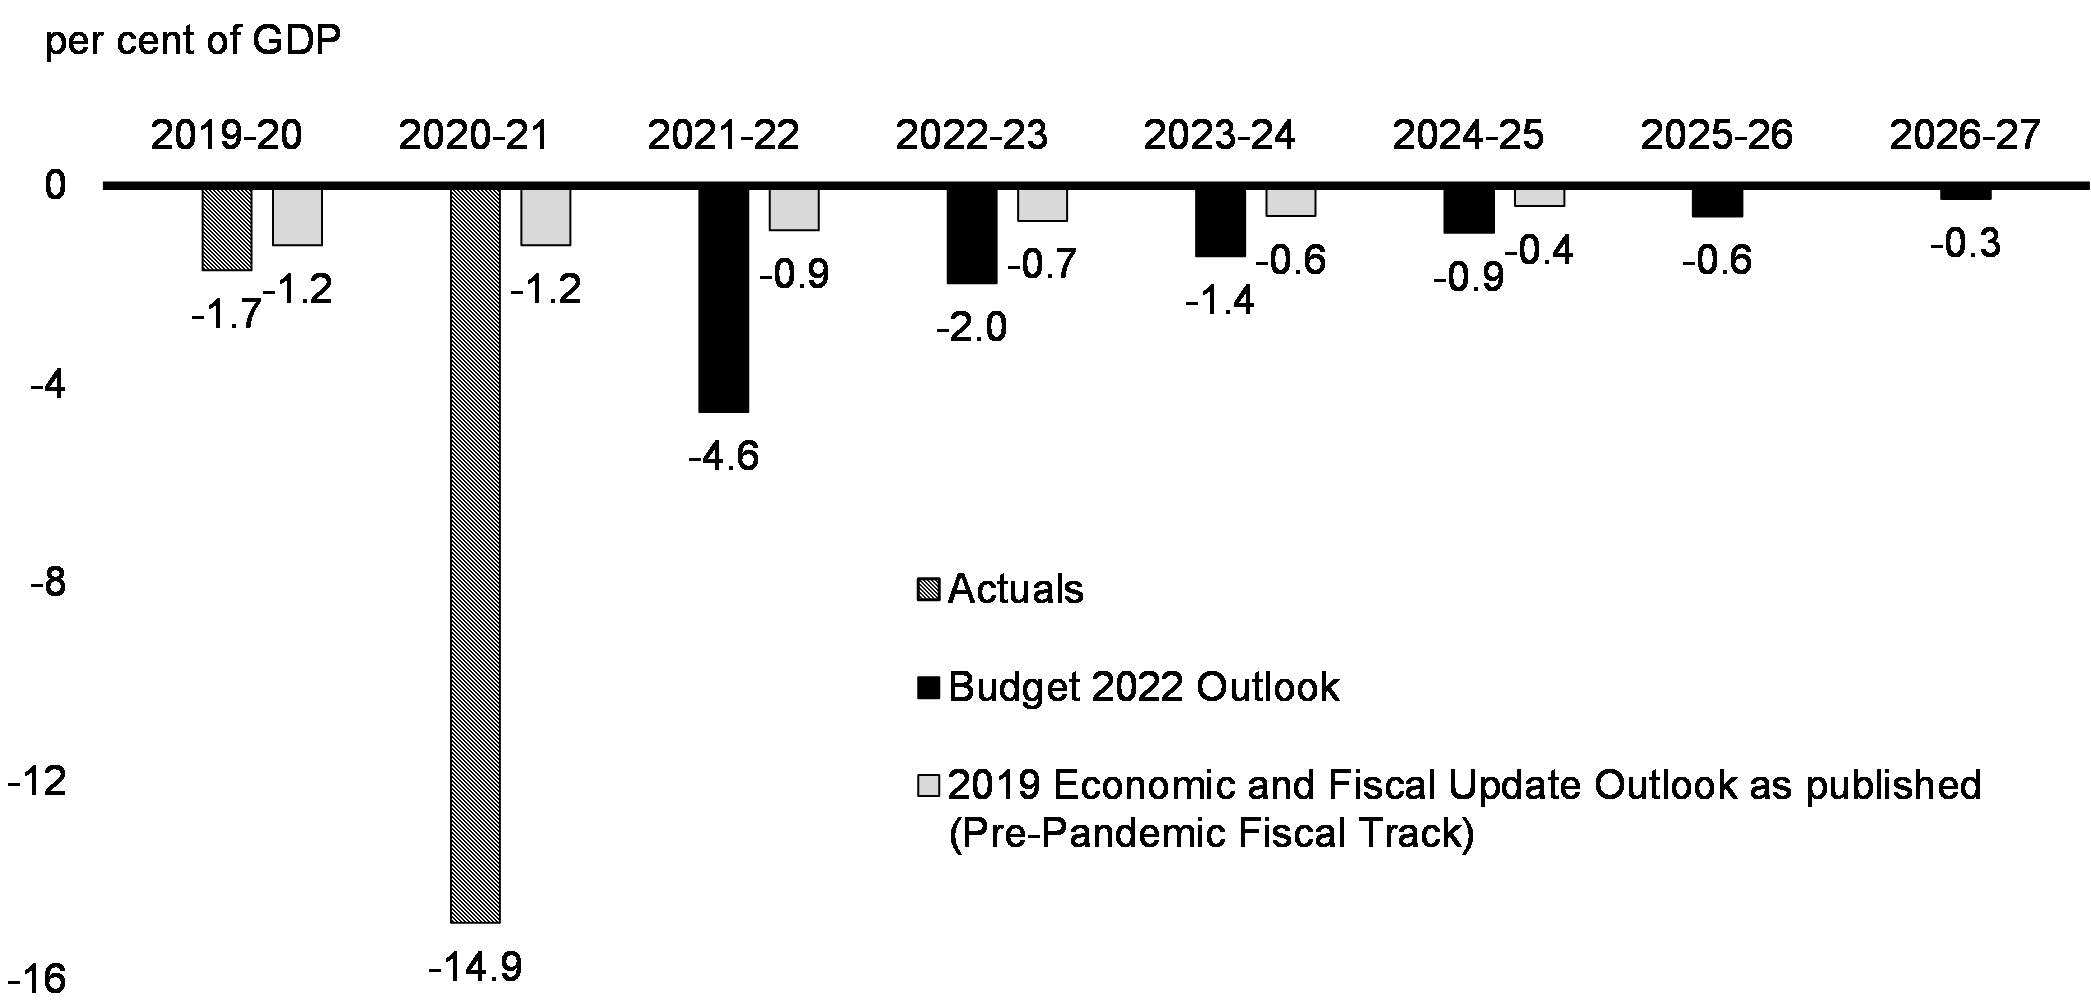
Budget 2022 once again meets this test. The government is winding down emergency COVID-19 expenditures and implementing a fiscal plan that ensures federal debt remains on a downward track as a share of the economy. This plan also effectively brings the deficit-to-GDP ratio back to its pre-pandemic track by the end of the budget forecast horizon (Chart 25).
Budgetary Balance
The government’s continued commitment to its fiscal anchor will help ensure Canada’s low debt advantage and enviable credit ratings are preserved and that future generations are not burdened with COVID-19-related debt.
Budget 2022 is taking critical steps to advance the government’s long-term objectives of (1) building a stronger and more resilient economy—one that generates shared prosperity, while (2) maintaining long-term fiscal sustainability. These objectives are mutually reinforcing, and the government will pursue them both as it works to build a more equitable future, for everyone.
Canada has a long history of prudent and sound fiscal management, along with several other strengths, such as economic resilience and diversity, effective policymaking and institutional frameworks, well-regulated financial markets, and monetary and fiscal policy flexibility. Together, these reinforce Canada’s stable economic and fiscal position.
These strengths continue to shape Canada’s excellent credit ratings from Moody’s (Aaa), S&P (AAA), DBRS (AAA), and Fitch (AA+). All four rating agencies have reaffirmed Canada’s strong credit ratings.
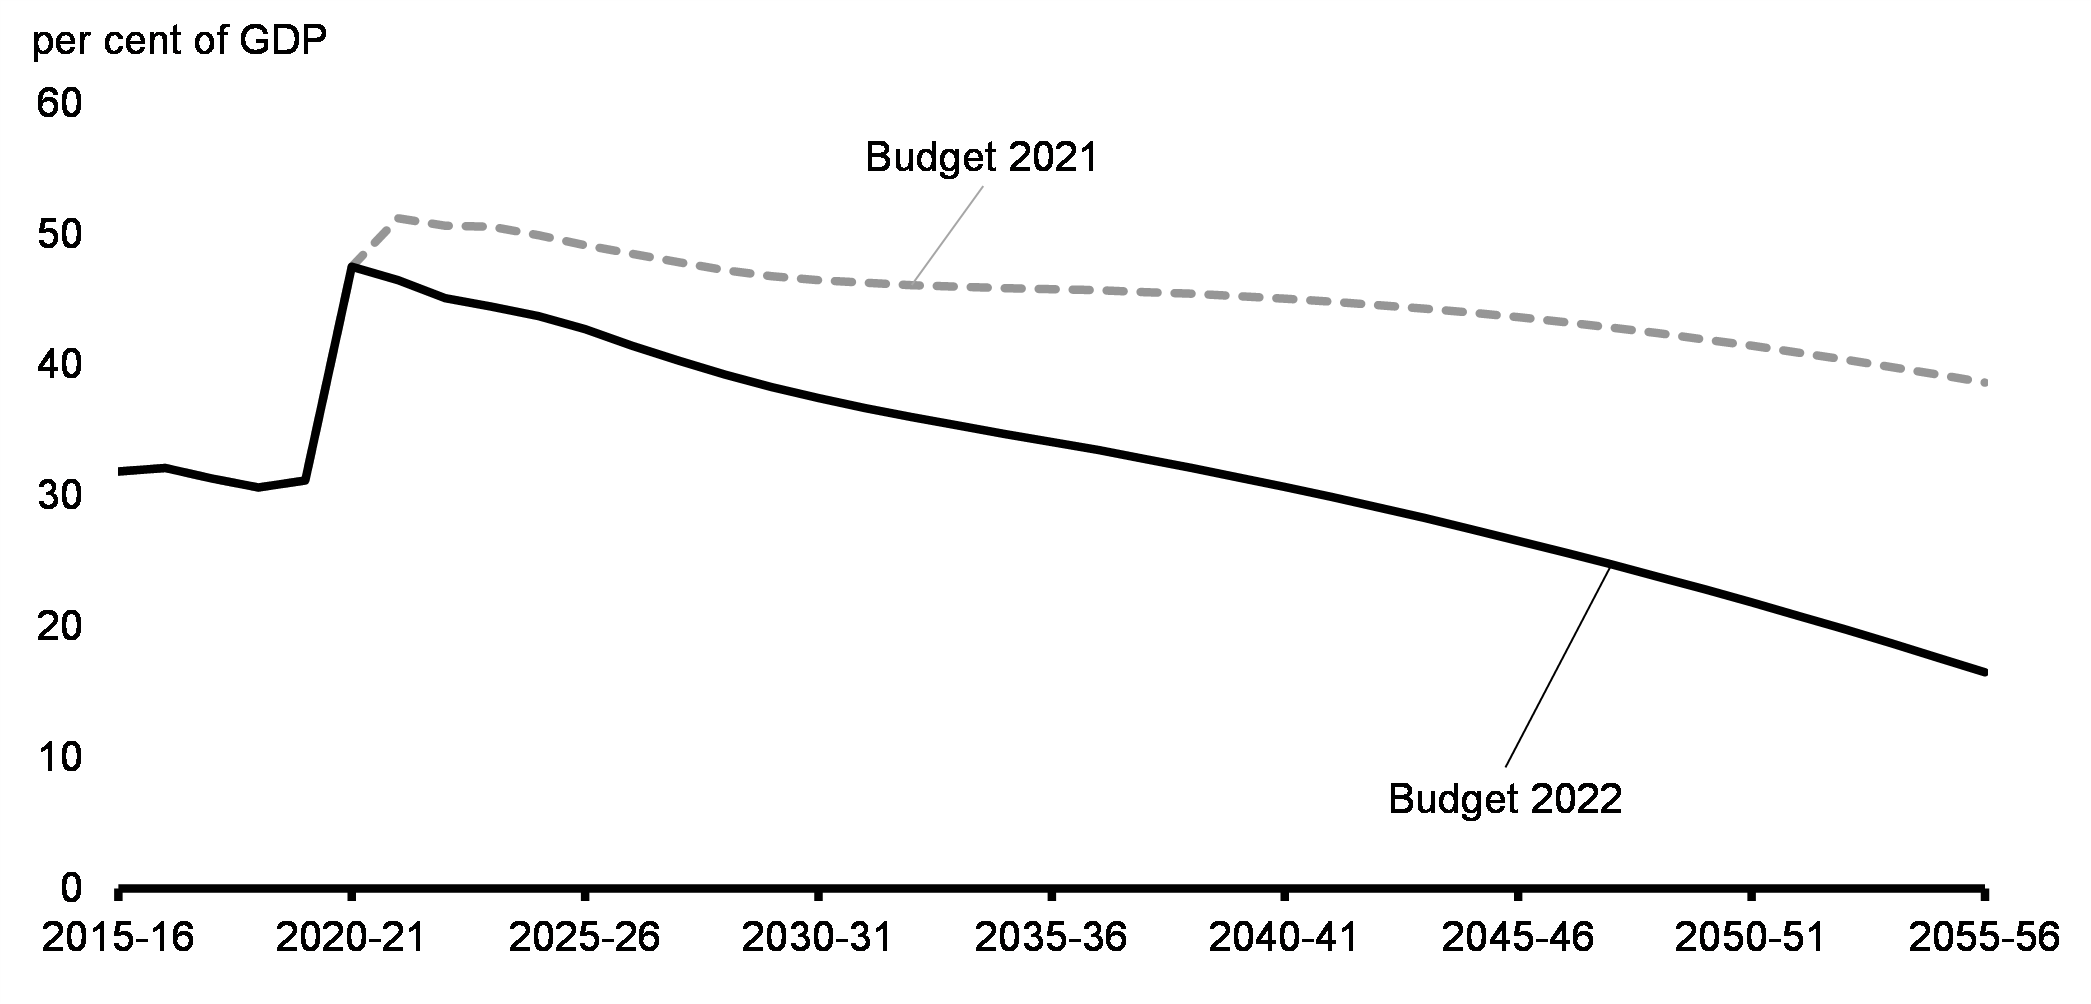
Considering the government’s fiscal anchor and using Budget 2022 forecasts as a starting point, the government’s plan is fiscally sustainable for current and future generations. Indeed, over the three next decades, the federal debt-to-GDP ratio is projected to continuously decline and be on a steeper downward track than projected in Budget 2021 (Chart 26). Details and sensitivity analysis around these long-term fiscal projections are presented in Annex 1.
Long-Term Projection of the Federal Debt
Projected Public Debt Charges
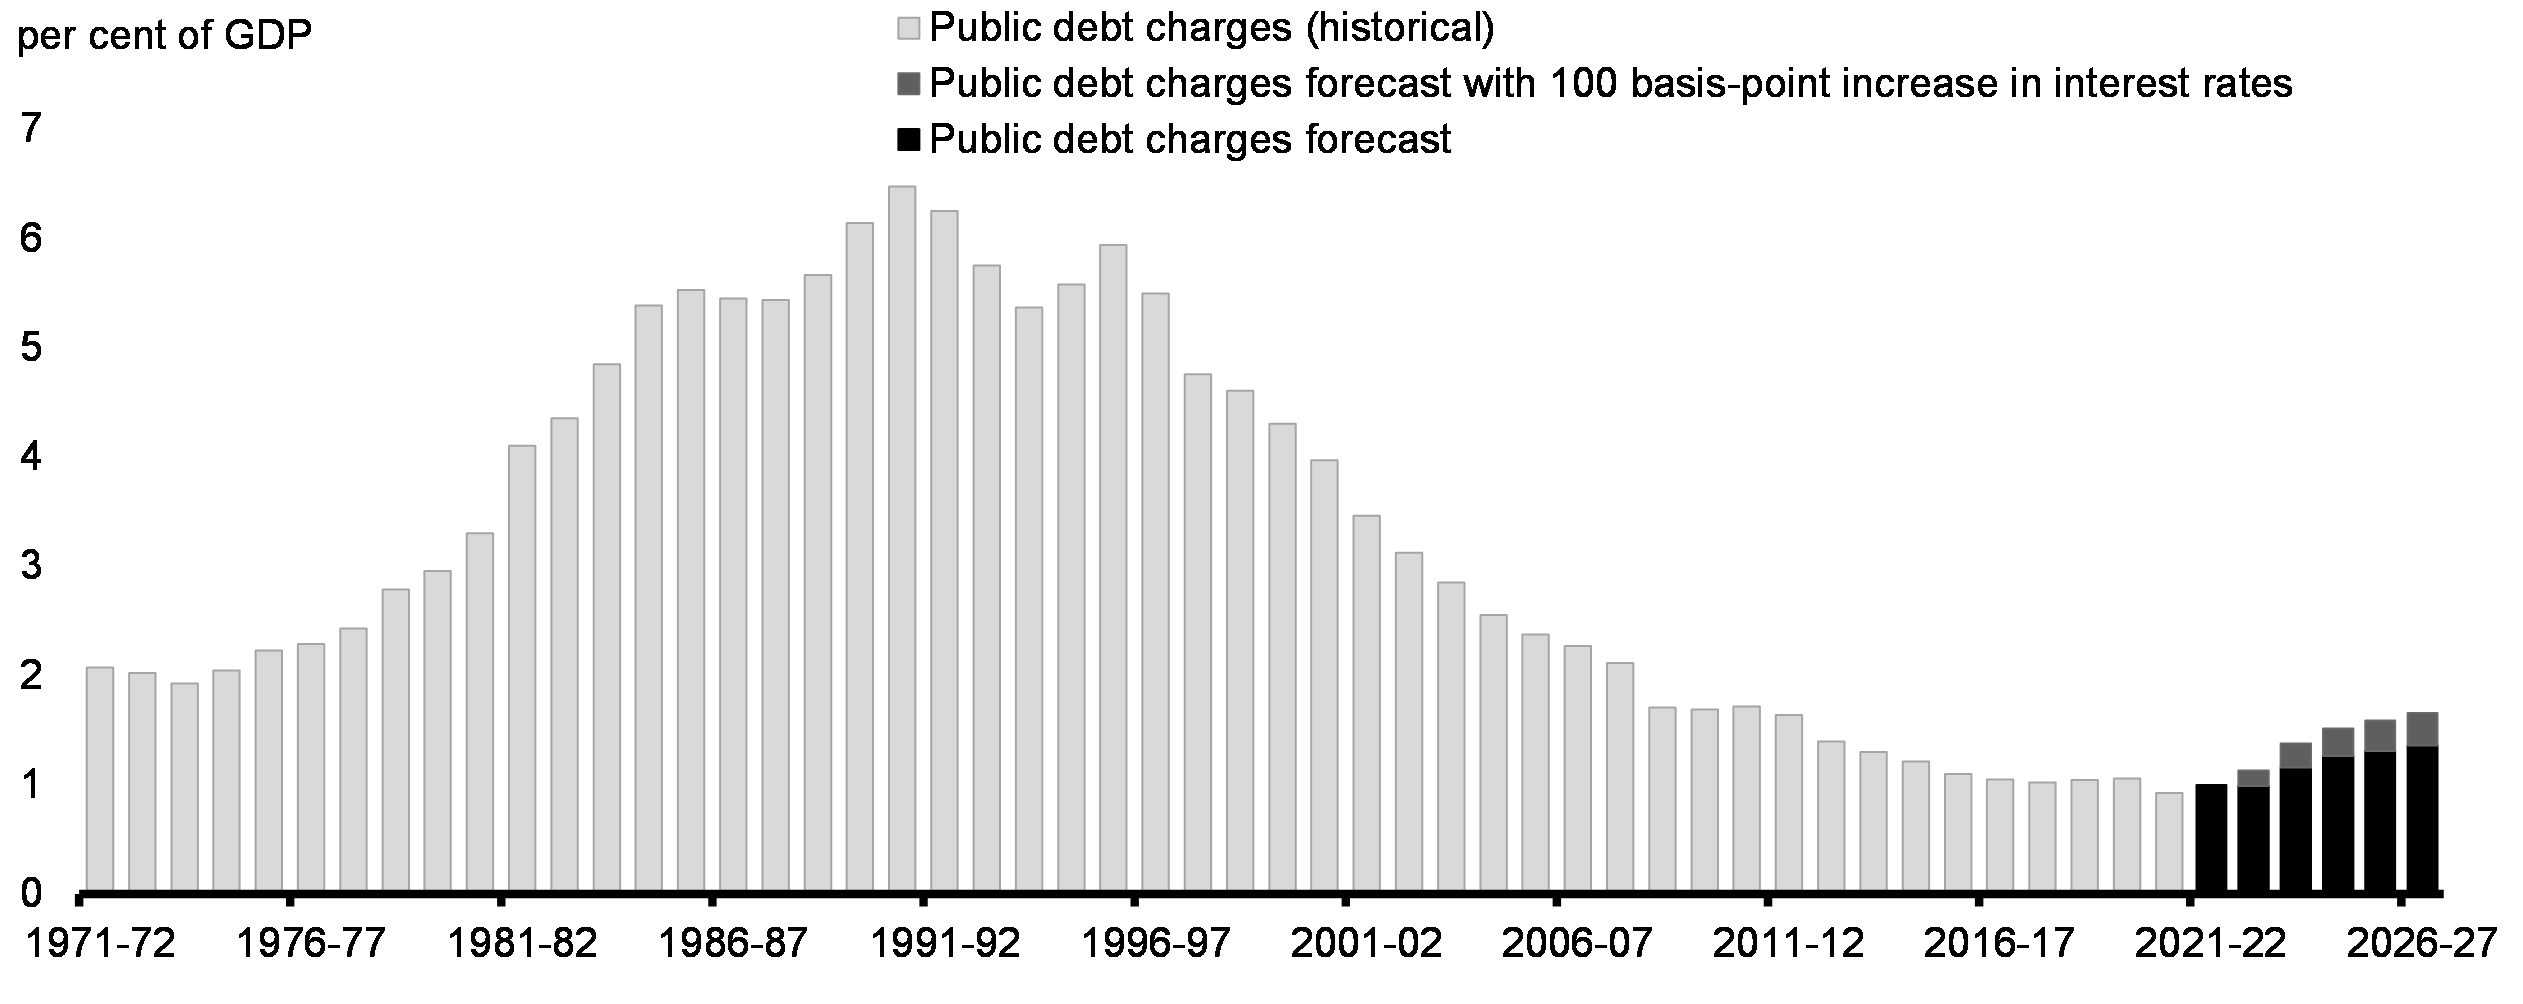
By 2026, private sector forecasters expect the three-month treasury bill rate to increase by 200 basis points and the ten-year government bond rate to increase by 160 basis points, consistent with a global increase in yields across all markets. As such, this is already built into the baseline forecast. Despite this forecast trend and the sharp increase in the federal debt since COVID-19, federal public debt charges are projected to remain historically low, at $42.9 billion or about 1.4 per cent of GDP. This is well below the pre-financial crisis level of 2.1 per cent in 2007-08 (Chart 27).
Federal public finances would remain resilient even under higher-than-projected interest rates. For example, in a scenario where interest rates were 100 basis points higher than forecast in all years in this budget, public debt charges would rise by an additional $9.3 billion (0.3 percentage points of GDP) by 2026, bringing them to 1.7 per cent of GDP, which is still lower than at the end of the 2000s.
Historical Public Debt Charges as a Proportion of GDP, and Projected Sensitivity to a 100 Basis-Point Increase in Interest Rates
With higher interest rates, the government would also realize some offsetting benefits, including:
- Higher revenues from the government’s interest-bearing assets;
- Corresponding downward adjustments that reduce public sector pensions and employee benefit obligations; and,
- Higher government tax revenues if interest rate increases were due to stronger economic growth.
5. Investing to Grow the Economy
Budget 2022 Makes Essential Investments Now
Canada has many of the essential building blocks it needs to be one of the most competitive economies in the world today, and for the years and decades to come. We have: a strong base of commodities and critical minerals that are in high global demand; abundant sources of clean energy; one of the highest rates of inward foreign direct investment in the G7; a growing population; high levels of fundamental research occurring in world-class universities and colleges; and a talented workforce that is among the most highly educated in the world. Canada boasts one of the fastest-growing employment bases for high-tech jobs, and with the right investments, has the potential to become a world leader in technology and innovation.
In the face of uncertainty, business investment can be paralyzed by a “wait-and-see” approach. But to succeed in an uncertain world, Canada must invest in its future now, or risk falling behind. Over the medium term, investments that expand Canada’s supply capacity will allow the economy to grow while mitigating future inflationary pressures.
Budget 2022’s investments in housing, immigration, and skills will be key to growing and maintaining a strong, diverse, and talented workforce. Investments in growth—including clean growth—and innovation will be central to building Canada’s industries and economy of tomorrow. And together, these investments will help build a resilient and sustainable economy that strengthens the middle class, and leaves no one behind.
Average Potential Annual Growth in Real GDP per capita, Selected OECD Countries, 2020-2060
The stakes are high. Most Canadian businesses have not invested at the same rate as their U.S. counterparts. Unless this changes, the OECD projects that Canada will have the lowest per-capita GDP growth among its member countries (Chart 28). By working to bring Canada’s projected growth rate up to the OECD average, we could add more than $4,000 (in 2019 dollars) to the annual income of the median family with children by 2030.
Investing in Long-Term Economic Growth
The government is committed to investing in the health of the Canadian economy and making life more affordable for Canadians. This means investments in areas like the transition to a low-carbon economy and business innovation that will increase productivity and help to contain inflation going forward.
Boosting the supply side of the economy is one of the key ways to mitigate inflation. Expanding the supply capacity of the economy requires investments that grow the labour force, improve workers’ skills and increase the stock of productive capital (buildings, machinery, equipment, software, intellectual property, etc.). Canada must prioritize such investments in order to surmount the fundamental economic challenges it faces over the longer-term.
It takes time before investment actually boosts economic supply. While investment may add to demand in the short-term, improved prospects for future supply will help to keep inflation expectations in check. This directly addresses the biggest threat to price stability today: the risk that elevated inflation becomes entrenched in expectations. When businesses expect that increases in their costs will be moderate, they do not feel the same need to raise prices to sustain profit margins.
The government has already made important supply-side investments. The investment in Early Learning and Child Care, which is expected to yield a material increase in labour-force participation, is one important example. Budget 2022 redoubles the focus on expanding supply capacity with investments to grow and maintain our talented and diverse workforce through immigration and skills development; facilitate the transition to a low-carbon economy; drive innovation and business growth; and make our cities more competitive by expanding the supply of housing.
Investing in a Green Transition That Will Support Jobs and Growth
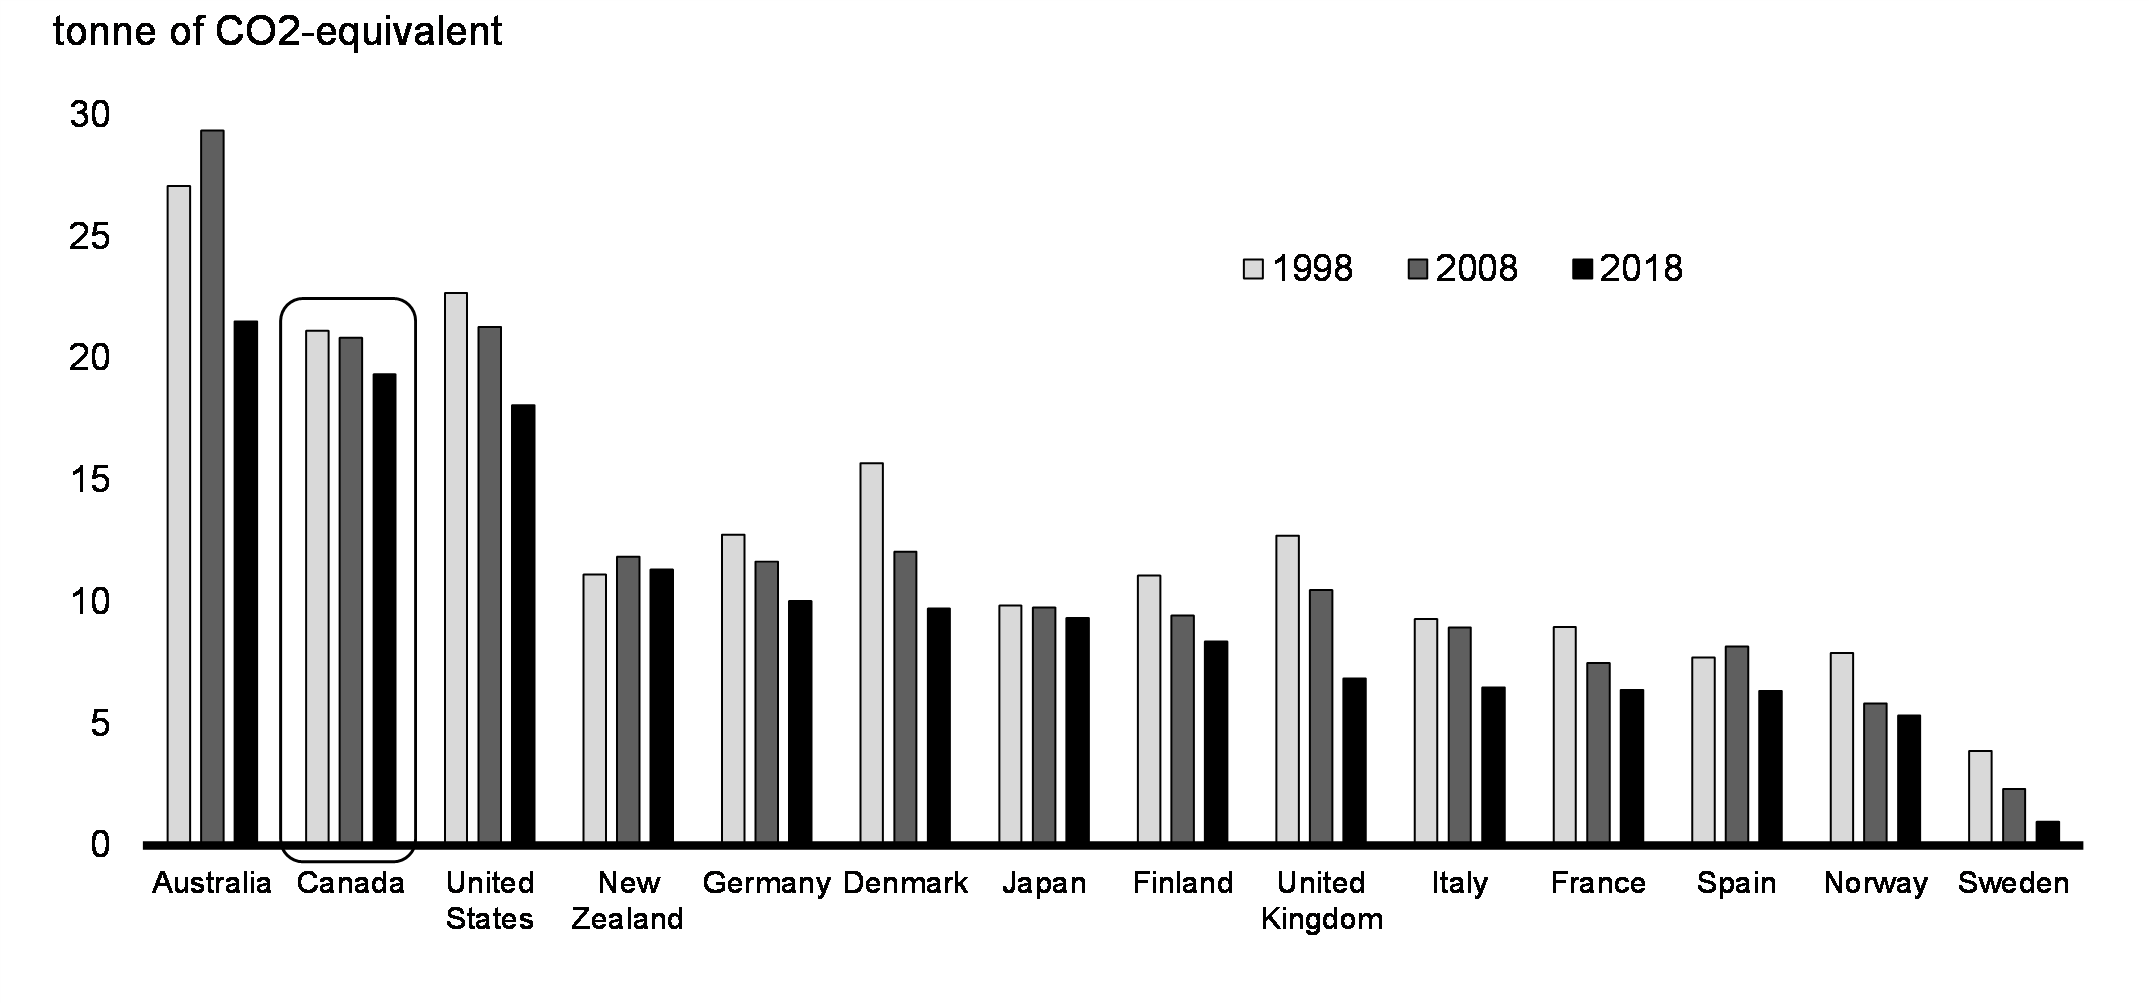
Canada has among the highest per-capita greenhouse gas (GHG) emissions in the world (Chart 29). In part, this reflects the role that the resource sector plays in Canada’s economy, with the share of investment attributable to oil, gas, and mining being ten times the average of other G7 countries. Canada’s vast geography and seasonality also contribute to energy-intensive housing and transportation needs.
Carbon pricing is an important part of driving Canada towards a cleaner economy. But to reduce Canada’s emissions, and ensure our economy is competitive in an increasingly green world, significant investments are also needed, from both government and private capital. This includes investment in the development and usage of clean technologies that are needed to grow Canada’s supply capacity while reducing emissions. Leading into the pandemic, growth in Canada’s clean technology sector had been outpacing growth in the rest of the economy. Building on these strengths would allow Canada to prosper through the transition to net-zero and create good jobs. But uncertainty about how the global transition will unfold is hampering this investment. To address this, the government is taking action to help mobilize readily available private capital to invest in Canada’s capacity to ensure that Canada’s workers and businesses prosper in the green transition. The goals are both to achieve net-zero and to build the new low-carbon industries we will need as engines for future growth.
Greenhouse Gas Emissions per Capita
Investing in Our Economic Capacity and Security
While Canada and Canadians have benefited from higher rates of labour force participation and employment compared to our international peers, we have not done as well in keeping up with the changes in technology and innovation that improve productivity.
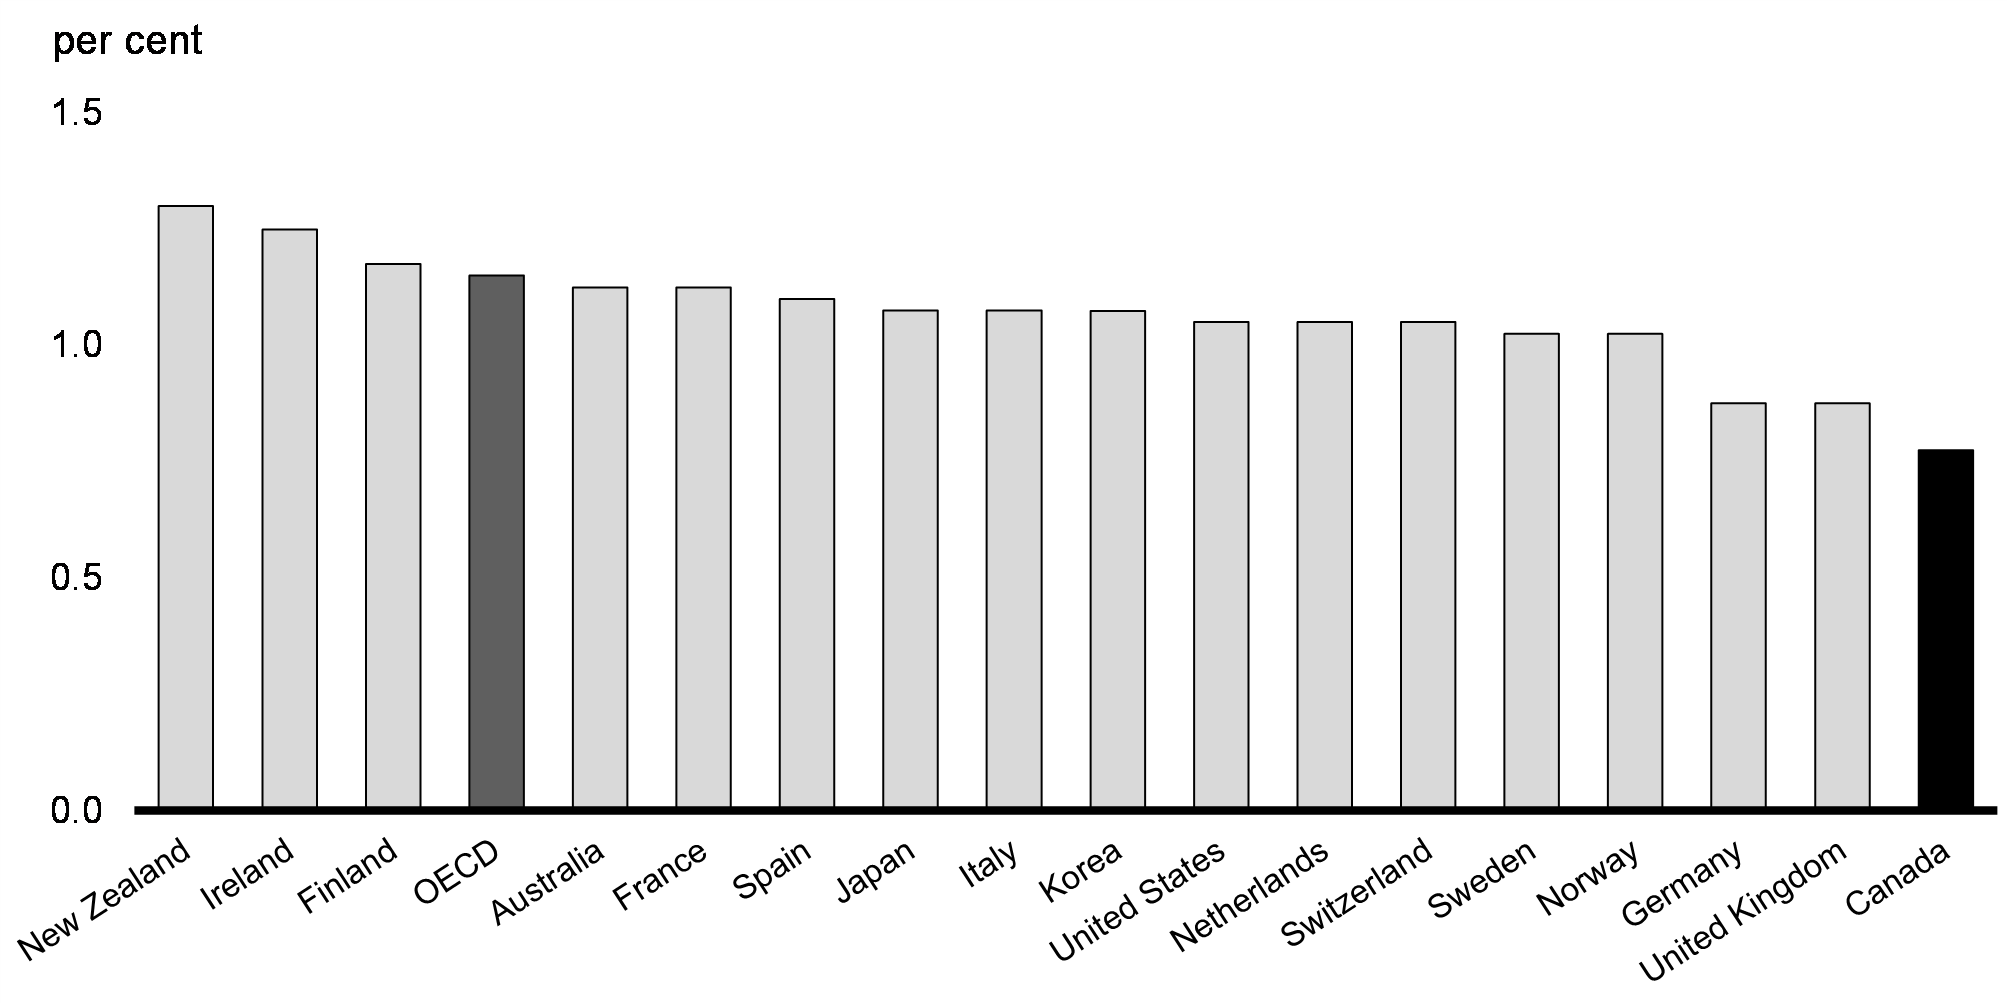
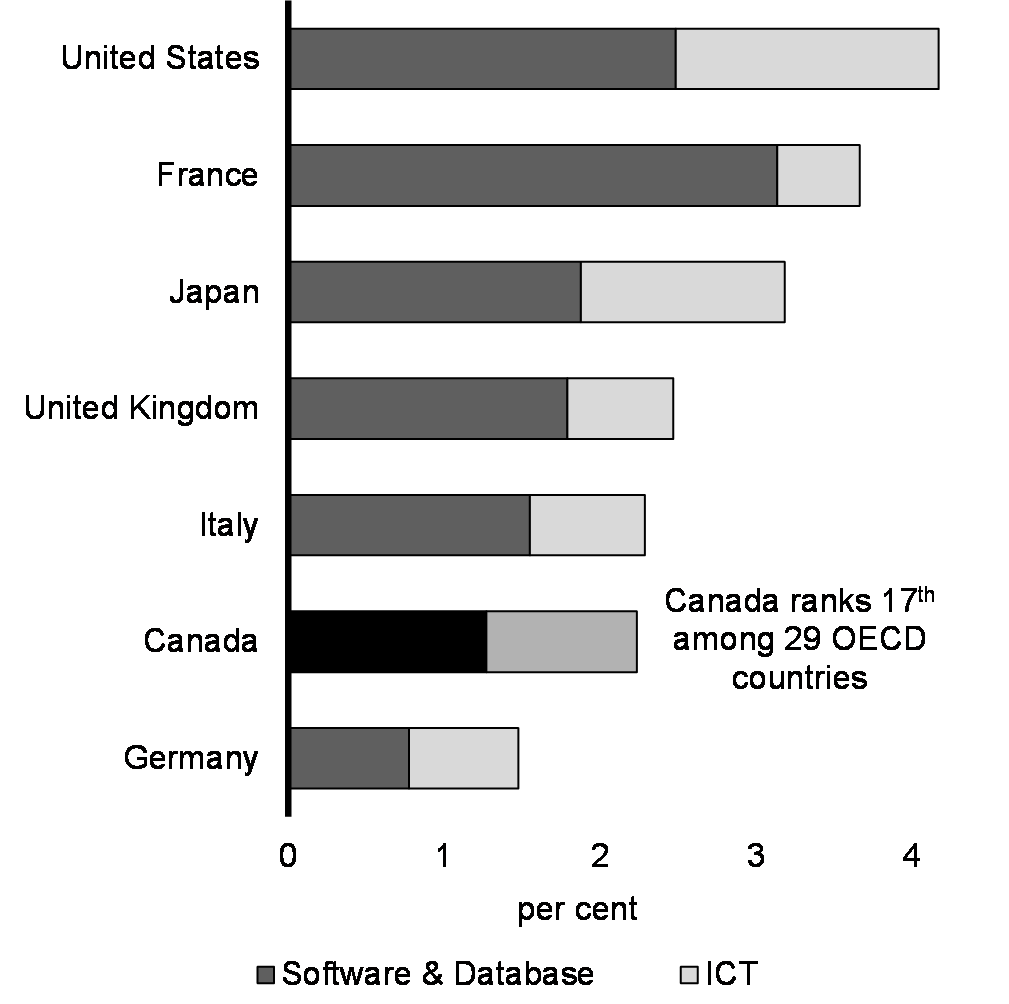
Labour productivity growth in Canada has slowed from about 2.7 per cent in the 1960s and 1970s to less than 1 per cent today. Technology has been a key driver of productivity and supply-driven economic growth. However, Canada has lagged behind other advanced economies in investing in and adopting new and innovative technologies (Charts 30 and 31). The rates of investment in Information and Communications Technology (ICT) equipment and R&D in Canada are only about half the U.S. levels.
Importantly, Canada is highly exposed to global economic developments, with trade as a share of GDP second only to Germany among G7 countries. This means investment in Canada is often aimed at producing for the global market. In recent years, trade and geopolitical tensions have strained the rules-based global trading system. Ensuring stable trade relations will continue to be important for investment in Canada. At the same time, an uncertain world creates opportunities for a stable democracy like Canada to supply energy and other critical goods to the world.
In response to recent developments and emerging opportunities in the global economy, the government will act to improve business investment in innovation and technology and help Canadian businesses to grow and strengthen Canada’s critical supply chains, and its ability to produce strategic commodities.
Business Expenditures on Research and Development as Share of GDP, G7 Countries, Average 2015-19

ICT Hardware, Software, and Database Investment as Share of GDP, G7 Countries, Average 2015-19
Investing in an Inclusive Workforce
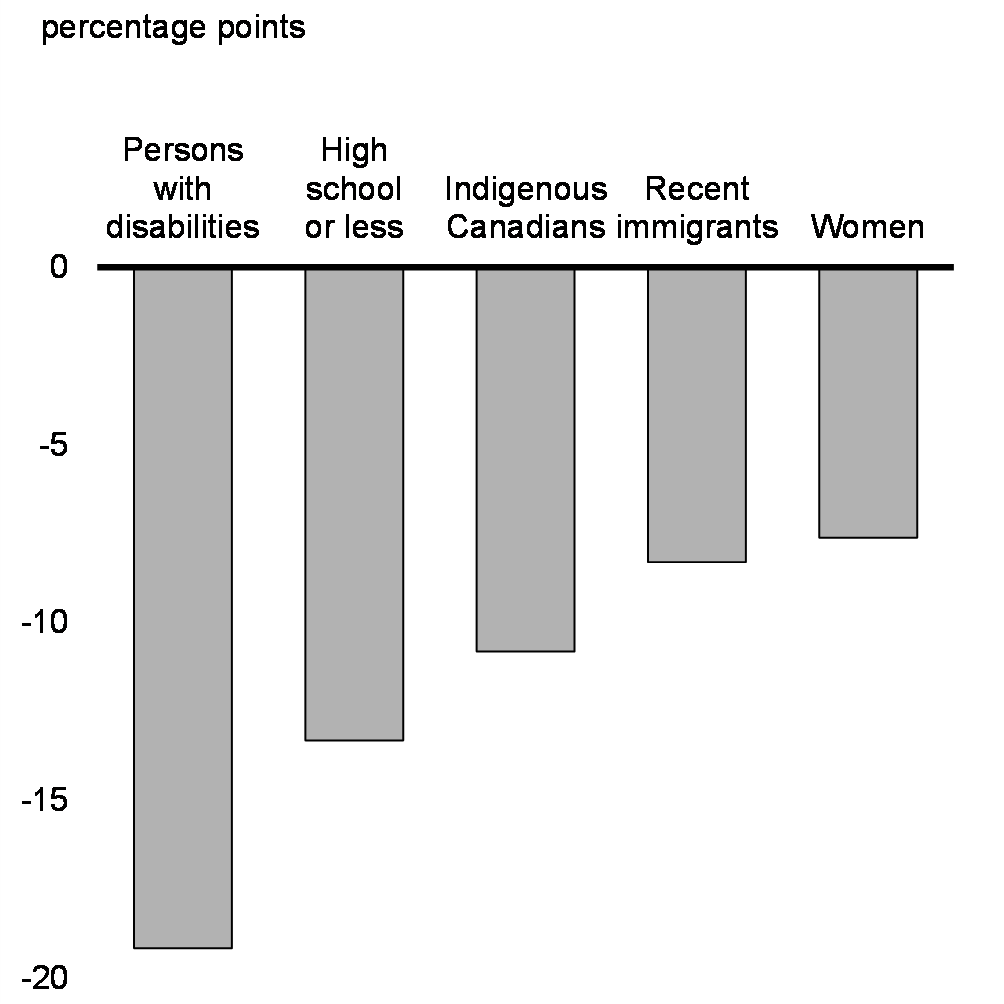
While the government’s COVID-19 economic response plan has been successful in getting Canadians back to work, over the long term, population aging may weigh on labour force growth and the economy’s capacity to supply goods and services. It will, therefore, become critical to improve labour market participation of under-represented segments of the population (Chart 32).
The government’s significant investment in early learning and child care is a major step in this direction and it is expected to result in a marked improvement in labour market participation by women with children. The evidence from Quebec—which began building a universal early learning and child care network in 1997—is clear. In 1997, the women’s labour force participation rate in Quebec was 4 percentage points lower than the rest of Canada. Today it is 4 points higher than the rest of Canada.
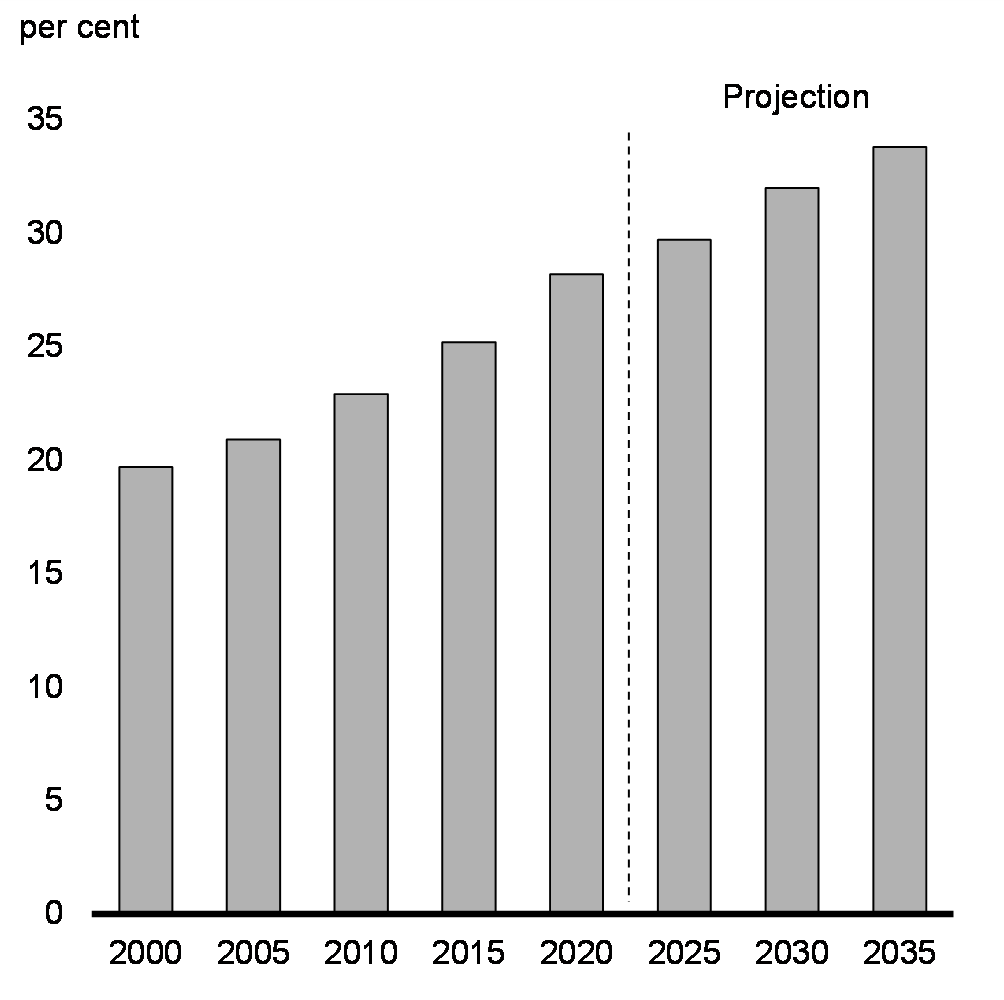
Immigration will be another key driver of workforce growth in Canada. Already, more than one in four workers are foreign-born. As the Canadian population ages, immigration is expected to account for an increasingly large share of the labour force (Chart 33).
Gap in Labour Force Participation Relative to Men, Selected Groups, 2021
Foreign-Born Share of Labour Force, 2000-2035
Report a problem on this page
- Date modified: