
Archived - Annex 1:
Details of Economic and Fiscal Projections
1.1 Economic Projections
The average of private sector forecasts has been used as the basis for economic and fiscal planning since 1994. This helps ensure objectivity and transparency, and introduces an element of independence into the government’s economic and fiscal forecast. The economic forecast presented in this section is based on a survey conducted in early February 2022. The survey average has been adjusted to incorporate the actual results of the National Accounts for the fourth quarter of 2021 and the historical revisions released on March 1, 2022.
The February survey includes the views of 13 private sector economists:
- BMO Capital Markets,
- Caisse de dépôt et placement du Québec,
- CIBC World Markets,
- The Conference Board of Canada,
- Desjardins,
- IHS Markit,
- Industrial Alliance Insurance and Financial Services Inc.,
- Laurentian Bank Securities,
- National Bank Financial Markets,
- Royal Bank of Canada,
- Scotiabank,
- TD Bank Financial Group, and
- The University of Toronto (Policy and Economic Analysis Program).
The macroeconomic inputs of the February 2022 survey continue to provide a reasonable basis for fiscal planning. However, the outlook is clouded by a number of key uncertainties, including the impact of Russia’s invasion of Ukraine. Throughout March, the Department closely tracked evolving external views and forecasts. This information was used to inform two alternative economic scenarios that illustrate the effects of unusually high uncertainty around the Russian invasion of Ukraine and its spillovers (Annex 1 for details).
Following a strong rebound of 4.6 per cent in 2021, private sector economists expected real gross domestic product (GDP) growth at a still solid 3.9 per cent for 2022. Growth for 2022 has been revised down from 4.2 per cent expected in the 2021 Economic and Fiscal Update (EFU 2021), reflecting slower expected growth in the first quarter of this year resulting from renewed restrictions in most provinces due to the fast spread of the Omicron variant. The outlook for real GDP growth has been revised up for 2023, from 2.8 per cent in EFU 2021 to 3.1 per cent. Overall, the revisions leave the level of real GDP roughly unchanged relative to EFU 2021 by 2023. Real GDP growth is then expected to moderate to near 2 per cent on average per year over the remaining years of the forecast horizon, reflecting a return to trend long-run growth rates.
This forecast for real GDP is generally in line with recent estimates from the International Monetary Fund, which in January 2022, projected Canada as having the second fastest growth this year and the fastest growth next year, of all G7 countries. Indeed, private sector economists foresee Canada experiencing faster GDP growth than the United States in both 2022 and 2023.
The outlook for the unemployment rate has substantially improved relative to EFU 2021 and was expected to average 5.8 per cent in 2022 and to decline further to 5.5 per cent in 2023, remaining at that historically low level over the remaining years of the forecast horizon.
Private sector economists expected the recent price pressures to continue for some time. Consistent with global trends, the outlook for Consumer Price Index (CPI) inflation has been revised significantly, up to 3.9 per cent in 2022 compared to 3.1 per cent in EFU 2021. CPI inflation was then expected to gradually normalize to around 2 per cent over the remainder of the forecast horizon, which is consistent with the average rate of inflation in Canada over the last 30 years.
Reflecting recent strength in commodity prices, the outlook for West Texas Intermediate crude oil prices has been revised up to US$80 per barrel for 2022 and to US$74 per barrel for 2023, about US$6 to US$7 per barrel higher on average than in EFU 2021. Going forward, crude oil prices were expected to remain higher than in EFU 2021 by about US$3 per barrel on average per year.
While private sector economists forecast the average for 2022 as lower than prices exhibited in the last several weeks, current price levels are operating in an environment of both high volatility and uncertainty. The alternative economic scenarios developed by the Department provide a useful illustration of how a sustained increase in commodity prices could affect the overall economic and fiscal outlook.
As a result of this strength in both domestic inflation and crude oil prices, the outlook for GDP inflation (the broadest measure of economy-wide price inflation) has been revised up significantly to 3.7 per cent in 2022 compared to 2.4 per cent in EFU 2021. Going forward, the GDP inflation outlook was expected to be broadly in line with the EFU 2021 outlook.
As a result of these developments, the level of nominal GDP (the broadest measure of the tax base) was expected to be higher than projected in EFU 2021 by about $41 billion per year over the 2021-2026 period.
The outlook for short- and long-term interest rates has been revised up in the February 2022 survey by about 30 and 10 basis points, respectively, over the 2021-2026 period compared to EFU 2021.
| 2021 | 2022 | 2023 | 2024 | 2025 | 2026 | 2021- 2026 |
|
|---|---|---|---|---|---|---|---|
| Real GDP growth1 | |||||||
|
2021 Economic and Fiscal Update
|
4.5 | 4.2 | 2.8 | 2.0 | 1.8 | 1.8 | 2.8 |
|
Budget 2022
|
4.6 | 3.9 | 3.1 | 2.0 | 1.9 | 1.8 | 2.9 |
| GDP inflation1 | |||||||
|
2021 Economic and Fiscal Update
|
8.0 | 2.4 | 1.5 | 1.9 | 1.9 | 1.9 | 2.9 |
|
Budget 2022
|
8.2 | 3.7 | 1.7 | 1.8 | 1.9 | 1.9 | 3.2 |
| Nominal GDP growth1 | |||||||
|
2021 Economic and Fiscal Update
|
12.8 | 6.7 | 4.3 | 3.9 | 3.7 | 3.8 | 5.9 |
|
Budget 2022
|
13.1 | 7.7 | 4.8 | 3.9 | 3.8 | 3.7 | 6.2 |
| Nominal GDP level (billions of dollars)1 | |||||||
|
2021 Economic and Fiscal Update
|
2,488 | 2,656 | 2,771 | 2,879 | 2,987 | 3,100 | |
|
Budget 2022
|
2,496 | 2,689 | 2,819 | 2,929 | 3,040 | 3,153 | |
|
Difference between EFU 2021 and Budget 2022
|
8 | 33 | 48 | 50 | 53 | 53 | 41 |
| 3-month treasury bill rate | |||||||
|
2021 Economic and Fiscal Update
|
0.1 | 0.5 | 1.2 | 1.6 | 1.9 | 2.0 | 1.2 |
|
Budget 2022
|
0.1 | 0.8 | 1.7 | 2.0 | 2.1 | 2.1 | 1.5 |
| 10-year government bond rate | |||||||
|
2021 Economic and Fiscal Update
|
1.4 | 1.9 | 2.3 | 2.5 | 2.7 | 2.9 | 2.3 |
|
Budget 2022
|
1.4 | 2.0 | 2.4 | 2.6 | 2.8 | 3.0 | 2.4 |
| Exchange rate (US cents/C$) | |||||||
|
2021 Economic and Fiscal Update
|
80.0 | 80.6 | 80.7 | 80.4 | 80.4 | 80.6 | 80.5 |
|
Budget 2022
|
79.8 | 79.9 | 80.2 | 80.5 | 80.4 | 80.1 | 80.2 |
| Unemployment rate | |||||||
|
2021 Economic and Fiscal Update
|
7.6 | 6.1 | 5.7 | 5.7 | 5.6 | 5.7 | 6.1 |
|
Budget 2022
|
7.4 | 5.8 | 5.5 | 5.5 | 5.5 | 5.5 | 5.8 |
| Consumer Price Index inflation | |||||||
|
2021 Economic and Fiscal Update
|
3.3 | 3.1 | 2.3 | 2.1 | 2.1 | 2.0 | 2.5 |
|
Budget 2022
|
3.3 | 3.9 | 2.4 | 2.2 | 2.1 | 2.0 | 2.6 |
| U.S. real GDP growth | |||||||
|
2021 Economic and Fiscal Update
|
5.6 | 3.9 | 2.6 | 1.9 | 1.8 | 1.8 | 2.9 |
|
Budget 2022
|
5.7 | 3.8 | 2.6 | 2.0 | 1.8 | 1.9 | 3.0 |
| West Texas Intermediate crude oil price ($US per barrel) | |||||||
|
2021 Economic and Fiscal Update
|
68 | 73 | 68 | 66 | 65 | 63 | 67 |
|
Budget 2022
|
68 | 80 | 74 | 70 | 68 | 66 | 71 |
|
Note: Forecast averages may not equal average of years due to rounding. Numbers may not add
due to rounding.
|
|||||||
1.2 Fiscal Projections
The fiscal outlook presented in this budget is based on the economic projections presented above. The tables that follow present changes to the fiscal outlook since EFU 2021, including the impact of government policy actions taken since EFU 2021 and measures in this budget, year-to-date financial results, and the improved economic outlook.
Changes to the Fiscal Outlook Since EFU 2021
| Projection | ||||||
|---|---|---|---|---|---|---|
| 2021– 2022 |
2022– 2023 |
2023– 2024 |
2024– 2025 |
2025– 2026 |
2026– 2027 |
|
| Budgetary balance – EFU 2021 | -144.5 | -58.4 | -43.9 | -29.1 | -22.7 | -13.1 |
| Economic and fiscal developments since EFU 2021 | 36.1 | 14.3 | 11.7 | 7.5 | 8.5 | 7.4 |
| Budgetary balance before policy actions and measures | -108.5 | -44.1 | -32.3 | -21.6 | -14.2 | -5.8 |
| Policy actions since EFU 2021 | -3.1 | -1.3 | -0.6 | 0.6 | 0.4 | 0.3 |
| Budget 2022 measures (by chapter) | ||||||
| 1. Making Housing More Affordable | -0.7 | -2.0 | -2.2 | -2.1 | -2.2 | -1.0 |
| 2. A Strong, Growing, and Resilient Economy | 0.0 | -0.3 | -1.4 | -1.2 | -1.3 | -1.3 |
|
reprofiling infrastructure investments
|
0.1 | 0.2 | 0.8 | 1.2 | 2.0 | 2.1 |
| 3. Clean Air and a Strong Economy | 0.0 | -1.3 | -2.2 | -3.0 | -2.9 | -3.0 |
| 4. Creating Good Middle Class Jobs | 0.0 | -0.8 | -1.3 | -1.4 | -1.2 | -1.2 |
| 5. Canada’s Leadership in the World | 0.0 | -1.7 | -1.5 | -1.9 | -2.0 | -2.3 |
| 6. Strong Public Health Care | -1.3 | -0.7 | -0.8 | -1.3 | -1.4 | -1.6 |
| 7. Moving Forward on Reconciliation | -0.2 | -2.5 | -2.0 | -1.9 | -1.9 | -2.0 |
| 8. Safe and Inclusive Communities | 0.0 | -0.2 | -0.4 | -0.4 | -0.3 | -0.3 |
| 9.1 Tax Fairness | 0.0 | 2.0 | 3.3 | 3.6 | 3.7 | 3.9 |
| 9.2 Effective Government | 0.0 | 0.0 | 0.7 | 1.7 | 2.7 | 3.7 |
| Total – Budget 2022 measures | -2.2 | -7.4 | -7.1 | -6.7 | -4.8 | -3.0 |
| Budgetary balance | -113.8 | -52.8 | -39.9 | -27.8 | -18.6 | -8.4 |
| Budgetary balance (% of GDP) | -4.6 | -2.0 | -1.4 | -0.9 | -0.6 | -0.3 |
| Federal debt (% of GDP) | 46.5 | 45.1 | 44.5 | 43.8 | 42.8 | 41.5 |
Economic and Fiscal Developments Since EFU 2021
| Projection | ||||||
|---|---|---|---|---|---|---|
| 2021– 2022 |
2022– 2023 |
2023– 2024 |
2024– 2025 |
2025– 2026 |
2026– 2027 |
|
| Economic and fiscal developments by component1 | ||||||
| Change in budgetary revenues | ||||||
(1.1) Income taxes |
19.1 | 12.0 | 8.9 | 6.9 | 7.9 | 8.1 |
|
(1.2) Excise taxes/duties
|
1.6 | 1.9 | 2.0 | 2.0 | 2.2 | 2.7 |
|
(1.3) Proceeds from the pollution pricing framework
|
0.1 | 0.2 | 0.1 | 0.0 | 0.0 | 0.0 |
|
(1.4) Other revenues2
|
3.1 | 1.3 | 1.9 | 3.2 | 3.3 | 1.9 |
|
(1) Total budgetary revenues
|
24.0 | 15.4 | 12.9 | 12.2 | 13.4 | 12.7 |
| Change in program expenses | ||||||
|
(2.1) Major transfers to persons
|
3.9 | 1.2 | -0.9 | -1.4 | -1.6 | -1.7 |
|
(2.2) Major transfers to other levels of government
|
0.4 | -0.4 | -0.5 | -1.0 | -1.2 | -1.2 |
|
(2.3) Proceeds from the pollution pricing framework returned
|
0.0 | -0.3 | -0.1 | 0.0 | -0.1 | 0.0 |
|
(2.4) Direct program expenses
|
8.2 | 0.4 | 2.2 | -0.7 | -0.5 | -0.3 |
|
(2) Total program expenses, excluding net actuarial losses
|
12.5 | 0.9 | 0.6 | -3.2 | -3.3 | -3.2 |
|
(3) Net actuarial losses (gains)
|
0.0 | -1.1 | -0.2 | 0.0 | -0.3 | -0.2 |
|
(4) Public debt charges
|
-0.4 | -1.0 | -1.6 | -1.5 | -1.2 | -1.9 |
| (5) Total economic and fiscal developments | 36.1 | 14.3 | 11.7 | 7.5 | 8.5 | 7.4 |
|
1 A negative number implies a deterioration in the budgetary balance (lower
revenues or higher spending). A positive number implies an improvement in the budgetary
balance (higher revenues or lower spending).
|
||||||
The outlook for budgetary revenues has improved relative to EFU 2021 reflecting significant upward revisions to economic projections, as well as stronger-than-anticipated year-to-date monthly fiscal results.
- Driven by an improvement in the outlook for corporate profitability and the labour market, income tax revenues are projected to be higher by roughly $10.5 billion per year on average over the forecast horizon.
- The outlook for excise taxes and import duty revenues has been revised up due to strong monthly results and a better outlook for taxable consumption.
- Proceeds from the federal pollution pricing framework that arise from the provinces and territories that are a part of the federal backstop are projected to be higher, largely due to a slight improvement in projections of economic growth. Direct proceeds will continue to be fully returned in the provinces or territories where they are generated.
- Projected other revenues, such as those resulting from sales of goods and services, investments and loans, interest and penalties, and Crown corporations’ net profits, have been revised upwards over the forecast horizon. In 2021-22, the improvement largely reflects higher enterprise Crown corporation profits as a result of the improved economic outlook and lower anticipated provisions for losses relative to what was previously assumed in their corporate plans. Over the remainder of the forecast horizon, higher projected interest rates also lift enterprise Crown revenues, as well as interest and penalty revenues.
Program expenses, particularly major transfers to persons and direct program expenses, are projected to be significantly lower in 2021-22 relative to EFU 2021, largely reflecting improved economic projections, as well as lower anticipated departmental spending, in part from reduced COVID-related program expenses.
- Over the remainder of the forecast horizon, the outlook for major transfers to persons has been revised upwards to reflect the impact of higher expected CPI inflation, to which the Canada Child Benefit and elderly benefit rates are indexed.
- Relative to EFU 2021, major transfers to other levels of government are projected to be lower in 2021-22, primarily because Fiscal Stabilization claims from provinces related to 2020-21 are now expected to be received in 2022-23. In the outer years of the forecast, expenses have been revised upwards as a result of the stronger economic outlook, as the Canada Health Transfer and Equalization payments are indexed to growth in nominal GDP.
- Direct program expenses have been adjusted downward in 2021-22 through 2023-24, relative to the EFU 2021 forecast, due primarily to re-estimation of pandemic-related public health supports and slower departmental spending. This effect is partially offset by an increase in the forecast of wage and rent subsidy programs in 2021-22 resulting from worse economic conditions in hard-hit industries (e.g. lower sales in service and retail industries) relative to previous expectations. In all other years of the projection period, direct program expenses are modestly higher relative to EFU 2021, reflecting revised departmental spending plans.
Net actuarial losses, which represent changes in the measurement of the government’s obligations for pensions and other employee future benefits accrued in previous fiscal years, are expected to be slightly higher across the horizon relative to EFU 2021, reflecting updated demographic and economic assumptions used in estimating these amounts.
Relative to EFU 2021, public debt charges have increased in 2021-22 due to the impacts of higher inflation on Real Return Bonds. Over the remainder of the forecast, public debt charges are higher due to the increased outlook for short- and long-term interest rates as forecast by private sector economists. That being said, as outlined further in the Overview, public debt charges as a share of GDP remain below the average of the last two decades over the forecast period, despite the large extraordinary borrowing necessitated by COVID-19.
Summary Statement of Transactions
| Projection | |||||||
|---|---|---|---|---|---|---|---|
| 2020– 2021 |
2021– 2022 |
2022– 2023 |
2023– 2024 |
2024– 2025 |
2025– 2026 |
2026– 2027 |
|
| Budgetary revenues | 316.4 | 394.4 | 408.4 | 429.5 | 450.8 | 475.1 | 496.0 |
| Program expenses, excluding net actuarial losses | 608.5 | 473.0 | 425.4 | 430.4 | 439.2 | 453.1 | 463.3 |
| Public debt charges | 20.4 | 24.9 | 26.9 | 32.9 | 37.0 | 39.8 | 42.9 |
| Total expenses, excluding net actuarial losses | 628.9 | 497.9 | 452.3 | 463.3 | 476.2 | 492.9 | 506.1 |
| Budgetary balance before net actuarial losses | -312.4 | -103.5 | -43.9 | -33.8 | -25.5 | -17.8 | -10.2 |
| Net actuarial losses | -15.3 | -10.3 | -8.9 | -6.1 | -2.4 | -0.8 | 1.8 |
| Budgetary balance | -327.7 | -113.8 | -52.8 | -39.9 | -27.8 | -18.6 | -8.4 |
| Financial Position | |||||||
| Total liabilities | 1,652.2 | 1,803.8 | 1,819.5 | 1,854.8 | 1,907.6 | 1,949.2 | 1,976.1 |
| Financial assets1 | 502.4 | 541.3 | 504.3 | 496.5 | 518.0 | 537.4 | 553.0 |
| Net debt | 1,149.8 | 1,262.5 | 1,315.1 | 1,358.2 | 1,389.6 | 1,411.8 | 1,423.1 |
| Non-financial assets | 101.1 | 101.7 | 101.5 | 104.7 | 108.2 | 111.8 | 114.7 |
| Federal debt | 1,048.7 | 1,160.8 | 1,213.7 | 1,253.6 | 1,281.4 | 1,300.0 | 1,308.4 |
| Per cent of GDP | |||||||
| Budgetary revenues | 14.3 | 15.8 | 15.2 | 15.2 | 15.4 | 15.6 | 15.7 |
| Program expenses, excluding net actuarial losses | 27.6 | 18.9 | 15.8 | 15.3 | 15.0 | 14.9 | 14.7 |
| Public debt charges | 0.9 | 1.0 | 1.0 | 1.2 | 1.3 | 1.3 | 1.4 |
| Budgetary balance | -14.9 | -4.6 | -2.0 | -1.4 | -0.9 | -0.6 | -0.3 |
| Federal debt |
47.5 |
46.5 |
45.1 |
44.5 |
43.8 |
42.8 |
41.5 |
|
Note: Totals may not add due to rounding
|
|||||||
Outlook for Budgetary Revenues
| Projection | |||||||
|---|---|---|---|---|---|---|---|
| 2020– 2021 |
2021– 2022 |
2022– 2023 |
2023– 2024 |
2024– 2025 |
2025– 2026 |
2026– 2027 |
|
| Income tax revenues | |||||||
|
Personal income tax
|
174.8 | 189.4 | 197.3 | 205.7 | 214.7 | 225.5 | 236.1 |
|
Corporate income tax
|
54.1 | 72.8 | 68.4 | 69.9 | 72.5 | 76.8 | 79.5 |
|
Non-resident income tax
|
8.1 | 10.3 | 10.9 | 11.5 | 12.0 | 12.4 | 13.0 |
|
Total
|
237.0 | 272.5 | 276.6 | 287.1 | 299.2 | 314.7 | 328.6 |
| Excise tax and duty revenues | |||||||
|
Goods and Services Tax
|
32.4 | 44.0 | 47.8 | 49.5 | 51.2 | 52.8 | 54.7 |
|
Customs import duties
|
4.3 | 5.1 | 5.5 | 5.9 | 6.2 | 6.5 | 6.9 |
|
Other excise taxes/duties
|
10.3 | 11.1 | 12.0 | 12.5 | 12.6 | 12.7 | 12.8 |
|
Total
|
47.0 | 60.2 | 65.3 | 67.9 | 69.9 | 72.0 | 74.4 |
| Other taxes | 0.0 | 0.0 | 0.2 | 0.9 | 0.9 | 1.0 | 1.0 |
| Total tax revenues | 283.9 | 332.7 | 342.1 | 355.9 | 370.0 | 387.8 | 404.1 |
| Proceeds from the pollution pricing framework | 4.4 | 6.7 | 8.2 | 10.2 | 12.3 | 14.2 | 16.2 |
| Employment Insurance premium revenues | 22.4 | 23.8 | 25.8 | 28.0 | 30.4 | 32.2 | 33.3 |
| Other revenues | |||||||
|
Enterprise Crown corporations
|
-10.5 | 12.3 | 10.1 | 9.5 | 9.9 | 11.2 | 12.4 |
|
Other programs
|
14.1 | 17.8 | 20.4 | 23.5 | 25.4 | 26.6 | 26.5 |
|
Net foreign exchange
|
2.2 | 1.2 | 1.7 | 2.4 | 2.8 | 3.1 | 3.5 |
|
Total
|
5.7 | 31.2 | 32.3 | 35.4 | 38.1 | 40.9 | 42.3 |
| Total budgetary revenues | 316.4 | 394.4 | 408.4 | 429.5 | 450.8 | 475.1 | 496.0 |
| Per cent of GDP | |||||||
| Total tax revenues | 12.9 | 13.3 | 12.7 | 12.6 | 12.6 | 12.8 | 12.8 |
| Proceeds from the pollution pricing framework | 0.2 | 0.3 | 0.3 | 0.4 | 0.4 | 0.5 | 0.5 |
| Employment Insurance premium revenues | 1.0 | 1.0 | 1.0 | 1.0 | 1.0 | 1.1 | 1.1 |
| Other revenues | 0.3 | 1.3 | 1.2 | 1.3 | 1.3 | 1.3 | 1.3 |
| Total budgetary revenues | 14.3 | 15.8 | 15.2 | 15.2 | 15.4 | 15.6 | 15.7 |
|
Note: Totals may not add due to rounding. |
|||||||
Table A1.5 above provides an overview of projected budgetary revenues by major component.
Income Tax Revenues
Personal income tax revenues—the largest component of budgetary revenues at 55.2 per cent in 2020-21—are projected to increase to $189.4 billion in 2021-22, or 8.4 per cent, largely reflecting the robust recovery in household income (including labour income and employment). For the remainder of the forecast, personal income tax revenue growth averages 4.5 per cent, in line with projected nominal GDP growth.
Corporate income tax revenues are projected to increase by 34.6 per cent, to $72.8 billion in 2021-22, propelled by broad-based gains across industry sectors. Beyond this, corporate income tax revenues are expected to retreat by -6.1 per cent, in 2022-23, and then grow at an average rate of 3.9 per cent per year. This reflects the corporate profit outlook, which falls in 2022-23 due to a projected stabilization of commodity prices and the absence of one-time factors influencing growth in 2021-22, such as the release of pandemic-related loss provisions in the financial sector.
Overall, as a result of both higher commodity prices and a faster overall economic recovery than originally anticipated, corporate income tax revenues for 2021-22 are forecast to be 45 per cent higher than their pre-pandemic level in 2019-20.
Income taxes paid by non-residents on Canadian-sourced income, notably dividends and interest payments, are expected to grow to $10.3 billion in 2021-22, or 27 per cent, driven by robust corporate profit and investment income growth. Over the remainder of the forecast horizon, growth in non-resident income tax revenues is expected to average 4.8 per cent reflecting the outlook for corporate profits, dividends and interest rates.
Excise Tax and Duty Revenues
Goods and Services Tax (GST) revenues are projected to rebound to $44 billion in 2021-22, or 35.7 per cent, from a very weak 2020-21 outcome that was the result of the temporary pandemic driven shutdown of large portions of the retail sector and the reduction in revenues due to the cost of the one-time enhanced GST credit payment. Over the remainder of the projection period, GST revenues are forecast to grow by 4.4 per cent per year, on average, reflecting the outlook for taxable consumption.
Customs import duties are projected to increase 19.1 per cent in 2021-22, due to the economic recovery and the reduced demand for remissions of duties due to lower-than-expected imports of personal protective equipment and other medical goods. Customs import duty revenue is then estimated to grow at an average annual rate of 6.3 per cent, driven by projected growth in imports.
Other excise taxes and duties are expected to increase to $11.1 billion in 2021-22, or 8.4 per cent, as demand recovers, before softening to growth of an average annual rate of 2.9 per cent over the remainder of the projection period, reflecting expected consumption growth of motive fuels and tobacco products, in particular.
Other taxes include revenues from the Underused Housing Tax announced in Budget 2021. Revenues from this tax are projected to be $0.2 billion in 2022-23.
Proceeds From the Pollution Pricing Framework
Proceeds from the pollution pricing framework represent the direct proceeds from the federal fuel charge and the Output-Based Pricing System in jurisdictions in which the federal carbon pollution pricing system applies. Growth in the proceeds from the federal pollution pricing framework will be driven primarily by the increase in the carbon price over the fiscal planning horizon Footnote 1. All direct proceeds from the pollution pricing framework are returned to the jurisdictions where they were collected, with a majority of proceeds returned directly to Canadians through Climate Action Incentive payments.
Employment Insurance Premium Revenues
Employment Insurance (EI) premium revenues are projected to grow at 6.9 per cent over the horizon due to the significant projected improvement in the labour market, with the unemployment rate expected to fall to 5.5 per cent, a historically low level. The two-year freeze in premium rates is scheduled to end in 2023, returning to a premium rate-setting structure under current legislation that balances accumulated spending from the account over seven years. Premium rates are assumed to increase gradually from $1.58 in 2022 to $1.73 per $100 insurable earnings (see Box A1.1 for details of the outlook for the EI Operating Account). As a result of the faster and swifter recovery in the labour market over the last year, which led to both increased revenues as Canadians returned to work and reduced expenditures from less demand for Employment Insurance, this forecast represents a 10 cent improvement (reduction) in premiums compared to Budget 2021, which estimated a long-term premium rate of $1.83 as of 2028. If achieved, this rate would still be 15 cents lower than the $1.88 premium rate in 2015.
Box A1.1 Employment Insurance Operating Account
| 2020-2021 | 2021-2022 | 2022-2023 | 2023-2024 | 2024-2025 | 2025-2026 | 2026-2027 | ||||
|---|---|---|---|---|---|---|---|---|---|---|
| EI premium revenues | 22.4 | 23.8 | 25.8 | 28.0 | 30.4 | 32.2 | 33.3 | |||
| EI benefits1 | 33.7 | 39.0 | 31.3 | 24.4 | 24.8 | 25.4 | 26.3 | |||
| EI administration and other expenses2 | 2.5 | 2.9 | 2.1 | 2.0 | 2.0 | 2.0 | 2.0 | |||
| 20203 | 2021 | 2022 | 2023 | 2024 | 2025 | 2026 | 2027 | 2028 | 2029 | |
| EI Operating Account annual balance | -6.4 | -21.5 | -10.8 | 0.7 | 3.7 | 5.3 | 5.8 | 5.7 | 5.7 | 4.7 |
| EI Operating Account cumulative balance | -1.3 | -22.8 | -33.6 | -32.9 | -29.2 | -23.8 | -18.0 | -12.3 | -6.6 | -1.94 |
| Projected premium rate (per $100 of insurable earnings) | 1.58 | 1.58 | 1.58 | 1.63 | 1.68 | 1.73 | 1.73 | 1.73 | 1.73 | 1.73 |
|
1 EI benefits include regular EI benefits, sickness, maternity, parental,
compassionate care, fishing and work-sharing benefits, and employment benefits and
support measures. EI benefits exclude EI-Emergency Response Benefit costs in line
with the government’s commitment to credit the EI Operating Account. |
||||||||||
The Employment Insurance (EI) Operating Account operates within the Consolidated Revenue Fund. As such, EI-related revenues and expenses that are credited and charged to the Account, respectively, in accordance with the Employment Insurance Act, are consolidated with those of the government, and impact the budgetary balance. For consistency with the EI premium rate, which is set on a calendar-year basis with the objective of having the Account break even over time, the annual and cumulative balances of the Account are also presented on a calendar-year basis.
The EI Operating Account is expected to record annual deficits from 2020 to 2022 as a result of the increase in EI benefits (excluding the Emergency Response Benefit) and the temporary freeze on EI premiums through 2022. The Account is then projected to record annual surpluses due to projected increases in the premium rate, which are expected to rise in 5 cent increments, consistent with the legislated limit, until reaching $1.73. The increases reflect the practice of the break-even rate-setting mechanism that started with the setting of the 2017 premium rate.
Other Revenues
Other revenues consist of three broad components: net income from enterprise Crown corporations; other program revenues from returns on investments, proceeds from the sales of goods and services, and other miscellaneous revenues; and net foreign exchange revenues.
- Enterprise Crown corporation revenues are projected to rebound by $22.8 billion in 2021-22 and then decline slightly in 2022-23 and 2023-24 as the impact of one-time factors recedes—in particular, the impact of Bank of Canada programs introduced during COVID-19, including purchases of Government of Canada securities on the secondary market to support liquidity in financial markets. Beyond this, growth averages 9.1 per cent annually reflecting the outlooks presented in corporate plans of respective enterprise Crown corporations.
- Other program revenues are affected by consolidated Crown corporation revenues, interest rates, inflation, and exchange rate movements (which affect the Canadian-dollar value of foreign-denominated assets). These revenues are projected to increase by 26 per cent in 2021-22, primarily due to:
-
- An increase in interest and penalty revenue since waivers provided as part of the government’s COVID-19 response in 2020-21, which reduced that year’s revenue, are no longer in effect; and,
- A projected increase in revenue from sales of goods and services (e.g., VIA Rail revenue, fees for passports and visas, and wireless spectrum auction revenue).
- Over the remainder of the forecast horizon, other program revenues are projected to continue to grow largely as a result of increased interest rates and revenue from sales of goods and services.
- Net foreign exchange revenues, which consist mainly of returns on Canada’s official international reserves held in the Exchange Fund Account, are volatile and sensitive to fluctuations in foreign exchange rates and foreign interest rates. Assets in the Exchange Fund Account are mainly invested in debt securities of sovereigns and their agencies, and are held to aid in the control and protection of the external value of the Canadian dollar and to provide a source of liquidity for the government, if required. These revenues are projected to decrease in the near term due to lower gains on sales of investments, but increase over the remainder of the forecast horizon as a result of growth in reserves and higher projected interest rates.
Outlook for Program Expenses
| Projection | |||||||
|---|---|---|---|---|---|---|---|
| 2020– 2021 |
2021– 2022 |
2022– 2023 |
2023– 2024 |
2024– 2025 |
2025– 2026 |
2026– 2027 |
|
| Major transfers to persons | |||||||
| Elderly benefits | 58.5 | 61.0 | 68.2 | 73.6 | 78.0 | 82.6 | 87.2 |
| Employment Insurance benefits1 | 58.4 | 39.0 | 31.3 | 24.4 | 24.8 | 25.4 | 26.3 |
| COVID-19 income support for workers2 | 55.8 | 17.7 | 0.4 | 0.0 | 0.0 | 0.0 | 0.0 |
| Canada Child Benefit3 | 27.4 | 26.3 | 25.2 | 26.6 | 27.6 | 28.5 | 29.4 |
| Total | 200.1 | 144.0 | 125.1 | 124.6 | 130.4 | 136.4 | 142.9 |
| Major transfers to other levels of government | |||||||
| Canada Health Transfer | 45.9 | 45.1 | 45.2 | 49.1 | 51.8 | 53.9 | 56.0 |
| Canada Social Transfer | 15.0 | 15.5 | 15.9 | 16.4 | 16.9 | 17.4 | 17.9 |
| Equalization | 20.6 | 20.9 | 21.9 | 23.8 | 25.1 | 26.1 | 27.1 |
| Territorial Formula Financing | 4.2 | 4.4 | 4.6 | 4.9 | 5.1 | 5.2 | 5.4 |
| Canada Community-Building Fund | 4.3 | 2.3 | 2.3 | 2.4 | 2.4 | 2.5 | 2.5 |
| Home care and mental health | 1.3 | 1.5 | 1.2 | 1.2 | 1.2 | 1.2 | 1.2 |
| Canada-wide early learning and child care4 | 0.0 | 2.9 | 4.5 | 5.6 | 6.6 | 7.9 | 7.9 |
| Other fiscal arrangements5 | 15.4 | -5.2 | -5.6 | -6.5 | -6.8 | -7.1 | -7.5 |
| Total | 106.7 | 87.4 | 90.0 | 96.9 | 102.2 | 107.2 | 110.5 |
| Proceeds from the pollution pricing framework returned | 4.6 | 4.1 | 8.0 | 11.9 | 12.4 | 14.3 | 16.2 |
| Direct program expenses | |||||||
| Canada Emergency Wage Subsidy | 80.2 | 20.9 | 0.0 | 0.0 | 0.0 | 0.0 | 0.0 |
| Other transfer payments | 98.0 | 94.2 | 86.3 | 83.7 | 81.3 | 81.3 | 79.1 |
| Operating expenses6 | 119.1 | 122.4 | 116.0 | 113.4 | 112.9 | 113.8 | 114.5 |
| Total | 297.2 | 237.5 | 202.2 | 197.1 | 194.2 | 195.2 | 193.6 |
| Total program expenses, excluding net actuarial losses | 608.5 | 473.0 | 425.4 | 430.4 | 439.2 | 453.1 | 463.3 |
| Net actuarial losses (gains) | 15.3 | 10.3 | 8.9 | 6.1 | 2.4 | 0.8 | -1.8 |
| Per cent of GDP | |||||||
| Major transfers to persons | 9.1 | 5.8 | 4.7 | 4.4 | 4.5 | 4.5 | 4.5 |
| Major transfers to other levels of government | 4.8 | 3.5 | 3.3 | 3.4 | 3.5 | 3.5 | 3.5 |
| Direct program expenses | 13.5 | 9.5 | 7.5 | 7.0 | 6.6 | 6.4 | 6.1 |
| Total program expenses | 27.6 | 18.9 | 15.8 | 15.3 | 15.0 | 14.9 | 14.7 |
|
Note: Totals may not add due to rounding. |
|||||||
Table A1.6, above, provides an overview of the projection for program expenses by major component. As shown in the outlook, total program expenses as a share of GDP will continue to track downward, reflecting prudent and responsible fiscal management and a more normal trend in spending post-pandemic.
Program expenses consist of four main categories: major transfers to persons, major transfers to other levels of government, proceeds from the pollution pricing framework returned, and direct program expenses.
Major Transfers to Persons
Major transfers to persons consist of elderly benefits, Employment Insurance (EI) benefits, the Canada Child Benefit, and the COVID-19 income supports for workers.
Elderly benefits are projected to reach $61 billion in 2021-22, up 4.2 per cent. Over the forecast horizon, elderly benefits are forecast to grow by 7.4 per cent on average annually. Growth in elderly benefits is due to the increasing population of seniors and projected consumer price inflation, to which benefits are fully indexed, as well as the 10 per cent increase to Old Age Security payments for pensioners 75 and over on an ongoing basis as of July 2022, announced in Budget 2021.
EI benefits are projected to decrease to $39 billion in 2021-22, largely reflecting the expiration of temporary COVID-related EI measures and a lower unemployment rate. EI benefits are expected to fall further to $24.4 billion by 2023-24 as a result of the projected improvement in the labour market and grow at an average of 2.5 per cent annually thereafter.
The Canada Emergency Response Benefit was introduced as part of Canada’s COVID-19 Economic Response Plan to provide immediate assistance to Canadians. In September 2020, when this program ended, the government continued to support Canadians with the Canada Recovery Benefit, the Canada Recovery Sickness Benefit, and the Canada Recovery Caregiving Benefit. While the Canada Recovery Benefit ended on October 23, 2021, the government extended the sickness and caregiving benefits until May 7, 2022 and introduced the Canada Worker Lockdown Benefit. The Canada Worker Lockdown Benefit remains available for workers who face direct work interruptions due to public health lockdowns until May 7, 2022. These income support programs for workers are expected to cost $17.7 billion in 2021-22, decreasing to $0.4 billion in 2022-23 as the recovery strengthens and temporary programs end.
Canada Child Benefit (CCB) payments are projected to decrease 3.8 per cent to $26.3 billion in 2021-22, largely reflecting the phasing out of 2020-21 temporary top-up transfer. CCB benefits will decline further in 2022-23 due to the phasing out of the temporary supplement for families with young children introduced in the 2020 Fall Economic Statement. Over the remainder of the forecast horizon, CCB payments are expected to grow at an average annual rate of 3.9 per cent, reflecting forecasted recipient growth and consumer price inflation, to which the benefits are indexed.
Major Transfers to Other Levels of Government
Major transfers to other levels of government include the Canada Health Transfer (CHT), the Canada Social Transfer (CST), Equalization, Territorial Formula Financing, and the Canada Community-Building Fund, as well as significant COVID-related payments made to provinces and territories such as the Safe Restart Agreement and the Safe Return to Class Fund, among others. In 2021-22, these transfers are expected to decrease by 18.1 per cent to $87.4 billion, as transfers to provinces and territories normalized following the unprecedented level of support provided during the height of the pandemic.
Including the $2 billion top-up announced by the government on March 25, 2022, to address the backlog of surgeries and procedures, total CHT support is projected to be $45.1 billion in 2021-22. Beginning in 2022-23, the CHT is projected to grow from $45.2 billion to $56 billion in 2026-27, in line with a three-year moving average of nominal GDP growth, with funding guaranteed to increase by at least 3 per cent per year.
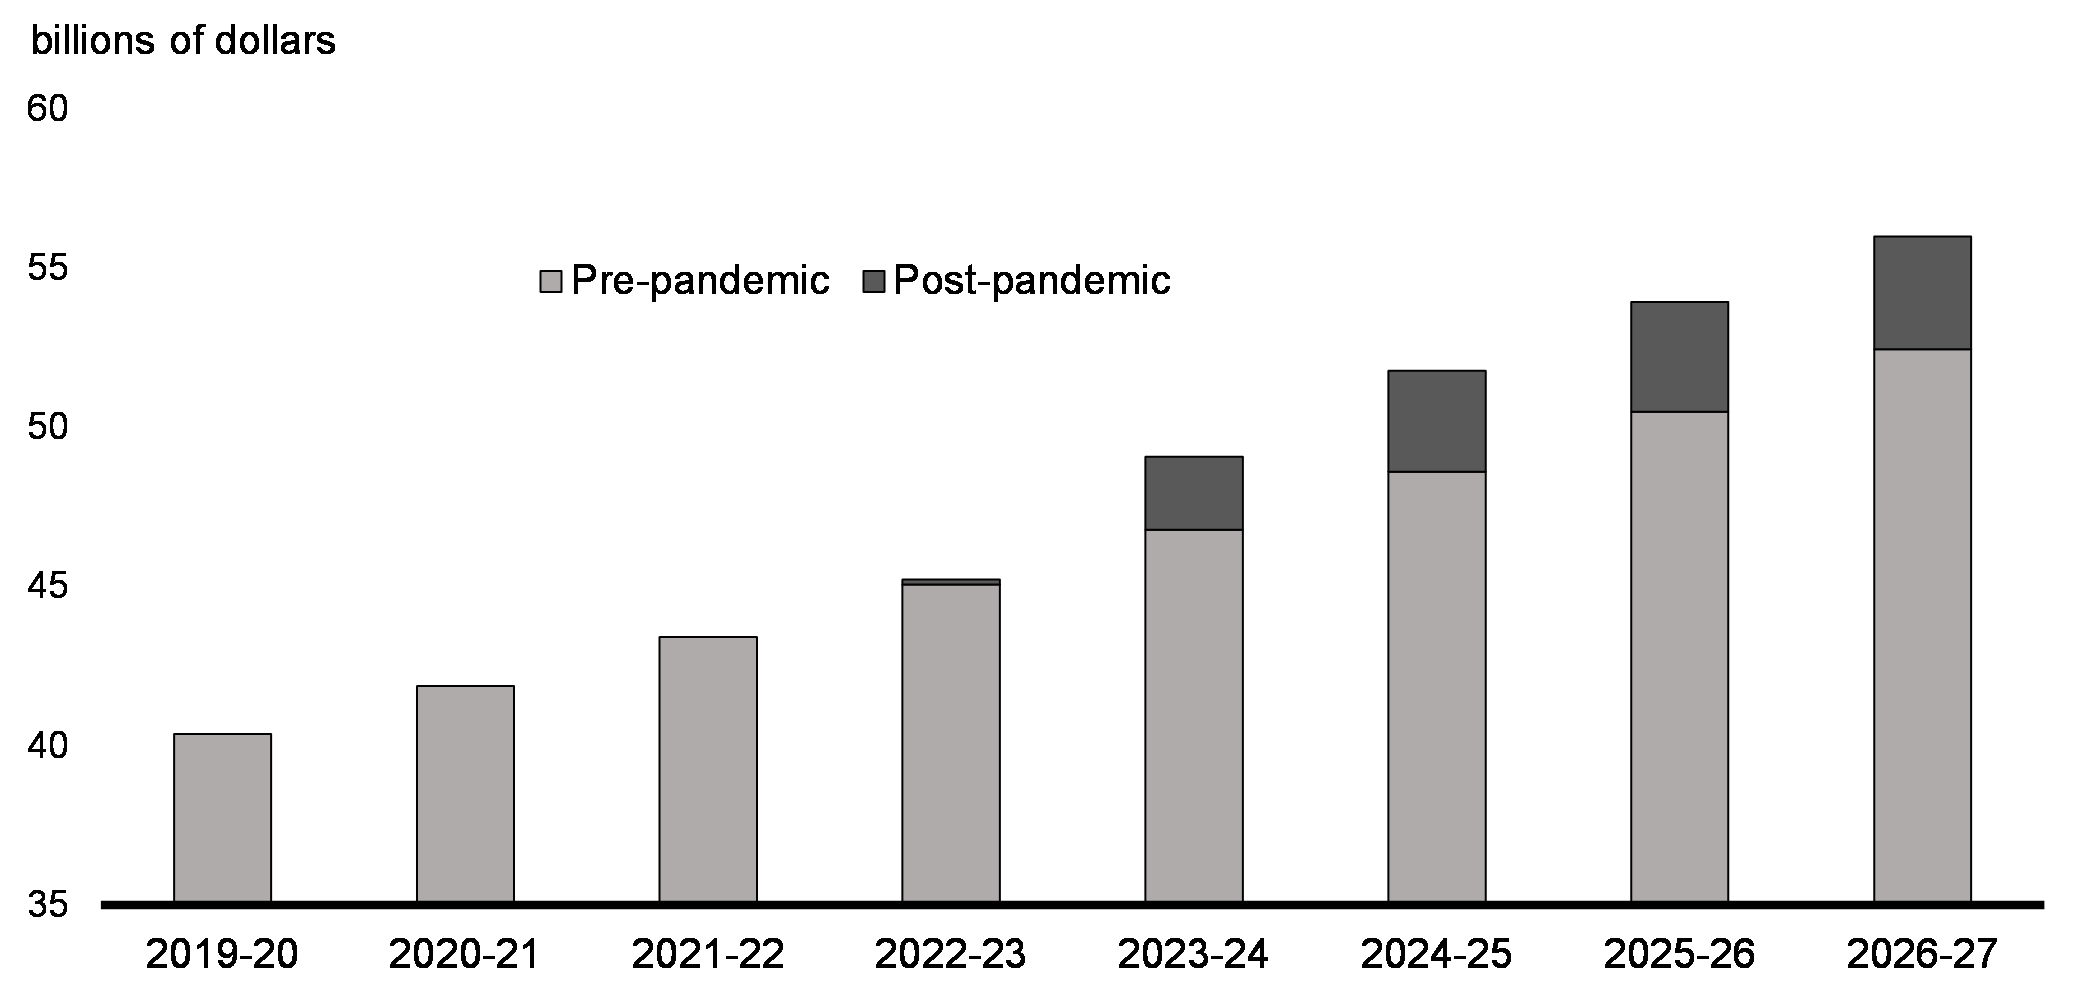
As a result of both the formula’s protection against down-side risk in the event of a recession (3 per cent floor), as well as the up-side from being linked to nominal GDP, provinces and territories are expected to receive $12 billion more in Canada Health Transfer payments over the next 5 years than originally forecast prior to the pandemic.
Pre- vs. Post-Pandemic Canada Health Transfer Forecast
The CST is legislated to grow at 3 per cent per year. Canada Community-Building Fund payments are indexed at 2 per cent per year, with increases applied in $100 million increments. Home care and mental health transfers are projected to be $1.5 billion in 2021-22, before stabilizing at $1.2 billion starting in 2022-23. Canada-wide early learning and child care transfer payments are expected to increase from $2.9 billion in 2021-22 to $7.9 billion in 2026-27, which includes the proposed Budget 2022 funding of $625 million over four years, beginning in 2023-24, to Employment and Social Development Canada for an Early Learning and Child Care Infrastructure Fund.
Proceeds From the Pollution Pricing Framework Returned
Proceeds from the pollution pricing framework returned represent the return of direct proceeds from the federal fuel charge and Output Based Pricing System to the jurisdiction from which they were collected. Proceeds from the pollution pricing framework returned are expected to be $4.1 billion in 2021-22, increasing to $16.2 billion by 2026-27, reflecting the increase in direct proceeds resulting from a higher price on carbon pollution.
Direct Program Expenses
Direct program expenses consist of the Canada Emergency Wage Subsidy, other transfer payments administered by departments, and operating expenses.
- Other transfer payments administered by departments are projected to decrease across the budgetary horizon from $94.2 billion in 2021-22 to $79.1 billion in 2026-27. The decline is steepest from 2021-22 to 2022-23, reflecting the phasing out of pandemic support programs. This trend is somewhat offset by measures announced in this budget, including funding to support investments in clean transportation and energy, such as the Zero-Emission Vehicles and the Low Carbon Economy Fund, and new housing supply.
- Operating expenses reflect the cost of doing business for more than 100 government departments, agencies, and Crown corporations. Operating expenses are forecasted to reach $122.4 billion in 2021-22 and decline to $112.9 billion in 2024-25, as pandemic-related expenses for procurement of vaccines, personal protective equipment, therapeutics, and rapid testing kits wind down. Operating expenses are then expected to grow modestly to $114.5 billion in 2026-27.
Net Actuarial Losses
Net actuarial losses, which represent changes in the measurement of the government’s obligations for pensions and other employee future benefits, are expected to gradually decline over the forecast horizon, from a projected loss of $10.3 billion in 2021-22 to a projected net actuarial gain of $1.8 billion in 2026-27, reflecting higher expected interest rates used to measure the present value of the obligations.
Financial Source/Requirement
The financial/source requirement measures the difference between cash coming in to the government and cash going out. In contrast, the budgetary balance is presented on a full accrual basis of accounting, meaning that government revenues and expenses are recorded when they are earned or incurred, regardless of when the cash is received or paid.
Table A1.7 provides a reconciliation of the two measures, starting with the budgetary balance. Non-budgetary transactions shown in the table reflect the reversal of certain revenues and expenses included in the budgetary balance that have no impact on cash flows in the year, such as the amortization of non-financial assets, and the addition of changes in asset and liability balances that have no accrual impact in a year but do result in the inflow or outflow of cash, such as the payment of accounts payable. An increase in a liability or decrease in an asset represents a financial source, whereas a decrease in a liability or increase in an asset represents a financial requirement. The sum of the budgetary balance and changes in asset and liability balances reflected under non-budgetary transactions is equal to the government’s net source of (+), or requirement for (-), cash.
| Projection | |||||||
|---|---|---|---|---|---|---|---|
| 2020– 2021 |
2021– 2022 |
2022– 2023 |
2023– 2024 |
2024– 2025 |
2025– 2026 |
2026– 2027 |
|
| Budgetary balance | -327.7 | -113.8 | -52.8 | -39.9 | -27.8 | -18.6 | -8.4 |
| Non-budgetary transactions | |||||||
|
Pensions and other accounts
|
16.9 | 11.8 | 10.4 | 6.7 | 2.1 | -0.1 | -3.1 |
|
Non-financial assets
|
-9.5 | -0.6 | 0.2 | -3.2 | -3.5 | -3.7 | -2.9 |
|
Loans, investments and advances
|
|||||||
|
Enterprise Crown corporations
|
5.5 | -12.7 | -6.5 | -9.2 | -9.2 | -9.9 | -8.3 |
|
Other
|
-31.9 | -1.8 | -3.0 | 24.8 | -3.8 | -3.6 | -1.8 |
|
Total
|
-26.4 | -14.5 | -9.5 | 15.7 | -13.0 | -13.5 | -10.1 |
|
Other transactions
|
|||||||
|
Accounts payable, receivable,
accruals and allowances |
19.9 | 16.7 | -25.0 | -1.0 | -1.7 | -2.6 | -2.9 |
|
Foreign exchange activities
|
12.3 | -5.2 | -8.2 | -8.1 | -7.9 | -4.1 | -4.1 |
|
Total
|
32.2 | 11.5 | -33.2 | -9.1 | -9.5 | -6.7 | -6.9 |
| Total | 13.2 | 8.2 | -32.0 | 10.0 | -23.9 | -23.9 | -22.9 |
| Financial source/requirement | -314.6 | -105.6 | -84.9 | -29.9 | -51.8 | -42.5 | -31.3 |
As shown in Table A1.7, a financial requirement is projected in each year over the forecast horizon, largely reflecting financial requirements associated with the projected budgetary balance and projected growth in financial assets. Reflecting an overall better fiscal outlook and less need for cash, the total financial requirement for 2021-22 of $105.6 billion is approximately $50.2 billion lower than forecast in EFU 2021 and about $85 billion lower than forecast in Budget 2021.
A financial source is projected for pensions and other accounts for 2021-22 to 2024-25. Pensions and other accounts include the activities of the Government of Canada’s employee pension plans and those of federally appointed judges and Members of Parliament, as well as a variety of other employee future benefit plans, such as health care and dental plans, and disability and other benefits for veterans and others. The financial source for pensions and other accounts reflects the difference between non-cash pension and benefit expenses recorded as part of the budgetary balance to reflect the value of benefits earned by employees during a fiscal year and the annual cash outflows for benefit payments. Financial requirements are projected for 2025-26 and 2026-27, as the balance of the government’s liabilities for pension and other accounts is expected to decline.
Financial requirements for non-financial assets mainly reflect the difference between cash outlays for the acquisition of new tangible capital assets and the amortization of capital assets included in the budgetary balance. They also include disposals of tangible capital assets and changes in inventories and prepaid expenses. Financial requirements are projected from 2023-24 to 2026-27, reflecting forecast net growth in non-financial assets.
Loans, investments and advances include the government’s investments in enterprise Crown corporations, including Canada Mortgage and Housing Corporation, Export Development Canada, the Business Development Bank of Canada, and Farm Credit Canada. They also include loans, investments and advances to national and provincial governments and international organizations, and under government programs, including the Canada Emergency Business Account (CEBA). The projected financial source for loans, investments and advances in 2023-24 is due to the expected repayment of CEBA loans, reflecting the recent extension of the forgiveness repayment date from December 31, 2022 to December 31, 2023.
In general, loans, investments and advances are expected to generate additional revenues for the government in the form of interest or additional net profits of enterprise Crown corporations, which partly offset debt charges associated with these borrowing requirements. These revenues are reflected in projections of the budgetary balance.
Other transactions include the payment of tax refunds and other accounts payable, the collection of taxes and other accounts receivable, the conversion of other accrual adjustments included in the budgetary balance into cash, as well as foreign exchange activities. Projected cash requirements from 2022-23 to 2026-27 mainly reflect the payment of accounts payable and forecast increases in the government’s official international reserves held in the Exchange Fund Account.
Alternative Economic Scenarios
While the macroeconomic inputs of the February 2022 survey of private sector economists continue to provide a reasonable basis for fiscal planning, the economic outlook is clouded by a number of key uncertainties.
Notably, Russia’s invasion of Ukraine, and related economic and financial sanctions, created a negative global supply shock that is pushing up commodity prices and inflation. The Canadian economy is less exposed to the economic fallout than other regions (e.g., Europe) given our limited trade links to Russia and Ukraine and Canada’s position as a net exporter of many commodities now in short supply. On the other hand, the conflict and the resulting sanctions disrupted global trade, led to tighter financial conditions, and put additional pressures on already stretched supply chains. Further, increased uncertainty around geopolitical risks could lead to more cautious behaviour by consumers and businesses. Overall, the net impact on economic activity is highly uncertain and depends on the path forward for global growth, commodity prices, and global interest rates. All of these drivers are intrinsically linked to the duration and impacts of the supply shock.
Beyond the conflict, further uncertainties continue to obscure the outlook, including the impact of the COVID-19 resurgence in China and other regions on supply chains, the effects of supply and labour shortages on inflation, and the impact of rising interest rates on the Canadian economy. On the other hand, Canada’s solid underlying fundamentals, including improved balance sheets and elevated profits, could also boost consumer spending and business investment by more than expected.
The Department of Finance actively engages with external economists to assess risks and uncertainties to the outlook. To illustrate the effects of unusually high uncertainty around the Russian invasion of Ukraine and its spillovers, the Department has considered two alternative economic scenarios to the private sector projections. Notably, the scenarios consider a wide range of views on the potential fallout from Russia’s invasion of Ukraine, including on the outlook for crude oil prices. Beyond the next two years, projections for crude oil prices are largely consistent with oil futures (i.e. a benign scenario for oil supply disruptions with crude oil prices easing back to pre-conflict levels). The scenarios also recognize that, while higher commodity prices should trigger investment in the oil and gas sector, the response is unlikely to be as strong as in past commodity booms given that supply disruptions – not stronger global demand – are behind the run-up in prices.
Heightened Impact Scenario
This scenario considers the economic repercussions of a drawn-out conflict in Ukraine with surging commodity prices, prolonged supply-chain disruptions, and more rapid monetary policy tightening. The result is weaker economic activity and temporarily stronger inflation.
- Supply disruptions resulting from a reduction in Russian energy exports lead to a spike in commodity prices, with WTI crude oil prices reaching a peak of US$180 in the second quarter of 2022.
- In response to higher inflation, global interest rates rise higher and more quickly than anticipated, with Canada’s three-month treasury bill rate up by almost 50 basis points on average per year compared to the February survey, contributing to weaker growth.
- Higher energy bills and weaker confidence substantially reduce consumption while ongoing supply shortages and trade disruptions hold back activity, leading to a sharp slowdown in global economic growth, potentially tipping some regions into recession (e.g., Europe).
- With a sharp slowdown in global economic activity, and a recession in some parts of the world, global crude oil prices moderate quickly and converge to the February survey by the second half of 2023.
- Weaker global activity reduces demand for Canadian products generally. Overall, growth in real GDP for 2023 as a whole remains slightly positive, though substantially lower than in the baseline forecast. Despite improved terms of trade, energy-related investment and exports remain relatively muted (compared to the February survey) due to lower global activity and uncertainty about longer-term demand for fossil fuels.
- Altogether, Canada sees significantly weaker real GDP growth in 2022 and 2023 compared to the February survey (close to 2 percentage points lower on average per year), while the unemployment rate is 0.7 percentage point higher in 2022, reflecting spillovers from global supply disruptions and higher interest rates.
- Despite slower growth compared to the February survey, higher domestic and commodity prices push up GDP inflation and nominal GDP in the near term before it falls below the survey in 2024 amid easing commodity prices and weaker economic growth. Initially, nominal GDP is $126 billion higher than the survey in 2022. The difference in nominal GDP shrinks to $18 billion in 2023 and turns below the survey level by around $23 billion on average per year over the last three years of the forecast horizon. Notably, this temporary spike in nominal GDP drives a temporary improvement to the budgetary balance and the debt-to-GDP ratio.
Moderate Impact Scenario
This scenario considers a de-escalation of tensions in Ukraine and a world in which supply disruptions from the conflict and pandemic are smaller than expected while global demand remains resilient along with an easing of geopolitical tensions. Although commodity prices and inflation spike immediately following Russia’s invasion of Ukraine, the global economy successfully adapts to COVID-19 risks and pivots to more secure commodity suppliers, reducing inflationary pressures as geopolitical tensions ease.
- After peaking at almost US$100 in the first quarter of 2022, global crude oil prices fall quickly but remain slightly above the February survey over the forecast horizon, limiting inflationary pressures compared to the Heightened Impact scenario, and thus the loss of consumers’ purchasing power.
- This leads to a smaller drag on global growth, as well as a smaller increase in interest rates (up by 20 basis points on average per year compared to the February survey) needed to bring inflation back to target without derailing the economic expansion.
- At the same time, Canadian commodity producers make full use of current spare capacity and increase investment, albeit not commensurate to the rise in energy prices. This along with improved sentiment provides a boost to economic growth. Increased activity in the sector also supports employment growth and real incomes, pushing up spending on domestically-produced goods and services.
- Altogether, Canada sees stronger real GDP growth in 2022 and 2023 compared to the February survey, supported by Canada’s strong underlying fundamentals, increased activity in commodity sectors, and faster adjustments to the supply shock.
- With higher commodity prices and stronger real GDP growth, nominal GDP remains well above the February survey over the entire forecast horizon. Altogether, nominal GDP is about $77 billion higher than the February survey outlook on average per year.
| 2022 | 2023 | 2024 | 2025 | 2026 | 2022- 2026 |
|
|---|---|---|---|---|---|---|
| Real GDP Growth | ||||||
| Budget 2022 | 3.9 | 3.1 | 2.0 | 1.9 | 1.8 | 2.5 |
| Heightened Impact Scenario | 2.8 | 0.4 | 2.0 | 2.4 | 2.2 | 2.0 |
| Moderate Impact Scenario | 4.3 | 4.0 | 2.1 | 1.8 | 1.7 | 2.8 |
| GDP Inflation | ||||||
| Budget 2022 | 3.7 | 1.7 | 1.8 | 1.9 | 1.9 | 2.2 |
| Heightened Impact Scenario | 9.7 | 0.4 | 0.5 | 1.3 | 1.6 | 2.7 |
| Moderate Impact Scenario | 5.4 | 1.8 | 1.5 | 1.8 | 1.9 | 2.5 |
| Nominal GDP Growth | ||||||
| Budget 2022 | 7.7 | 4.8 | 3.9 | 3.8 | 3.7 | 4.8 |
| Heightened Impact Scenario | 12.8 | 0.8 | 2.5 | 3.7 | 3.8 | 4.7 |
| Moderate Impact Scenario | 10.0 | 5.8 | 3.6 | 3.6 | 3.6 | 5.3 |
| Nominal GDP Level ($ billions) |
||||||
| Budget 2022 | 2,689 | 2,819 | 2,929 | 3,040 | 3,153 | |
| Heightened Impact Scenario | 2,815 | 2,837 | 2,908 | 3,015 | 3,130 | |
| Moderate Impact Scenario | 2,746 | 2,905 | 3,011 | 3,119 | 3,232 | |
| Difference between Budget 2022 and Heightened Impact Scenario | 126 | 18 | -21 | -25 | -22 | 15 |
| Difference between Budget 2022 and Moderate Impact Scenario | 57 | 86 | 82 | 79 | 79 | 77 |
| Unemployment Rate | ||||||
| Budget 2022 | 5.8 | 5.5 | 5.5 | 5.5 | 5.5 | 5.5 |
| Heightened Impact Scenario | 5.9 | 6.2 | 6.1 | 6.0 | 5.9 | 6.0 |
| Moderate Impact Scenario | 5.6 | 5.2 | 5.2 | 5.3 | 5.3 | 5.3 |
| 3-month Treasury Bill Rate | ||||||
| Budget 2022 | 0.8 | 1.7 | 2.0 | 2.1 | 2.1 | 1.7 |
| Heightened Impact Scenario | 1.5 | 2.3 | 2.4 | 2.3 | 2.3 | 2.2 |
| Moderate Impact Scenario | 1.1 | 1.9 | 2.2 | 2.2 | 2.3 | 1.9 |
| CPI Inflation | ||||||
| Budget 2022 | 3.9 | 2.4 | 2.2 | 2.1 | 2.0 | 2.5 |
| Heightened Impact Scenario | 6.3 | 2.7 | 1.8 | 2.0 | 2.0 | 3.0 |
| Moderate Impact Scenario | 5.7 | 2.9 | 1.9 | 2.0 | 2.0 | 2.9 |
| WTI Crude Oil Price ($US/barrel) | ||||||
| Budget 2022 | 80 | 74 | 70 | 68 | 66 | 72 |
| Heightened Impact Scenario | 126 | 79 | 70 | 68 | 66 | 82 |
| Moderate Impact Scenario | 89 | 79 | 74 | 72 | 69 | 77 |
|
Sources: Department of Finance Canada February 2022 survey of private sector economists, which has been adjusted to incorporate the actual results of the National Accounts for the fourth quarter of 2021 released on March 1, 2022; Department of Finance Canada calculations. |
||||||
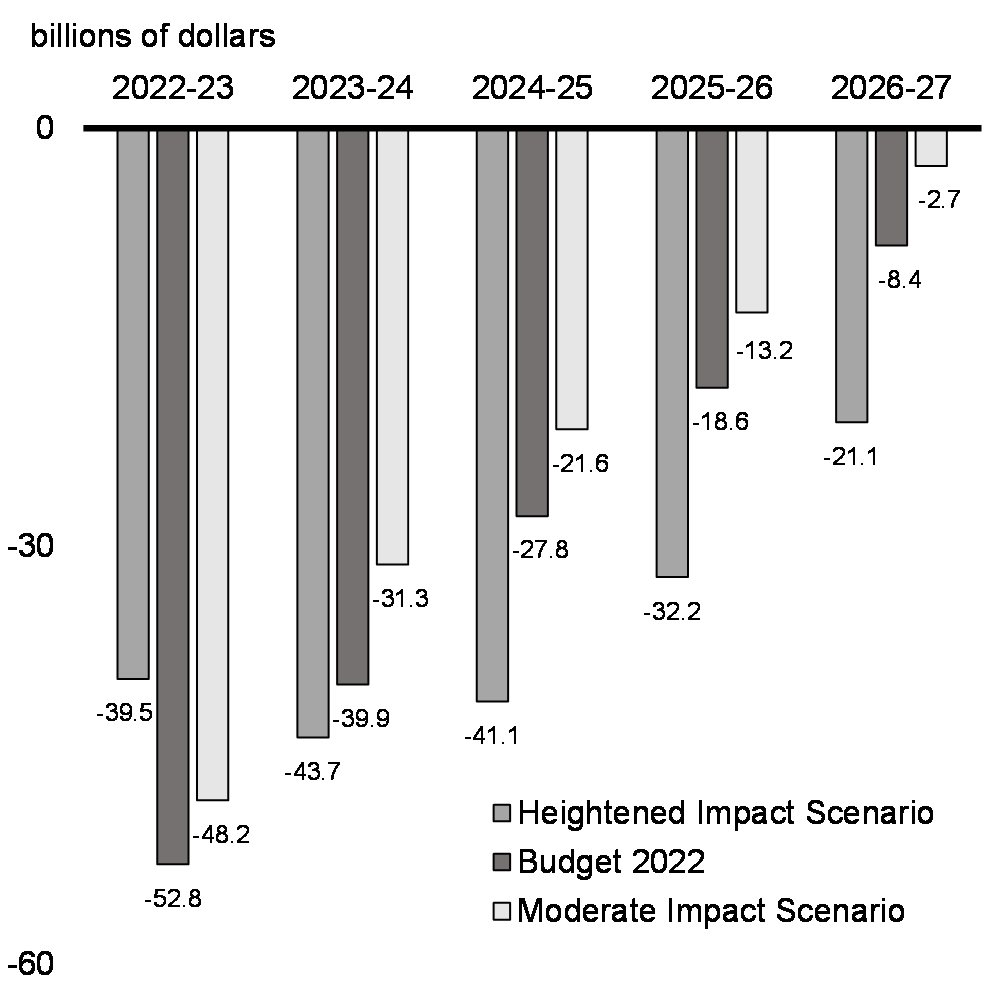
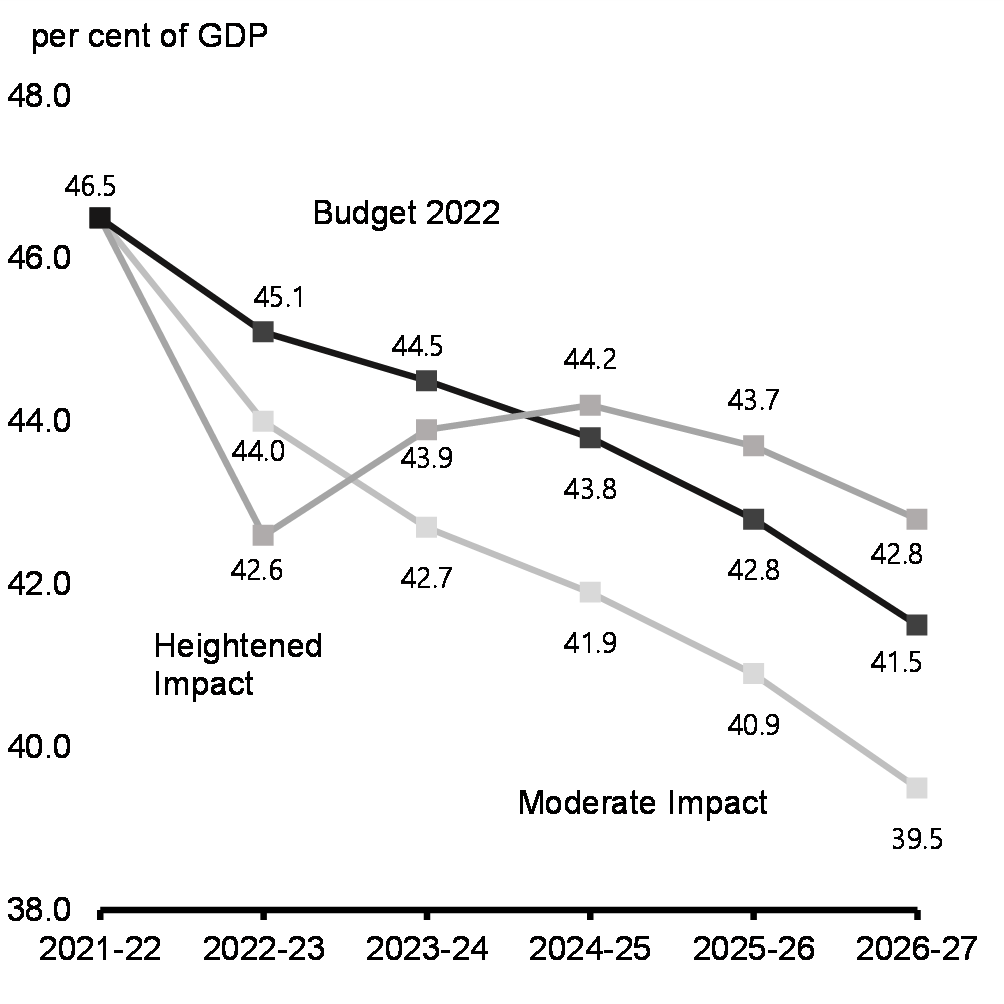
The potential impact of these increased uncertainties on the projected federal deficit and debt-to-GDP ratio is shown in Charts A1.2 and A1.3 below. The relative change in economic activity under both scenarios would be expected to affect tax revenues, and expenses such as Employment Insurance benefits, and major health and social transfer payments to provinces.
- In the Heightened Impact scenario, the budgetary balance worsens in all years except 2022-23, due to lower revenues stemming from the economic deterioration. In the first year, the near-term improvement in nominal GDP, driven by commodity prices, dominates and more than offsets the increase in expenses.
- In the Moderate Impact scenario, revenue is projected to experience a broad-based increase reflecting greater income, profits, and employment, and lower use of income supports, partially offset by higher health and social transfers.
In total, the Heightened Impact scenario could be expected to add about $6 billion on average to the deficit across the horizon, and the federal debt-to-GDP ratio would would be 1.3 percentage points higher, at 42.8 per cent, by 2026-27. In the Moderate Impact scenario, the deficit would be reduced by $6.1 billion on average across the projection, and the federal debt-to-GDP ratio would fall to 39.5 per cent by 2026-27, 2 percentage points below the Budget 2022 projection.
Deficit Under Alternative Economic Scenarios
Federal Debt-to-GDP Ratio Under Alternative Economic Scenarios
Supplementary Information
Sensitivity of Fiscal Projections to Economic Shocks
Changes in economic assumptions affect the projections for revenues and expenses. The following tables illustrate the sensitivity of the budgetary balance to a number of economic shocks relative to the baseline Budget 2022 projections, which already incorporate forecast changes in levels to these components over the budget horizon:
- A one-year, 1-percentage-point decrease in real GDP growth driven equally by lower productivity and employment growth.
- A decrease in nominal GDP growth resulting solely from a one-year, 1-percentage-point decrease in the rate of GDP inflation (assuming that the Consumer Price Index moves in line with GDP inflation).
- A sustained 100-basis-point increase in all interest rates.
These sensitivities are generalized rules of thumb that assume any decrease in economic activity is proportional across income and expenditure components, and are meant to provide a broad illustration of the impact of economic shocks on the outlook for the budgetary balance. The sensitivity analysis conducted in this section has been presented routinely in budgets since 1994, and is separate from the scenarios for a faster or slower recovery presented earlier in this annex. Actual economic shocks may have different fiscal impacts. For example, they may be concentrated in specific sectors of the economy or cause different responses in key economic variables (e.g., GDP inflation and CPI inflation may have different responses to a given shock).
| Year 1 | Year 2 | Year 5 | |
|---|---|---|---|
| Federal revenues | |||
|
Tax revenues
|
|||
|
Personal income tax
|
-2.7 | -2.9 | -3.3 |
|
Corporate income tax
|
-0.6 | -0.7 | -0.9 |
|
Goods and Services Tax
|
-0.4 | -0.4 | -0.5 |
|
Other
|
-0.2 | -0.2 | -0.2 |
|
Total tax revenues
|
-3.9 | -4.1 | -4.9 |
|
Employment Insurance premiums
|
-0.1 | -0.2 | -0.2 |
|
Other revenues
|
-0.1 | -0.1 | -0.1 |
| Total budgetary revenues | -4.1 | -4.3 | -5.1 |
| Federal expenses | |||
|
Major transfers to persons
|
|||
|
Elderly benefits
|
-0.1 | 0.0 | 0.0 |
|
Employment Insurance benefits
|
1.0 | 1.0 | 1.1 |
|
Canada Child Benefit
|
0.1 | 0.2 | 0.2 |
|
Total major transfers to persons
|
1.0 | 1.2 | 1.3 |
|
Other program expenses
|
-0.2 | -0.3 | -0.6 |
|
Public debt charges
|
0.0 | 0.2 | 0.6 |
| Total expenses | 0.8 | 1.1 | 1.3 |
| Budgetary balance | -5.0 | -5.4 | -6.4 |
A 1-percentage-point decrease in real GDP growth proportional across income and expenditure components reduces the budgetary balance by $5.0 billion in the first year, $5.4 billion in the second year, and $6.4 billion in the fifth year (Table A1.9).
- Tax revenues from all sources fall by a total of $3.9 billion in the first year. Personal income tax revenues decrease as employment and the underlying tax base fall. Corporate income tax revenues fall as output and profits decrease. GST revenues decrease as a result of lower consumer spending associated with the fall in employment and personal income.
- EI premium revenues are relatively unchanged, as the EI premium rate is bound by the 5-cent maximum annual increase for the majority of the baseline forecast. EI revenues would typically rise as a result of this shock, as the EI premium rate increases under the seven-year break-even mechanism, adjusting to offset the increase in benefits such that the EI Operating Account balances over time.
- Expenses rise, mainly reflecting higher EI benefits (due to an increase in the number of unemployed) and higher public debt charges (reflecting a higher stock of debt due to the lower budgetary balance). This rise is partially offset by lower other program expenses, primarily the Canada Health Transfer and Equalization, as the decline in real GDP is reflected in nominal GDP, to which these payments are indexed.
| Year 1 | Year 2 | Year 5 | |
|---|---|---|---|
| Federal revenues | |||
|
Tax revenues
|
|||
|
Personal income tax
|
-2.6 | -2.5 | -2.7 |
|
Corporate income tax
|
-0.6 | -0.7 | -0.9 |
|
Goods and Services Tax
|
-0.4 | -0.4 | -0.5 |
|
Other
|
-0.2 | -0.2 | -0.2 |
|
Total tax revenues
|
-3.8 | -3.7 | -4.3 |
|
Employment Insurance premiums
|
0.0 | -0.1 | -0.2 |
|
Other revenues
|
-0.1 | -0.1 | -0.1 |
| Total budgetary revenues | -3.9 | -3.9 | -4.6 |
| Federal expenses | |||
| Major transfers to persons | |||
|
Elderly benefits
|
-0.4 | -0.8 | -0.9 |
|
Employment Insurance benefits
|
-0.1 | -0.1 | -0.2 |
|
Canada Child Benefit
|
0.1 | -0.1 | -0.2 |
|
Total major transfers to persons
|
-0.5 | -1.0 | -1.4 |
|
Other program expenses
|
-0.6 | -0.7 | -1.7 |
|
Public debt charges
|
-0.6 | 0.1 | 0.2 |
| Total expenses | -1.7 | -1.6 | -2.9 |
| Budgetary balance | -2.2 | -2.3 | -1.8 |
A 1-percentage-point decrease in nominal GDP growth proportional across income and expenditure components, resulting solely from lower GDP inflation (assuming that the CPI moves in line with GDP inflation), lowers the budgetary balance by $2.2 billion in the first year, $2.3 billion in the second year, and $1.8 billion in the fifth year (Table A1.10).
- Lower prices result in lower nominal income and, as a result, personal income tax revenues decrease. As the parameters of the personal income tax system are indexed to inflation, the fiscal impact is smaller than under the real shock. For the other sources of tax revenue, the negative impacts are similar under the real and nominal GDP shocks.
- EI premium revenues decrease in response to lower earnings.
- Other revenues decline slightly as lower prices lead to lower revenues from the sales of goods and services.
- Partly offsetting lower revenues are the declines in the cost of statutory programs that are indexed to CPI inflation, such as elderly benefit payments, which puts downward pressure on federal program expenses. In addition, other program expenses are also lower as certain programs are linked directly to growth in nominal GDP, such as the Canada Health Transfer and Equalization.
- Public debt charges decline in the first year due to lower costs associated with Real Return Bonds.
| Year 1 | Year 2 | Year 5 | |
|---|---|---|---|
| Federal revenues | -1.4 | 0.2 | 2.4 |
| Federal expenses | 3.7 | 6.1 | 9.3 |
|
Of which: public debt charges
|
3.7 | 6.1 | 9.3 |
| Budgetary balance | -5.1 | -5.9 | -6.9 |
A 1 per cent increase in interest rates decreases the budgetary balance by $5.1 billion in the first year, $5.9 billion in the second year, and $6.9 billion in the fifth year (Table A1.11). Higher interest rates directly impact estimated public debt charges on marketable debt in two ways. First, interest costs increase as existing debt matures and is refinanced at higher rates. Second, rising rates increase the expected cost of future borrowing needs. Public debt charges are estimated based on the current expectations for future changes in interest rates, which are subject to change based on economic conditions.
It is important to note that interest rates also directly affect other government revenues and expenses and that they typically do not change in isolation. That is, with higher interest rates, the government would realize some offsetting benefits, including:
- Higher revenues from the government’s interest-bearing assets, which are recorded as part of other revenues;
- Corresponding downward adjustments that reduce the valuations of public sector pensions and employee benefits obligations, which are not incorporated in the table above; and,
- Higher government tax revenues if interest rate increases were due to stronger economic growth (also not included in the table above).
Even with a 1 per cent increase in interest rates, public debt charges are sustainable and would remain near historic lows as a proportion of GDP. Further discussion of public debt charges can be found in the Overview (Chart 27), which also compares forecasted increases in interest rates and borrowing costs over the budget horizon to historical trends.
Policy Actions Taken Since the 2021 Economic and Fiscal Update
Since 2016, the government has provided a transparent overview of all policy actions taken between budgets and updates. These measures, listed in Table A1.12, ensure that Canadians are continually well served by the programs they rely on and that government operations carry on as usual.
| 2021– 2022 |
2022– 2023 |
2023– 2024 |
2024– 2025 |
2025– 2026 |
2026– 2027 |
|
|---|---|---|---|---|---|---|
| Finishing the Fight Against COVID-19 | 3,619 | 1,503 | 447 | -126 | -26 | 1 |
| Support for Proof of Vaccination — International Travel | 28 | 1 | 1 | 1 | 1 | 1 |
| Funding provided to Immigration, Refugees and Citizenship Canada, the Canada Border Services Agency, and the Public Health Agency of Canada to cover federal costs associated with implementing verifiable proof of vaccination tools at Canadian borders. | ||||||
| Rapid Test Kits | 3,500 | 0 | 0 | 0 | 0 | 0 |
| Funding to support the procurement of rapid test kits to help curb the transmission of the COVID-19 virus. This could include the procurement of additional rapid test kits, treatments or therapeutics, or biomedical assets, including associated logistics and operational costs. | ||||||
| COVID-19 Testing Capacity and Border Operations | 650 | 350 | 0 | 0 | 0 | 0 |
|
Less: Funds Previously Provisioned in the
Fiscal Framework
|
-650 | 0 | 0 | 0 | 0 | 0 |
| Funding to enhance COVID-19 testing capacity and border operations, in particular related to the Omicron variant, in order to continue to protect Canadians and limit the spread of COVID-19. Funding also supports the Safe Voluntary Isolation Sites program. | ||||||
| Temporary Accommodations for Asylum Seekers | 88 | 0 | 0 | 0 | 0 | 0 |
| Funding provided for Immigration, Refugees and Citizenship Canada to provide temporary lodging sites in 2021-22 for asylum seekers arriving without a suitable COVID-19 quarantine plan or alternative accommodation options. | ||||||
| Supporting the Ongoing Delivery of Employment Insurance | 0 | 448 | 0 | 0 | 0 | 0 |
| Funding provided in 2022-23 to maintain Service Canada’s capacity to meet service standards for processing EI claims and to answer Canadians’ enquiries about their EI claims in a timely manner. | ||||||
| Regional Relief and Recovery Fund Adjustments | 3 | 0 | 0 | 0 | 0 | 0 |
|
Less: Funds Sourced From Existing Departmental
Resources
|
-6 | 0 | 0 | 0 | 0 | 0 |
| Funding adjustment for the Atlantic Canada Opportunities Agency to enable a greater use of repayable contributions as part of the Regional Relief and Recovery Fund. | ||||||
| Extension of the Short-Term Compensation Fund for Canadian Audiovisual Productions | 0 | 150 | 0 | 0 | 0 | 0 |
| Funding provided to Telefilm Canada to extend the Short-Term Compensation Fund until March31, 2023 to mitigate the lack of insurance coverage for COVID-19 production stoppages in the Canadian audiovisual industry. This one-year program extension was announced on February 11,2022. | ||||||
| COVID-19 Benefits and the Guaranteed Income Supplement (GIS), 2021 and Future Years | 0 | 333 | 120 | 3 | 0 | 0 |
| Funding provided to Employment and Social Development Canada pursuant to Bill C-12 (An Act to amend the Old Age Security Act), which received Royal Assent on March 3, 2022. These changes ensure that seniors who received pandemic benefits in 2021 or future years will not have their GIS or Allowance benefits affected. | ||||||
| Canada Worker Lockdown Benefit | 942 | 18 | 0 | 0 | 0 | 0 |
|
Less: Funds Previously Provisioned in the
Fiscal Framework
|
-942 | 0 | 0 | 0 | 0 | 0 |
| As announced on October 21, 2021, the Canada Worker Lockdown Benefit was introduced to support Canadians who are unable to work as a result of public health lockdowns in their region. Between December 19, 2021 and March 12, 2022, the benefit was temporarily expanded to include workers in regions where capacity-limiting restrictions of 50 per cent or more were in effect, during the peak of the Omicron wave. The benefit is set to end on May 7, 2022. | ||||||
| Expanding Access to the Local Lockdown Program | 1,320 | 0 | 0 | 0 | 0 | 0 |
|
Less: Funds Previously Provisioned in the
Fiscal Framework
|
-1,320 | 0 | 0 | 0 | 0 | 0 |
| As announced on December 22, 2021, this measure expanded access to the Local Lockdown Program from December 19, 2021 to February 12, 2022 to include employers subject to capacity-limiting restrictions of 50 per cent or more and with current-month revenue declines of at least 25per cent. On February 9, 2022, this measure was extended until March 12, 2022. | ||||||
| Extending the Repayment Deadline for the Canada Emergency Business Account (CEBA) | 6 | 221 | 326 | -130 | -27 | 0 |
| The repayment deadline for CEBA loans to qualify for partial loan forgiveness was extended by one year to December 31, 2023, for eligible borrowers in good standing. | ||||||
| Government Operations, Fairness, and Openness | 49 | 53 | 53 | 54 | 55 | 56 |
| Prince Edward Island Potato Wart Response Plan1 | 25 | 0 | 0 | 0 | 0 | 0 |
|
Less: Funds Sourced From Existing Departmental
Resources
|
-7 | 0 | 0 | 0 | 0 | 0 |
| Funding provided to Agriculture and Agri-Food Canada to support Prince Edward Island potato producers affected by trade disruptions relating to the potato wart outbreak, as announced on December 20, 2021. Funding is aimed at supporting the diversion of surplus potatoes, including help to redirect surplus potatoes to organizations addressing food insecurity and support for the environmentally sound disposal of surplus potatoes. Funding also seeks to support marketing activities and will help industry to develop long-term strategies to manage future challenges. | ||||||
| Implementing Tax Measures and Advancing Policy Priorities | 6 | 17 | 17 | 18 | 18 | 18 |
| Funding provided to the Department of Finance Canada to support increased expertise and analytical capacity to advance key priorities, including the design and implementation of a broad range of new and complex tax measures, Indigenous policy advancement, and work in emerging economic, social, and fiscal policy areas. Funding will also stabilize and secure the department’s information technology and other core operational functions. | ||||||
| Supporting Essential Goods and Services Within Federal Correctional Facilities | 0 | 12 | 12 | 12 | 12 | 12 |
| Funding adjustments for the Correctional Service of Canada to reflect non-discretionary cost increases for goods and services it uses, including electricity, water, food, prescription drugs, and contracted medical services for inmates. | ||||||
| Supporting the National Day for Truth and Reconciliation | 18 | 19 | 19 | 20 | 21 | 21 |
| Funding for the Treasury Board Secretariat to address federal public service costs associated with the statutory holiday—the National Day for Truth and Reconciliation. | ||||||
| Supporting Judicial Compensation and Benefits | 7 | 5 | 5 | 5 | 5 | 5 |
| Funding for the Courts Administration Service, Office of the Commissioner for Federal Judicial Affairs, and Office of the Registrar of the Supreme Court of Canada, to implement all of the recommendations from the sixth Quadrennial Commission on Judicial Compensation and Benefits’ report, as announced on December 29, 2021. | ||||||
| Growth, Innovation, Infrastructure, and the Environment | 39 | 11 | 0 | 0 | 0 | 0 |
| Emergency Response to the MV Schiedyk shipwreck | 33 | 0 | 0 | 0 | 0 | 0 |
| Funding for Fisheries and Oceans Canada to recover the costs expended for the response operation to remove pollutants from the sunken shipwreck MV Schiedyk. The Canadian Coast Guard worked with partners to remove heavy fuel oil inside the sunken ship and manage any residual pollutants in the surrounding area to protect the marine environment in Nootka Sound, British Columbia. | ||||||
| Funding for the Canadian Transportation Agency | 0 | 11 | 0 | 0 | 0 | 0 |
| Funding proposed for the Canadian Transportation Agency to address operating pressures related to the Agency’s broadened authorities and activities. This will enable the Agency to continue to provide timely dispute resolution services to Canadians when they are unable to resolve issues directly with service providers. | ||||||
| Support for Ottawa Businesses Impacted by Illegal Blockades | 20 | 0 | 0 | 0 | 0 | 0 |
|
Less: Funds Previously Provisioned in the
Fiscal Framework
|
-14 | 0 | 0 | 0 | 0 | 0 |
| Funding provided to the Federal Economic Development Agency for Southern Ontario to support eligible downtown Ottawa businesses who have suffered losses due to illegal blockades, as announced on February 19, 2022. | ||||||
| Labour Markets, Health, Safety, and Economic Prosperity of Canadians | 253 | 191 | 74 | 0 | 0 | 0 |
| First Nations Emergency Response and Recovery | 194 | 0 | 0 | 0 | 0 | 0 |
| Funding for Indigenous Services Canada to support First Nations in responding to and recovering from emergencies. | ||||||
| 2021-22 Adjustment to the Grant for the Canada-Quebec Accord on Immigration | 47 | 0 | 0 | 0 | 0 | 0 |
| Funding provided to Immigration, Refugees and Citizenship Canada for the annual adjustment to the payment to Quebec under the Canada-Quebec Accord on immigration. | ||||||
| Supporting Access to Post-Secondary Education for At-Risk and Indigenous Youth | 0 | 18 | 0 | 0 | 0 | 0 |
| Funding for Employment and Social Development Canada to ensure a continuity in financial and mentorship supports provided by Pathways to Education Canada and Indspire. | ||||||
| Reducing Veterans Disability Benefit Wait-Times | 0 | 85 | 74 | 0 | 0 | 0 |
|
Less: Funds Previously Provisioned in the
Fiscal Framework
|
0 | -19 | 0 | 0 | 0 | 0 |
| Funding for Veterans Affairs Canada to continue working on reducing disability benefit applications wait-times. Offsets include funding provided in Budget 2021 to extend temporary disability adjudicators hired in 2018 for an additional year. | ||||||
| AgriRecovery Response for B.C. Floods | 12 | 108 | 0 | 0 | 0 | 0 |
| Funding for Agriculture and Agri-Food Canada to support the creation of a $120 million AgriRecovery response initiative to help agricultural producers recover from flood damages in British Columbia. | ||||||
| Trade, International Relations, and Security | 17 | -50 | -29 | -16 | -23 | -41 |
| World Expo Osaka 2025 | 0 | 5 | 11 | 21 | 17 | 0 |
| Funding provided to Global Affairs Canada for Canada's participation in the next World Expo event, which will be held in Osaka in 2025. | ||||||
| Global Affairs Canada Adjustments for Non-Discretionary Cost Fluctuations | 17 | 32 | 47 | 50 | 47 | 47 |
|
Less: Projected Savings
|
0 | -87 | -87 | -87 | -87 | -87 |
| Funding provided to Global Affairs Canada for non-discretionary cost increases, such as changes in exchange rates and inflation, affecting missions abroad. This will allow Canada's missions to continue delivering a high standard of service to support the needs of Canadians. | ||||||
| Extension of Special Envoy on Preserving Holocaust Remembrance | 1 | 0 | 0 | 0 | 0 | 0 |
|
Less: Funds Sourced From Existing Departmental
Resources
|
-1 | 0 | 0 | 0 | 0 | 0 |
| An extension for the appointment of the Honourable Irwin Cotler as Canada's Special Envoy on Preserving Holocaust Remembrance and Combatting Anti-Semitism for a term of up to one year. | ||||||
| Tax and Financial Sector Policy | 24 | 496 | 280 | 120 | -195 | -140 |
| Expanding Immediate Expensing to a Broader Range of Taxpayers | -10 | 420 | 265 | 110 | -210 | -155 |
| As announced on February 4, 2022, the government proposed to expand eligibility for the immediate expensing measure announced in Budget 2021 to include unincorporated businesses and certain partnerships. Technical amendments were also proposed in relation to certain passenger vehicles (i.e., Class 10.1 assets). | ||||||
| Luxury Tax | 34 | 140 | 140 | 145 | 145 | 145 |
|
Less: Projected Revenues
|
0 | -79 | -140 | -145 | -145 | -145 |
| Budget 2021 proposed the introduction of a tax on the sale of new luxury cars and aircraft with a retail sale price over $100,000, and new boats over $250,000, effective as of January 1, 2022. The tax would be calculated at the lesser of 20 per cent of the value above these price thresholds or 10 per cent of the full value of the luxury vehicle, aircraft or vessel. On March 11, 2022, the Department of Finance Canada launched a public consultation on draft legislative proposals to implement the proposed tax framework. Subject to Parliamentary approval, this tax would now come into effect on September 1, 2022. | ||||||
| Changes to the Automobile Deduction Limits | 0 | 15 | 15 | 10 | 15 | 15 |
| On December 23, 2021, the government announced changes to the automobile deduction limits that would apply in 2022: (1) the ceiling applicable to capital cost allowances (CCA) for zero-emission passenger vehicles was increased from $55,000 to $59,000, before tax, in respect of vehicles (new and used) acquired on or after January 1, 2022; (2) the ceiling applicable to CCA for passenger vehicles was increased from $30,000 to $34,000, before tax, in respect of vehicles (new and used) acquired on or after January 1, 2022; and (3) the ceiling applicable to deductible leasing costs was increased from $800 to $900 per month, before tax, for new leases entered into on or after January 1, 2022. | ||||||
| (Net) Fiscal Impact of Non-Announced Measures Since Budget 2021 | -855 | -895 | -211 | -588 | -222 | -215 |
| The net fiscal impact of measures that are not announced is presented at the aggregate level, and would include provisions for anticipated Cabinet decisions not yet made (including the use of such provisions from previous budgets or updates) and funding decisions related to national security, commercial sensitivity, contract negotiations, and litigation issues. | ||||||
| Net Fiscal Impact – Total Policy Actions Taken Since the 2021 Economic and Fiscal Update | 3,147 | 1,310 | 614 | -556 | -412 | -339 |
|
Note: Totals may not add due to rounding. |
||||||
Canada's COVID-19 Economic Response Plan
Since March 2020, the government has committed over $350 billion—16.0 per cent of 2020 GDP—to support Canadians through the pandemic, with major investments in health care, procuring vaccines and personal protective equipment, in income support, and responding to businesses’ urgent needs. Altogether, these investments by the federal government represent approximately eight out of every ten dollars provided in Canada to fight COVID-19 and support Canadians.
Table A1.13 below updates the overview of Canada’s COVID-19 Economic Response Plan detailed in Chapters 1 and 2 of the 2020 Fall Economic Statement, with new COVID response measures taken since then, up to and including Budget 2022.
| Net Fiscal Impact (Accrual) | |||||
|---|---|---|---|---|---|
| Impact Value1 | 2019– 2020 |
2020– 2021 |
2021– 2022 |
Future Years2 | |
| Protecting Health and Safety | |||||
Safe Restart Agreement |
19,909 | - | 19,909 | - | - |
Safe Return to Class |
2,000 | - | 2,000 | - | - |
Vaccines and Therapeutics |
14,340 | - | 7,520 | 6,530 | 826 |
PPE and Medical Equipment |
5,352 | 200 | 3,331 | 1,821 | 289 |
Long-Term Care |
1,340 | - | 824 | 516 | 1 |
Helping Health Care Systems Recover |
4,000 | - | 4,000 | - | - |
Canada’s COVID-19 Immunization Plan |
1,000 | - | 1,000 | - | - |
Rapid Tests - Provinces, Territories and Workplaces |
1,450 | - | - | 1,450 | - |
Therapeutics |
1,000 | - | - | 1,000 | 1,000 |
Other Public Health Support |
12,839 | 382 | 6,831 | 5,272 | 578 |
Rapid Test Kits3 |
3,500 | 3,500 | |||
COVID-19 Testing Capacity and Border Operations3 |
650 | - | - | 650 | 350 |
Of which: amount provisioned in EFU 2021 for Omicron variant response4 |
650 | - | - | 650 | - |
Support for Proof of Vaccination — International Travel3 |
34 | - | - | 29 | 4 |
Reducing the Backlogs of Surgeries and Procedures5,6 |
2,000 | - | - | 2,000 | - |
| Total - Protecting Health and Safety | 69,414 | 582 | 45,414 | 22,767 | 3,047 |
Of which: |
|||||
| Policy Actions in EFU 20214 |
63,880 | 582 | 45,414 | 17,239 | 2,694 |
Policy Actions Since EFU 2021 (net) |
3,534 | - | - | 3,529 | 354 |
Policy Actions in Budget 2022 |
2,000 | - | - | 2,000 | - |
| Direct Support Measures | |||||
Canada Emergency Wage Subsidy |
101,050 | - | 80,166 | 20,884 | - |
EFU 2021 |
100,495 | - | 80,166 | 20,329 | - |
Revised estimate |
101,050 | - | 80,166 | 20,884 | - |
Difference |
555 | - | - | 555 | - |
Canada Emergency Rent Subsidy and Lockdown Support |
7,930 | - | 4,045 | 3,885 | - |
EFU 2021 |
8,015 | - | 4,045 | 3,970 | - |
Revised estimate |
7,930 | - | 4,045 | 3,885 | - |
Difference |
-85 | - | - | -85 | - |
Canada Emergency Response Benefit |
70,671 | 6,505 | 64,166 | - | - |
EFU 2021 |
70,671 | 6,505 | 64,166 | - | - |
Enhancements to Employment Insurance |
13,133 | - | 3,240 | 9,893 | 2,954 |
EFU 2021 |
13,133 | - | 3,240 | 9,893 | 2,954 |
Canada Recovery Benefit6 |
28,324 | - | 14,442 | 13,875 | 76 |
EFU 20216 |
28,661 | - | 14,442 | 14,212 | 76 |
Revised estimate6 |
28,324 | - | 14,442 | 13,875 | 76 |
Difference |
-338 | - | - | -338 | - |
Canada Recovery Sickness Benefit6 |
1,479 | 419 | 960 | 115 | |
EFU 20216 |
1,383 | - | 419 | 864 | 115 |
Revised estimate6 |
1,479 | - | 419 | 960 | 115 |
Difference |
96 | - | - | 96 | - |
Canada Recovery Caregiver Benefit6 |
4,620 | 1,967 | 2,333 | 341 | |
EFU 20216 |
5,273 | - | 1,967 | 2,986 | 341 |
Revised estimate6 |
4,620 | - | 1,967 | 2,333 | 341 |
Difference |
-653 | - | - | -653 | - |
Canada Workers Lockdown Benefit6 |
960 | - | - | 942 | 18 |
Of which: amount provisioned in EFU 2021 for Omicron variant response |
942 | - | - | 942 | - |
Canada Emergency Business Account – Incentive7 |
15,167 | - | 13,085 | 2,082 | - |
EFU 2021 |
14,076 | - | 13,085 | 992 | - |
Revised estimate |
15,167 | - | 13,085 | 2,082 | - |
Difference |
1,090 | - | - | 1,090 | - |
Targeting Supports for Deeply Affected Businesses6 |
6,075 | - | - | 5,655 | 420 |
EFU 20216 |
3,185 | - | - | 3,010 | 175 |
Local Lockdown Program – Expanded Eligibility (announced December 22, 2021 and February 9, 2022)3, 6 |
1,320 | - | - | 1,320 | - |
Revised estimate6 |
6,075 | - | - | 5,655 | 420 |
Difference6 |
1,570 | - | - | 1,325 | 245 |
Of which: amount provisioned in EFU 2021 for Omicron Variant response |
2,645 | - | - | 2,645 | - |
Other Direct Support Measures (EFU 2021) |
33,401 | 106 | 28,151 | 3,771 | 2,157 |
Remaining EFU 2021 provision for Omicron Variant response |
263 | - | - | 263 | - |
| Total - Direct Support Measures | 282,790 | 6,611 | 209,681 | 64,279 | 6,081 |
Of which: |
|||||
Policy Actions in EFU 20214 |
282,143 | 6,611 | 209,681 | 63,877 | 5,818 |
Impact of re-estimated costs |
2,235 | - | - | 1,990 | 245 |
Policy Actions Since EFU 2021 (net) |
-1,588 | - | - | -1,588 | 18 |
| Total-Protecting Health and Safety and Direct Support Measures | 352,204 | 7,193 | 255,095 | 87,046 | 9,128 |
| Tax and Customs Duty Payment Liquidity (in FES 2020) | 85,050 | 56 | 2,938 | 15 | -5 |
| Business Credit Availability Program and Other Credit Liquidity Support | 80,122 | - | 5,073 | 3,602 | 2,666 |
Of which: |
|||||
Policy Actions in EFU 2021 |
80,571 | - | 5,073 | 4,051 | 2,666 |
Impact of re-estimated costs |
-449 | - | - | -449 | - |
| Total- COVID-19 Economic Response Plan | 517,376 | 7,249 | 261,753 | 90,663 | 11,789 |
Of which: |
|||||
Policy Actions in EFU 20216,8 |
511,644 | 7,249 | 261,753 | 85,182 | 11,173 |
Impact of re-estimated costs |
1,786 | - | - | 1,541 | 245 |
Policy Actions since EFU 2021 (net)6 |
1,946 | - | - | 1,940 | 371 |
Policy Actions in Budget 2022 |
2,000 | - | - | 2,000 | - |
|
Note: Numbers may not add due to rounding.
|
|||||
1.3 Long-Term Economic and Fiscal Projections
Long-Term Debt Projections
As with any projection that extends over several decades, the long-term debt-to-GDP ratio projection presented in this budget is subject to a high degree of uncertainty and is sensitive to assumptions. It should not be viewed as a prediction of the future, but instead as a modelling scenario based on a set of reasonable economic and demographic assumptions, assuming no future changes in policies.
Building on the Budget 2022 forecasts, the long-term fiscal projection continues to indicate that federal public finances are sustainable beyond the usual budget forecast horizon, as demonstrated by a continuously declining debt-to-GDP ratio (Chart A1.4). This is despite adverse demographic trends, assumed modest future productivity growth rates, and projected increases in interest rates. As discussed in more detail in the next section, this conclusion is also robust to some changes in assumptions, including, for example, the projected growth rate of real GDP.
Long-Term Projections of the Federal Debt
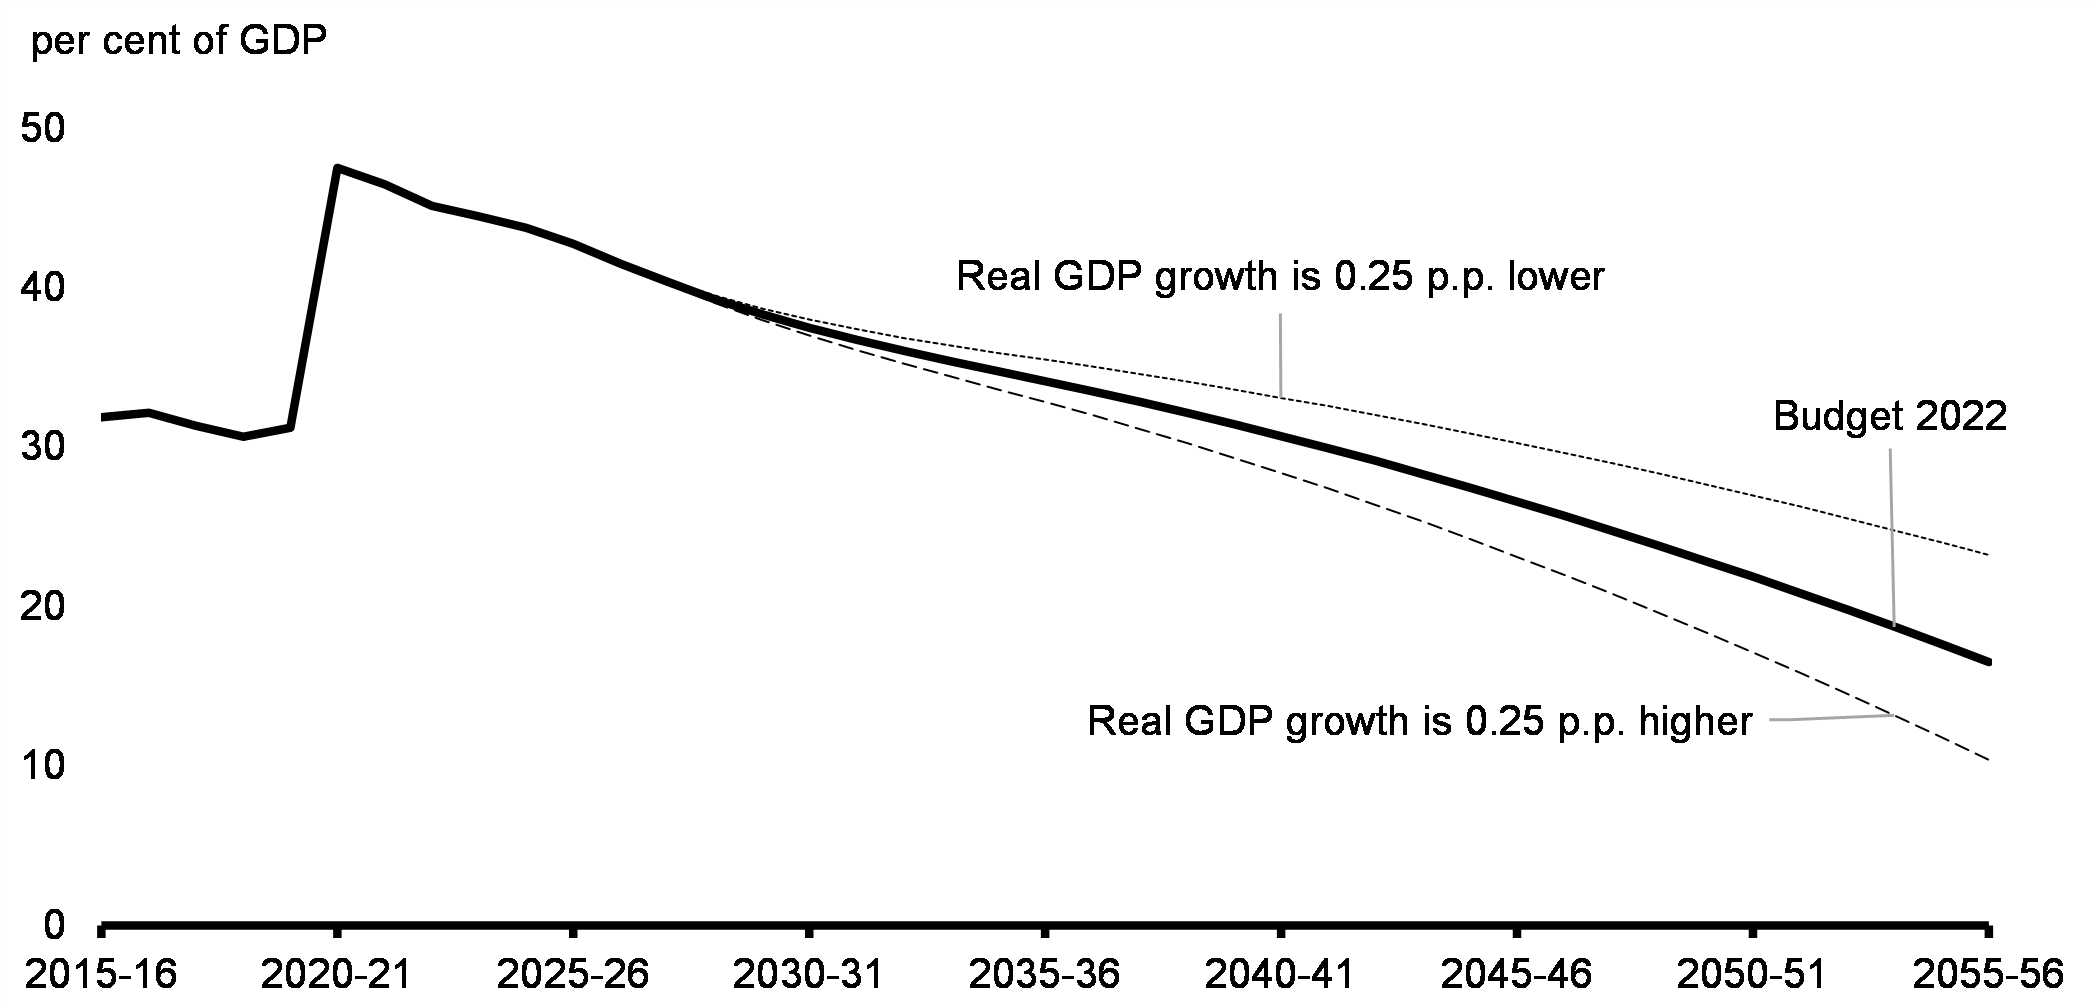
Budget 2022 is taking critical steps to advance the government’s long-term objectives of building a stronger and more resilient economy by reinvesting in areas that drive long-term growth while maintaining long-term fiscal sustainability. The government’s commitment to unwinding COVID-19-related deficits and reducing the federal debt-to-GDP ratio over the medium term will help ensure that fiscal room remains available to face future challenges and the risks that are not accounted for in this projection. These include, among others, climate change, the transition to net-zero, recessions, new pandemics, and deglobalization.
Methodology and Key Assumptions
To form the long-term economic projections, the medium-term (2022 to 2026) economic forecast presented in this budget is extended to 2055 using the long-term economic projection model of the Department of Finance Canada.
In this model, annual real GDP growth depends on labour productivity growth, which is calibrated over its 1974-2019 historical average (1 per cent), and labour input growth, which is based on demographic projections produced by the Centre for Demography at Statistics Canada using assumptions provided by the Department of Finance Canada and projections for the labour force participation rate and average hours worked using econometric models developed by the Department. Assuming a constant 2 per cent annual rate for GDP inflation, nominal GDP is projected to grow by an average of 3.7 per cent per year from 2027 to 2055 (Table A1.14).
| 1970– 2021 |
2022– 2026 |
2027– 2055 |
|
|---|---|---|---|
| Real GDP growth | 2.6 | 2.5 | 1.7 |
| Contributions of (percentage points): | |||
|
Labour supply growth
|
1.5 | 1.4 | 0.7 |
|
Working-age population
|
1.5 | 1.4 | 0.9 |
|
Labour force participation
|
0.2 | -0.5 | -0.2 |
|
Unemployment rate
|
-0.1 | 0.4 | 0.0 |
|
Average hours worked
|
-0.2 | 0.1 | 0.0 |
|
Labour productivity growth
|
1.1 | 1.1 | 1.0 |
|
Nominal GDP growth
|
6.8 | 4.8 | 3.7 |
|
Notes: Contributions may not add up due to rounding. The productivity growth assumption
represents a change from previous practice where projected productivity growth was based on
the slightly longer 1970-2019 average (1.2 per cent). |
|||
The long-term fiscal projections are obtained through an accounting model in which each revenue and expense category is modelled as a function of its underlying demographic and economic variables, with the relationships defined by a mix of current government policies and assumptions. The key assumptions are:
- All tax revenues as well as direct program expenses grow with nominal GDP.
- The Canada Health Transfer, Canada Social Transfer, and Equalization grow with their respective legislated escalators. The remaining federal transfers to other levels of government, depending on the transfer, grow with nominal GDP, the targeted populations and inflation, or current legislation.
- Old Age Security program and children’s benefits grow with the targeted populations and inflation. Employment Insurance (EI) benefits grow in line with the number of beneficiaries and the growth in average weekly earnings. The EI premium rate grows according to current program parameters.
- The effective interest rate on interest-bearing federal debt is assumed to gradually increase from about 2.4 per cent in 2026–27 to 3.3 per cent by the mid-2040s and to remain broadly stable around this level thereafter.
The sensitivity analysis below shows that the long-term fiscal projections are robust to some changes to these assumptions (Tables A1.15 and A1.16). It also confirms that government policies aimed at increasing labour force participation, immigration, and productivity could further help improve fiscal sustainability going forward.
| Baseline2 | High | Low | |
|---|---|---|---|
| Demographic: | |||
|
Fertility rate (average births per woman)
|
1.6 births | +0.5 births | -0.5 births |
|
Immigration (per cent of population)
|
0.9 | +0.25 p.p. | -0.25 p.p. |
|
Life expectancy at 65
|
22.6 years | +3 years | -3 years |
| Economic: | |||
|
Total labour force participation rate (per cent)
|
61.5 | +2.0 p.p. | -2.0 p.p. |
|
Average weekly hours worked
|
33.3 hours | +1.0 hour | -1.0 hour |
|
Unemployment rate (per cent)
|
5.5 | +1.0 p.p. | -1.0 p.p. |
|
Labour productivity (per cent)
|
1.0 | +0.25 p.p. | -0.25 p.p. |
|
Interest rates (per cent)
|
3.2 | +1.0 p.p. | -1.0 p.p. |
|
Note: p.p. = percentage point.
|
|||
| Baseline | High | Low | ||||
|---|---|---|---|---|---|---|
| Budgetary Balance | Debt | Budgetary Balance | Debt | Budgetary Balance | Debt | |
| Demographic: | ||||||
|
Fertility rate
|
0.5 | 16.5 | 0.3 | 19.9 | 0.7 | 13.0 |
|
Immigration
|
0.5 | 16.5 | 0.9 | 10.8 | 0.0 | 23.5 |
|
Life expectancy at 65
|
0.5 | 16.5 | 0.2 | 19.9 | 0.8 | 13.7 |
| Economic: | ||||||
|
Total labour force
participation rate |
0.5 | 16.5 | 0.8 | 11.8 | 0.2 | 22.0 |
|
Average weekly hours worked
|
0.5 | 16.5 | 0.8 | 12.2 | 0.2 | 21.5 |
|
Unemployment rate
|
0.5 | 16.5 | 0.4 | 18.1 | 0.6 | 15.0 |
|
Labour productivity
|
0.5 | 16.5 | 1.0 | 10.2 | 0.0 | 23.4 |
|
Interest rates
|
0.5 | 16.5 | 0.0 | 25.0 | 0.8 | 9.9 |
Report a problem on this page
- Date modified: