This page has been archived on the Web
Information identified as archived is provided for reference, research or recordkeeping purposes. It is not subject to the Government of Canada Web Standards and has not been altered or updated since it was archived. Please contact us to request a format other than those available.
Annex 2 - Debt Management Strategy for 2017-18
Introduction
The Debt Management Strategy sets out the Government of Canada’s objectives, strategy and borrowing plans for its domestic debt program and the management of its official international reserves. Borrowing activities support the ongoing refinancing of government debt coming to maturity, the execution of the budget plan and the financial operations of the Government. The Debt Management Strategy for 2017-18 reflects the latest fiscal projections.
The Financial Administration Act requires that the Government table in Parliament, prior to the start of the fiscal year, a report on the anticipated borrowing to be undertaken in the year ahead, including the purposes for which the money will be borrowed. The Debt Management Strategy fulfills this requirement.
Outlook for Government of Canada Debt
The Government of Canada continues to receive the highest possible credit ratings, with stable outlooks, from the five rating agencies that evaluate Canada’s debt.
Those rating agencies indicate that Canada’s effective, stable and predictable policy-making and political institutions, economic resilience and diversity, well-regulated financial markets, and the strength of monetary and fiscal flexibility support the country’s triple-A credit ratings.
Canada’s general government gross debt and net debt positions also remain favourable (see box entitled Gross vs. Net Debt Measures). According to the International Monetary Fund (IMF), Canada’s net debt-to-GDP (gross domestic product) ratio is the lowest in the G7, reflecting significant holdings of financial assets.
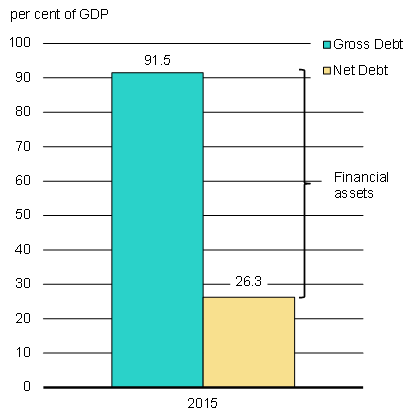
On a general government basis, the IMF reports that Canada’s total liabilities, or gross debt, totalled 91.5 per cent of GDP in 2015. To better assess a country’s fiscal position, however, a net debt measure should be used.
Net debt takes into account the value of a country’s financial assets (such as currency and deposits, short-term paper, bonds and debentures, foreign investments, loans, equity and investment fund shares, and other receivables), which could be liquidated if necessary.
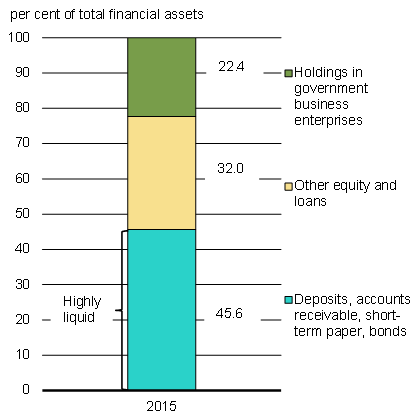
Canada’s general government net debt (total liabilities net of financial assets) was 26.3 per cent of GDP in 2015, as financial assets held by Canadian governments totalled over 65 per cent of GDP in that year (Chart A2.1). These assets reflect, in part, the country’s well-funded public pension systems and other holdings in publicly owned corporations, such as Canada Mortgage and Housing Corporation and provincially owned public utilities. The IMF estimates that close to half of Canada’s financial assets are highly liquid (e.g. deposits, short-term paper and bonds).
Canada’s net debt-to-GDP ratio is the lowest in the G7 and one-third the G7 average, while its gross debt-to-GDP ratio is the third lowest in the G7 and about 25 percentage points lower than the average.
Planned Borrowing Activities for 2017-18
Borrowing Authority
The authority for funds management flows from Part IV of the Financial Administration Act, which empowers the Minister of Finance to borrow money on behalf of Her Majesty in right of Canada.
The Government has delivered on its commitment to restore the requirement for Parliamentary approval of government borrowing to enhance transparency and accountability to Parliament. Budget 2017 proposes to implement this new framework by introducing legislation to seek Parliamentary approval of government borrowing.
The expected sources and uses of borrowings are set out below. Actual borrowings and uses of funds for the upcoming fiscal year compared with the forecast provided below will be reported in the Debt Management Report for 2017-18, and detailed information on outcomes will be provided in the Public Accounts of Canada 2018.
Sources of Borrowings
The aggregate principal amount of money to be borrowed by the Government in 2017-18 is projected to be $286 billion, primarily reflecting borrowing in domestic and foreign wholesale markets (Table A2.1).
Uses of Borrowings
The Government’s borrowing needs are driven by the refinancing of maturing debt, the Government’s expected financial source/requirement, and the expected changes in the Government’s cash balances.
While the Government’s cash balances are expected to remain the same from the beginning to the end of the fiscal year, refinancing needs for debt expected to mature by the end of 2017-18 are projected to be $247 billion. The financial requirement for 2017-18 is projected to be approximately $39 billion. The Government’s financial source/requirement measures the net cash flow attributed to the Government’s budgetary and non-budgetary transactions.1 If the Government has a net cash inflow (financial source), it can use the cash to decrease the total debt stock. If it has a net cash outflow (financial requirement), it must meet that requirement by increasing the total debt stock.
Actual borrowings for the year may differ from the forecast due to uncertainty associated with economic and fiscal projections, the timing of cash transactions, and other factors such as changes in foreign reserve needs and Crown borrowings.
| billions of dollars | |
|---|---|
| Sources of Borrowings | |
| Payable in Canadian currency | |
| Treasury bills1 | 131 |
| Bonds2 | 142 |
| Retail debt | 1 |
| Total payable in Canadian currency | 274 |
| Payable in foreign currencies | 12 |
| Total cash raised through borrowing activities | 286 |
| Uses of Borrowings | |
| Refinancing needs | |
| Payable in Canadian currency | |
| Treasury bills | 130 |
| Bonds | 103 |
| Of which: | |
| Regular bond buybacks | 1 |
| Cash management bond buybacks | 42 |
| Retail debt | 2 |
| Total payable in Canadian currency | 236 |
| Payable in foreign currencies | 11 |
| Total refinancing needs | 247 |
| Financial source/requirement | |
| Budgetary balance | 28 |
| Non-budgetary transactions | |
| Pension and other accounts | -3 |
| Non-financial assets | 1 |
| Loans, investments and advances | |
| Of which: | |
| Enterprise Crown corporations | 4 |
| Other | 1 |
| Total loans, investments and advances | 5 |
| Other transactions3 | 7 |
| Total non-budgetary transactions | 10 |
| Total financial source/requirement | 39 |
| Total uses of borrowings | 286 |
| Other unmatured debt transactions4 | 0 |
| Net Increase or Decrease (-) in Cash | 0 |
Debt Management Strategy for 2017-18
Objectives
The fundamental objectives of debt management are to raise stable and low-cost funding to meet the financial needs of the Government of Canada and to maintain a well-functioning Government of Canada securities market. Achieving stable, low-cost funding involves striking a balance between the cost and the risk associated with the debt structure as funding needs change and under various market conditions. Having access to a well-functioning government securities market ensures that funding can be raised efficiently over time to meet the Government’s needs. Moreover, to support a liquid and well-functioning Government of Canada securities market, the Government strives to promote transparency and regularity.
Debt Structure Planning
The Debt Management Strategy for 2017-18 is informed by analysis that reflects a wide range of economic and interest rate scenarios and forecasts for the debt structure over a medium-term horizon.
The Government seeks to strike a balance between keeping funding costs low and mitigating risks, as measured by metrics such as debt rollover and the variation in annual debt-service charges.
Market Consultations
As in previous years, market participants were consulted as part of the process of developing the debt management strategy.
During the consultations, market participants indicated that liquidity in treasury bills and more recently issued bonds (benchmark and building-to-benchmark bonds) in each sector is generally very good relative to both the size of the Government of Canada securities market and a year ago. On the other hand, bonds that have been outstanding for a longer period of time (off-the-run bonds) continue to be far less liquid, though some market participants indicated that the liquidity in these bonds has improved from last year.
Further details on the views expressed during consultations can be found on the Bank of Canada’s website.
Composition of Market Debt
The stock of total market debt is projected to reach $729 billion by the end of 2017-18 (Table A2.2).
| 2013-14 Actual |
2014-15 Actual |
2015-16 Actual |
2016-17 Estimated |
2017-18 Projected |
|
|---|---|---|---|---|---|
| Domestic bonds | 473 | 488 | 504 | 537 | 575 |
| Treasury bills | 153 | 136 | 138 | 130 | 131 |
| Foreign debt | 16 | 20 | 22 | 19 | 20 |
| Retail debt | 6 | 6 | 5 | 5 | 4 |
| Total market debt | 649 | 649 | 670 | 691 | 729 |
Over the next decade, the share of domestic market debt outstanding with original terms to maturity of 10 years or more is projected to be around 40 per cent. Additionally, the average term to maturity of domestic market debt is projected to remain relatively stable at around 5.5 to 6.5 years over the medium term.
Bond Program
In 2017-18, gross bond issuance is expected to be $142 billion,2 representing an increase of about $7 billion from 2016-17 levels (Table A2.3).
| 2013-14 Actual |
2014-15 Actual |
2015-16 Actual |
2016-17 Estimated |
2017-18 Projected |
|
|---|---|---|---|---|---|
| Gross bond issuance1 | 88 | 99 | 93 | 135 | 142 |
| Bond buybacks on a switch basis | -1 | -1 | -1 | -1 | -1 |
| Net issuance | 86 | 98 | 93 | 134 | 141 |
| Maturing bonds and adjustments2 | -82 | -84 | -78 | -102 | -103 |
| Change in bond stock | 4 | 15 | 16 | 33 | 39 |
The Debt Management Strategy for 2017-18 continues to have an increased focus on the issuance of short- and medium-term bonds (2-, 3- and 5-year maturities). This approach considers the liquidity needs of the market for core existing sectors while also satisfying the Government’s objectives of achieving stable, low-cost funding and promoting a well-functioning Government of Canada securities market.
Maturity Dates and Benchmark Bond Target Range Sizes
For 2017-18, no changes to the bond maturity pattern or benchmark target range sizes are planned relative to fiscal year 2016-17 (Table A2.4).
| Feb. | Mar. | May | June | Aug. | Sept. | Nov. | Dec. | |
|---|---|---|---|---|---|---|---|---|
| 2-year | 12-18 | 12-18 | 12-18 | 12-18 | ||||
| 3-year1 | 10-16 | 10-16 | ||||||
| 5-year | 14-20 | 14-20 | ||||||
| 10-year | 12-18 | |||||||
| 30-year2 | 10-16 | |||||||
| Real Return Bond2, 3 | 10-16 | |||||||
| Total | 12-18 | 24-36 | 12-18 | 12-18 | 12-18 | 24-36 | 12-18 | 10-16 |
Bond Auction Schedule
In 2017-18, there will be quarterly auctions of 2-, 3-, 5- and 10-year bonds, and 30-year Real Return Bonds. Some of these bonds may be issued multiple times per quarter. Based on feedback from consultations, 30-year nominal bond issuance will be redistributed across three auctions rather than two auctions. The number of auctions for each bond sector is shown in Table A2.5.
| Sector | Number |
|---|---|
| 2-year | 16 |
| 3-year | 8 |
| 5-year | 8 |
| 10-year | 5 |
| 30-year | 3 |
| Real Return Bond | 4 |
The order of bond auctions within each quarter may be adjusted to support the borrowing program. The dates of each auction will continue to be announced through the Quarterly Bond Schedule that is published on the Bank of Canada website prior to the start of each quarter.
Ultra-Long Bond Issuance
The Government may issue ultra-long bonds on a tactical basis if they are seen to contribute to the Government’s debt strategy objective of stable, low-cost funding and if market conditions are favourable.
Bond Buyback Programs
The Government plans to continue conducting regular bond buybacks on a switch basis and cash management bond buybacks.
Two bond buyback operations on a switch basis are planned for 2017-18. These operations would occur for bonds that were originally issued with terms to maturity of 30 years. The dates of each operation will continue to be announced through the Quarterly Bond Schedule that is published on the Bank of Canada website prior to the start of each quarter.
Weekly cash management bond buyback operations will be continued in 2017-18. The cash management bond buyback program helps to manage government cash requirements by reducing the high levels of cash balances needed ahead of large bond maturities.
Treasury Bill Program
For 2017-18, the stock of treasury bills is projected to end the fiscal year at $131 billion. This is consistent with the medium-term objective of maintaining a treasury bill stock that is large enough to promote market well-functioning while also managing debt rollover risk.
Bi-weekly issuance of 3-, 6- and 12-month maturities will be continued in 2017-18, with bi-weekly auction sizes projected to be largely in the $8 billion to $14 billion range. Cash management bills (i.e., short-dated treasury bills) help manage government cash requirements in an efficient manner. These instruments will also continue to be used in 2017-18.
Retail Debt
The Canada Savings Bonds Program, created in 1946, has historically provided the Government of Canada with a diversified source of funds. Given an overall decline in the sales of Canada Savings Bonds products, a proliferation of alternative investment vehicles for consumers, and management and administration costs of the Program, retail debt is no longer a cost-effective source of funds or a preferred investment by Canadians.
Consequently, the Government of Canada will discontinue the sales of retail debt products in 2017. All outstanding retail debt will continue to be honoured. More information regarding the Canada Savings Bonds Program and its contribution to Canada’s history can be found on the Canada Savings Bonds website.
Management of Canada’s Official International Reserves
The Exchange Fund Account (EFA), which is held in the name of the Minister of Finance, represents the largest component of Canada's official international reserves. The EFA is a portfolio made up of Canada’s liquid foreign exchange reserves (liquid reserves) and special drawing rights (SDRs).3 In addition to the EFA, Canada's official international reserves include Canada's reserve position held at the IMF.
The EFA aids in the control and protection of the external value of the Canadian dollar and provides a source of liquidity to the Government. The Government borrows to invest in liquid reserves, which are maintained at a level at or above 3 per cent of nominal GDP. To continue to meet this objective, funding requirements for 2017-18 are estimated to be around US$9 billion, but may vary as a result of movements in foreign interest rates and exchange rates.
The mix of funding sources used to finance the liquid reserves in 2017-18 will depend on a number of considerations, including relative cost, market conditions and the objective of maintaining a prudent foreign-currency-denominated debt maturity structure. Potential funding sources include a short-term US-dollar paper program (Canada bills), medium-term notes, international bond issues (global bonds), purchases and sales of Canadian dollars in foreign exchange markets, and cross-currency swaps involving the exchange of Canadian dollars for foreign currency to acquire liquid reserves.
Further information on foreign currency funding and the foreign reserve assets is available in the Report on the Management of Canada’s Official International Reserves and in The Fiscal Monitor.
Cash Management
The core objective of cash management is to ensure that the Government has sufficient cash available at all times to meet its operating requirements.
Cash consists of moneys on deposit with the Bank of Canada, chartered banks and other financial institutions. Cash with the Bank of Canada includes operational balances and balances held for prudential liquidity. Cash balances are projected to remain stable at $36 billion at the end of the fiscal year. Periodic updates on the liquidity position are available in The Fiscal Monitor.
Prudential Liquidity
The Government holds liquid financial assets in the form of domestic cash deposits and foreign exchange reserves to safeguard its ability to meet payment obligations in situations where normal access to funding markets may be disrupted or delayed. The Government’s overall liquidity levels cover at least one month of net projected cash flows, including coupon payments and debt refinancing needs.
1 Budgetary transactions include government revenues and expenses. Non-budgetary transactions include changes in federal employee pension accounts; changes in non-financial assets; investing activities through loans, investments and advances; and changes in other financial assets, including foreign exchange activities.
2 Includes additional debt that accrues during the fiscal year as a result of the inflation adjustments to Real Return Bonds.
3 SDRs are international reserve assets created by the IMF whose value is based on a basket of international currencies.