
Common menu bar links

Archived - Budget 2011
Annex 2: Debt Management Strategy for 2011–12 (June 6, 2011)
Table of Contents - Previous - Next
- Minor updates have been made to this annex to reflect changes to the financial requirement and the stock of treasury bills for 2010–11 and 2011–12, as a result of changes to the fiscal forecast.
Purpose
The Debt Management Strategy sets out the Government of Canada’s objectives, strategy and plans for the management of its domestic and foreign debt, other financial liabilities and related assets. Borrowing activities support the ongoing refinancing of government debt coming to maturity, the execution of the budget plan, and other financial operations of the Government, including investing in financial assets needed to establish a prudent liquidity position and borrowing on behalf of some Crown corporations.
The Financial Administration Act requires that the Government table in Parliament, prior to the start of the fiscal year, a report on the anticipated borrowing to be undertaken in the year ahead, including the purposes for which the money will be borrowed. This legislative requirement was fulfilled with the tabling of the 2011–12 Debt Management Strategy on March 22, 2011.
Highlights of the Federal Debt Management Strategy
- Updated Budget 2011 financial requirements for 2011–12 are projected to be lower than in 2010–11 at $36 billion versus $47 billion.
- The debt program for 2011–12 has been developed in the context of a new medium-term debt management strategy focused on stability and reduced financing risk.
- For 2011–12, gross issuance of domestic marketable bonds is planned to be approximately $102 billion. At the end of 2011–12, the stock of marketable bonds is projected to be $461 billion.
- Four new maturity dates have been introduced to reduce rollover risk. These new dates are expected to greatly reduce single-day rollover of maturing debt, with noticeable improvements beginning as early as 2013–14.
- Benchmark target range sizes in the 2-, 3- and 5-year sectors have been increased to facilitate the transition to the adjusted maturity dates in those sectors.
- Regular bond buyback program operations are planned to be $8 billion in 2011–12, about $3 billion higher than in 2010–11. For 2011–12, buyback operations on a cash basis will be reintroduced for longer-dated bonds.
- By the end of 2011–12, the treasury bill stock is projected to be $150 billion, about $13 billion lower than the year-end level for 2010–11.
- To improve prudential liquidity management, over the next three years, the Government will borrow an additional amount of $35 billion to safeguard its ability to meet payment obligations in situations where normal access to funding markets may be disrupted or delayed. This financing activity will have no material impact on the budgetary balance or the federal debt as the cost of the additional borrowing will be offset by a corresponding increase in returns on interest-bearing assets.
Medium-Term Debt Strategy
The Government of Canada’s debt securities have a ready and diversified investor base thanks to Canada’s strong fiscal position and a long-standing policy of maintaining a liquid, well-functioning securities market.
The financial crisis has highlighted the importance of prudent debt management for individuals, corporations and governments. The Government has therefore updated its debt strategy by adding new bond maturity dates for smoother cash flow and increasing cash reserves. These actions will help to insulate the Government’s financial position in case of future financial shocks.
Modelling analysis in support of the debt strategy has demonstrated that over a wide range of economic and interest rate scenarios, portfolios weighted towards more short- and medium-term bonds would improve the cost-risk characteristics of the debt structure. Consequently, the new medium-term debt strategy, while maintaining all current funding instruments, has an increased focus on the issuance of short- and medium-term bonds (2-, 3- and 5-year maturities). It includes specific actions to contain debt rollover levels, such as a reduction in the stock of treasury bills and changes to maturity dates in certain bond sectors.
Over time, the implementation of the strategy is expected to lead to a more balanced debt structure profile (Chart A2.1) and a reduced exposure to debt rollover risk, accompanied by continued maintenance of liquidity across all maturity sectors.
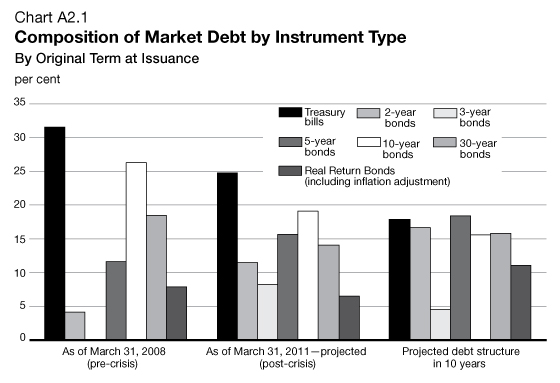
The medium-term debt strategy reduces the level of gross nominal long bond issuance and generally maintains the same level of Real Return Bond issuance compared to recent years. Nonetheless, the share of bonds with original terms of 30 years is expected to increase from 21 per cent to 27 per cent of the stock of market debt over the next decade. At that time, the share of longer-term debt is expected to stabilize as long bonds issued in the 1990s begin to mature. Over the coming decade, the share of bonds with original terms of 10 years or more is expected to hold steady at around 40 per cent.
It is projected that under the medium-term debt strategy, the net annual refixing share of debt, which measures the proportion of all interest-bearing debt net of financial assets that matures or needs to be repriced within one year, will fluctuate between 31 and 37 per cent (Chart A2.2).[1]
It is also projected that the average term to maturity of the market debt net of financial assets will range between 7 and 8 years (Chart A2.3).
The transition to the new debt structure is expected to take many years. During this period, the strategy will be monitored and, if necessary, adjusted to respond to unexpected changes in funding requirements.
Prudential Liquidity Management
The Government holds liquid financial assets in the form of domestic cash deposits and foreign exchange reserves to safeguard its ability to meet payment obligations in situations where normal access to funding markets may be disrupted or delayed. This also supports investor confidence in Canadian government debt. The level of prudential liquidity has remained relatively stable in recent years, even as the overall debt and refinancing needs have increased. The Government therefore plans to increase its liquidity position over the medium term.
When the new liquidity plan is fully implemented, the Government’s overall liquidity levels will cover at least one month of the net projected cash flows, including coupon payments and debt refinancing needs. The one-month coverage requirement is consistent with the proposed liquidity coverage rule for banks under Basel III. To accomplish this, over the next three fiscal years, government deposits held with financial institutions and the Bank of Canada will increase by about $25 billion. Liquid foreign exchange reserves will increase by US$10 billion over the next fiscal year, and subsequently rise sufficiently to maintain their level at or above 3 per cent of nominal gross domestic product. In total, prudential liquidity will increase by about $35 billion by the end of 2013–14.
The financing activity necessary to increase prudential liquidity will have no material impact on the budgetary balance or the federal debt as the cost of the additional borrowing will be offset by a corresponding increase in returns on interest‑bearing assets.
Information on cash balances and foreign exchange assets is available through The Fiscal Monitor. Information on the management of Canada’s reserves held in the Exchange Fund Account is available in the Report on the Management of Canada’s Official International Reserves.
Planned Borrowing Activities for 2011–12
Borrowing Authority
For 2011–12, the aggregate borrowing limit that was approved by the Governor in Council to meet updated Budget 2011 financial requirements and provide a margin for prudence was $300 billion, the same amount requested and approved for 2010–11.
Actual borrowing and uses of funds compared with those forecast will be reported in the 2011–12 Debt Management Report, and detailed information on outcomes will be provided in the 2012 Public Accounts of Canada. Both documents will be tabled in Parliament in the fall of 2012.
Sources of Borrowing
The aggregate principal amount of money required to be borrowed by the Government from financial markets in 2011–12 to finance updated Budget 2011 refinancing needs and other financial requirements is projected to be $263 billion.
Uses of Borrowing
Refinancing Needs
In 2011–12, refinancing needs are projected to be approximately $224 billion. The main source of refinancing needs during the year stems from the turnover of the treasury bill stock, which has a term to maturity of one year or less, and bonds that will mature in 2011–12. Other lesser amounts include retail debt (Canada Savings Bonds and Canada Premium Bonds) and foreign-currency-denominated bonds that will mature in 2011–12.
Financial Source/Requirement
The main other determinant of borrowing needs is the Government’s financial source or requirement. If the Government has a financial source, it can use the source for some of its refinancing needs. If it has a financial requirement, then it must meet that requirement along with its refinancing needs.
The financial source/requirement measures the difference between cash coming into the Government and cash going out. This measure is affected not only by the budgetary balance but also by the Government’s non-budgetary transactions.
The budgetary balance is presented on a full accrual basis of accounting, recording government liabilities and assets when they are incurred or acquired, regardless of when the cash is paid or received.
Non-budgetary transactions include changes in federal employee pension accounts; changes in non-financial assets; investing activities through loans, investments and advances (including loans to three Crown corporations—the Business Development Bank of Canada, Farm Credit Canada and Canada Mortgage and Housing Corporation); and other transactions (e.g. changes in other financial assets and liabilities and foreign exchange activities).
For 2011–12, a budgetary deficit of $32 billion and a financial requirement of $36 billion are projected. The new liquidity plan will increase borrowing in 2011–12 by about $12 billion.
As the planned amount to be borrowed is higher than the planned uses of borrowings, the year-end cash position is projected to increase by $4 billion.
Actual borrowing for the year may differ from the forecast due to uncertainty associated with economic and fiscal projections, the timing of cash transactions and other factors, such as changes in foreign reserve needs and Crown borrowings.
| (billions of dollars) | |
| Sources of Borrowings | |
| Payable in Canadian currency | |
| Treasury bills1 | 150 |
| Bonds | 102 |
| Retail debt | 2 |
| Total payable in Canadian currency | 254 |
| Payable in foreign currencies | 8 |
| Total cash raised through borrowing activities | 263 |
| Uses of Borrowings | |
| Refinancing needs | |
| Payable in Canadian currency | |
| Treasury bills | 163 |
| Bonds | 57 |
| Of which: | |
| Regular bond buybacks | 8 |
| Retail debt | 2 |
| Canada Pension Plan (CPP) bonds and notes | 0 |
| Total payable in Canadian currency | 222 |
| Payable in foreign currencies | 2 |
| Total refinancing needs | 224 |
| Financial source/requirement | |
| Budgetary balance | 32 |
| Non-budgetary transactions | |
| Pension and other accounts | -6 |
| Non-financial assets | 3 |
| Loans, investments and advances | |
| Enterprise Crown corporations | 3 |
| Insured Mortgage Purchase Program (net of redemptions) | -3 |
| Other | 1 |
| Total loans, investments and advances | 1 |
| Other transactions2 | 6 |
| Total non-budgetary transactions | 4 |
| Total financial source/requirement | 36 |
| Total uses of borrowings | 259 |
| Other unmatured debt transactions3 | |
| Net Increase or Decrease (-) in Cash | 4 |
| Notes: Numbers may not add due to rounding. A negative sign denotes a financial source. 1 These securities are rolled over, or refinanced, a number of times during the year. This results in a larger number of new issues per year than the stock outstanding at the end of the fiscal year, which is presented in the table. 2 Other transactions primarily comprise the conversion of accrual adjustments into cash, such as tax and other account receivables, provincial and territorial tax collection agreements, tax payables and other liabilities, and changes in the foreign exchange account. 3 These transactions comprise cross-currency swap revaluation, unamortized discounts on debt issues and obligations related to capital leases. This table has been updated since Budget 2011. The appendix to this annex provides details of the updates. | |
Debt Management Strategy for 2011–12
Objectives
The fundamental objective of debt management is to raise stable and low‑cost funding to meet the financial needs of the Government of Canada. An associated objective is to maintain a well-functioning market in Government of Canada securities, which helps to keep debt costs low and stable.
Raising Stable Low-Cost Funding
Achieving stable low-cost funding involves striking a balance between the cost and the risk associated with the debt structure.
Fiscal year 2011–12 will mark the beginning of a transition to a more efficient debt structure with a smoother maturity profile. This transition period is expected to be characterized by a smaller treasury bill stock relative to the most recent fiscal year and a bond program that remains relatively large. Planned changes to the allocation of issuance between the maturity sectors are modest, but significant enough to greatly improve funding flexibility and the cost-risk characteristics of the debt structure in the long run.
Maintaining a Well-Functioning Government Securities Market
Having access to a well-functioning government securities market ensures that funding can be raised efficiently to meet the Government’s needs in difficult economic times. To support a liquid and well‑functioning Government of Canada securities market, the Government strives to maintain transparent, regular and diversified borrowing programs.
Market Consultations
As in past years, market participants were consulted periodically in 2010–11. Consultations held in late November and early December focused on obtaining feedback on changing maturity dates in certain sectors and on the number and size of the benchmarks that would ensure sufficient depth and liquidity in each sector. Additionally, market participants’ views were sought on bond buyback operations on a switch basis and the increased frequency of cash management bond buyback operations.
Further details on the subjects of discussion and the views expressed during the consultations can be found on the Bank of Canada website.
Composition of Market Debt
The stock of market debt increased by $89 billion between 2008–09 and 2010–11 (Table A2.2). However, since a significant proportion of market debt issued since 2008–09 was used to acquire interest-bearing investments, the increase in the federal debt (accumulated deficit) is much lower.
| 2007–08 Actual |
2008–09 Actual |
2009–10 Actual |
2010–11 Actual |
2011–12 Planned |
|
|---|---|---|---|---|---|
| (billions of dollars) | |||||
| Treasury bills | 117 | 192 | 176 | 163 | 150 |
| Marketable bonds | 254 | 295 | 368 | 416 | 461 |
| Retail debt | 13 | 13 | 12 | 10 | 10 |
| Foreign debt | 9 | 7 | 8 | 8 | 15 |
| CPP bonds | 1 | 0.5 | 0.5 | 0 | 0 |
| Total market debt | 394 | 508 | 565 | 597 | 636 |
| This table has been updated since Budget 2011. The appendix to this annex provides details of the updates. | |||||
Bond Program
In 2011–12, the level of gross bond issuance is planned to be about $102 billion, $6 billion higher than the $96 billion issued in 2010–11 (Table A2.3).
| 2007–08 Actual |
2008–09 Actual |
2009–10 Actual |
2010–11 Actual |
2011–12 Planned |
|
|---|---|---|---|---|---|
| (billions of dollars) | |||||
| Gross bond issuance | 34 | 75 | 102 | 96 | 102 |
| Buybacks | -7 | -6 | -2 | -4 | -8 |
| Net issuance | 27 | 69 | 100 | 92 | 94 |
| Maturing bonds and adjustments1 | -32 | -27 | -27 | -44 | -49 |
| Change in bond stock | -5 | 42 | 73 | 48 | 45 |
| 1 Includes cash management bond buybacks and the inflation adjustment for Real Return Bonds. This table has been updated since Budget 2011. The appendix to this annex provides details of the updates. | |||||
Maturity Dates and Benchmark Bond Target Range Sizes
Under the current bond issuance pattern, a number of single-day cash flow maturity spikes are expected over the medium term as a result of a combination of higher debt issuance since the financial crisis and the issuance of bonds sharing the same maturity dates. This concentration of maturities implies that the amount of coupon payments due on those dates is large.
To help smooth the cash flow profile of upcoming maturities over the medium term, the maturity dates of the 2-, 3-, 5- and 30-year nominal bonds have been changed:
- 2-year sector: shift to February-May-August-November dates.
- 3-year sector: shift to February-August dates.
- 5-year sector: shift back to its traditional March-September dates.
- 30-year sector: shift to December, alternating years with Real Return Bond (RRB) maturities.
The addition of four new maturity dates—February 1, May 1, August 1 and November 1—will have a noticeable effect on the size of June 1 and December 1 maturities and coupon payments, beginning as early as 2013–14, and will also provide the debt program with a tremendous capacity to absorb potential increases in funding requirements.
The 2- and 3-year sectors continue to share two maturity dates (February 1 and August 1). In general, however, market participants have repeatedly indicated that larger benchmarks would be more effective than bond fungibility (i.e., the issuance of new bonds sharing the same maturity date as older bonds) in enhancing benchmark liquidity. Towards this end, the benchmark target sizes in the 2-, 3- and 5-year sectors have been increased.
In 2011–12, benchmark target range sizes are as follows:
- 2-year bonds: $8 billion to $12 billion.
- 3-year bonds: $8 billion to $12 billion.
- 5-year bonds: $10 billion to $13 billion.
- 10-year bonds: $10 billion to $14 billion.
- 30-year bonds: $12 billion to $15 billion.
Tables A2.4 and A2.5 show the projected bond maturity pattern and benchmark size ranges before and after the implementation of the revised medium-term debt strategy. These amounts do not include coupon payments.
| March | June | September | December | |
|---|---|---|---|---|
| (billions of dollars) | ||||
| 2-year | 7-10 | 7-10 | 7-10 | 7-10 |
| 3-year | 7-10 | 7-10 | ||
| 5-year | 9-12 | 9-12 | ||
| 10-year | 10-14 | |||
| 30-year | 12-15 | |||
| RRB1 | 10-16 | |||
| Total | 14-20 | 38-51 | 14-20 | 26-38 |
| 1 Includes estimate for inflation adjustment. | ||||
The addition of the four new maturity dates will effectively reduce single-day cash flow maturities from a potential range of $14 billion to $50 billion under the old issuance pattern to about $8 billion to $24 billion. The largest maturity dates will fall on February 1 and August 1.
| Feb. | Mar. | May | June | Aug. | Sept. | Nov. | Dec. | |
|---|---|---|---|---|---|---|---|---|
| (billions of dollars) | ||||||||
| 2-year | 8-12 | 8-12 | 8-12 | 8-12 | ||||
| 3-year | 8-12 | 8-12 | ||||||
| 5-year | 10-13 | 10-13 | ||||||
| 10-year | 10-14 | |||||||
| 30-year | 12-15 | |||||||
| RRB1 | 10-16 | |||||||
| Total | 16-24 | 10-13 | 8-12 | 10-14 | 16-24 | 10-13 | 8-12 | 10-16 |
| 1 Includes estimate for inflation adjustment. | ||||||||
Bond Auction Schedule
In 2011–12, there will be quarterly auctions of 2-, 3-, 5- and 10-year bonds and RRBs, and three 30-year bond auctions, announced through the Quarterly Bond Schedule on the Bank of Canada’s website before the start of each quarter (Table A2.6).
| Fiscal Year 2010–11 | Fiscal Year 2011–12 | ||||||
|---|---|---|---|---|---|---|---|
| Q1 | Q2 | Q3 | Q4 | Q1 | Q2 | Q3 | Q4 |
| 2-year | 2-year | 2-year | 2-year | 2-year | 2-year | 2-year | 2-year |
| 3-year | 3-year | 3-year | 3-year | 3-year | 3-year | 3-year | 3-year |
| 5-year | 5-year | 5-year | 5-year | 5-year | 5-year | 5-year | 5-year |
| 10-year | 10-year | 10-year | 10-year | 10-year | 10-year | 10-year | 10-year |
| 30-year | 30-year | 30-year | – | 30-year | – | 30-year | 30-year |
| RRB | RRB | RRB | RRB | RRB | RRB | RRB | RRB |
The order of bond auctions within each quarter may be adjusted to support the borrowing program, and there may be multiple auctions of the same benchmarks in some quarters.
Bond Buyback Programs
To decrease large maturities on certain dates and support gross issuance in the long end of the issuance program, two types of bond buyback operations will continue to be conducted: regular bond buybacks (on a switch and cash basis) and cash management bond buybacks.
Regular Bond Buyback Operations
The regular bond buyback program in 2011–12 will be used to facilitate the management of the debt maturity profile and the transition to new benchmark dates for 2-, 3- and 5‑year nominal bonds. Buybacks will also be conducted in the 10- and 30-year sector to support gross issuance in the long end.
Bond buybacks are planned to be just under $8 billion for the year, about $3 billion higher than in 2010–11, and will be conducted on a switch and cash basis.
The date of each operation will continue to be announced through the Quarterly Bond Schedule.
Cash Management Bond Buyback Operations
The cash management bond buyback program helps manage government cash requirements by reducing the high levels of cash balances needed ahead of large bond maturities. In light of the above considerations and taking into account feedback received during market consultations, weekly cash management bond buyback operations will be continued in 2011–12.
Treasury Bill Program
By the end of 2011–12, the treasury bill stock is projected to be $150 billion, approximately $13 billion lower than the end-of-year level for 2010–11. The bi-weekly issuance of 3-, 6- and 12-month maturities will be continued.
Cash management bills (i.e. short-dated treasury bills) help manage government cash requirements in an efficient manner. These instruments will continue to be used in
2011–12.
Retail Debt Program
In 2011–12, the retail debt stock is expected to decline as redemptions continue to exceed sales in an environment of historically low interest rates and continued competition from other retail savings instruments in the marketplace. Over the coming year, opportunities to reduce overall program delivery costs will be explored.
Further information on the retail debt program is available on the Canada Saving Bonds.
Foreign Currency Funding
The purpose of the Exchange Fund Account (EFA) is to aid in the control and protection of the external value of the Canadian dollar. Assets held in the EFA are managed to provide foreign currency liquidity, support market confidence, and promote orderly conditions for the Canadian dollar in the foreign exchange markets, if required.
The Government has access to a range of direct sources of funding for its foreign currency assets. These include a short-term US-dollar paper program, medium-term note issuance in various markets, international bond issues, purchases and sales of Canadian dollars in foreign exchange markets, and cross-currency swaps involving the exchange of domestic liabilities for foreign-currency-denominated liabilities.
As part of the planned increase in prudential liquidity and ongoing International Monetary Fund commitments, the level of foreign exchange reserves will increase by about $10 billion by the end of 2011–12. The mix of funding sources used to finance this increase will depend on a number of considerations, including relative cost, market conditions, and the objective of maintaining a prudent foreign-currency-denominated debt maturity structure. The medium-term debt strategy assumes that all foreign liabilities maturing during the year will be refinanced. However, the amount of foreign currency funding may vary from the plan, depending on market conditions and government foreign currency needs.
Further information on managing foreign currency reserves and funding objectives is provided in the Report on the Management of Canada’s Official International Reserves, which is available on the Department of Finance website.
Appendix—Updates to Tables
| (billions of dollars) | |
|---|---|
| Sources of Borrowings | |
| Payable in Canadian currency | |
| Treasury bills1 | 5 |
| Bonds | 0 |
| Retail debt | 0 |
| Total payable in Canadian currency | 5 |
| Payable in foreign currencies | 0 |
| Total cash raised through borrowing activities | 5 |
| Uses of Borrowings | |
| Refinancing needs | |
| Payable in Canadian currency | |
| Treasury bills | 3 |
| Bonds | 0 |
| Of which: | |
| Regular bond buybacks | 0 |
| Retail debt | 0 |
| Canada Pension Plan (CPP) bonds and notes | 0 |
| Total payable in Canadian currency | 3 |
| Payable in foreign currencies | 0 |
| Total refinancing needs | 3 |
| Financial source/requirement | |
| Budgetary balance | 2 |
| Non-budgetary transactions | |
| Pension and other accounts | 0 |
| Non-financial assets | 0 |
| Loans, investments and advances | |
| Enterprise Crown corporations | 0 |
| Insured Mortgage Purchase Program (net of redemptions) | 0 |
| Other | 0 |
| Total loans, investments and advances | 0 |
| Other transactions2 | 0 |
| Total non-budgetary transactions | 0 |
| Total financial source/requirement | 2 |
| Total uses of borrowings | 5 |
| Other unmatured debt transactions3 | |
| Net Increase or Decrease (-) in Cash | 0 |
| Notes: Numbers may not add due to rounding. A negative sign denotes a financial source. 1 These securities are rolled over, or refinanced, a number of times during the year. This results in a larger number of new issues per year than the stock outstanding at the end of the fiscal year, which is presented in the table. 2 Other transactions primarily comprise the conversion of accrual adjustments into cash, such as tax and other account receivables, provincial and territorial tax collection agreements, tax payables and other liabilities, and changes in the foreign exchange account. 3 These transactions comprise cross-currency swap revaluation, unamortized discounts on debt issues and obligations related to capital leases. |
|
| 2007–08 Actual |
2008–09 Actual |
2009–10 Actual |
2010–11 Actual |
2011–12 Planned |
|
|---|---|---|---|---|---|
| (billions of dollars) | |||||
| Treasury bills | 0 | 0 | 0 | 3 | 5 |
| Marketable bonds | 0 | 0 | 0 | -1 | -1 |
| Retail debt | 0 | 0 | 0 | -1 | -1 |
| Foreign debt | 0 | 0 | 0 | 0 | 0 |
| CPP bonds | 0 | 0 | 0 | 0 | 0 |
| Total market debt | 0 | 0 | 0 | 1 | 3 |
| 2007–08 Actual |
2008–09 Actual |
2009–10 Actual |
2010–11 Actual |
2011–12 Planned |
|
|---|---|---|---|---|---|
| (billions of dollars) | |||||
| Gross bond issuance | 0 | 0 | 0 | 0 | 0 |
| Buybacks | 0 | 0 | 0 | 1 | 0 |
| Net issuance | 0 | 0 | 0 | 1 | 0 |
| Maturing bonds and adjustments1 | 0 | 0 | 0 | -2 | 1 |
| Change in bond stock | 0 | 0 | 0 | -1 | 1 |
| 1 Includes cash management bond buybacks and the inflation adjustment for Real Return Bonds. | |||||
1 The refixing share is simply a reformulation of the fixed rate share reported in the past. The fixed rate share has been replaced by the refixing share to facilitate comparison and be consistent with the metrics used by other sovereigns.