
Common menu bar links
archived - Annex 1: Job Impact of the Economic Action Plan to Date
Table of Contents - Previous - Next
Introduction
Canada's Economic Action Plan, including provincial and territorial actions, is expected to create or maintain 220,000 jobs by the end of 2010. This annex provides an assessment of the economic impact of the Economic Action Plan to date. The Action Plan is on track, with an estimated 130,000 jobs having been created or maintained. These estimates were reviewed and validated by well-respected economic experts from the private sector and academia.
Canada Has Been Less Affected Than Other Countries by the Global Economic Slowdown
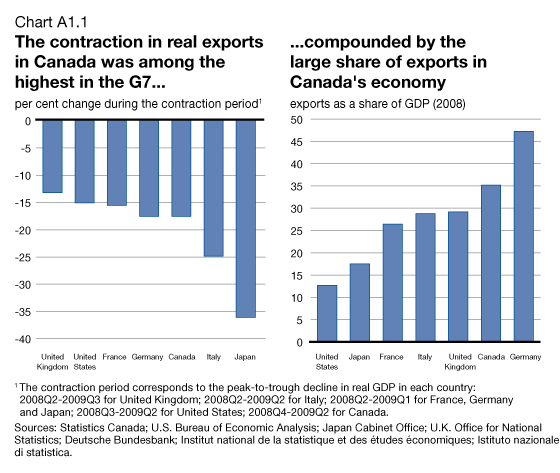
The global recession did not start within Canadian borders. Nevertheless, Canada was not immune to the global recession. Given its strong ties to the United States, demand for its exports declined significantly (Chart A1.1). The economic impact of this decline was compounded by the large share of exports in Canada's economy. Moreover, because Canada is the only net exporter of commodities in the Group of Seven (G7), the sharp drop in commodity prices caused by the global recession exacerbated the shock in Canada while mitigating its impact in the other G7 countries.
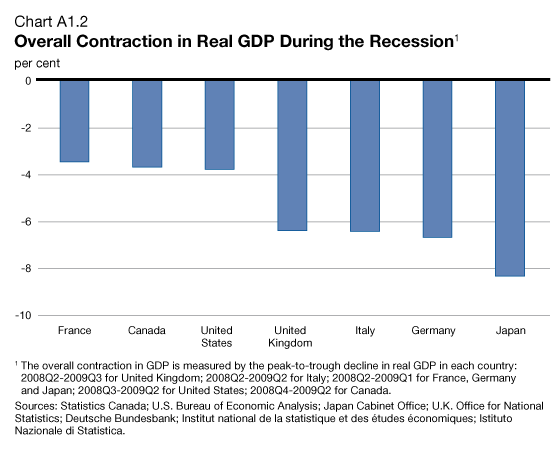
In spite of this, Canada has fared better than virtually all other major industrialized economies during the global slowdown. Canada was the last G7 country to enter recession and the deterioration of the economy has been less severe than in nearly all other G7 countries (Chart A1.2).
This performance reflects a number of fundamental strengths including the strong financial situation of households, businesses and governments; one of the strongest financial systems in the world; and housing markets that avoided the excesses seen elsewhere.
Canada's economic performance also reflects extraordinary policy actions: the Bank of Canada reduced its policy rate by 425 basis points between July 2007 and April 2009, while providing substantial amounts of liquidity to the financial system; and the Government responded with the Economic Action Plan in early 2009, building on permanent tax reductions announced in the October 2007 Economic Statement, just before the United States entered recession.
Evidence From Recent Economic Developments
The objective of the Economic Action Plan was to boost confidence and economic growth in order to protect Canadian jobs and incomes in the midst of the most synchronized global recession since the 1930s.
This section examines economic developments since the Economic Action Plan was introduced. The analysis indicates that the sectors targeted by the Action Plan have strengthened markedly and that domestic demand—personal, business and government expenditures—has increased more than in any other G7 country since the beginning of 2009.
Impact of the Economic Action Plan on Consumer and Business Confidence
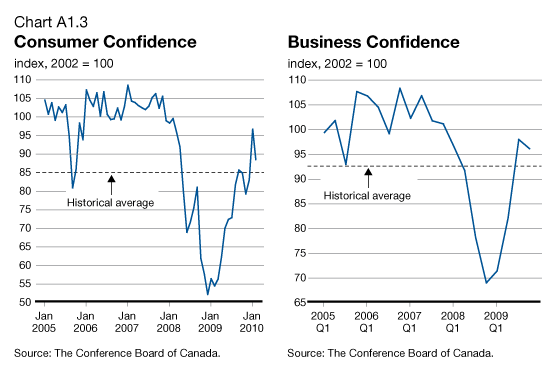
One of the principal objectives of the Economic Action Plan was to restore confidence in the economy. In Canada, consumer confidence began to decline at the onset of the U.S. recession in January 2008 and then fell sharply as the labour market weakened and equity markets declined sharply (Chart A1.3). Consumer confidence was near a record low in December 2008. With the implementation of the Economic Action Plan, consumer and business confidence have improved and are now back to historical norms.
Impact of the Economic Action Plan on Consumer Spending
The Economic Action Plan has helped individuals through the worst of the global recession by providing tax relief and support for the unemployed through enhanced Employment Insurance (EI) benefits and training programs.
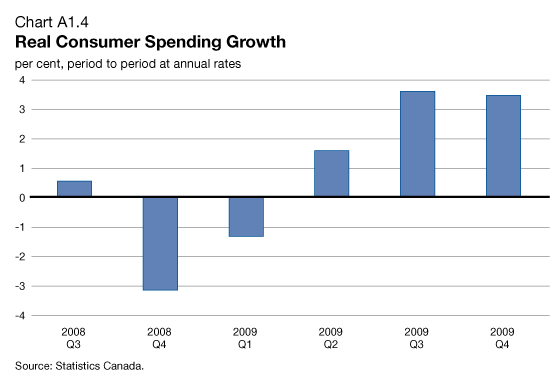
These measures to support household incomes have contributed significantly to the recovery of consumer spending in Canada. After declining in the fourth quarter of 2008 and the first quarter of 2009, consumption spending has increased for three straight quarters (Chart A1.4).
Impact of the Economic Action Plan on Residential Investment
Canadian homeowners have received support from a variety of measures, including the introduction of the temporary Home Renovation Tax Credit and the First-Time Home Buyers' Tax Credit and enhancements to the Home Buyers' Plan. Combined with historically low interest rates, these initiatives have contributed to a strong recovery in housing activity.
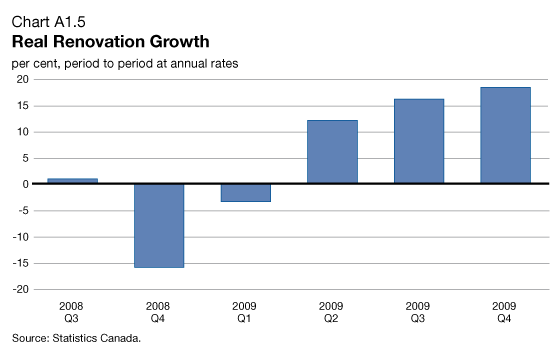
After declines in the fourth quarter of 2008 and the first quarter of 2009, residential investment increased in each of the last three quarters of 2009. Renovation spending, which accounts for about 40 per cent of residential investment, has rebounded, averaging 15.8-per-cent growth in the last three quarters with support from the Home Renovation Tax Credit (Chart A1.5).
Impact of the Economic Action Plan on Infrastructure Investment
Building infrastructure is one of the cornerstones of the Economic Action Plan. Infrastructure measures in the Action Plan include the establishment of the Infrastructure Stimulus Fund and increased spending on railways, bridges, recreational facilities and federal buildings.
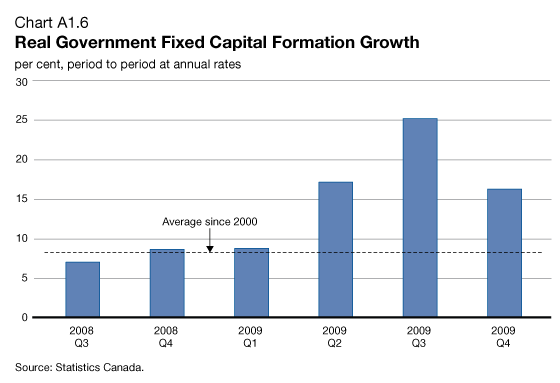
These measures have contributed to the economic recovery in Canada. Growth of government investment in infrastructure and capital goods averaged almost 20 per cent in the last three quarters of 2009, supported by infrastructure measures in the Economic Action Plan (Chart A1.6). This was more than twice the average growth rate observed in the previous three quarters.
Impact of the Economic Action Plan on Overall Economic Activity
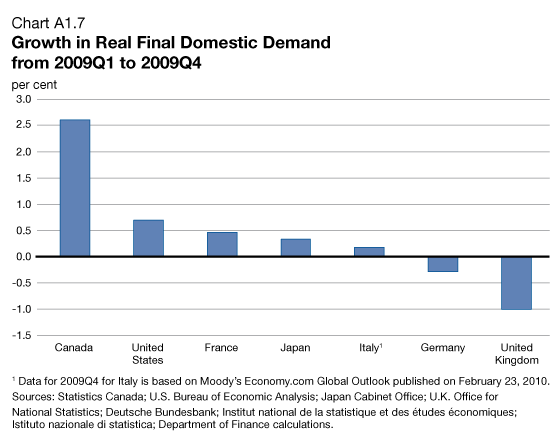
The rebound in consumer spending, residential investment and government investment has boosted domestic demand—the sum of household, business and government expenditures. Following two large quarterly declines in late 2008 and early 2009, domestic demand stabilized in the second quarter of 2009 and increased by more than 5.0 per cent on average in the third and fourth quarters. In fact, since the first quarter of 2009, Canada has experienced the largest increase in domestic demand among G7 countries (Chart A1.7). This rebound in domestic demand led to a moderation in the rate of economic contraction in the second quarter and drove gross domestic product (GDP) growth in the third and fourth quarters.[1]
Thus, recent economic developments suggest that the Economic Action Plan has helped to stabilize the domestic economy and has supported the resumption of economic growth.
Job Impact of the Economic Action Plan to Date
Measuring the Job Impact of the Economic Action Plan
To estimate the total number of jobs maintained or created by the Economic Action Plan, all stimulus actions—infrastructure spending, tax reductions, EI measures and other actions—need to be taken into account. Job impacts cannot be observed directly for all elements of the Action Plan (i.e. tax reductions and EI measures) since they are not related to specific projects or activities but rather support income and overall economic activity.
For elements of the Economic Action Plan that are project-based, project managers can normally estimate the number of jobs related to each project. However, project-level data cannot readily be aggregated to determine an overall job impact because:
- Where data is available, it is often not presented in a consistent manner—for example, on a full-time-equivalent basis.
- Even if complete project-level data were available on a consistent basis, the data would only account for the direct impact in the construction industry. Indirect jobs created or maintained in industries providing inputs to the construction industry and induced jobs created or maintained in all industries by the additional economic activity in the construction industry would not be accounted for.
These same issues have been raised by the Congressional Budget Office in its evaluation of the U.S. economic stimulus package.[2] For these reasons, this annex estimates the job impact of the Economic Action Plan using the Department of Finance's Canadian Economic and Fiscal Model (CEFM). To carry out this estimate, measures in the Action Plan were allocated to seven categories that correspond to those used in the CEFM (infrastructure investment measures, housing investment measures, other spending measures, measures for low-income households and the unemployed, EI premiums, personal income tax measures and corporate income tax measures).
Each of these categories has a different economic activity multiplier. These multipliers are summary measures that take into account first-round, indirect and induced impacts, and leakages to saving and imports (Table A1.1). For example, infrastructure investment measures and measures for low-income households and the unemployed have high multipliers because of small leakages to imports and saving respectively. Consistent with historical relationships, a 1-per-cent increase in economic activity was assumed to translate into an immediate 0.2‑per‑cent increase in employment, rising to about 0.6 per cent after eight quarters. The job impact of the International Partnership to Support the Automotive Industry was estimated separately (see box below).
| 2009 | 2010 | 2010Q4 | |
|---|---|---|---|
| (dollar impact on the level of real GDP of a permanent one-dollar increase in fiscal measures) |
|||
| Infrastructure investment measures | 1.0 | 1.5 | 1.6 |
| Housing investment measures | 1.0 | 1.4 | 1.5 |
| Other spending measures | 0.8 | 1.3 | 1.4 |
| Measures for low-income households and the unemployed |
0.8 | 1.5 | 1.7 |
| EI premiums | 0.2 | 0.5 | 0.6 |
| Personal income tax measures | 0.4 | 0.9 | 1.0 |
| Corporate income tax measures1 | 0.1 | 0.2 | 0.3 |
| 1 Corporate income tax measures have a limited impact on aggregate demand over the periods displayed in the table but have among the highest multiplier effects in the long run. This is because they increase the incentive to invest and accumulate capital, which leads to a higher capacity to produce goods and services. | |||
Given the considerable uncertainty surrounding the size of fiscal multipliers, prudent estimates have been used. The multipliers used in assessing the economic impact of the Economic Action Plan are similar to or lower than those used by the U.S. Council of Economic Advisers in assessing the impact of the American Recovery and Reinvestment Act and those found in models of leading Canadian private sector forecasters.[3] In addition, recent economic research suggests that fiscal multipliers are larger than those used in this analysis when the policy interest rate has reached its effective lower bound, where it has been in Canada since April 2009.[4] This is because in such a context, fiscal actions help anchor inflation expectations and boost confidence, leading to higher private sector economic activity than otherwise would be the case.
to Support the Automotive Industry
The motor-vehicle industry, including both assembly and parts, is Canada's largest manufacturing industry, accounting for 10 per cent of manufacturing real GDP and about 20 per cent of real merchandise exports in 2008. About 100,000 Canadians were directly employed in the motor-vehicle and parts manufacturing industries at the end of 2008. Of these workers, about 40,000 were employed in automotive assembly.
The automotive industry provides employment in a number of supporting industries. For every 10 direct jobs in auto assembly, there are:
- 5 jobs in the motor-vehicle parts industry.
- 7 jobs in other manufacturing industries, such as primary and fabricated metal products, plastics and rubber products, and machinery.
- 24 jobs in non-manufacturing sectors, such as engineering, accounting and legal services, financial services, wholesale trade, and transportation and warehousing.
General Motors and Chrysler account for close to 45 per cent of vehicles produced in Canada. Moreover, given the extreme interdependency of the auto supply chain, a shock to the supplier base caused by production disruptions at one of Canada's automakers would pose a systemic risk to continued operations of other automakers and suppliers in Canada.
As a result, the governments of Canada and Ontario worked together, in partnership with the government of the United States, to support the auto sector. Combined support by Canadian governments, provided through loans and other instruments to General Motors and Chrysler, totalled about $14.6 billion.
In early 2009, General Motors and Chrysler assembly plants directly employed an estimated 14,000 workers. In addition, over 50,000 jobs in other industries were estimated to be tied to production at General Motors and Chrysler. Based on Statistics Canada's input-output model of the Canadian economy, the Department of Finance estimates that 52,000 jobs (all the assembly jobs and about three-quarters of the indirect jobs) are being protected by government action to support the automotive industry. This estimate does not take into account the induced effects arising from the maintenance of economic activity in the automotive and related industries.
The Job Impact of the Economic Action Plan to Date
Multipliers used in the 2009 budget analysis are used again in this analysis to assess the impact of the Economic Action Plan on jobs maintained or created to date, together with information on the proportion of Economic Action Plan measures actually flowing in the economy.
Determining the amount of stimulus flowing in the economy from tax reductions and measures to support the unemployed, industries and communities is fairly straightforward as flows correspond to amounts paid.
However, for infrastructure-related investment projects amounts paid to provinces, territories and third parties do not accurately reflect the full stimulus created. Amounts paid tend to lag the economic impact of fiscal stimulus as payments are typically made when the work is completed rather than as it is progressing. To account for this lag, infrastructure project start and end dates have been used to arrive at an estimate of funds flowing. Economic stimulus was assumed to flow in a linear fashion from project start to end. This approach has been used for approximately three-quarters of project-based infrastructure spending.
Table A1.2 shows the resulting estimated stimulus flowing in the economy as of January 31, 2010, the latest date for which amounts paid are available, to each area of the Economic Action Plan.
| Dollars Flowing as of January 2010 | |
|---|---|
| (millions of dollars) | |
| Reducing the Tax Burden for Canadians | 2,571 |
| Helping the Unemployed | 1,978 |
| Building Infrastructure to Create Jobs1 | 7,850 |
| Creating the Economy of Tomorrow1 | 1,807 |
| Supporting Industries and Communities1 | 15,157 |
| Total | 29,362 |
| Note: Totals may not add due to rounding. 1 Includes provincial, territorial and municipal leverage assumed in Budget 2009. |
|
It is estimated that over $4 billion has been devoted to reducing the tax burden and helping the unemployed. Almost $8 billion has been invested in new public and housing infrastructure. Almost $2 billion has been invested in knowledge infrastructure and science and technology to help create the economy of tomorrow. Finally, more than $15 billion has been disbursed to support industries and communities.
The results suggest that the implementation of the Economic Action Plan has had a substantial beneficial impact on production and employment (Table A1.3). The funds disbursed are estimated to have reduced the decline in real GDP in the second quarter, avoided another contraction in the third quarter and increased growth by 2.2 percentage points in the fourth quarter of 2009.
Improved economic growth translates into a higher level of employment. Indeed, the Economic Action Plan reduced the size of the contraction in employment in both the second and third quarters of 2009, and led to a larger increase in employment in the fourth quarter. As of January 2010, it is estimated that the Economic Action Plan has created or maintained 130,000 jobs.
| 2009Q2 | 2009Q3 | 2009Q4 | January 2010 | |
|---|---|---|---|---|
| (per cent, unless otherwise indicated) | ||||
| Real GDP Growth | ||||
| Actual | -3.5 | 0.9 | 5.0 | – |
| Without Economic Action Plan (EAP) measures | -5.1 | -0.8 | 2.8 | – |
| Impact of the EAP (percentage points) | 1.6 | 1.7 | 2.2 | – |
| Employment Growth | ||||
| Actual | -1.1 | -0.1 | 1.3 | – |
| Without EAP measures | -1.7 | -0.8 | 0.3 | – |
| Impact of the EAP (percentage points) | 0.6 | 0.7 | 1.0 | – |
| Employment level (thousands) | 29 | 57 | 100 | 130 |
Since October 2008, cumulative net job losses in the Canadian economy have amounted to about 280,000. Most of these occurred from October 2008 to March 2009, with the labour market improving thereafter. Had the Economic Action Plan not been implemented, the cumulative number of job losses would have been close to 410,000.
Table A1.4 breaks down the jobs estimated to have been created or maintained according to the five elements of the Economic Action Plan. To date, most of the jobs created or maintained have been the result of infrastructure investment and support to industries and communities.
| January 2010 | End of 2010 | |
|---|---|---|
| Reducing the Tax Burden for Canadians | 8,000 | 19,000 |
| Helping the Unemployed | 10,000 | 24,000 |
| Building Infrastructure to Create Jobs | 42,000 | 84,000 |
| Creating the Economy of Tomorrow | 13,000 | 27,000 |
| Supporting Industries and Communities |
58,000 | 66,000 |
| Total | 130,000 | 220,000 |
| Note: Totals may not add due to rounding. | ||
Sectoral Impact of the Economic Action Plan on Jobs
The manufacturing and construction sectors were particularly hard hit by the economic slowdown. The Economic Action Plan responded with several measures to support these sectors directly, particularly through infrastructure investment and funding to support housing as well as industries and communities.
From October 2008 to March 2009, the economy shed over 385,000 jobs. More than 250,000 of the job losses, or about two-thirds of the total, occurred in the manufacturing and construction sectors. These two sectors, however, account for less than 20 per cent of Canada's employment.
Since March 2009, the labour market has shown some stability, with notable improvements occurring in the manufacturing, construction and service sectors. Employment in construction has risen by about 40,000 while job losses in manufacturing have slowed considerably. Continued job losses in the manufacturing sector reflect weak U.S. demand and the appreciation of the Canadian dollar. Employment in the service sector has increased significantly since March 2009, returning above pre-recession levels.
Table A1.5 provides a sectoral breakdown of the jobs estimated to have been created or maintained by the Economic Action Plan.[5] It is estimated that about 45 per cent of the jobs created or maintained by January 2010 have been in the manufacturing and construction industries.
The actual timing of improvements in the labour market and developments at the industry level are consistent with the roll-out of the Economic Action Plan, suggesting it played an important role in improving the labour market situation.
| January 2010 | End of 2010 | |
|---|---|---|
| Primary and utilities | 3,000 | 5,000 |
| Construction | 29,000 | 50,000 |
| Manufacturing | 32,000 | 37,000 |
| Services | 67,000 | 129,000 |
| Total | 130,000 | 220,000 |
| Note: Totals may not add due to rounding. | ||
Conclusion
The evidence presented in this analysis indicates that the Economic Action Plan has played an important role in stabilizing the economy and fostering a recovery in Canada. It has helped get the economy growing again and supported employment, particularly in the industries most affected by the global recession.
Overall, indications are that the implementation of the Economic Action Plan has created or maintained about 130,000 jobs to date.
Because of the inherent uncertainty in estimating the impact of fiscal stimulus, the approach taken has been prudent.
- The fiscal multipliers used to generate the model-based estimates, a key input to the model, are similar to or lower than those used by the U.S. Council of Economic Advisors and those found in models of recognized Canadian private sector forecasters.
- Multipliers have not been adjusted upward to take into account the notion that they are larger when the policy interest rate is at its effective lower bound.
- The estimated impacts on employment do not fully include the impact of the work-sharing program on preserving jobs. Over 160,000 Canadians are benefiting from this program.
- The estimated impacts on employment do not take into account actions taken by the Government to improve access to financing for consumers and businesses through the Extraordinary Financing Framework.
External Assessment
The Department of Finance's analysis of the job impact of the Economic Action Plan to date was reviewed by well‑respected economic experts from the private sector and academia:
- Peter Dungan, Director, and Steve Murphy, Research Associate, Policy and Economic Analysis Program, Rotman School of Management, University of Toronto.
- Glen Hodgson, Senior Vice-President and Chief Economist, and Pedro Antunes, Director of the National and Provincial Forecast, Conference Board of Canada.
- Stéfane Marion, Chief Economist and Strategist, National Bank Financial Group.
The reviewers believe that the Department of Finance's analysis presents a reasonable representation of the economic impact of the Economic Action Plan to date.
[1] Domestic demand is the best aggregate indicator to assess the impact of the stimulus since it is not directly affected by fluctuations in net exports and changes in the pace of inventory accumulation or depletion.
[2] Congressional Budget Office, Estimated Impact of the American Recovery and Reinvestment Act on Employment and Economic Output From October 2009 Through December 2009 (February 2010).
[3] Executive Office of the President, Council of Economic Advisers. Christina Romer and Jared Bernstein. "The Job Impact of the American Recovery and Reinvestment Plan" (January 2009) and Government of Canada, Budget 2009, Annex 1.
[4] Lawrence Christiano, Martin Eichenbaum and Sergio Rebelo. "When is the Government Spending Multiplier Large?" National Bureau of Economic Research Working Paper 15394 (2009).
[5] The results are based on estimates from the CEFM and simulations from an input-output model of the Canadian economy.
This annex incorporates data available up to and including March 1, 2010. All rates are reported at annual rates unless otherwise noted.