
Archived - Economic Overview
On this page:
In many ways, the Canadian economy is doing well. Our unemployment rate is near its record low, 830,000 more Canadians are employed compared to when COVID-19 first hit, and Canada's economic growth was the strongest in the G7 over the last year.
At the same time, many Canadians are faced with real affordability challenges, and are feeling the effects of higher grocery prices and housing costs. While inflation has fallen in Canada for eight straight months, it remains elevated—both in Canada and around the world. For many advanced economies, interest rates have risen to their highest levels in more than 15 years. This is resulting in slowing economic growth, both in Canada and around the world. The rapid rise in interest rates has also led to turmoil in some parts of the global banking system and volatility in global financial markets, highlighting the considerable uncertainty about how economic conditions will evolve going forward.
Canada is well positioned to navigate these turbulent times. Our economy entered 2023 on a better footing than most of our peers, and with strong economic fundamentals, including robust population growth, a strong labour market, and a well-regulated and well-capitalized financial system, Canada will be able to weather a global economic slowdown.
Canada's strength and resilience in the face of global economic challenges has been underpinned by steps the government has taken since 2015 to support Canadians and build an economy that creates good jobs and opportunities:
Since 2015, close to 2.7 million fewer Canadians are living in poverty, income inequality has continued to fall, the labour force participation rate for women aged 15 to 64 years is at record highs, and young Canadians have access to a greater number of good-paying jobs than before the pandemic. Significant investments in infrastructure and in the capacity of the Canadian economy will continue to benefit Canadians for decades.
A More Inclusive Economy: Progress Since 2015
-
2.7 million fewer Canadians are living in poverty, a 56 per cent decrease;
-
Income inequality has declined by 11 per cent;
-
The gender wage gap is getting smaller, having decreased by 12 per cent;
-
Women are closing the labour force participation gap, which has decreased by 28 per cent; and,
-
More young people have good jobs, with the youth unemployment rate down by 22 per cent.
In the face of a rapidly changing global economic landscape, there is more work to be done to build a more sustainable and prosperous future for Canadians.
In the years to come, Canada will contend with two intertwined global economic shifts: first, the accelerating global race to build net-zero economies and the industries of tomorrow; and second, a realignment of global trade patterns as democracies move to friendshore their economies by limiting their strategic economic dependence on countries like Russia and China.
While these two global shifts represent significant economic opportunities for Canadian workers and businesses, significant investment will be required to capitalize on them, from both the private and the public sectors. To support this, Budget 2023 takes substantial action to mobilize private investment in building Canada's clean economy. The goal of these investments is to grow Canada's economic capacity in the industries of the future, create good careers, and usher in a new generation of prosperity for all Canadians, while simultaneously reducing Canada's emissions and strengthening our essential trading relationships.
Moreover, at a time of elevated global inflation, investing in Canada's long-term prosperity must be balanced with the need to avoid exacerbating inflation.
Against this backdrop, the government is taking a responsible, balanced approach to fiscal management: supporting the most vulnerable Canadians, strengthening our public health system, and investing in Canada's future prosperity while preserving Canada's long-term fiscal sustainability. Canada's enviable fiscal position—the lowest net debt and deficit as a share of gross domestic product (GDP) in the G7—means we can afford to make these essential investments. Over time, the growing returns of these essential investments will further enhance Canada's economic prospects.
1. Recent Economic Developments
Canada's Recovery Has Created the Strongest Job Market in Decades
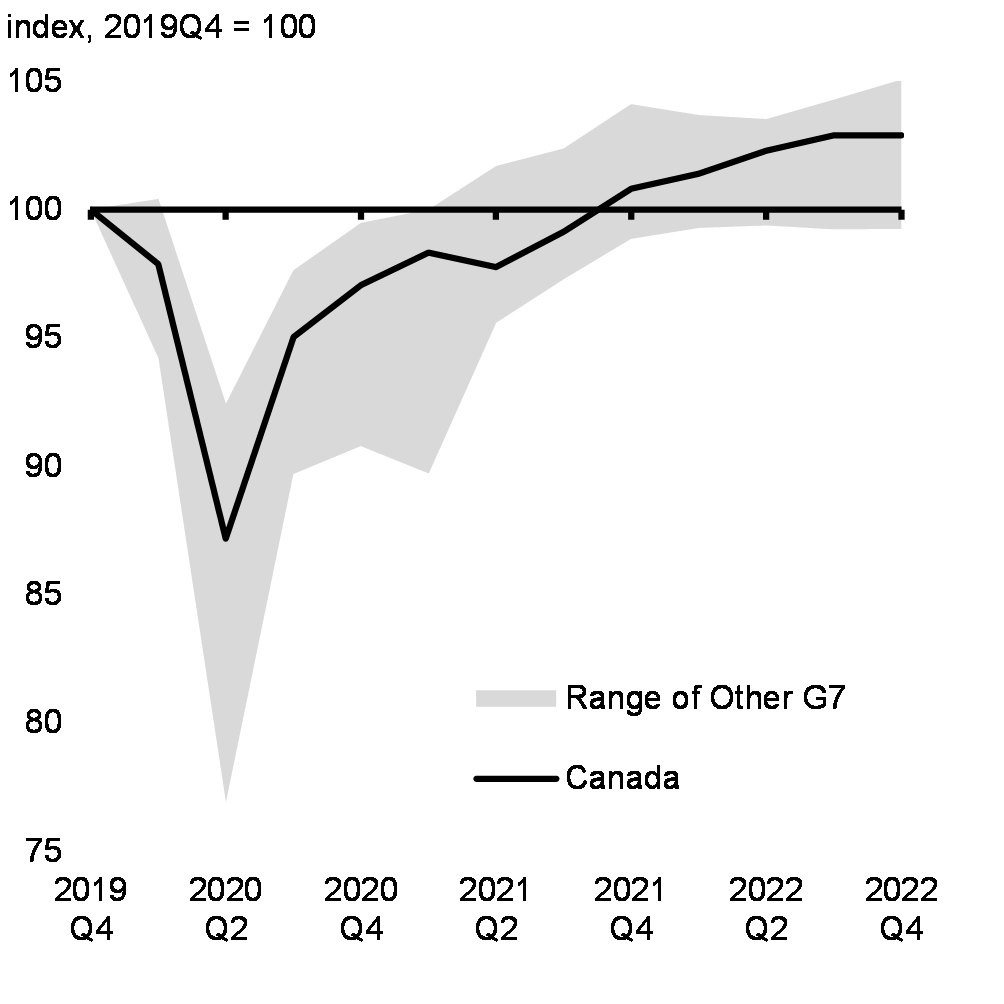
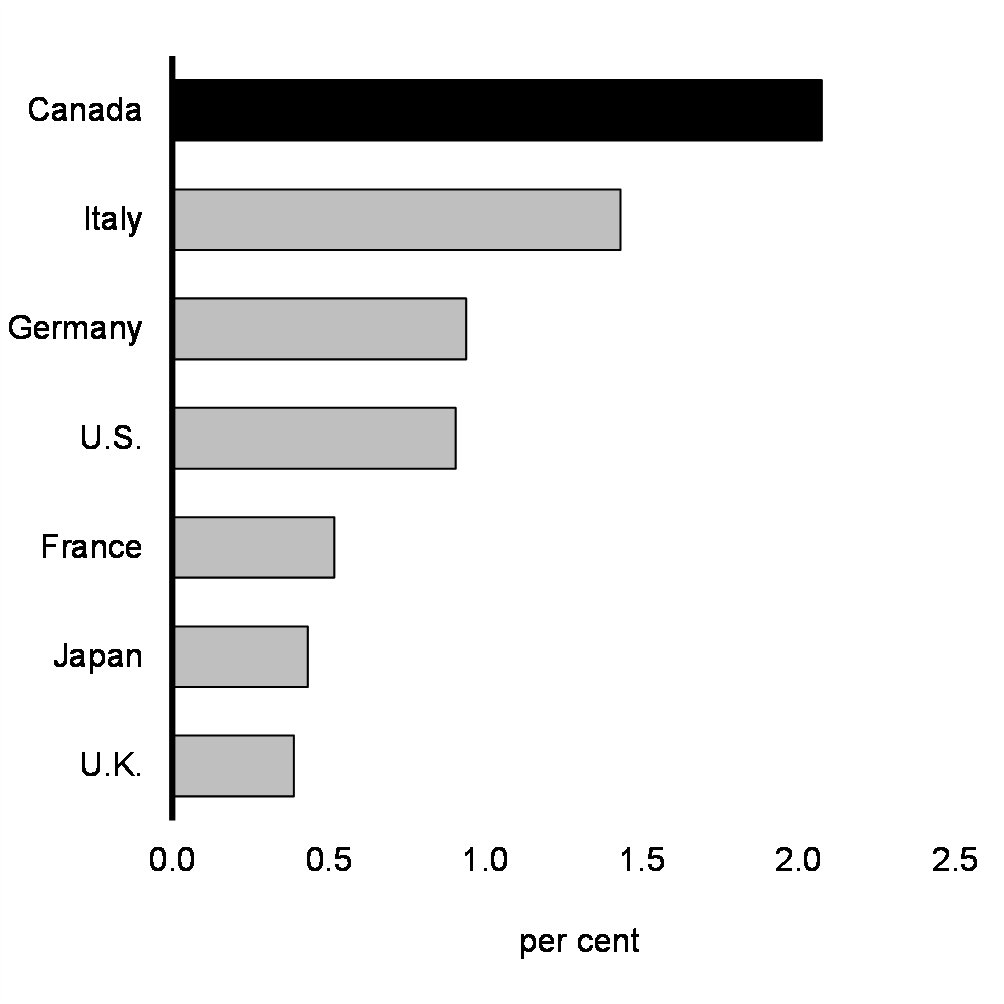
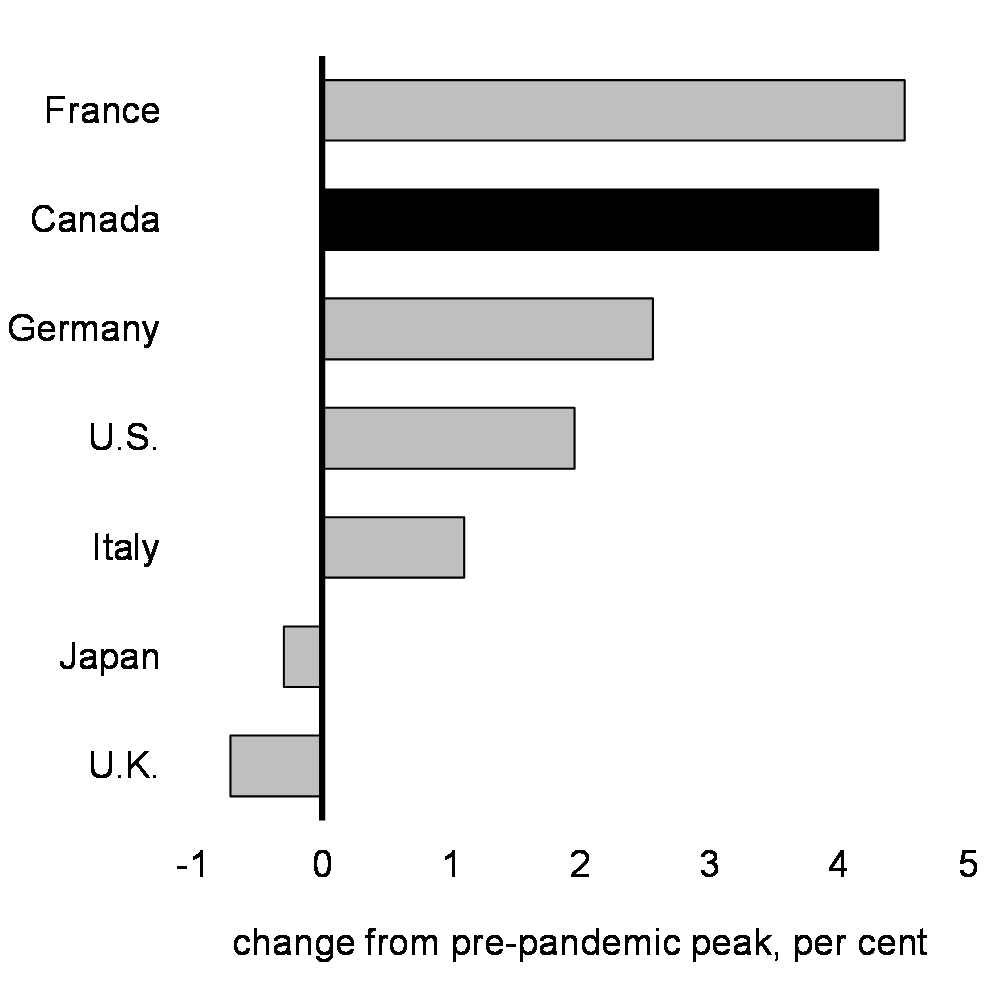
Canada's economy is now 103 per cent the size it was before the pandemic, marking the fastest recovery of the last four recessions, and the second strongest recovery in the G7 (Chart 1). Throughout 2022, our economy demonstrated sustained strength, with Canada posting the fastest growth in the G7 over the past year (Chart 2). Resilient household and business finances and strong population growth, supported by the government's COVID-19 Economic Response Plan and Immigration Levels Plan, underpinned this strong economic performance.
Real GDP Recovery From the Pandemic in G7 Economies
Real GDP Growth in G7 Economies, 2021Q4 to 2022Q4
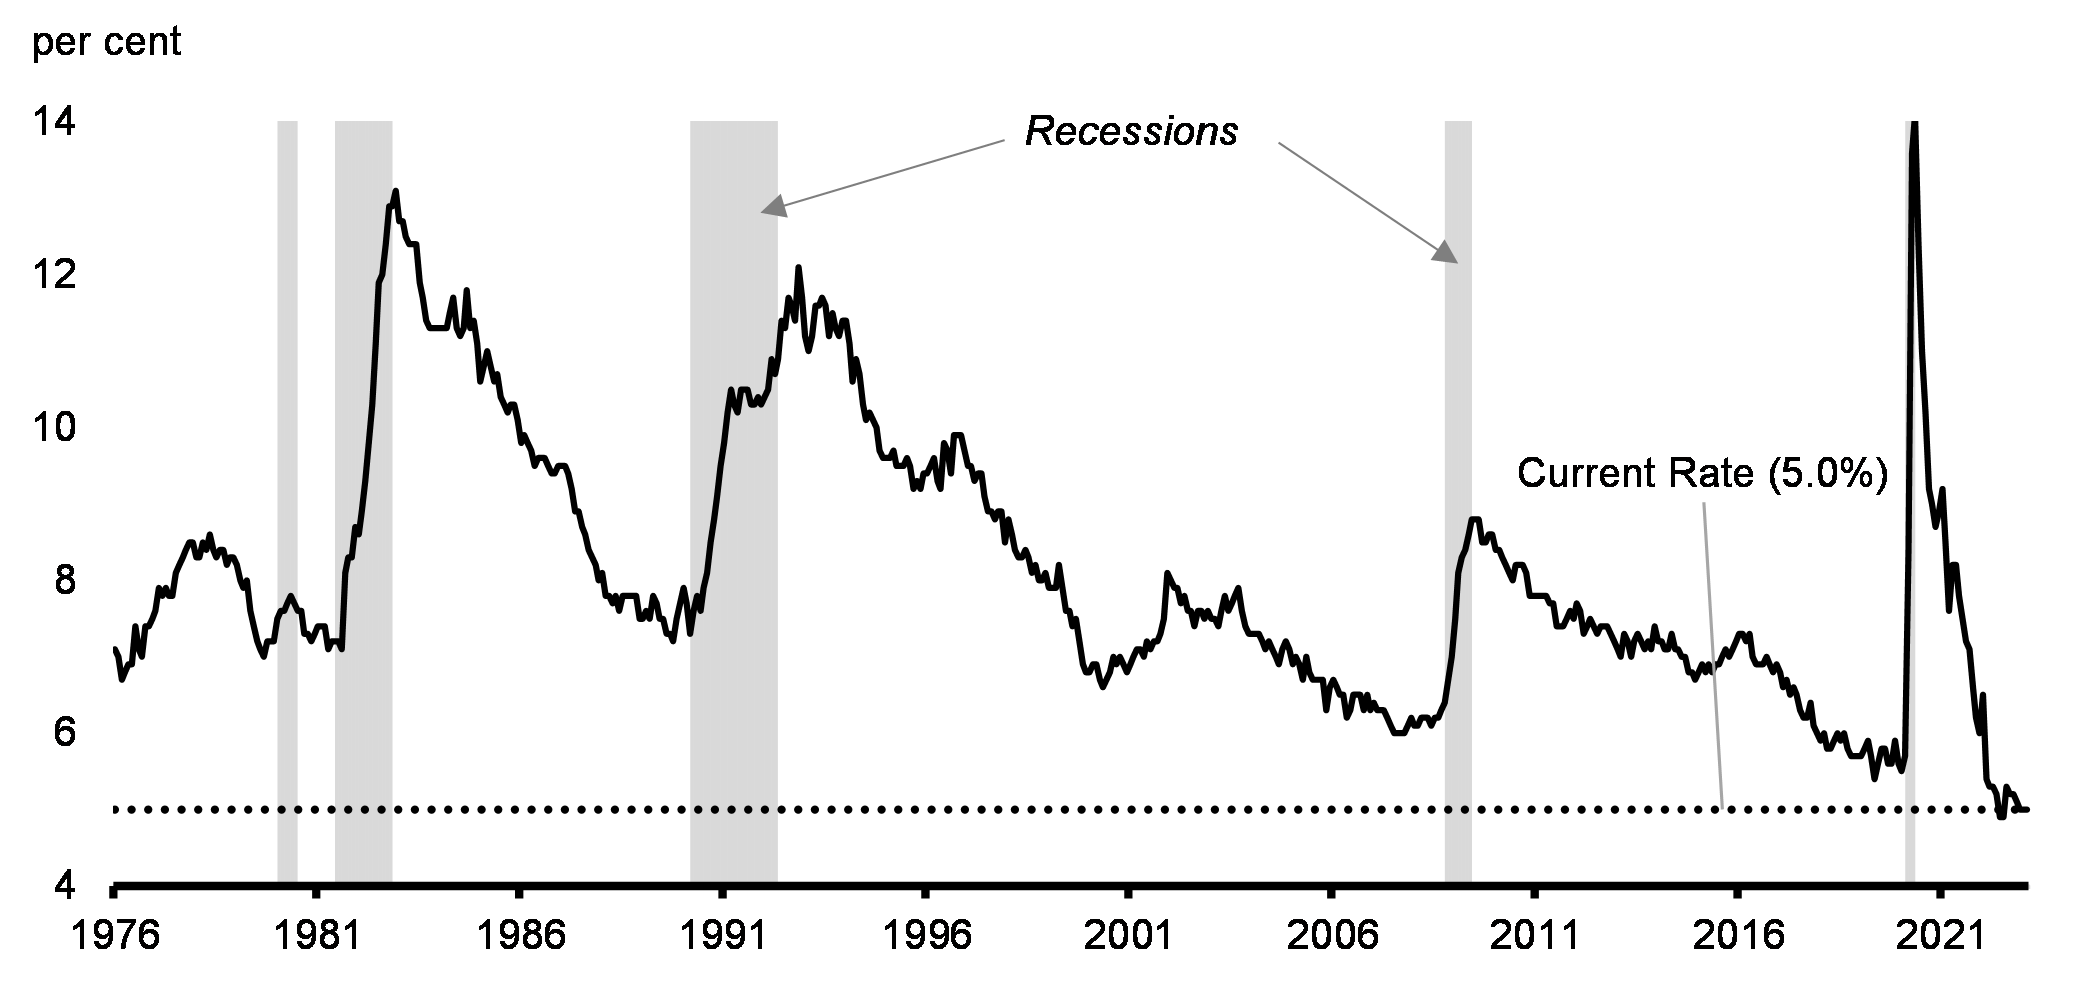
Canada's strong recovery has supported the strongest labour market in several decades. About 830,000 more Canadians are employed compared to the pre-pandemic period, and at just 5 per cent, the unemployment rate is near its record low of 4.9 per cent (Chart 3).
Unemployment Rate
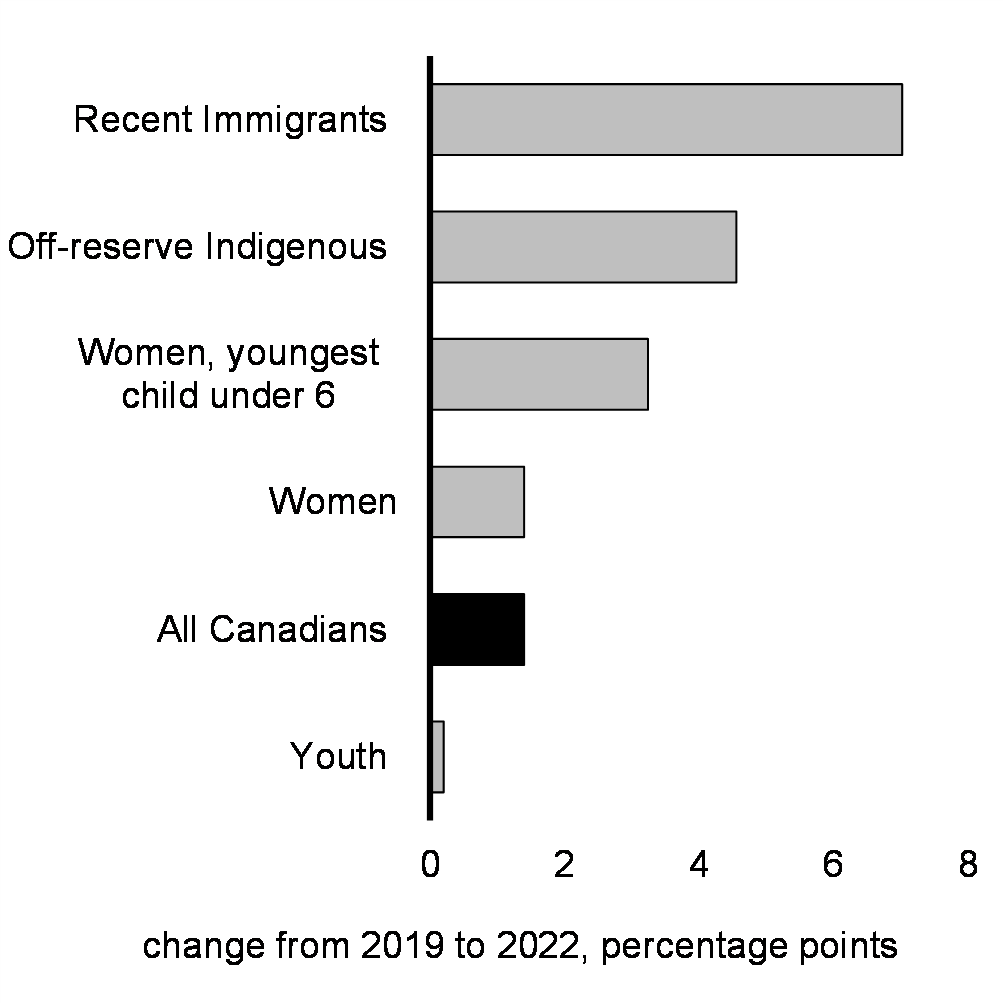
The benefits of this strong labour market are being widely shared among Canadians. More people aged 15 to 64 years are engaged in the labour market than ever before, with meaningful increases for historically under-represented groups, including women, newcomers, and young Canadians. Today, more Canadians have good middle class jobs than before the pandemic, with many also benefitting from stronger wage growth, particularly among lower-wage workers.
A Growing Workforce Benefits All Canadians
A strong and inclusive labour market has been a key driver of Canada's economic resilience over the past year.
Canada's job gains compared to when COVID-19 first hit have outperformed almost all of our G7 peers, supported by a rapidly expanding workforce (Chart 4). Notably, the government's historic investment in early learning and child care is helping more women fully participate in the workforce. The labour force participation rate for women aged 25 to 54 years has reached a record high of nearly 86 per cent, compared to just 77 per cent in the U.S. At the same time, a record high of 80 per cent of Canadians aged 15 to 64 years are now participating in the workforce, reflecting broad-based gains in employment opportunities across demographic groups (Chart 5). Making full use of the skills and talents of Canadians is a key driver of a stronger economy, helps to address labour market shortages, and increases the rate at which the economy can grow without generating inflationary pressures.
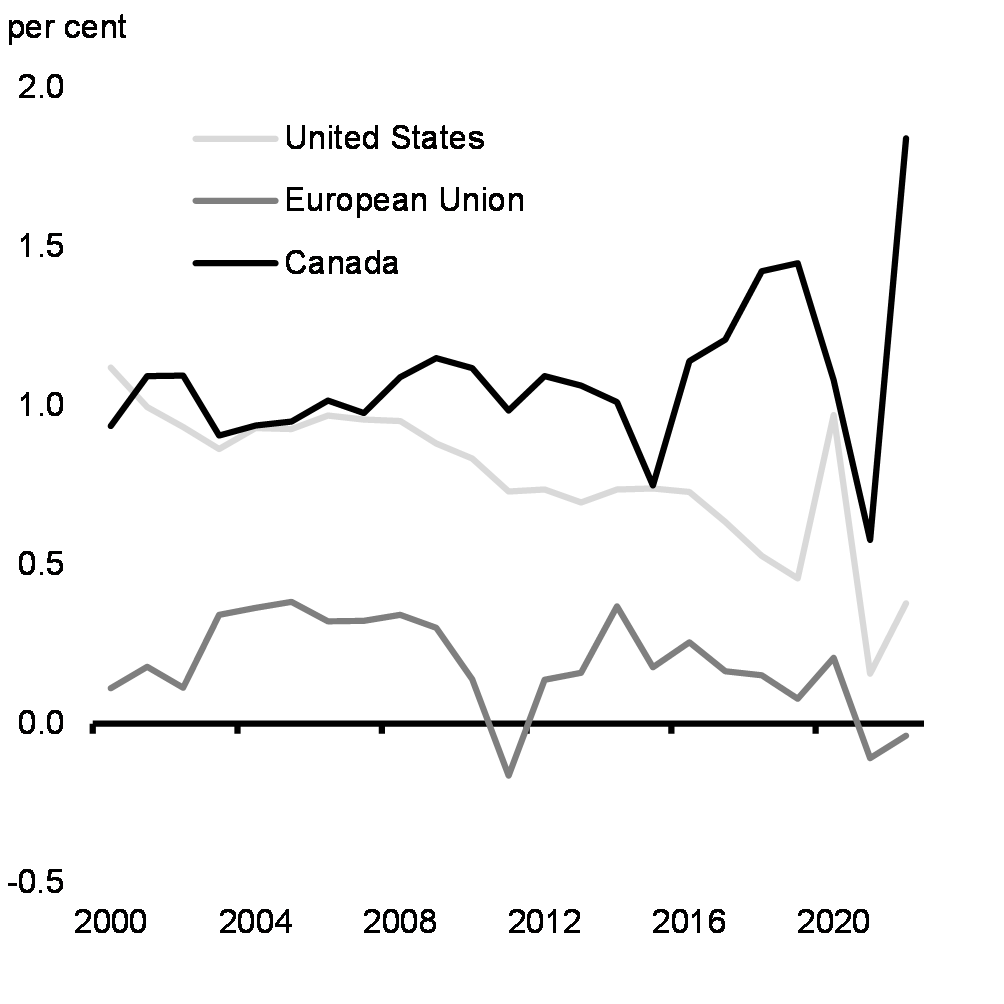
Immigration is a significant driver of economic growth and helps to build a stronger economy for everyone. Canada continues to post the fastest population growth in the G7, with strong immigration levels pushing population growth to its fastest pace since the 1950s (Chart 6).
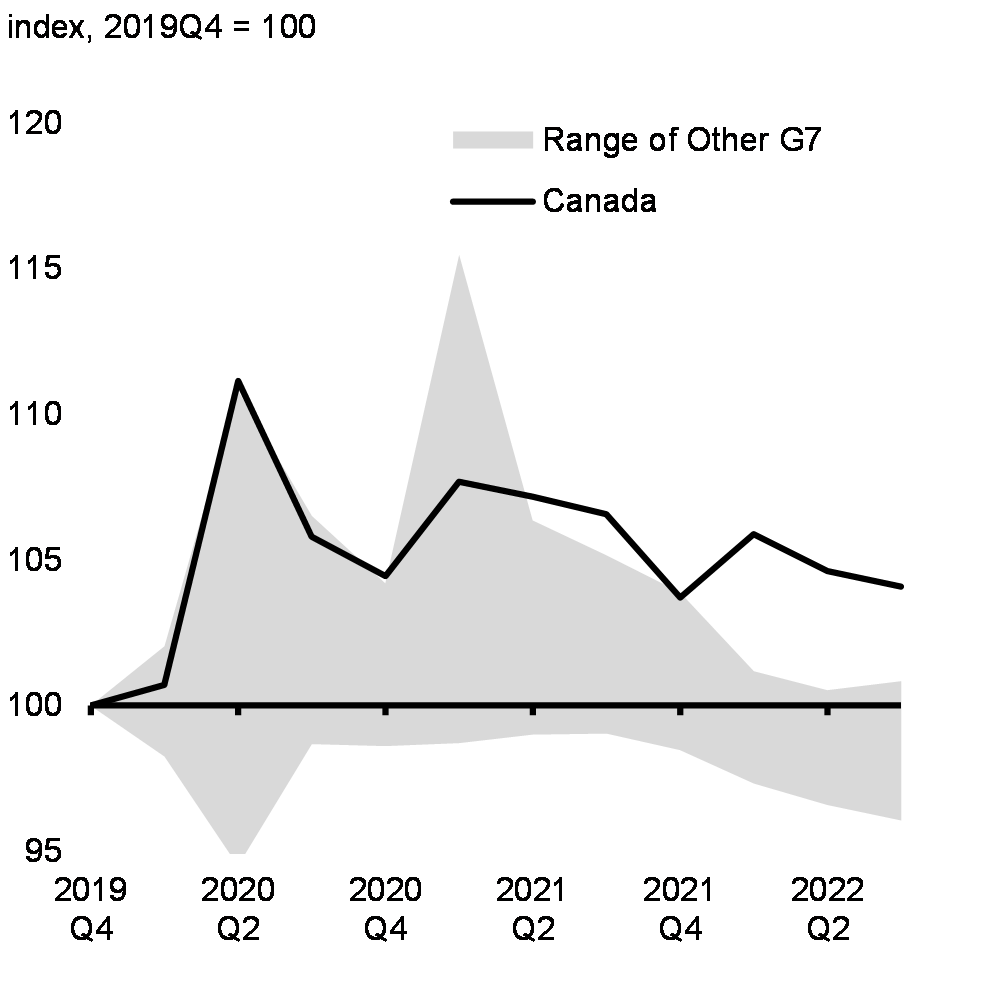
Together, higher immigration and higher labour force participation are expanding the pool of available workers, and offsetting population aging more than in other G7 economies. The resulting boost to employment has helped maintain real household disposable income per capita, even as it declined in peer economies (Chart 7). This is expected to continue to support the Canadian economy throughout 2023.
Employment Recovery From the Pandemic in G7 Economies
Change in Employment Rates From the Pre-Pandemic Period
Population Growth in Selected Economies
Real Household Disposable Income Per Capita in G7 Economies
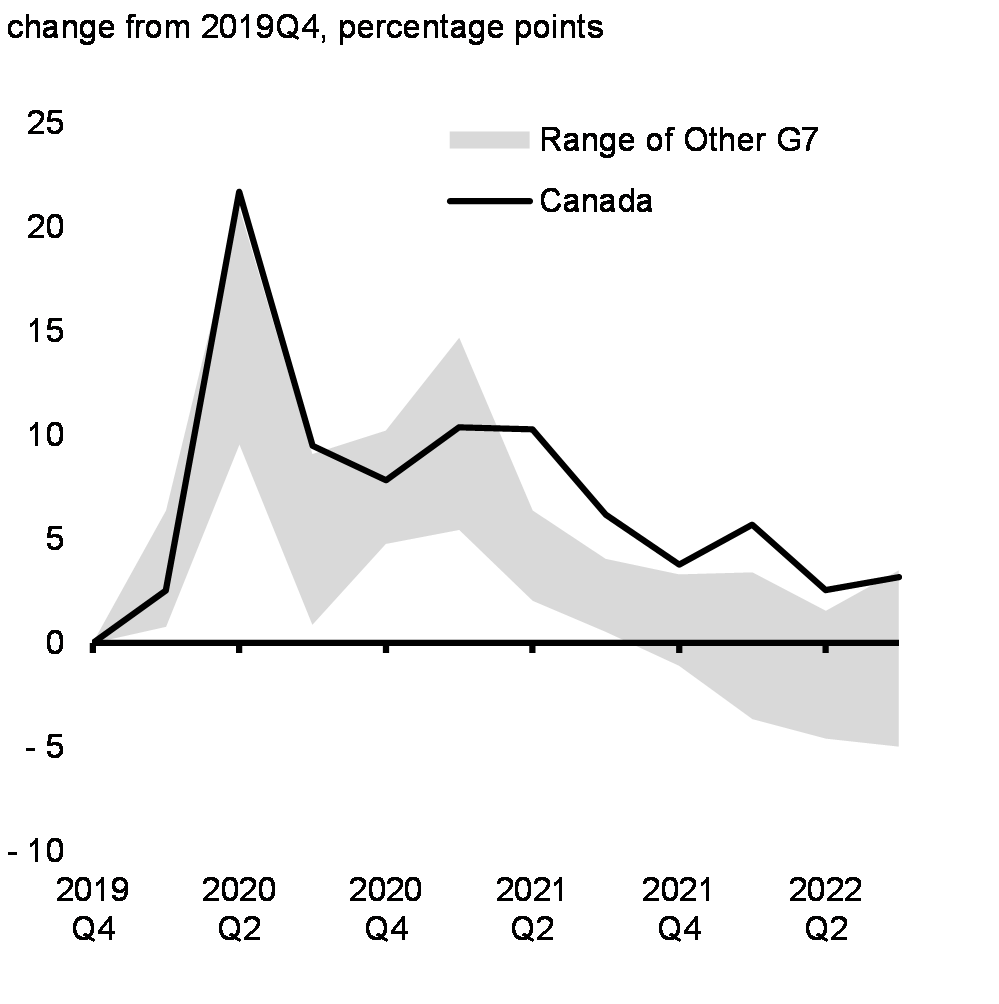
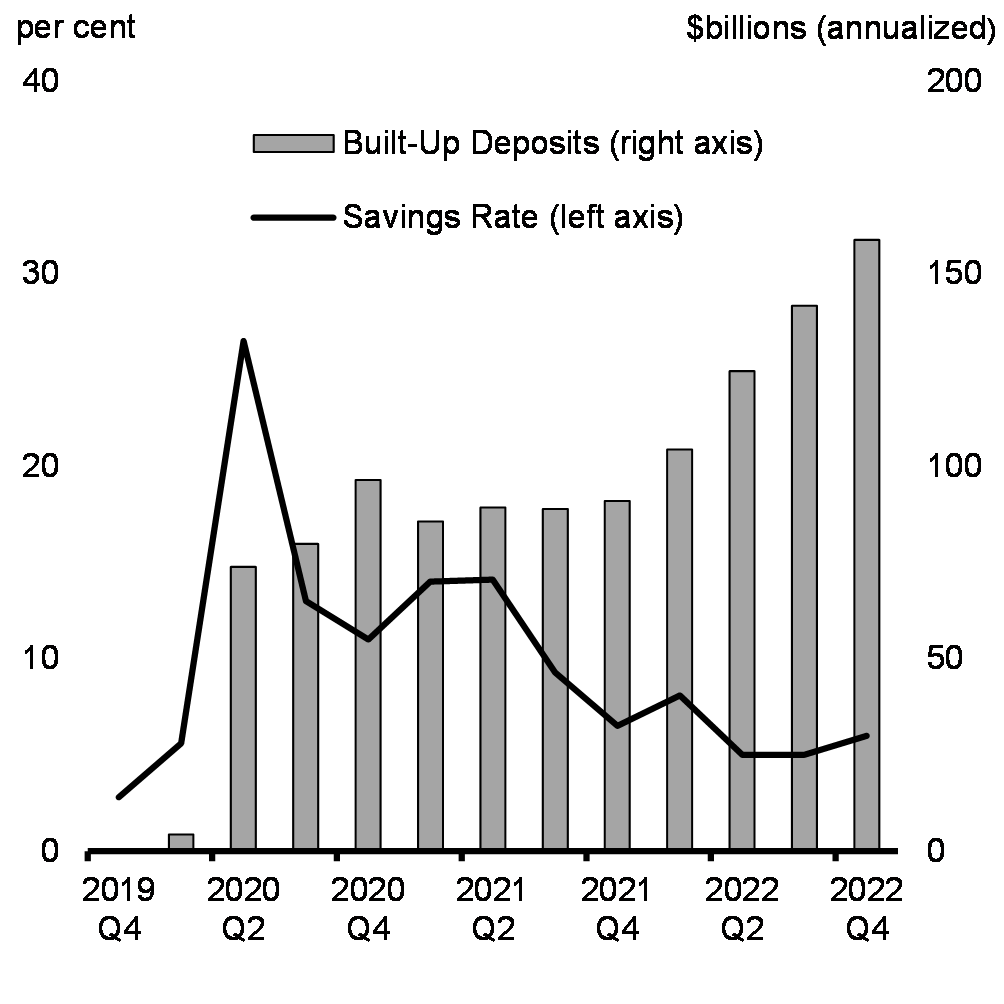
With strong labour markets supporting household income, Canadians have also built up significant savings since the beginning of the pandemic (Chart 8). Notably, many people have continued to add to their pool of savings despite the elevated cost of living (Chart 9).
Change in Household Gross Savings Rates in G7 Economies
Household Savings Rate and Build-Up in Deposits
A strong economic recovery has also resulted in labour shortages, as evidenced by Canada's near record-low unemployment rate combined with many unfilled job openings. These ongoing labour shortages are a challenge for many employers. Many businesses continue to face difficulties hiring workers, with the number of vacant job positions for every unemployed person currently about 75 per cent above the pre-pandemic norm. Canada's immigration system will continue to play an important role in helping our businesses grow.
Inflation Is Coming Down but Remains a Challenge for Canadians
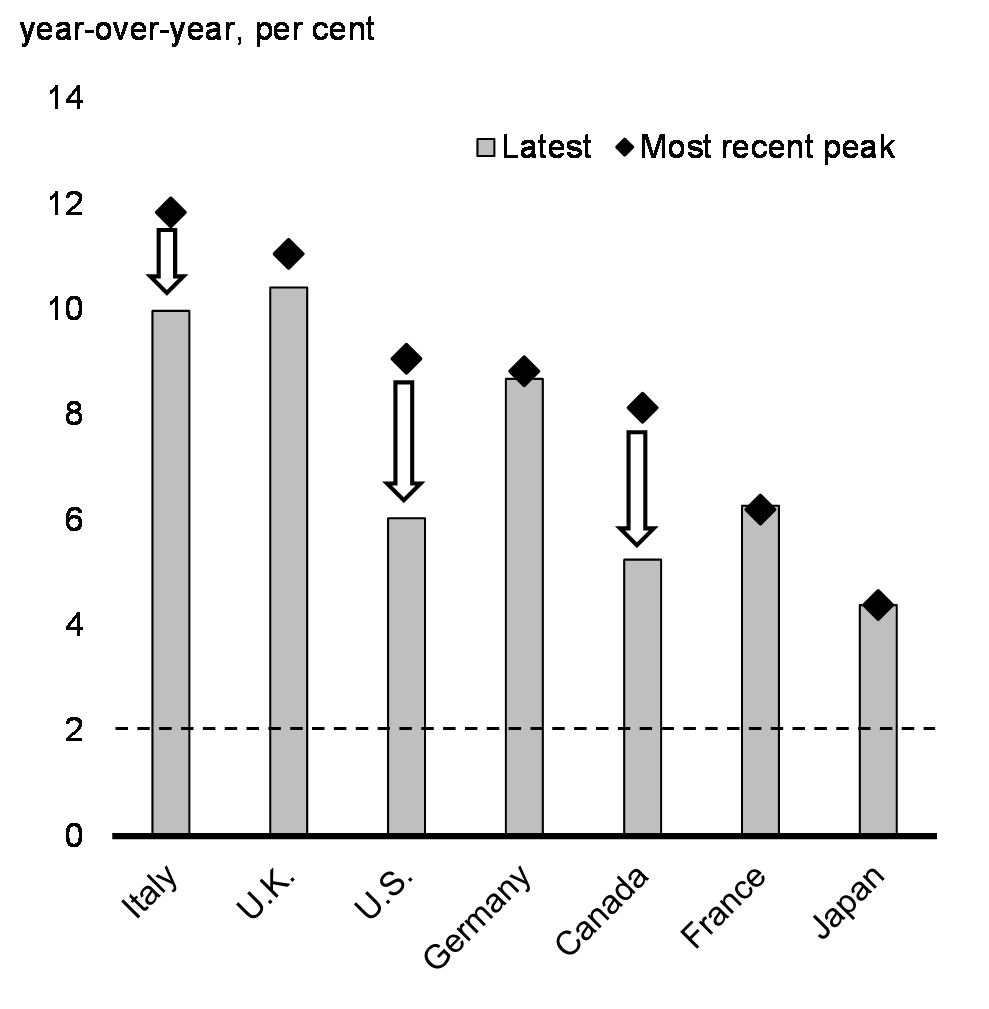
As the global economy recovered from the pandemic, inflation emerged as a major global economic challenge. Inflation was already rising when Russia's full-scale illegal invasion of Ukraine drove up commodity prices, pushing consumer price inflation globally to multi-decade highs (Chart 10). In Canada, consumer price inflation reached a peak of 8.1 per cent in June 2022, putting pressure on many household budgets.
In addition to the effect on commodity prices of Russia's full-scale invasion, rising global inflation was driven by supply-chain disruptions, strong consumption of goods, and rebounding global demand. A shortage of workers combined with higher demand for services have also contributed to upward pressure on services prices in many countries.
Consumer Price Inflation in G7 Economies
Change in Consumer Price Inflation Since the Peak of June 2022 for Selected Items in Canada
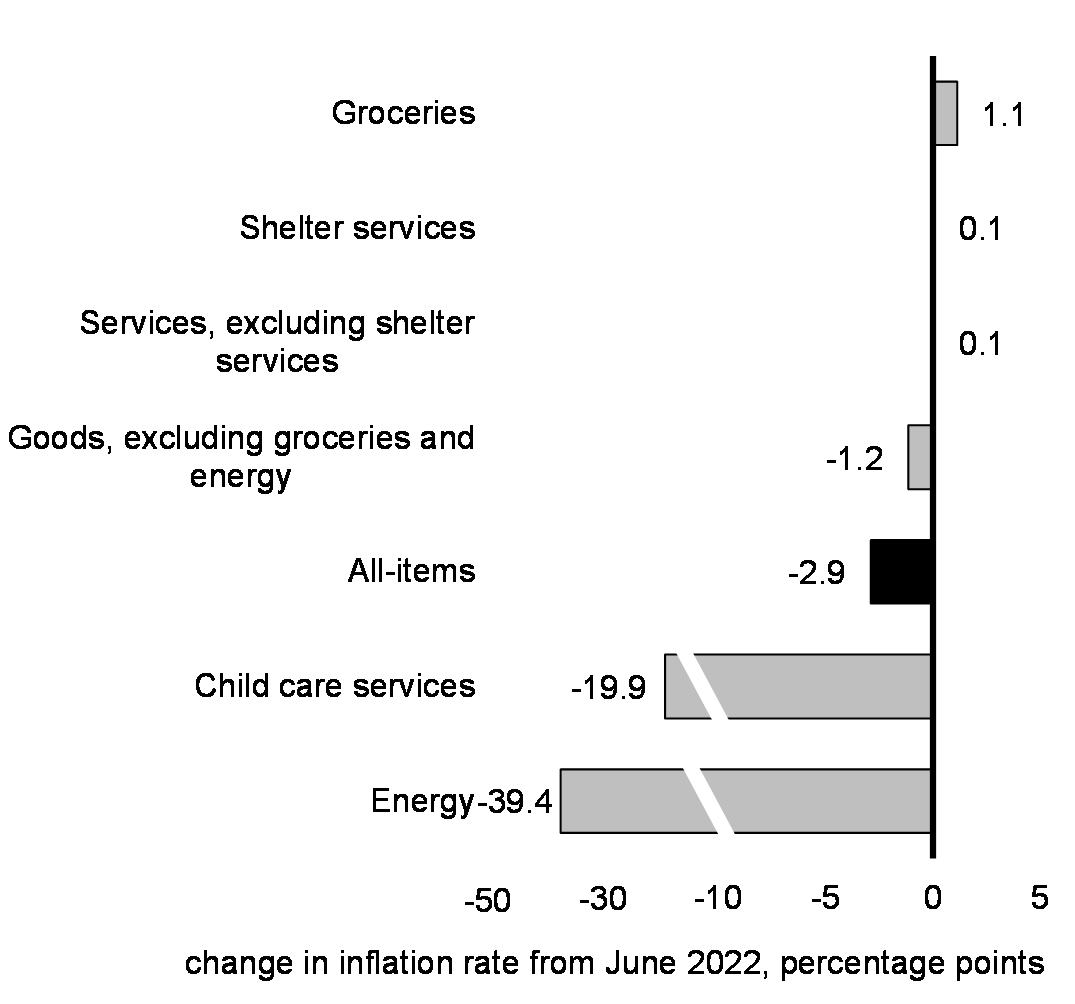
In recent months, some of these pressures have started to ease, with commodity prices falling, supply-chain bottlenecks easing, and the demand for goods normalizing (Chart 11). At 5.2 per cent in February, Canadian consumer price inflation has fallen meaningfully since its June 2022 peak and is below the rates seen in many peer economies. Services price inflation in Canada—a gauge of underlying inflationary pressures—has also plateaued in recent months, while it has continued to rise in some other countries.
Inflation is still too high. To bring inflation down, central banks around the world have sharply raised interest rates in what has been one of the fastest and most synchronised monetary policy tightening cycles since the 1980s. As the government continues to make targeted investments to support Canadians and grow the Canadian economy, it is important that governments remain mindful of not fuelling inflation. Measures in Budget 2023 to provide inflation relief to the most vulnerable are thus carefully targeted, while investments in jobs and economic growth will play a meaningful role in Canada's continued prosperity.
Continued progress on reducing inflation will be needed over the coming year to ensure that this period of elevated inflation is only temporary. As a result, there remains uncertainty about how long interest rates around the world will need to remain elevated.
The Canadian Economy Has Been Resilient, but Canadian and Global Growth Is Slowing
While the Canadian economy has remained solid, higher interest rates are beginning to work their way through both the global and Canadian economies. This is resulting in weaker economic activity.
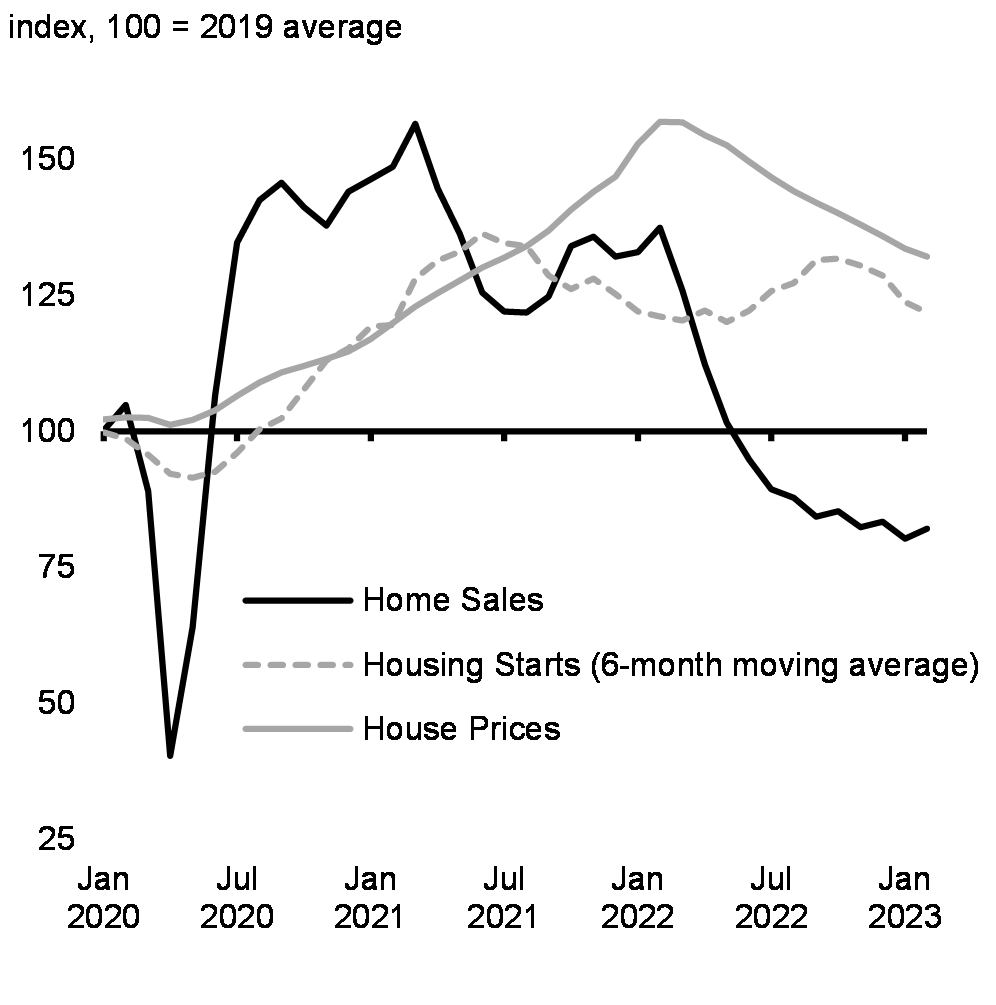
After growth of around 3 per cent annualized over the first three quarters of 2022, economic activity in Canada was unchanged in the final quarter. Despite slowing economic growth, final domestic demand—a measure of underlying economic strength—has shown resilience, and data so far suggest modest growth in the first quarter of 2023. So far, the consequences of moderating growth have been concentrated in housing markets, with higher mortgage rates pushing resales down 40 per cent, and prices down 16 per cent from their peaks in February 2022 (Chart 12). New construction is also slowing.
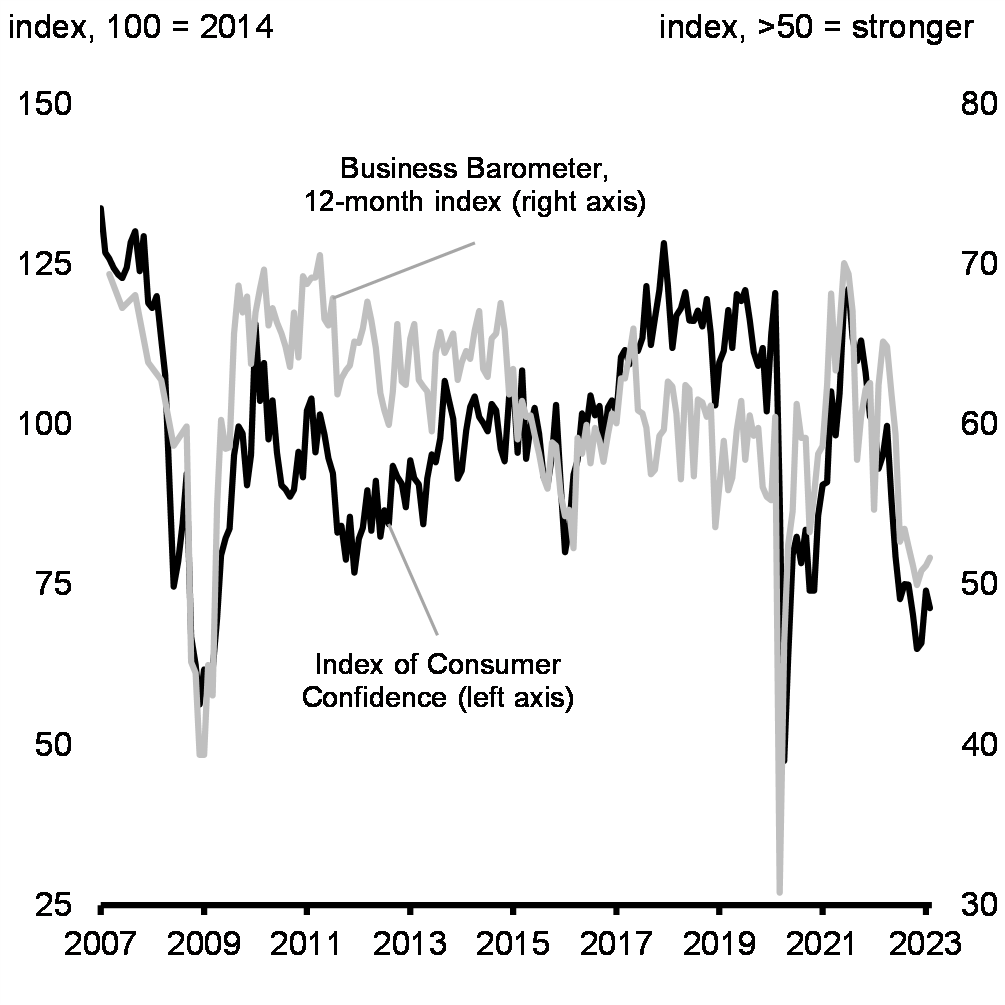
Inflation, elevated interest rates, and the higher costs, driven by global factors such as Russia's illegal invasion of Ukraine, are also creating affordability pressures for many Canadians. This is reflected in lower consumer confidence (Chart 13).
While business activity is at a healthy level and most businesses continue to report strong sales, many are also under financial pressure as the significant rise in interest rates boosts borrowing costs. A growing proportion of businesses expect activity to weaken in the coming year as the lagged impact of higher interest rates continues to feed into weaker consumer spending. As a result, many businesses have started to dial back their investment plans in recent months.
Home Sales, House Prices and Housing Starts, Canada
Measures of Consumer and Business Confidence, Canada
Outside of Canada, the rapid tightening in monetary policy has revealed pockets of vulnerabilities in the global banking system. Since March 8, three medium-sized regional U.S. banks—Silicon Valley Bank, Signature Bank, and Silvergate Bank—have failed. In Europe, one large and systemically important bank, Credit Suisse, was also nearing failure before UBS agreed to acquire it. While the global banking system remains well capitalized, uncertainty over the extent and magnitude of additional credit-related losses that could accrue as economies slow remains elevated. In response, financial authorities have taken a series of steps to stabilize the financial system, maintain confidence in the banking system, and limit further negative feedback into the global economy.
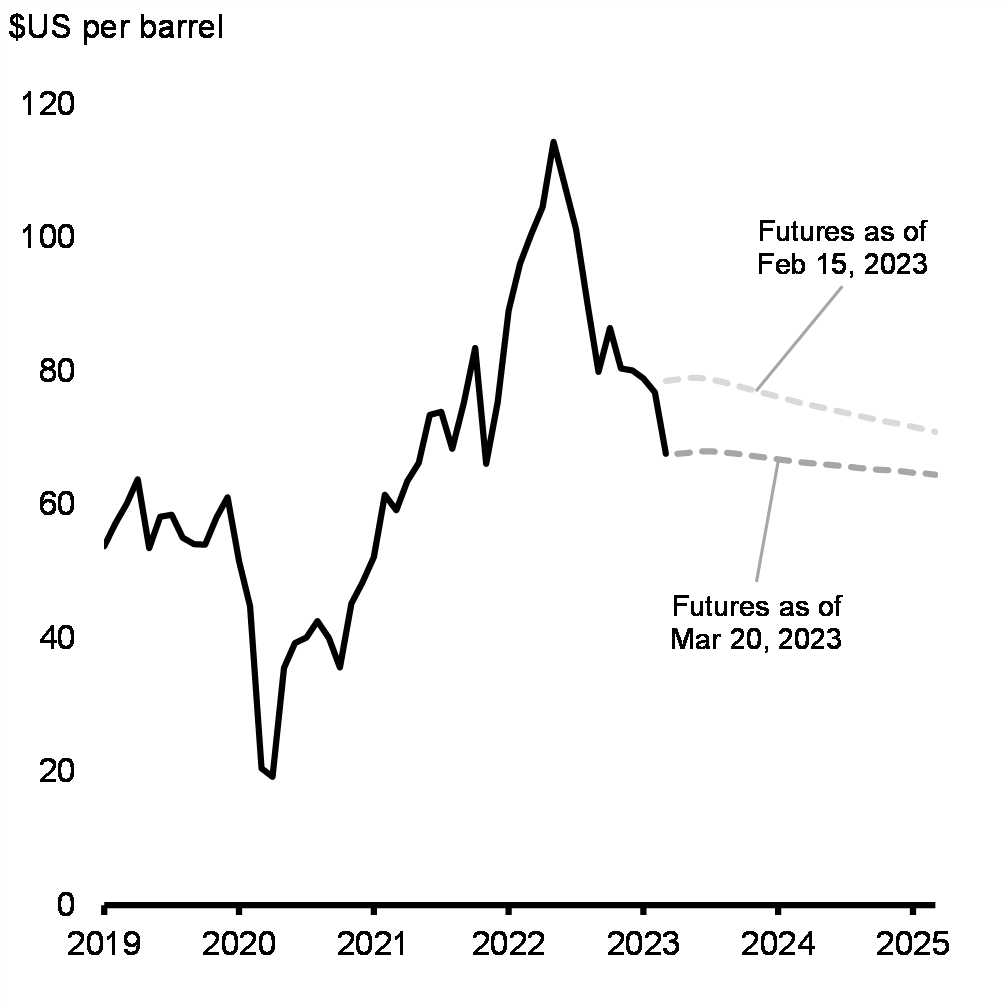
These events sent tremors across global markets, which saw an abrupt rise in risk aversion, a sudden tightening in global financial conditions, and a sharp decline in global crude oil prices (Chart 14). While the responses by U.S. and Swiss authorities have calmed markets, uncertainty remains, and a handful of smaller U.S. banks are under review for potential downgrades. On March 19, five central banks, including the Federal Reserve and the Bank of Canada, announced coordinated action to enhance the provision of liquidity in the financial system to ease strains in global funding markets.
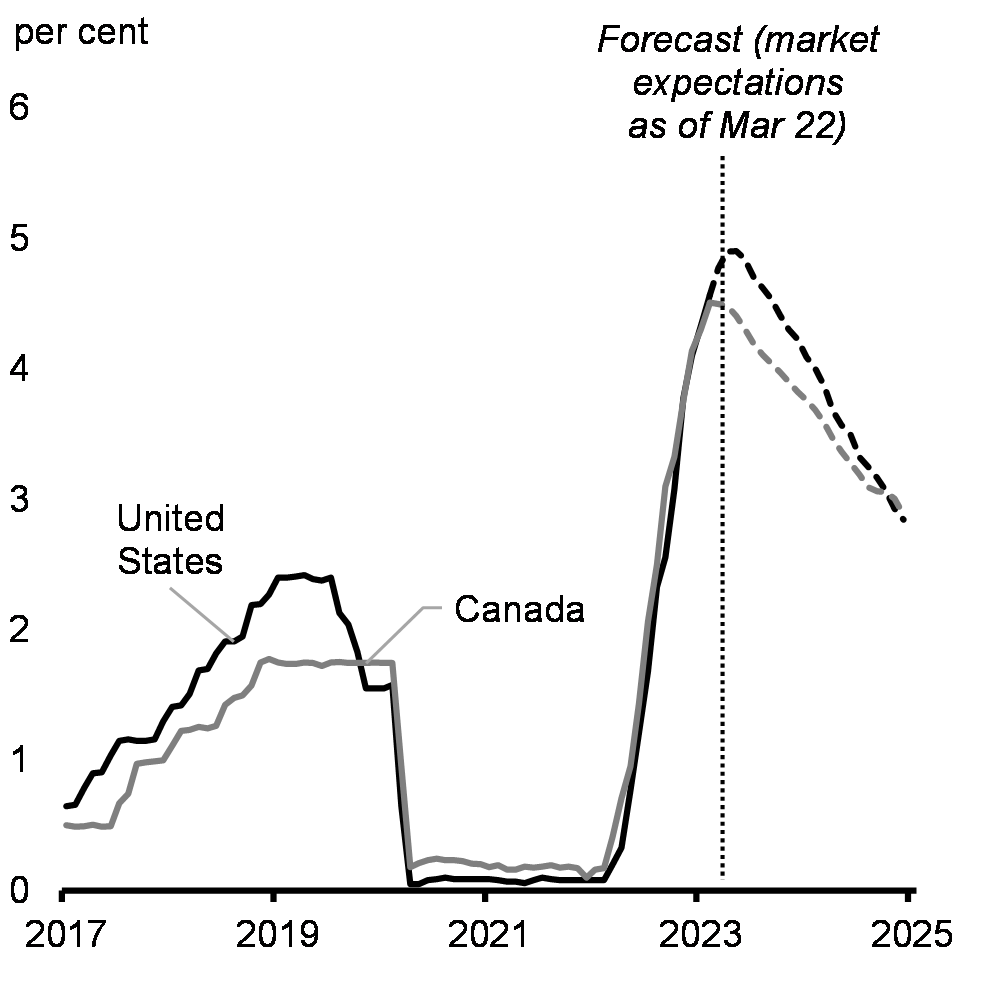
Globally, most central banks are set to maintain their policy rates at elevated levels or raise them further, with some continuing to shrink their balance sheets. This could keep broad liquidity conditions tighter than they have been in recent years. While the ramifications of banking sector stresses for the global economy are not yet clear, were the crisis to broaden, it could result in higher funding costs, restricted credit, and the amplification of the global economic slowdown. These developments also complicate the fight against global inflation, and markets now expect some pullback in policy rates as early as the second half of the year (Chart 15), suggesting the perceived likelihood of a soft landing has decreased.
The Canadian financial system is well-equipped to cope with the challenging global financial situation, and the Canadian banking sector is well-known for its stability and resilience, having fared better than many peers through the global financial crisis in 2008. Despite the healthy position of Canadian financial institutions, intensification of global financial stresses could have negative effects on the Canadian economy through tighter financial conditions and lower global economic activity.
Expected Future WTI Crude Oil Prices
Canada and United States Policy Rate Expectations
2. Canadian Economic Outlook
Private Sector Economists Expect a Shallow Recession
The Department of Finance surveyed a group of private sector economists in February 2023. The average of private sector forecasts has been used as the basis for economic and fiscal planning since 1994, helping to ensure objectivity and transparency, and introducing an element of independence into the government's economic and fiscal forecast.
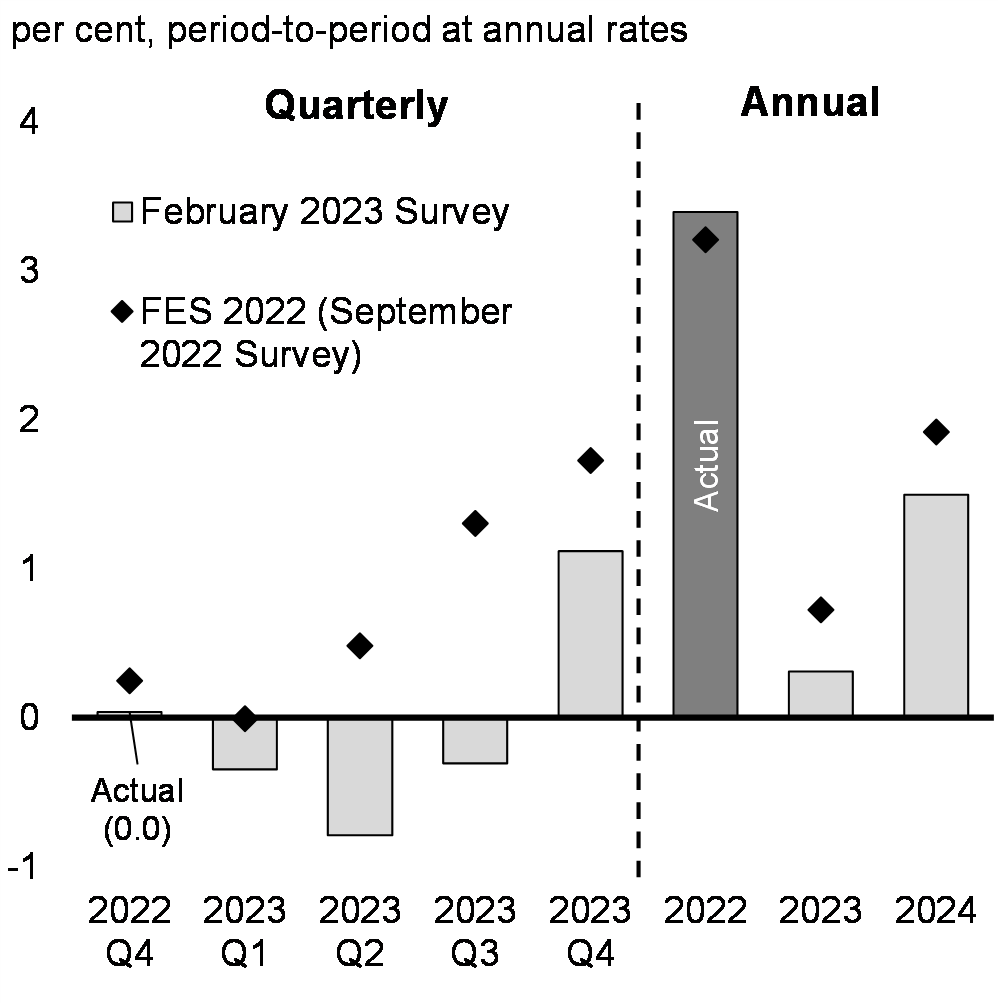
With higher interest rates, as well as slower economic growth in the U.S. and around the world, private sector economists expect Canada's economy to slow more than was projected in the 2022 Fall Economic Statement (Chart 16). Private sector economists expect the Canadian economy to enter a shallow recession in 2023. With a peak-to-trough decline of just 0.4 per cent, the contraction in real GDP is significantly smaller than during the 2008-09 recession (-4.4 per cent) and is less severe than the 1.6 per cent decline considered in the 2022 Fall Economic Statement downside scenario.
On an annual basis, real GDP growth is projected to decelerate from a strong 3.4 per cent in 2022 (slightly better than the 3.2 per cent projected in the 2022 Fall Economic Statement) to 0.3 per cent in 2023, before rebounding to 1.5 per cent in 2024 (previously 0.7 per cent and 1.9 per cent, respectively).
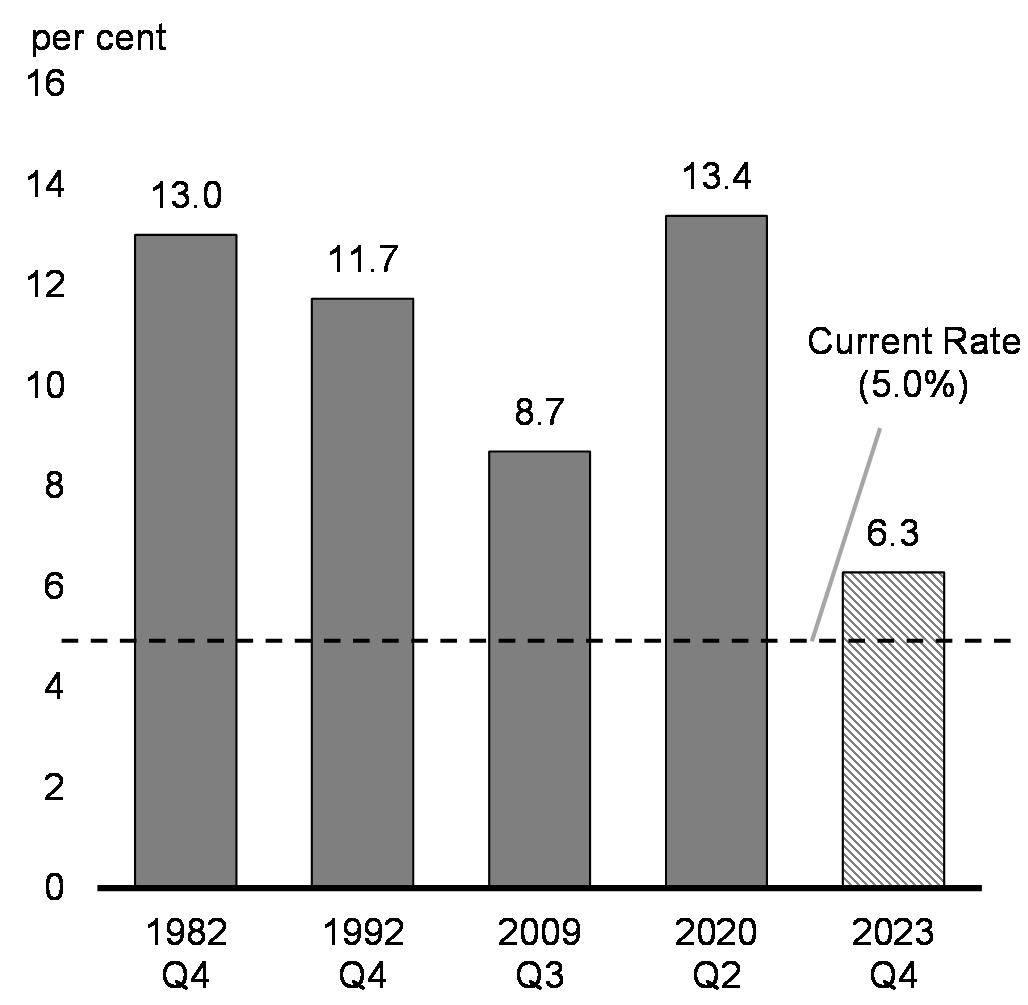
As the economy slows, Canada's near record-low unemployment rate is expected to rise to a peak of 6.3 per cent by the end of 2023. However, driven by Canada's strong labour market, unemployment is expected to remain low by historical standards, and far below the peaks of past recessions (Chart 17).
Real GDP Growth Projections
Peak Unemployment Rates in Past Recessions
Private sector economists expect Consumer Price Index (CPI) inflation to continue to ease. Inflation is expected to fall below 3 per cent in the third quarter of 2023 and to reach about 2 per cent, the Bank of Canada's target, in the second quarter of 2024, little changed from 2022 Fall Economic Statement projections.
After surging following Russia's full-scale invasion of Ukraine, commodity prices fell sharply in the second half of 2022, helping to reduce CPI inflation—largely through lower energy prices. This had a negative impact on GDP inflation (a measure of the selling price of goods and services that are produced in Canada, including our exports), which in the last two quarters of 2022 was much lower than expected by private sector economists in the 2022 Fall Economic Statement. As a result, GDP inflation in 2022 was lower than projected and is revised down significantly in 2023.
Together, the downward revisions to GDP inflation and, to a lesser extent, real GDP have weighed considerably on nominal GDP projections. On an annual basis, nominal GDP increased by 11.0 per cent in 2022 (below the 11.6 per cent projected in the 2022 Fall Economic Statement) and is projected to slow to 0.9 per cent in 2023 (previously 2.6 per cent). As a result, nominal GDP is now expected to be $60 billion lower, on average per year, compared to the private sector economists' projections in the 2022 Fall Economic Statement. It is also $16 billion lower, on average per year, compared to the downside scenario considered in the 2022 Fall Economic Statement. As the broadest measure of the tax base, the downward revision to nominal GDP is having an impact on tax receipts and the government revenue outlook. Slowing growth in nominal GDP in 2023 will push up the debt-to-GDP ratio in 2023-24 before it continues trending down (see Annex 1 for further details on the economic and fiscal outlook).
Budget 2023 Economic Scenario Analysis
Canada's near-term economic outlook remains uncertain. While the February 2023 survey suggests a shallow recession in 2023, the wide range of views among forecasters highlights many plausible outcomes, ranging from a soft landing to a more pronounced downturn.
In January 2023, the IMF upgraded its global growth forecast for 2023 to 2.9 per cent (previously 2.7 per cent in its October outlook). China's reopening is expected to provide a boost to global growth. In other major economies, including the U.S. and Europe, easing supply-chain bottlenecks and lower commodity prices have reduced inflationary pressures, while economic activity has been more resilient than expected. Likewise, Canada has continued to show progress on lowering inflation while the economy has remained solid, especially in the labour market.
The risks underpinning the downside scenario considered in the 2022 Fall Economic Statement remain areas of concern. Should elevated global inflation persist, central banks could take their policy rates higher or keep them elevated for longer. This could occur, for example, if labour markets remain constrained, or if there is a resurgence in global commodity prices related to a faster rebound in China's economy or further supply shocks related to Russia's illegal invasion of Ukraine.
In addition to the path of inflation, there is also uncertainty about the impact of higher interest rates on the global economy. With the rapid tightening in monetary policy across the world, further disruptions in the global financial system could emerge. Some funding markets have become more strained due to lower levels of liquidity, as has been seen recently with the failure of three medium-sized regional U.S. banks and challenges for Credit Suisse, and an abrupt repricing of risk could trigger a broader tightening of lending standards.
Overall, the economic outlook in the February 2023 survey continues to provide a reasonable basis for fiscal planning, and outcomes that are better or worse than the survey are both plausible. Still, the latest developments in financial markets have raised the odds of a more pronounced slowdown. To facilitate prudent economic and fiscal planning, and in light of elevated global uncertainty and recent developments in financial markets, the Department of Finance has developed two scenarios that consider faster or slower growth tracks relative to the February survey (see Annex 1 for further details on the scenarios).
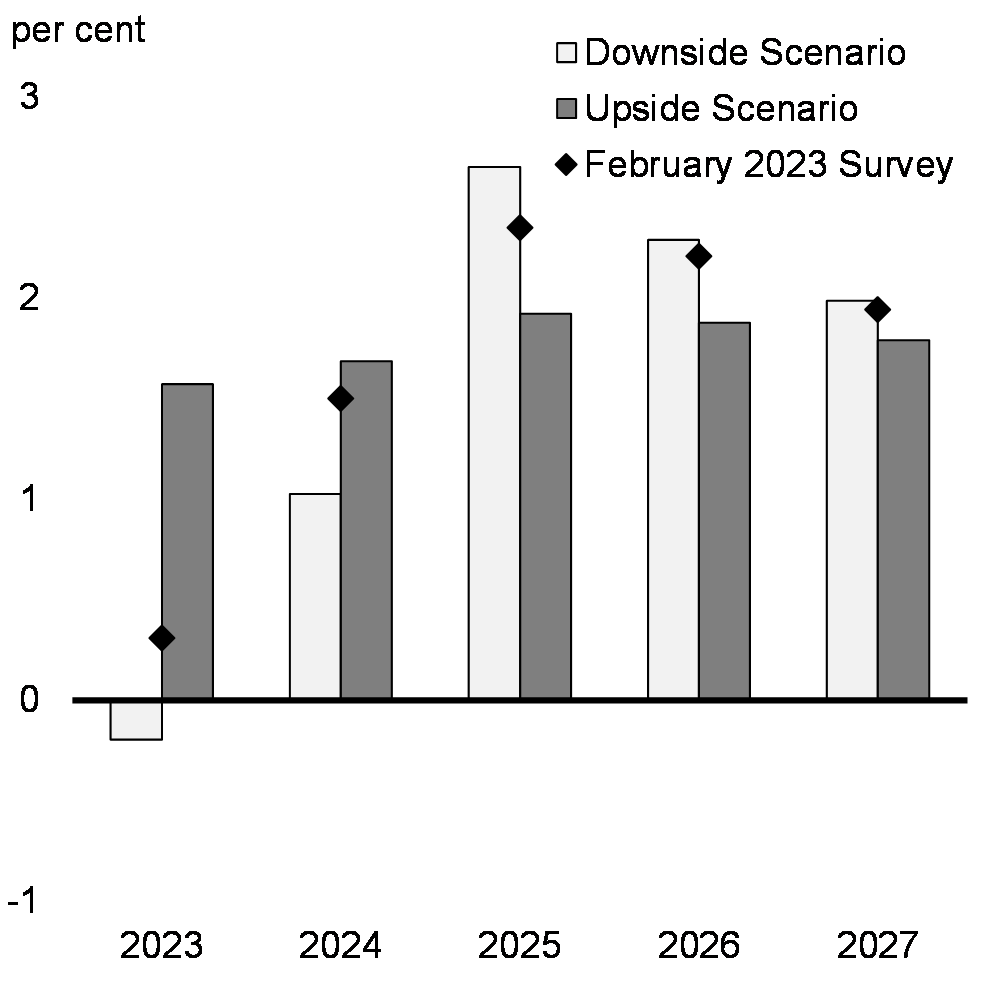
The downside scenario considers a more pronounced recession in Canada amid persistent elevated inflation, stresses in the global financial system associated with the sharp rise in interest rates, and a steeper housing correction. Real GDP contracts by 1.9 per cent from peak to trough compared to only 0.4 per cent in the survey, leading to slower growth in 2023 and 2024 (Chart 18). At the same time, weaker global demand weighs on commodity prices, with crude oil prices US$13 per barrel below the survey in 2023 and remaining US$3 per barrel below the survey over the rest of the forecast horizon.
In contrast, the upside scenario sees the Canadian economy avoid a recession as easing of supply challenges, both in Canada and globally, helps to bring down inflation even as economies remain stronger than anticipated. In Canada, this improved global economic backdrop is also supported by a larger boost from our rapidly growing population, expanding Canada's growth potential. A faster rebound in China's economy provides a boost to global growth and commodity prices, with crude oil prices US$4 per barrel above the survey in 2023 and US$8 per barrel higher for the rest of the forecast horizon. At the same time, an accelerated easing of global supply chain frictions, supported by China's reopening, results in lower inflation and interest rates compared to the survey.
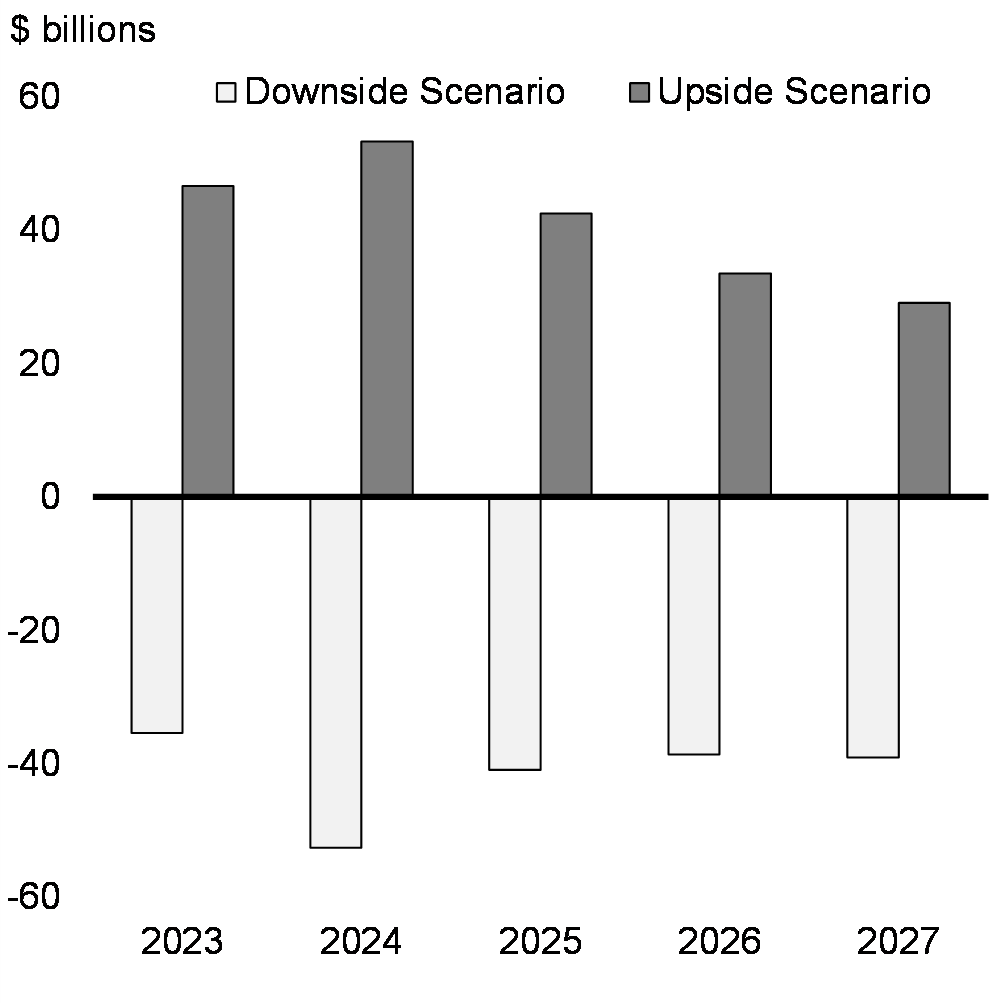
Overall, nominal GDP is $41 billion above the survey, on average per year, in the upside scenario, while it is $41 billion lower in the downside scenario (Chart 19)
Real GDP Growth
Nominal GDP Level Difference With February 2023 Survey Outlook
3. Canada's Place in a Changing Global Economy
The government is navigating the near-term economic challenges of inflation, higher interest rates, and supporting vulnerable Canadians with the rising cost of living, while also ensuring that Canada is well-placed to thrive in a rapidly changing global economy.
The accelerating work to build a net-zero global economy has sparked a global race to attract investment in clean economies and the growing industries of tomorrow. In the aftermath of Russia's illegal invasion of Ukraine, which exposed strategic economic vulnerabilities among many of the world's democracies, Canada's allies are also moving at speed to limit their dependence on dictatorships, and to friendshore their economies by building their critical supply chains through democracies like our own. In Budget 2023, the government makes transformative investments to ensure Canada does not fall behind at a time of significant opportunity for Canadians and Canadian businesses.
Moving to Net-Zero
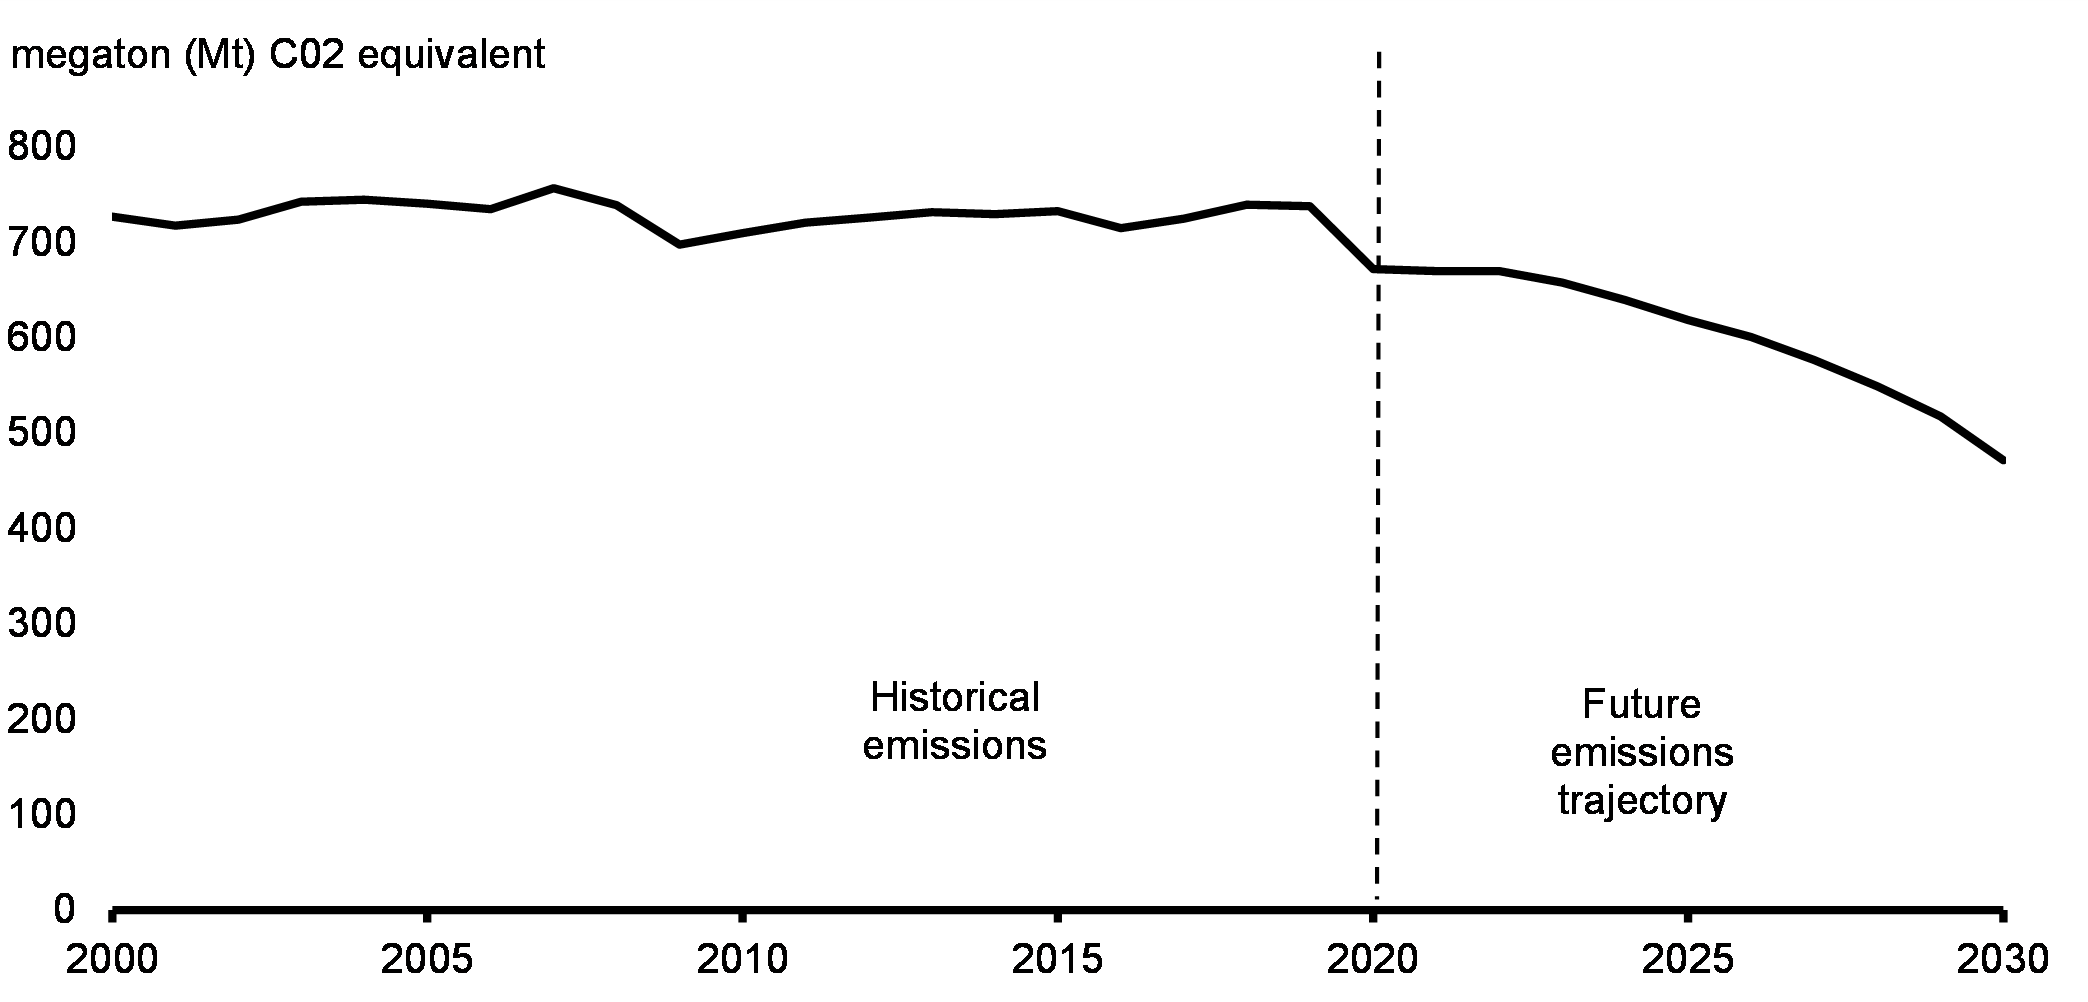
As a major energy producer, the global shift to net-zero presents both a challenge and a great opportunity for Canada (Chart 20). Analysis conducted by the Bank of Canada and the Office of the Superintendent of Financial Institutions suggests that decisive action is required to ensure Canada remains competitive during the global shift to net-zero. Inaction could, in some scenarios, leave Canada's GDP approximately 10 per cent lower than it otherwise would be by 2050. Canada's future economic prosperity depends on the speed and scale of our response.
Aggregate Historical and Future Trajectory of GHG Emissions, 2000-2030
Having invested heavily in our clean economy since 2015, along with our highly skilled workforce and abundance of natural resources, Canada is well-positioned to succeed in the growing global clean economy if we continue to make smart long-term investments today. The scale of investments that Canada requires to reach net-zero by 2050 is significant, with estimates ranging from $60 billion to $140 billion per year on average. It will be up to the private sector to make the majority of these investments, but to avoid the consequences of underinvestment, it is critical that governments invest in policy frameworks capable of mobilizing private capital. Supporting the private sector to make the investments needed to thrive and create good middle class jobs in the clean economy is a joint responsibility. The federal government cannot do this alone, and provinces and territories must similarly invest heavily if Canada is to avoid the consequences of being underprepared for the global shift to net-zero.
Reducing Supply Chain Vulnerabilities
Simultaneously, Canada must navigate a fundamental shift in the patterns of global trade. For much of the past three decades, the global economy has become increasingly interconnected. While economic integration lowered costs for many goods, it also built a system of global trade that was vulnerable to the disruption of critical supply chains.
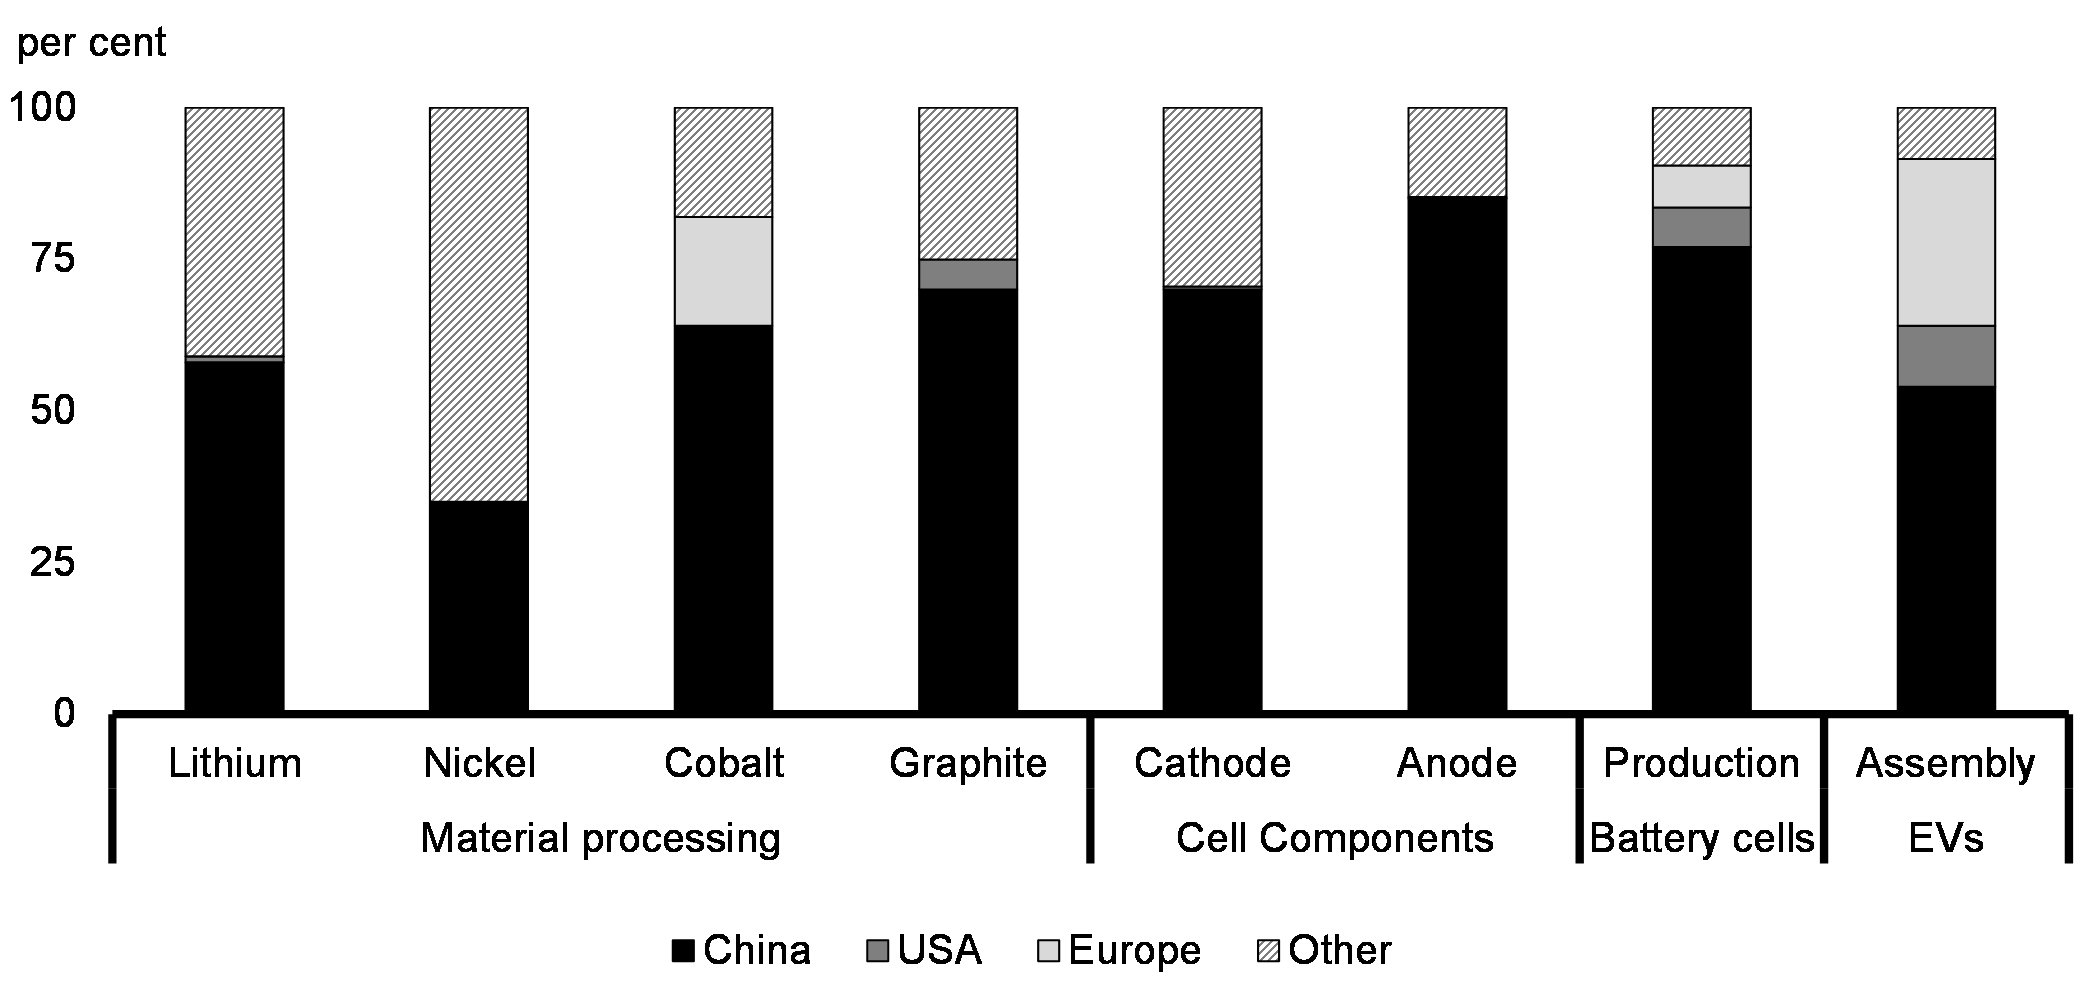
For Canada and our democratic partners, the vulnerability created by dependence on authoritarian regimes for critical goods is no longer tenable. Russia's weaponization of energy exports has forced the world's democracies to fundamentally rethink their supply chain vulnerabilities. China currently dominates key portions of supply chains for clean technologies, including batteries (Chart 21).
The mitigating of these vulnerabilities by the world's democracies will require a realignment of global trade, and the shifting of critical supply chains away from dictatorships and towards democracies like our own.
This process, which has been referred to as "friendshoring," represents a significant economic opportunity for Canada and for Canadian workers. As a stable democracy with a skilled workforce and a rich endowment of natural resources, Canada has a strong foundation from which to become a supplier of critical goods for our allies. Building upon this foundation will require investments in Canada's economic capacity, both now and into the future.
China's Comparative Concentration in the Global Electric Vehicle (EV) Battery Supply Chain, 2022
Transforming Challenges into Opportunities
The need for investment to manage these structural challenges will not be limited to one sector or one aspect of the economy. Broad-based investment will be required to grow our economy and create good middle class jobs in the years to come. The scale of required investments is massive and the private sector alone is unlikely to mobilize the level of capital required in Canada at sufficient speed.
Many of the investments that need to be made will stretch over decades and involve high up-front costs. Moreover, key sectors and technologies will have significant spillover effects by driving development of related industries. For example, fundamental inputs to clean production and the production of clean technologies, such as electricity, critical minerals, and carbon capture, utilization and storage (CCUS), will provide foundations for an expanding clean economy. For related sectors, such as hydrogen and clean manufacturing, this will boost their productivity and support their resilience, and help to generate new middle class jobs. Private investment decisions may not take full account of these spillovers, which increases the risk of underinvestment.
Without the right policy framework, Canada could see underinvestment in critical areas and a slow pace of innovation in new clean technology. Together, these would result in Canada falling behind the United States and other countries that are moving forward aggressively to build their clean economies, create middle class jobs, and ensure more prosperous futures for their people. Canada must act decisively to ensure it remains the location of choice for new investment in these sectors, particularly in the face of recent passage of U.S. Inflation Reduction Act (IRA).
Budget 2023 proposes substantial measures as the next steps in the government's plan to "crowd-in" new private investment by leveraging public investment and government policy. The goal of this approach is not to substitute government for the private sector, nor supplant market-based decision making. It is to leverage the tools of government to mobilize the private sector.
This approach is not about the government picking individual corporate winners in an effort to engineer a preferred vision of the economy in 2050. That approach did not work in the past, and is even less likely to work in today's environment of rapid technological change. The tax incentives and investment supports proposed in Budget 2023 are designed to set a framework for boosting overall investment, while leaving the private sector to determine how to invest based on market signals.
At the same time, the government has an indispensable role in ensuring that investment happens where it will have the greatest long-term impact for Canadians' standard of living and the reduction of our emissions. This means focusing on areas where Canada has a comparative advantage, and making investments that will have the greatest impact on Canada's productive capacity and ability to create good middle class jobs. It will also mean looking to industries that will grow in a changing global economy, and seeking out areas where Canada can both benefit at home and contribute to the economic resilience of our friends and allies.
Budget 2023 takes a strategic approach to supporting Canada's long-term economic competitiveness and prosperity by investing in securing Canada's clean technology advantage, our future as a global leader in clean fuels, and our natural advantage as a producer of clean electricity. In doing so, we can help to usher in a new era of prosperity for Canadians.
4. Investing Responsibly in Canada's Future
Budget 2023 lays out a responsible plan to grow Canada's economy and create good middle class jobs for Canadians; to strengthen Canada's universal public health care system and provide dental care for Canadians; to protect our environment; and to support a range of other key priorities that matter to Canadians.
Years of responsible fiscal stewardship have left Canada in an enviable fiscal position relative to our global peers. This responsible stewardship also allows the government to act proactively, with support for those who need it most and critical investments in the long-term prosperity of Canadians. At the same time, the government recognizes there is an opportunity to refocus existing spending, following the pandemic, on priorities that matter most to Canadians.
| Projection | ||||||
|---|---|---|---|---|---|---|
| 2022–2023 | 2023–2024 | 2024–2025 | 2025–2026 | 2026–2027 | 2027–2028 | |
| Budgetary balance – 2022 Fall Economic Statement (FES 2022) | -36.4 | -30.6 | -25.4 | -14.5 | -3.4 | 4.5 |
| Economic and fiscal developments since FES 2022 | 6.4 | -4.7 | -4.9 | -5.1 | -7.5 | -10.3 |
| Budgetary balance before policy actions and measures | -30.0 | -35.3 | -30.3 | -19.5 | -10.9 | -5.8 |
| Policy actions since FES 2022 | -5.4 | 0.7 | 3.2 | 2.6 | 1.7 | 0.1 |
| Budget 2023 measures (by chapter) | ||||||
| 1. Making Life More Affordable and Supporting the Middle Class | -2.5 | -0.8 | -0.3 | -0.5 | -0.5 | -0.6 |
| 2. Investing in Public Health Care and Affordable Dental Care | -2.0 | -3.6 | -4.6 | -6.4 | -6.8 | -7.9 |
| 3. A Made in Canada Plan: Affordable Energy, Good Jobs, and a Growing Clean Economy | 0.0 | -1.2 | -3.1 | -4.4 | -5.9 | -6.3 |
| 4. Advancing Reconciliation and Building a Canada That Works for Everyone | -3.1 | -2.5 | -1.3 | -1.0 | -0.6 | -0.6 |
| 5. Canada's Leadership in the World | -0.1 | -0.2 | -0.1 | -0.1 | -0.1 | -0.1 |
| 6a. Effective Government and Improving Services to Canadians | 0.1 | 2.8 | 0.1 | 0.8 | 2.9 | 3.2 |
| 6b. A Fair Tax System | 0.0 | 0.2 | 1.5 | 1.6 | 4.4 | 4.0 |
| Total – Actions Since FES 2022 and Budget 2023 Measures | -13.0 | -4.8 | -4.7 | -7.3 | -4.9 | -8.3 |
| Budgetary Balance | -43.0 | -40.1 | -35.0 | -26.8 | -15.8 | -14.0 |
| Budgetary Balance (per cent of GDP) | -1.5 | -1.4 | -1.2 | -0.9 | -0.5 | -0.4 |
| Federal debt (per cent of GDP) | 42.4 | 43.5 | 43.2 | 42.2 | 41.1 | 39.9 |
|
A negative number implies a deterioration in the budgetary balance (lower revenue or higher expenses). A positive number implies an improvement in the budgetary balance (higher revenue or lower expenses). |
||||||
Investing in Canada's Future is a Joint Responsibility
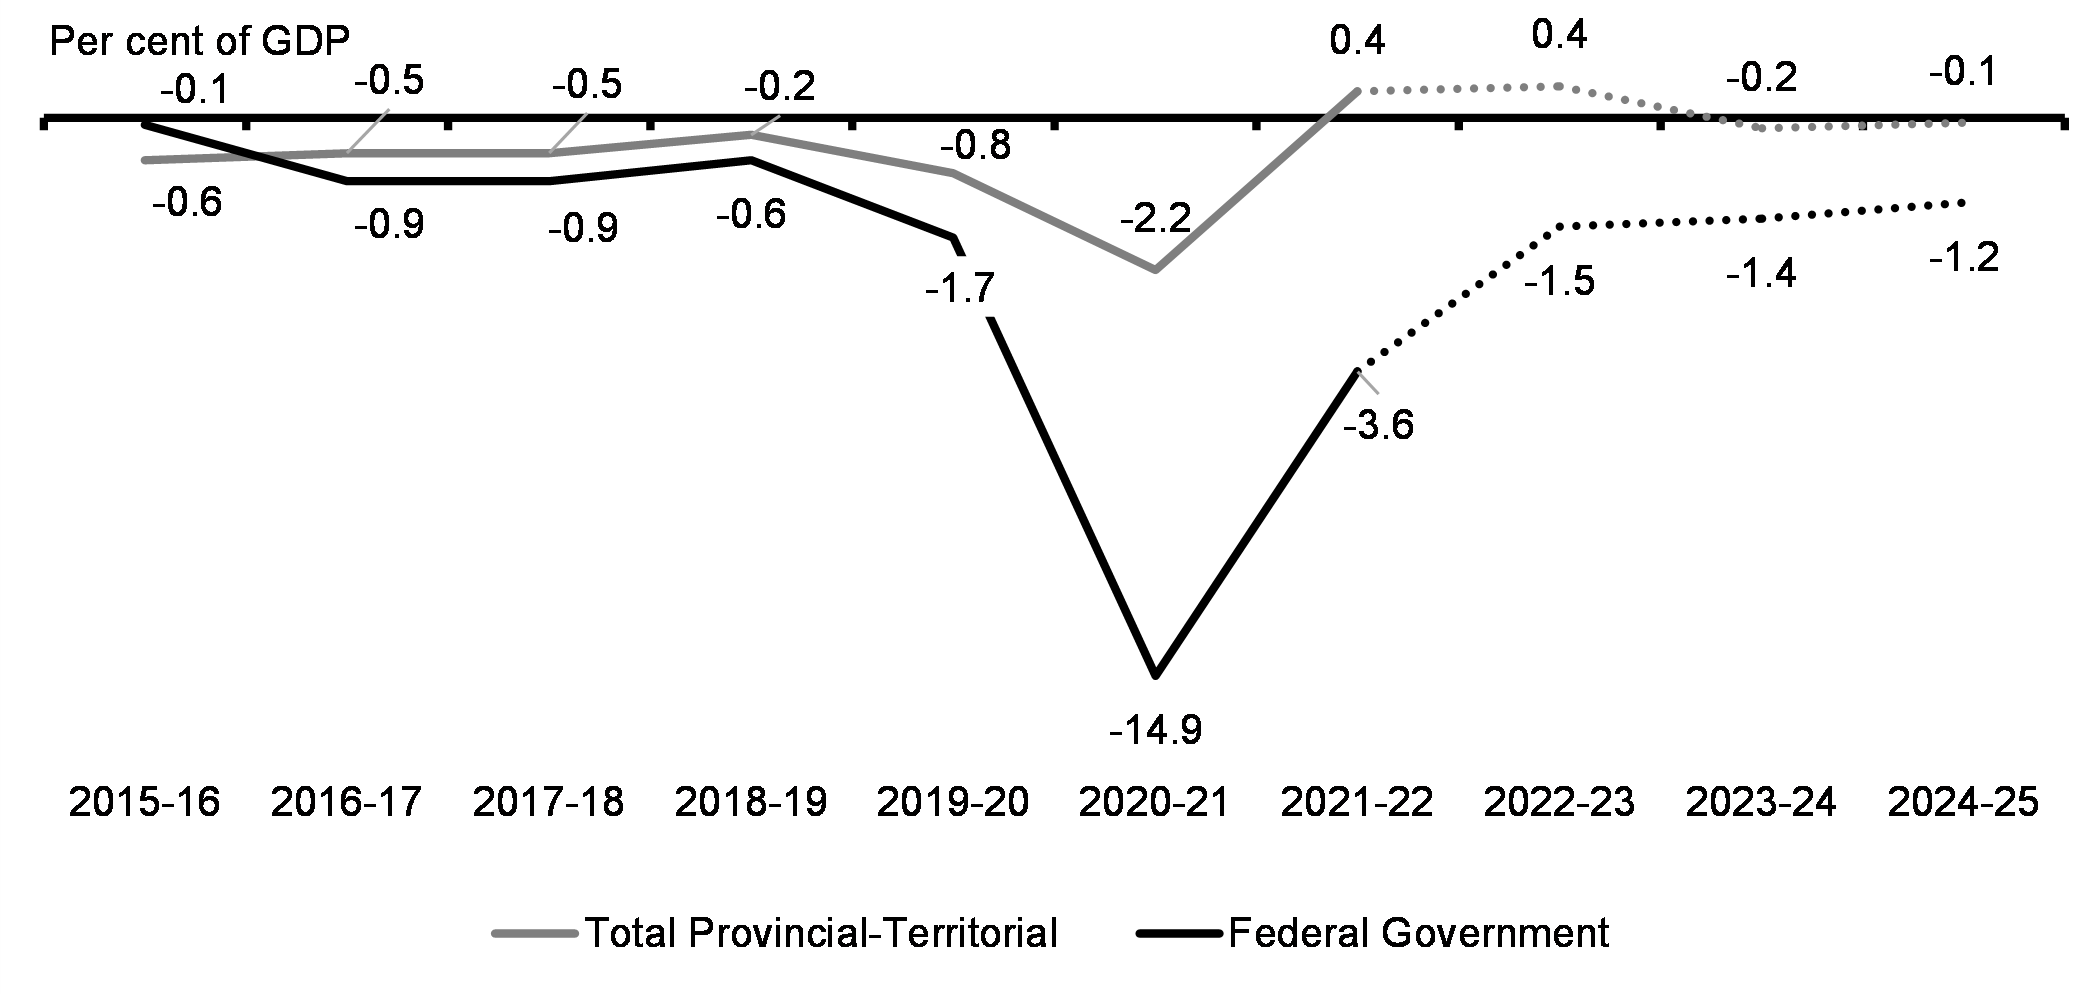
Driven by the federal government providing eight out of every ten dollars in emergency pandemic spending, provincial and territorial governments continue to significantly outperform fiscal projections. Fiscal results to date show that the aggregate provincial-territorial budgetary balance moved into a surplus position in 2021-22, with an expectation that it will remain broadly balanced thereafter. This stands in contrast to the deficit of 1 per cent of GDP in 2021-22 that had been expected through provincial and territorial 2022 budgets (Chart 22).
The solid provincial-territorial fiscal position means that, together, provinces and territories have the ability to take proactive action to help build Canada's clean economy.
Federal and Provincial Budgetary Balances
A Responsible Fiscal Plan in Challenging Times
The fiscal outlook presented in Budget 2023 continues to place the government's fiscal stance well within key fiscal sustainability indicators, including:
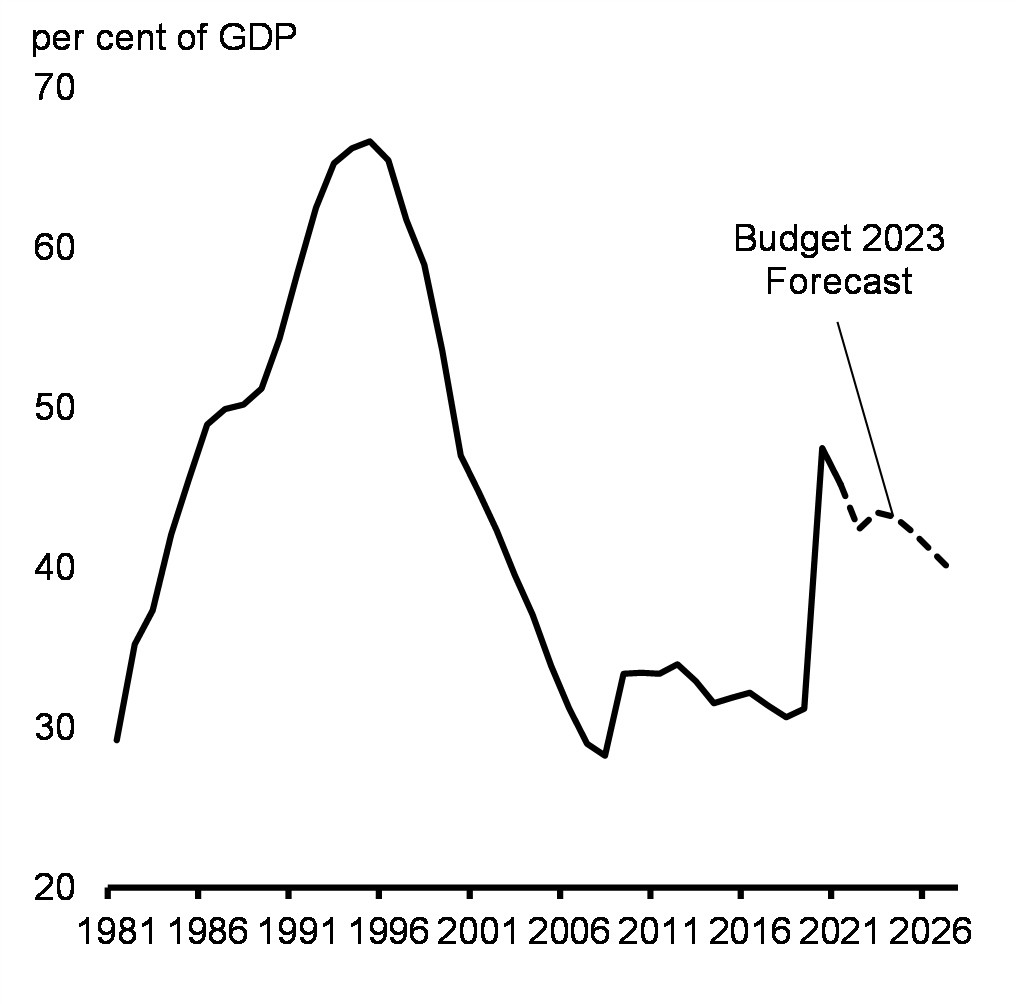
- While rising slightly in 2023-24 due to the global economic slowdown and lower forecasted GDP, the federal debt-to-GDP ratio continues on a declining path from 2024-25 onward (Chart 23).
- The deficit is projected to decline in every year of the forecast and return to 1 per cent of GDP or lower in 2025-26 and ongoing, ensuring Canada's longer-term fiscal sustainability by keeping the debt-to-GDP ratio on a downward path.
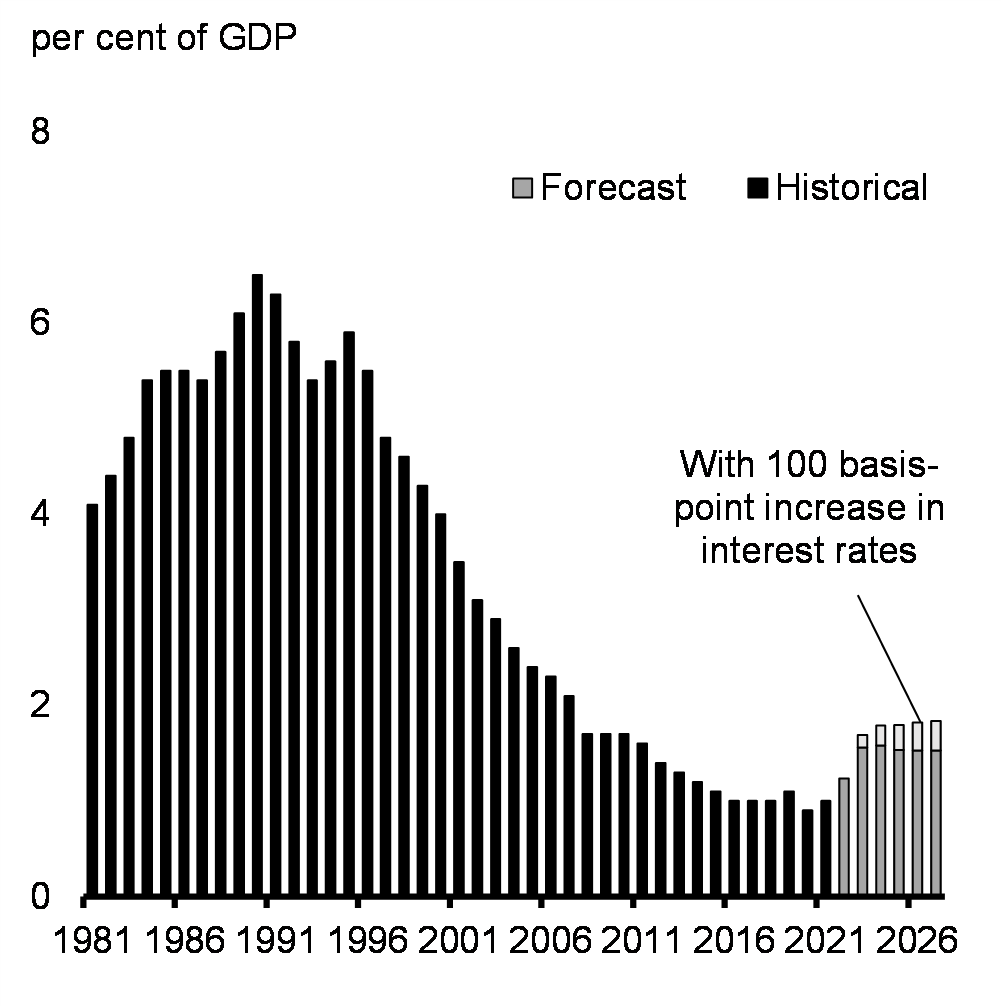
- Even with higher borrowing costs, public debt charges as a share of the economy are projected to remain at historically low levels (Chart 24). This would also be the case under even higher interest rates.
These indicators underscore the government's continued commitment to its fiscal anchor of reducing federal debt as a share of the economy over the medium-term, even as the government invests in Canadians.
Federal Debt
Public Debt Charges
Scenario Analysis
As discussed in section 2, while the latest developments in financial markets have raised the odds of a more pronounced slowdown, outcomes that are better or worse than the February survey of private sector economists are both plausible. To facilitate prudent economic and fiscal planning, and in light of elevated global uncertainty and recent developments in financial markets, the Department of Finance has developed two scenarios that consider faster or slower growth tracks relative to the February survey.
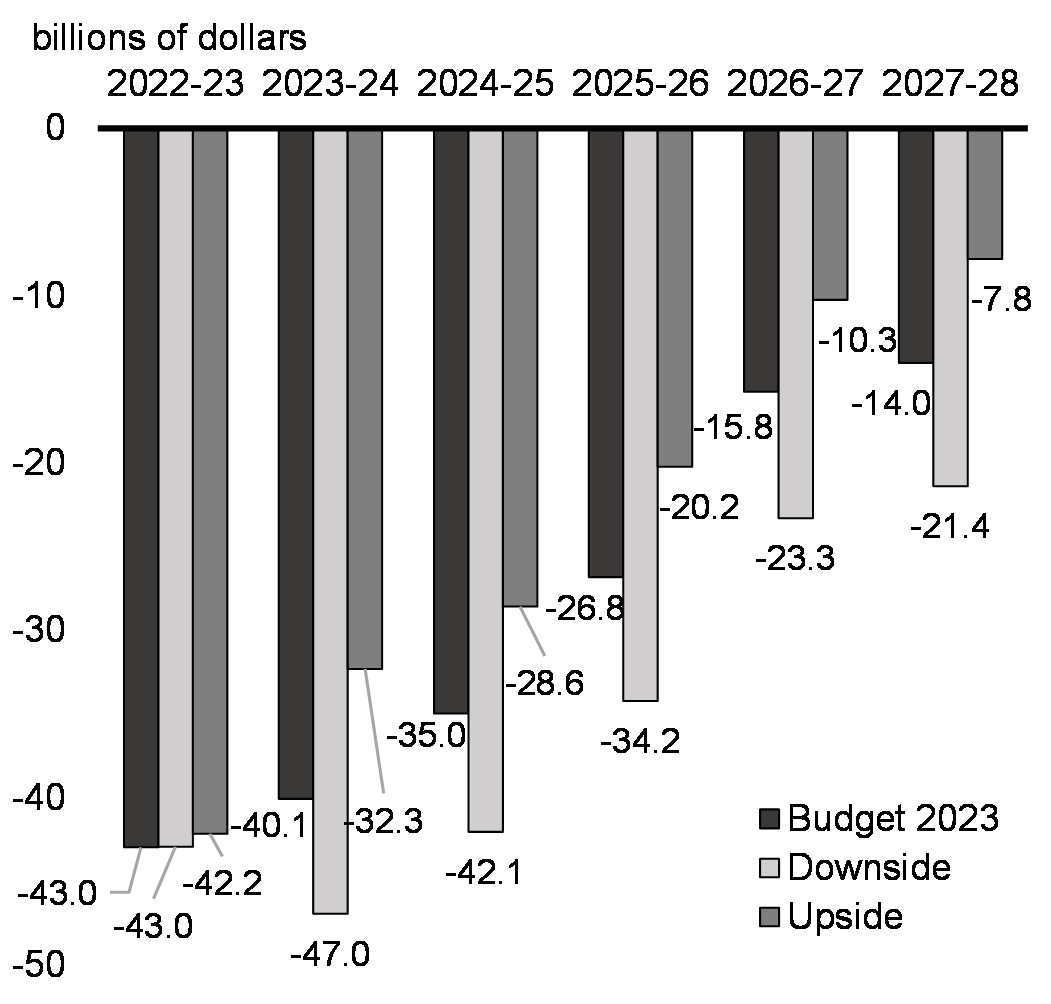
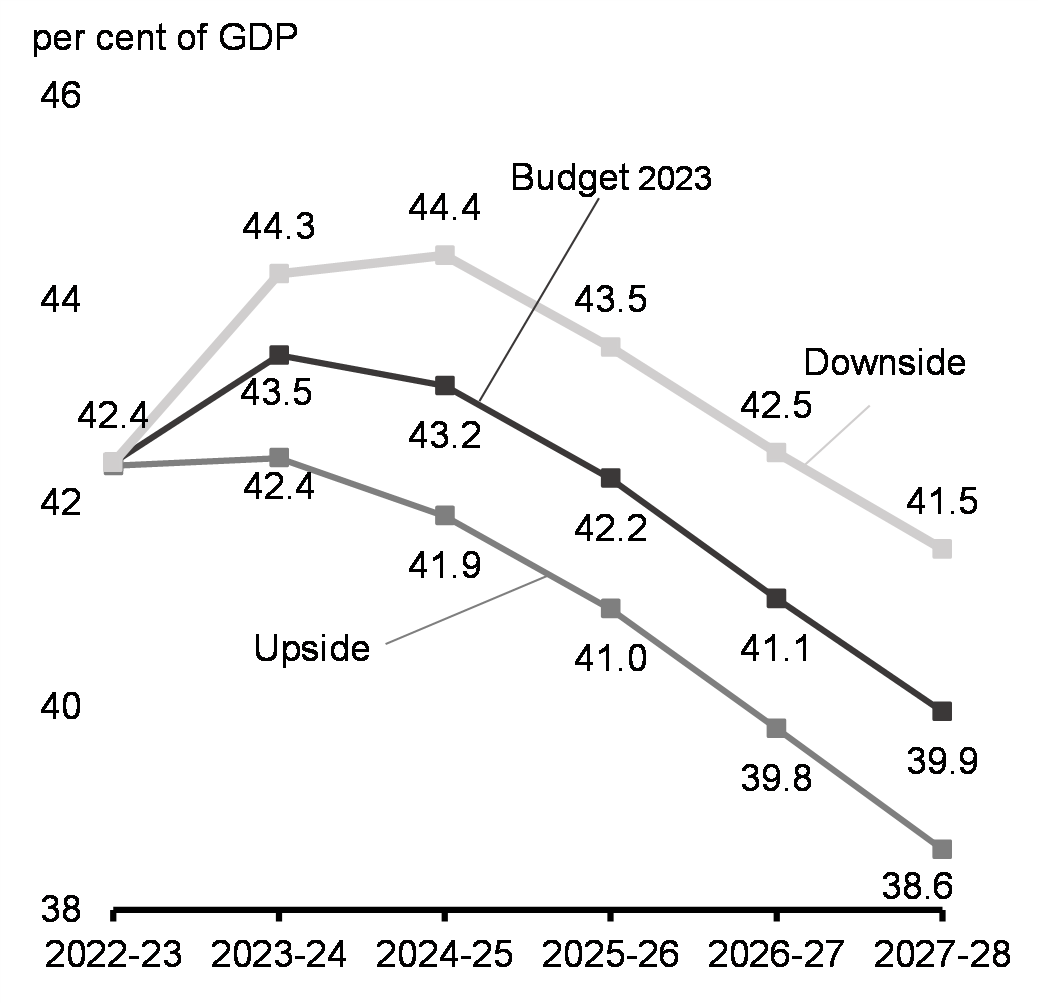
In the upside scenario, the budgetary balance would improve by an average of approximately $6.5 billion per year (Chart 25) and remove 1.3 percentage points from the federal debt-to-GDP ratio by 2027-28 (Chart 26).
In the downside scenario, the budgetary balance would deteriorate by an average of approximately $7.2 billion per year and add 1.6 percentage points to the federal debt-to-GDP ratio by 2027-28. That said, even under the downside scenario, the deficit would remain below 1 per cent of GDP by the end of the forecast horizon, and the federal debt-to-GDP ratio would still be lower in 2027-28 than it is today.
Details of the government's fiscal outlook and the fiscal impact of the scenarios can be found in Annex 1.
Federal Budgetary Balance under Economic Scenarios
Federal Debt-to-GDP under Economic Scenarios
International Comparisons
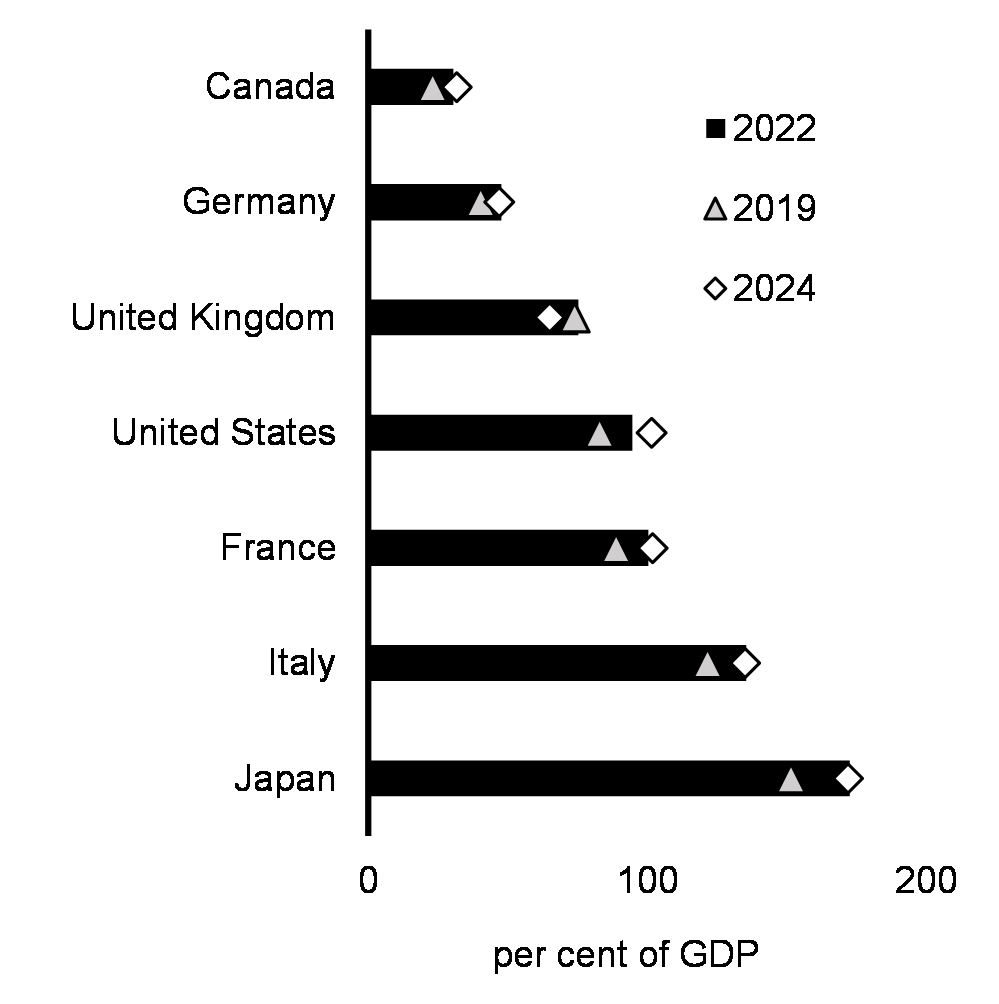
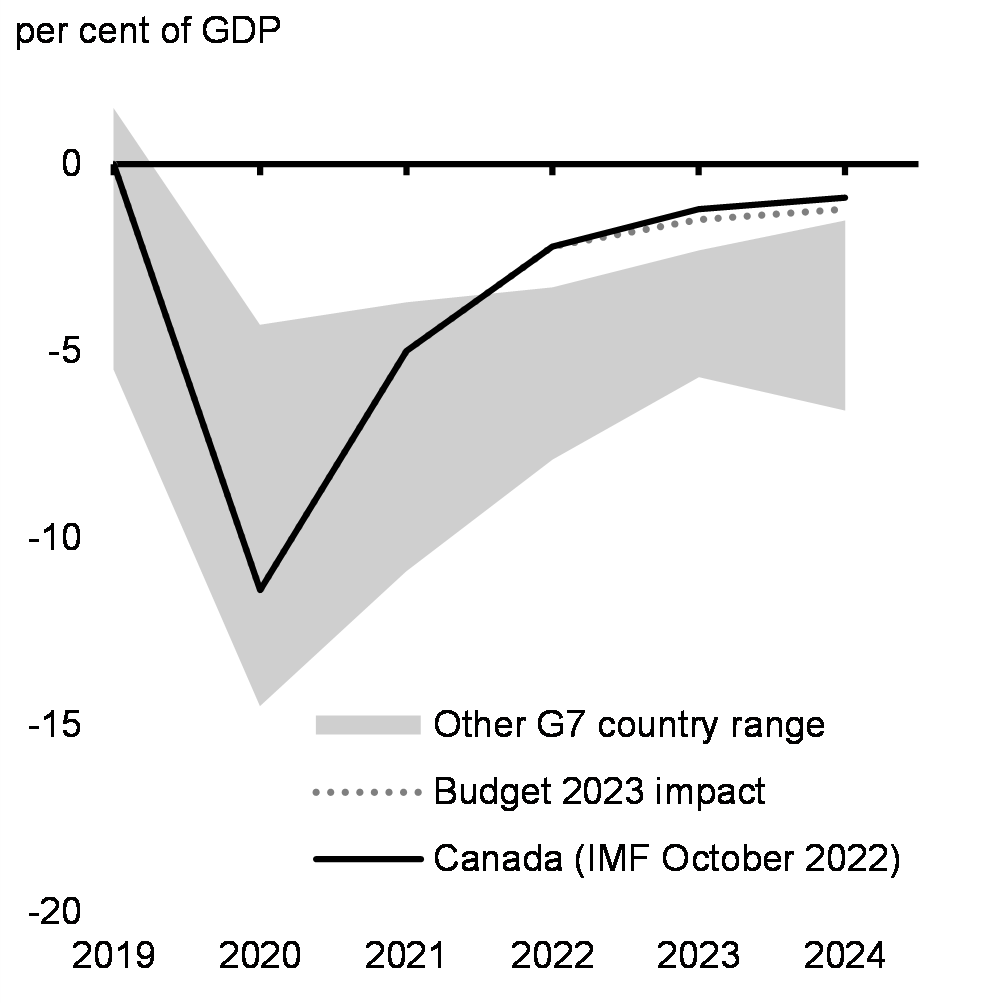
Including new measures in Budget 2023, Canada's net debt as a share of the economy is still lower today than in any other G7 country prior to the pandemic—an advantage that Canada is forecasted to maintain (Chart 27). Canada is also forecasted to post one of the largest improvements in its fiscal balance among G7 countries since the beginning of the COVID-19 pandemic, resulting in Canada having the smallest deficit in the G7, both this year and next (Chart 28).
Canada maintains a long tradition of responsible fiscal management along with several other strengths, such as sound macroeconomic policy frameworks, a large and diverse economy, and strong governing institutions which continue to shape Canada's excellent credit ratings from Moody's (Aaa), S&P (AAA), and Fitch (AA+). Canada is the third-largest economy in the world to have a AAA rating from at least two of the three major global credit rating agencies, together with only the United States and Germany.
Combined with the significant investments made since 2015 in the long-term capacity and resiliency of the Canadian economy, the additional investments in health care and Canada's clean economy presented in Budget 2023 can be expected to generate social and economic returns for decades, helping to bolster Canada's international economic and fiscal strengths, and maintain our enviable credit ratings.
General Government Net Debt Forecasts, G7 Countries
General Government Balance Forecasts, G7 Countries
Preserving Canada's Fiscal Advantage: Maintaining our Fiscal Anchor
The federal government's fiscal anchor—reducing the federal debt-to-GDP ratio over the medium term—remains unchanged and is being met.
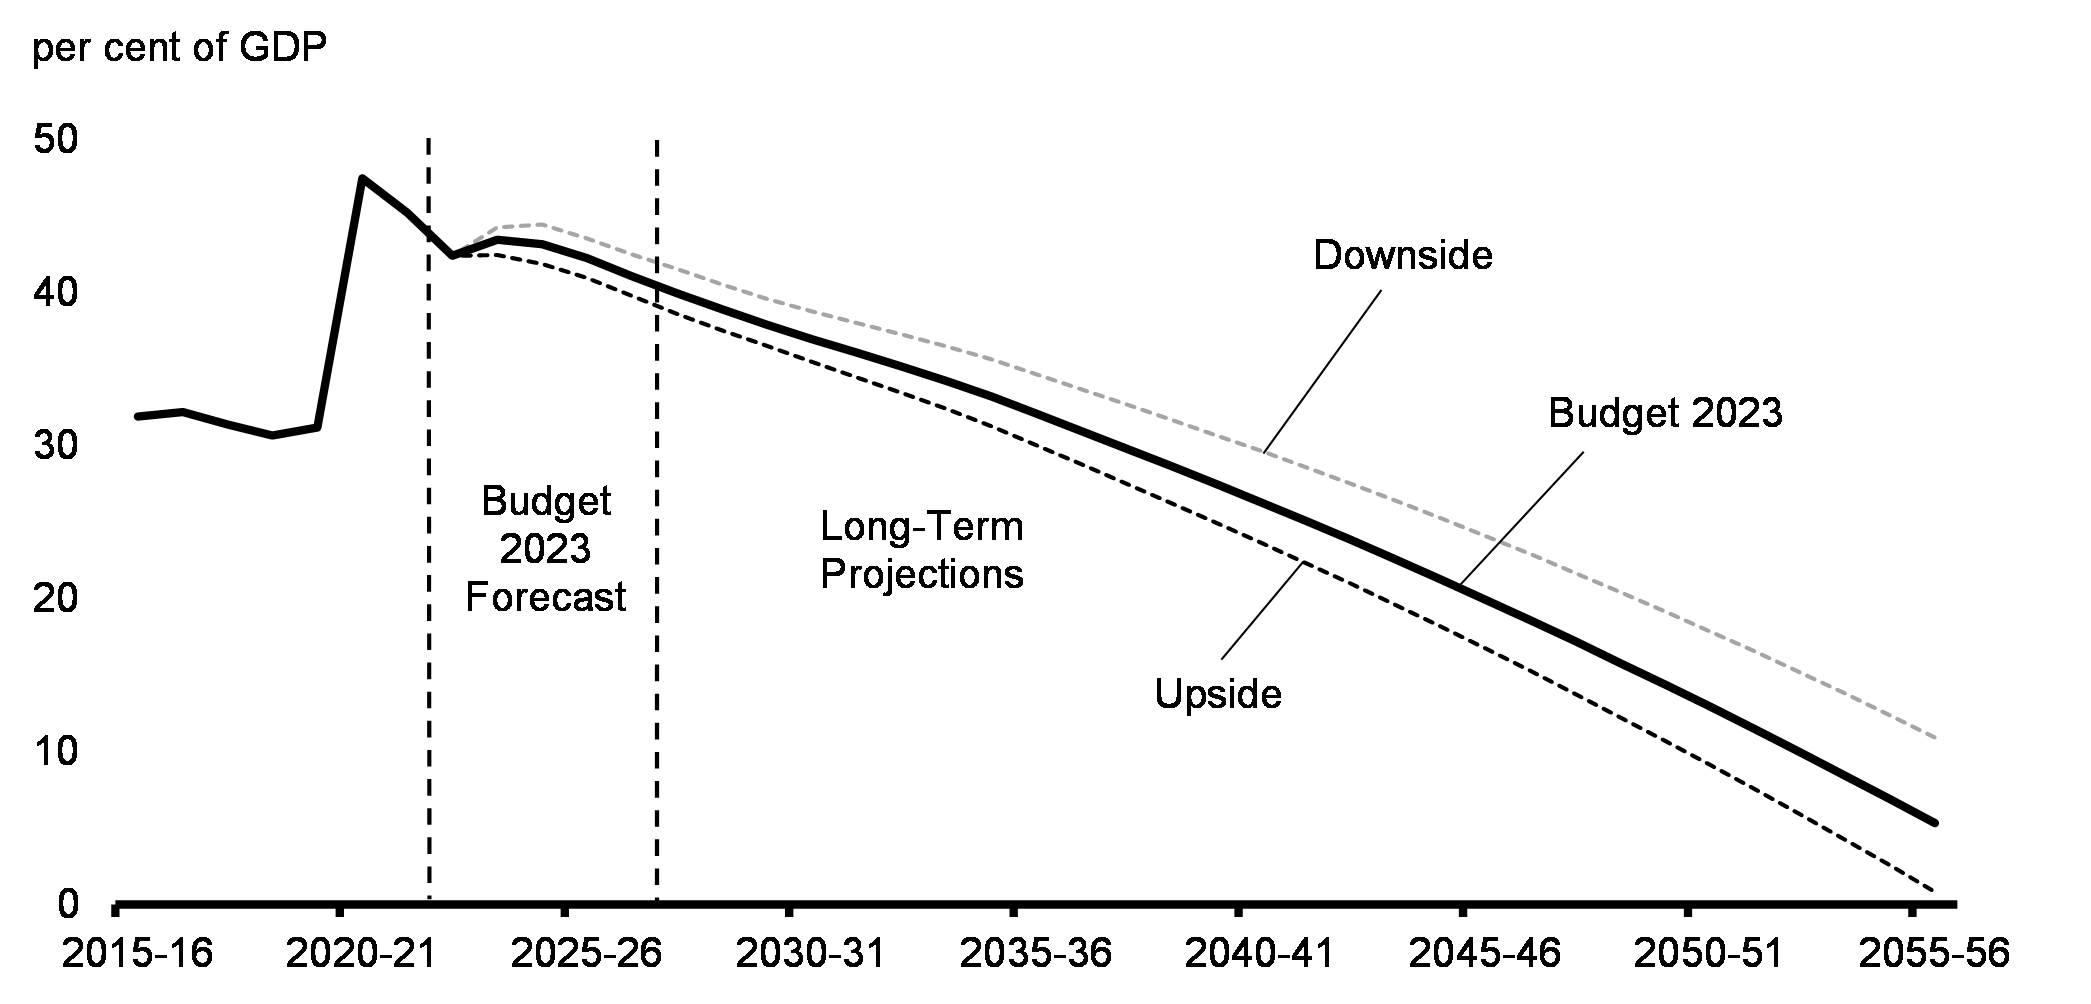
The Budget 2023 forecast shows the federal debt-to-GDP ratio declining in 2024-25 and throughout the remainder of the period. The government's spending plan is also projected to remain fiscally sustainable over the long term. Modelling scenarios based on a set of reasonable economic and demographic assumptions show the federal debt-to-GDP ratio continuing to decline over the entire long-term projection horizon ending in 2055-56 (Chart 29). This is despite adverse demographic trends, including an aging population, assumed modest future productivity growth rates and projected increases in borrowing costs.
While based on reasonable assumptions, these long-term projections should not be viewed as forecasts. Notably, these projections do not reflect all potential economic and fiscal impacts of the global economic evolutions that Canada will have to navigate over the coming decades, nor do they reflect positive impacts that can be expected to result from the foundational investments made by the government up to this budget. Details and sensitivity analysis around these long-term fiscal projections are presented in Annex 1.
Long-Term Projections of the Federal Debt
Page details
- Date modified: