
Archived - Overview:
Our Shared Economic and Social Foundations — Challenges and Opportunities Ahead
On this page:
Canada entered 2020 in the midst of a sustained period of economic expansion. More than a million jobs had been created since 2015, unemployment was at historically low rates, wages were on the rise, the labour market was broadening to include more Canadians traditionally under-represented, over 1.3 million Canadians had been lifted out of poverty including 400,000 children since 2015, businesses were reporting above-average profits, and Canada had a strong and growing middle class. Canada was the second fastest growing economy in the G7 with the enviable position of having the lowest debt-to-GDP ratio in the group.
In the early weeks of 2020, news of a novel coronavirus began to spread. By March a global pandemic was declared. Canada went into a widespread lockdown and the global economy was facing unprecedented uncertainty.
1. The Course of COVID-19 in Canada
An unprecedented global disruption
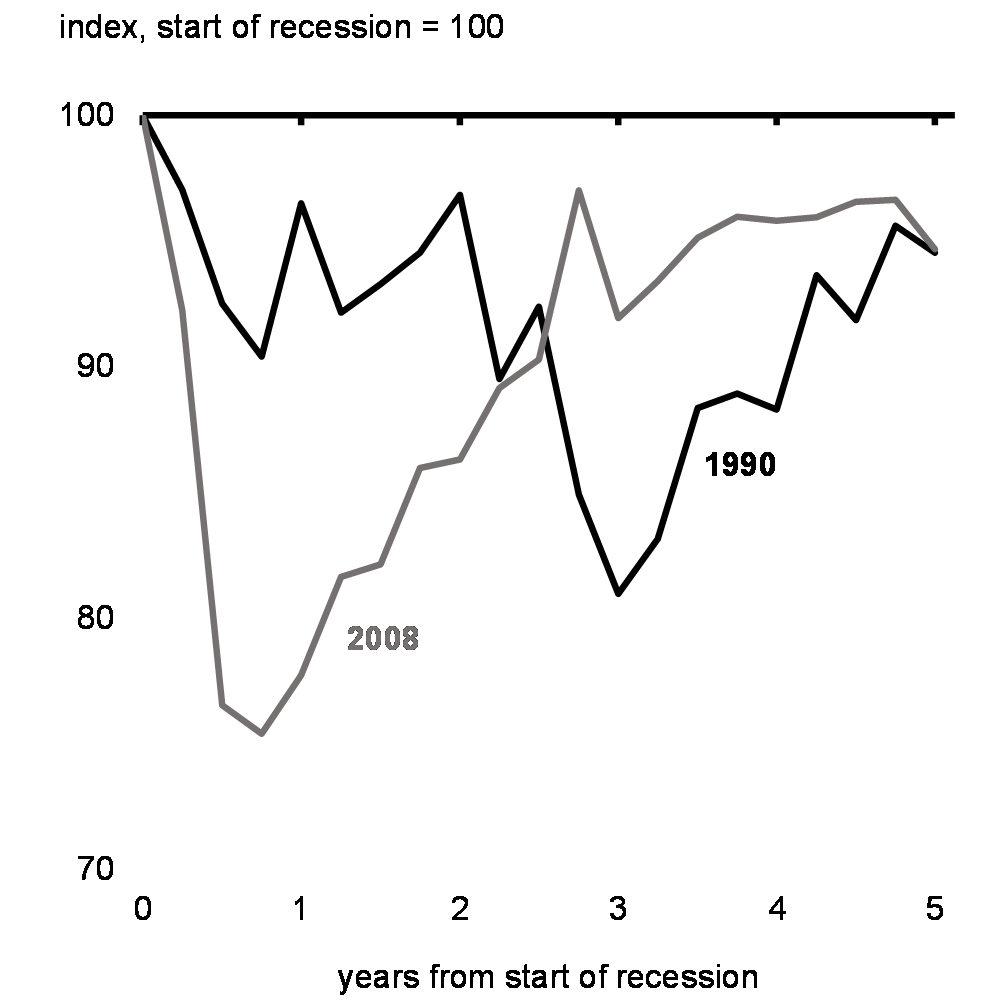
The COVID-19 pandemic brought about the deepest and fastest recession, worldwide, since the Great Depression (Chart 1). Here at home, real GDP fell by a record 13 per cent over the first half of 2020. Activity in Canada declined about three times as much as in the 2008-09 recession, in a much shorter time.
The crisis had an unprecedented impact on the Canadian labour market, with more than 3 million Canadians losing their jobs and another 2.5 million Canadians working significantly reduced hours—representing about 30 per cent of the pre-pandemic workforce. By the end of April, the employment rate for Canadians aged 15 to 64 fell from record highs to record lows (Chart 2). The pandemic had its worst impacts on many of the most vulnerable people in Canada—primarily low-wage workers, young people, racialized workers, and women. On the disproportionate effects on women in particular, this has led to what many experts call a “She-cession.”
Chart 1
Annual Real GDP Growth
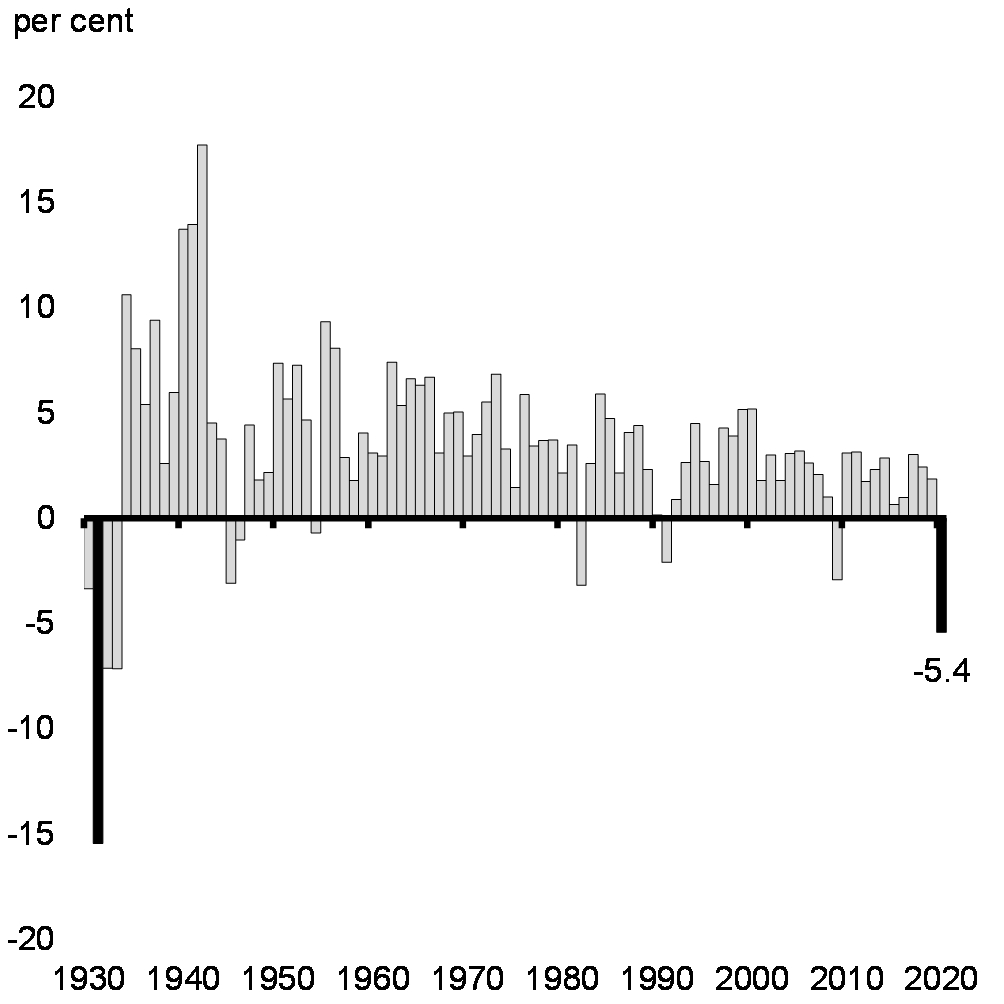
Chart 2
Share of Canadians Age 15-64 Employed

The recovery path has been uneven over the fall and winter
Following the first wave of infections, economic activity and employment rebounded at a faster pace than expected over the summer of 2020 as restrictions eased, businesses reopened, and Canadians adapted. The Canadian economy saw a bounce-back in real GDP at over 40 per cent (annualized) in the third quarter, and over three-quarters of the 3 million jobs lost at the peak of the pandemic were recovered by the end of September.
Nevertheless, the recovery shifted into a slower gear in the fall and remaining gains were harder fought, with virus risks still hindering tourism, indoor dining, and activities involving large gatherings (Chart 3). Restrictions on these activities intensified over recent months as virus cases surged and hospitalizations surpassed their earlier peaks. This made for highly uneven impacts across sectors, with layoffs concentrated once again in contact-sensitive businesses with a larger share of part-time workers like retail, hotels, entertainment, and restaurants, while many other industries were virtually unaffected (Chart 4). Many small businesses in these sectors continue to face acute challenges.
Real GDP Change in Key Sectors since February 2020

Employment Change by Employment Status since February 2020

Canada’s economic performance has exceeded expectations
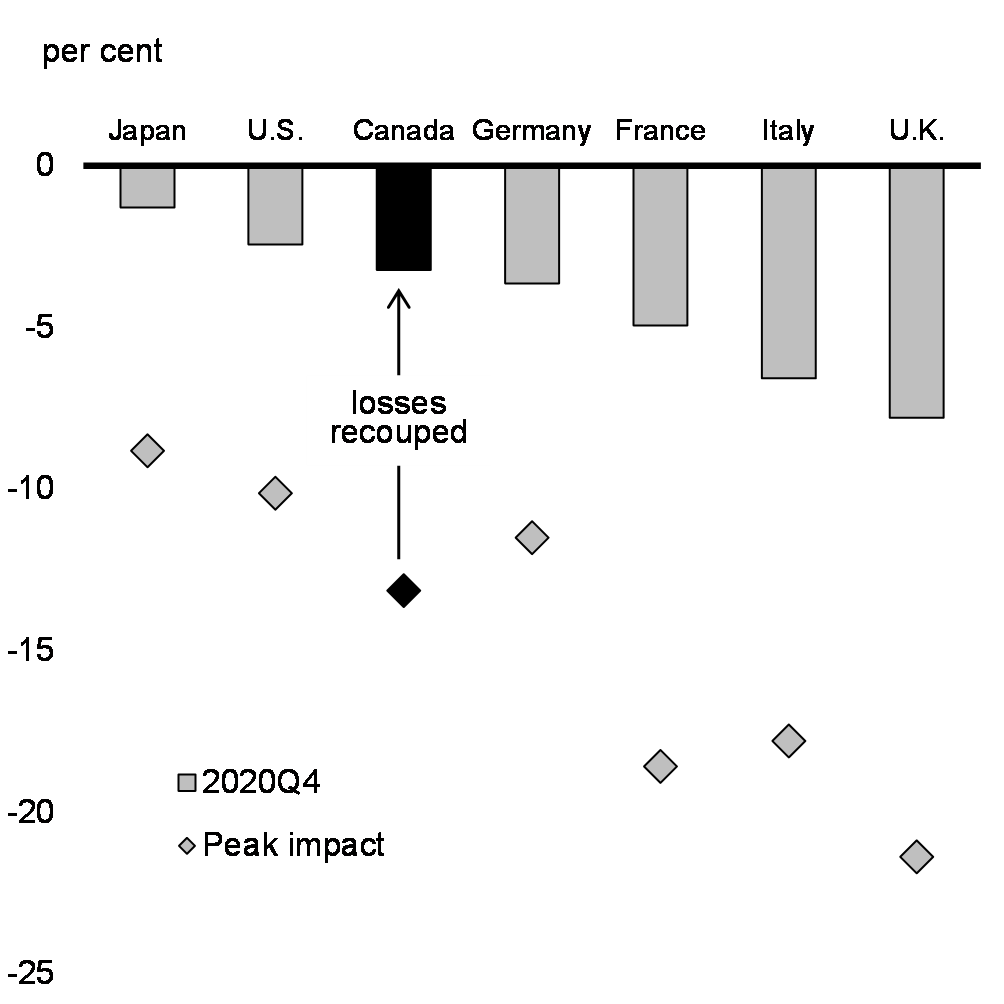
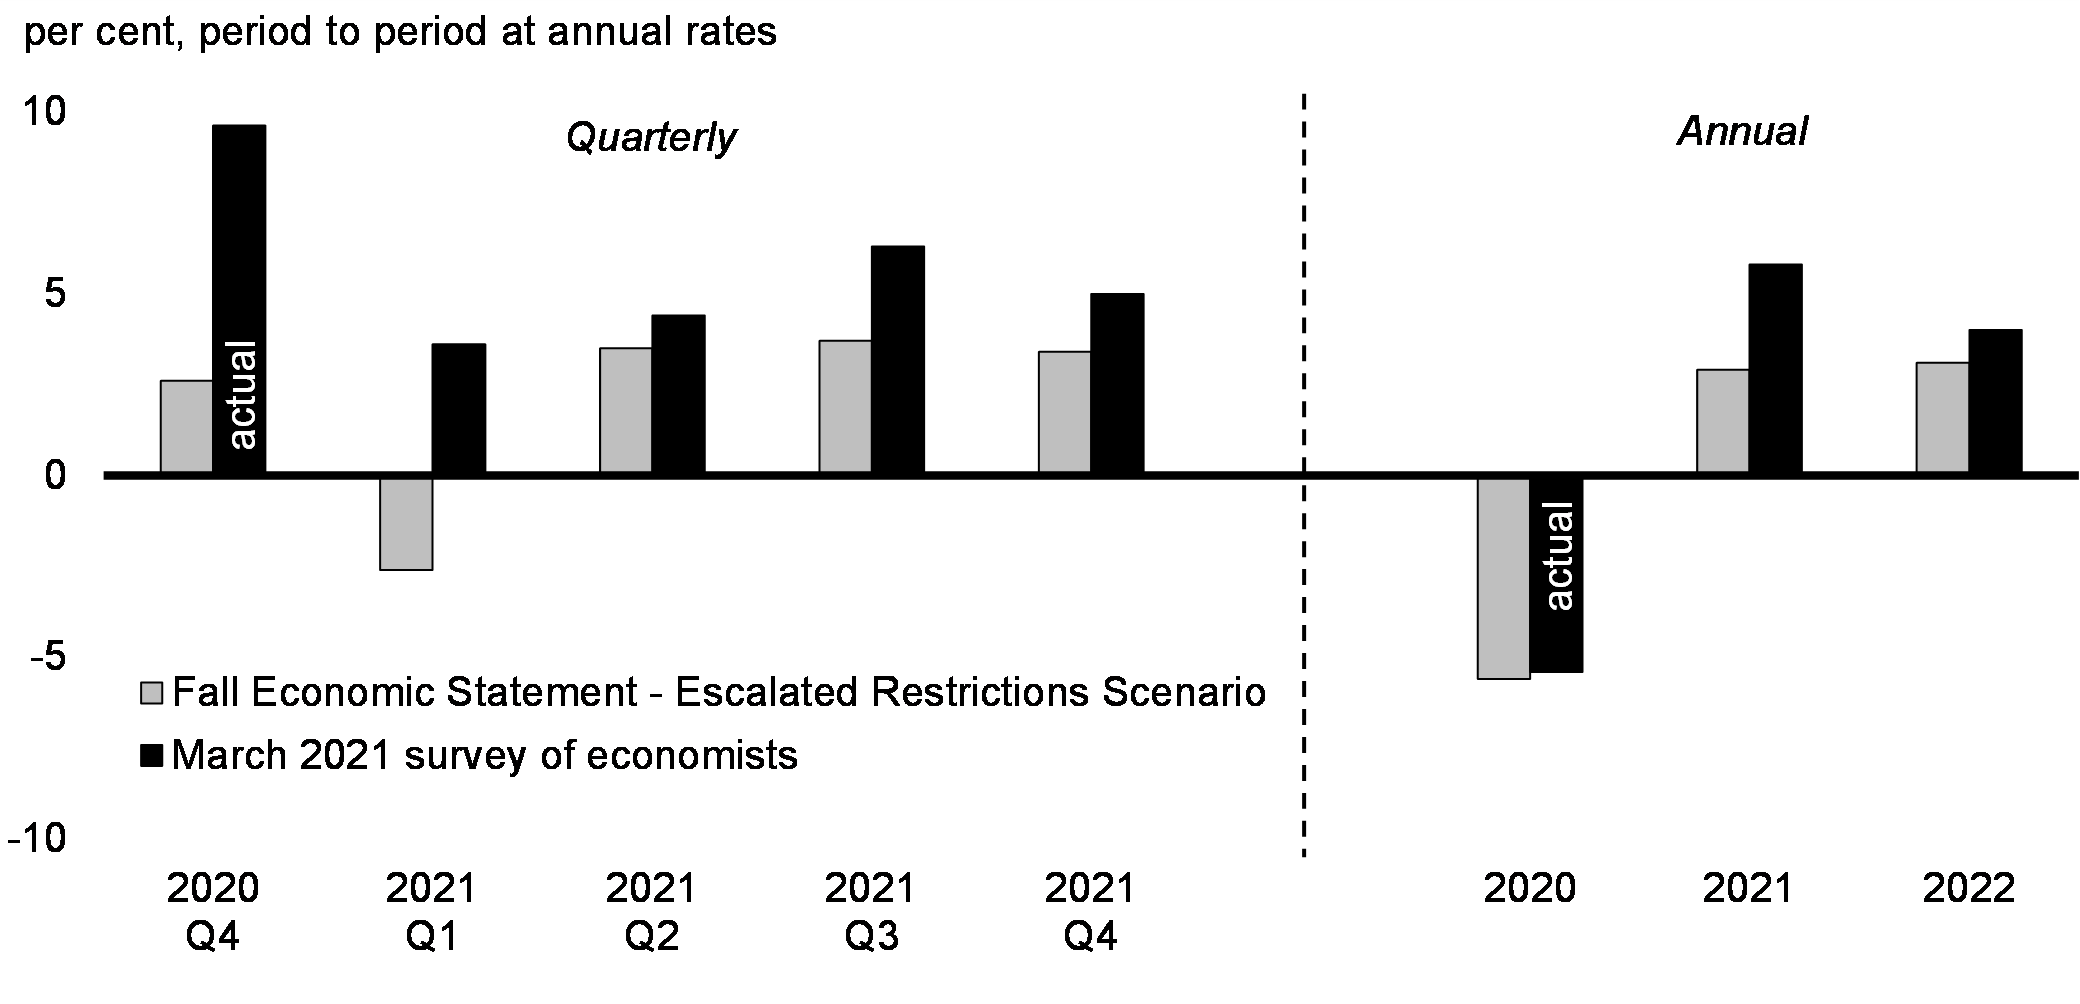
Economic activity during the second wave has proved more resilient than during the initial wave, showing that Canadians and businesses have adapted to operating under restrictions. While some peers saw contractions amid the second wave (Chart 5), Canada closed out 2020 far ahead of forecasters’ mid-2020 predictions (Chart 6).
Early indications suggest that this momentum has carried over to the beginning of the year. Forecasts point to real GDP increasing for the third quarter in a row, in stark contrast to expectations for second wave impacts set out in the Fall Economic Statement.
Real GDP Growth, Fourth Quarter of 2020

Canadian Real GDP Change since 2019Q4

Canada’s COVID-19 Economic Response has bridged Canadians through the crisis
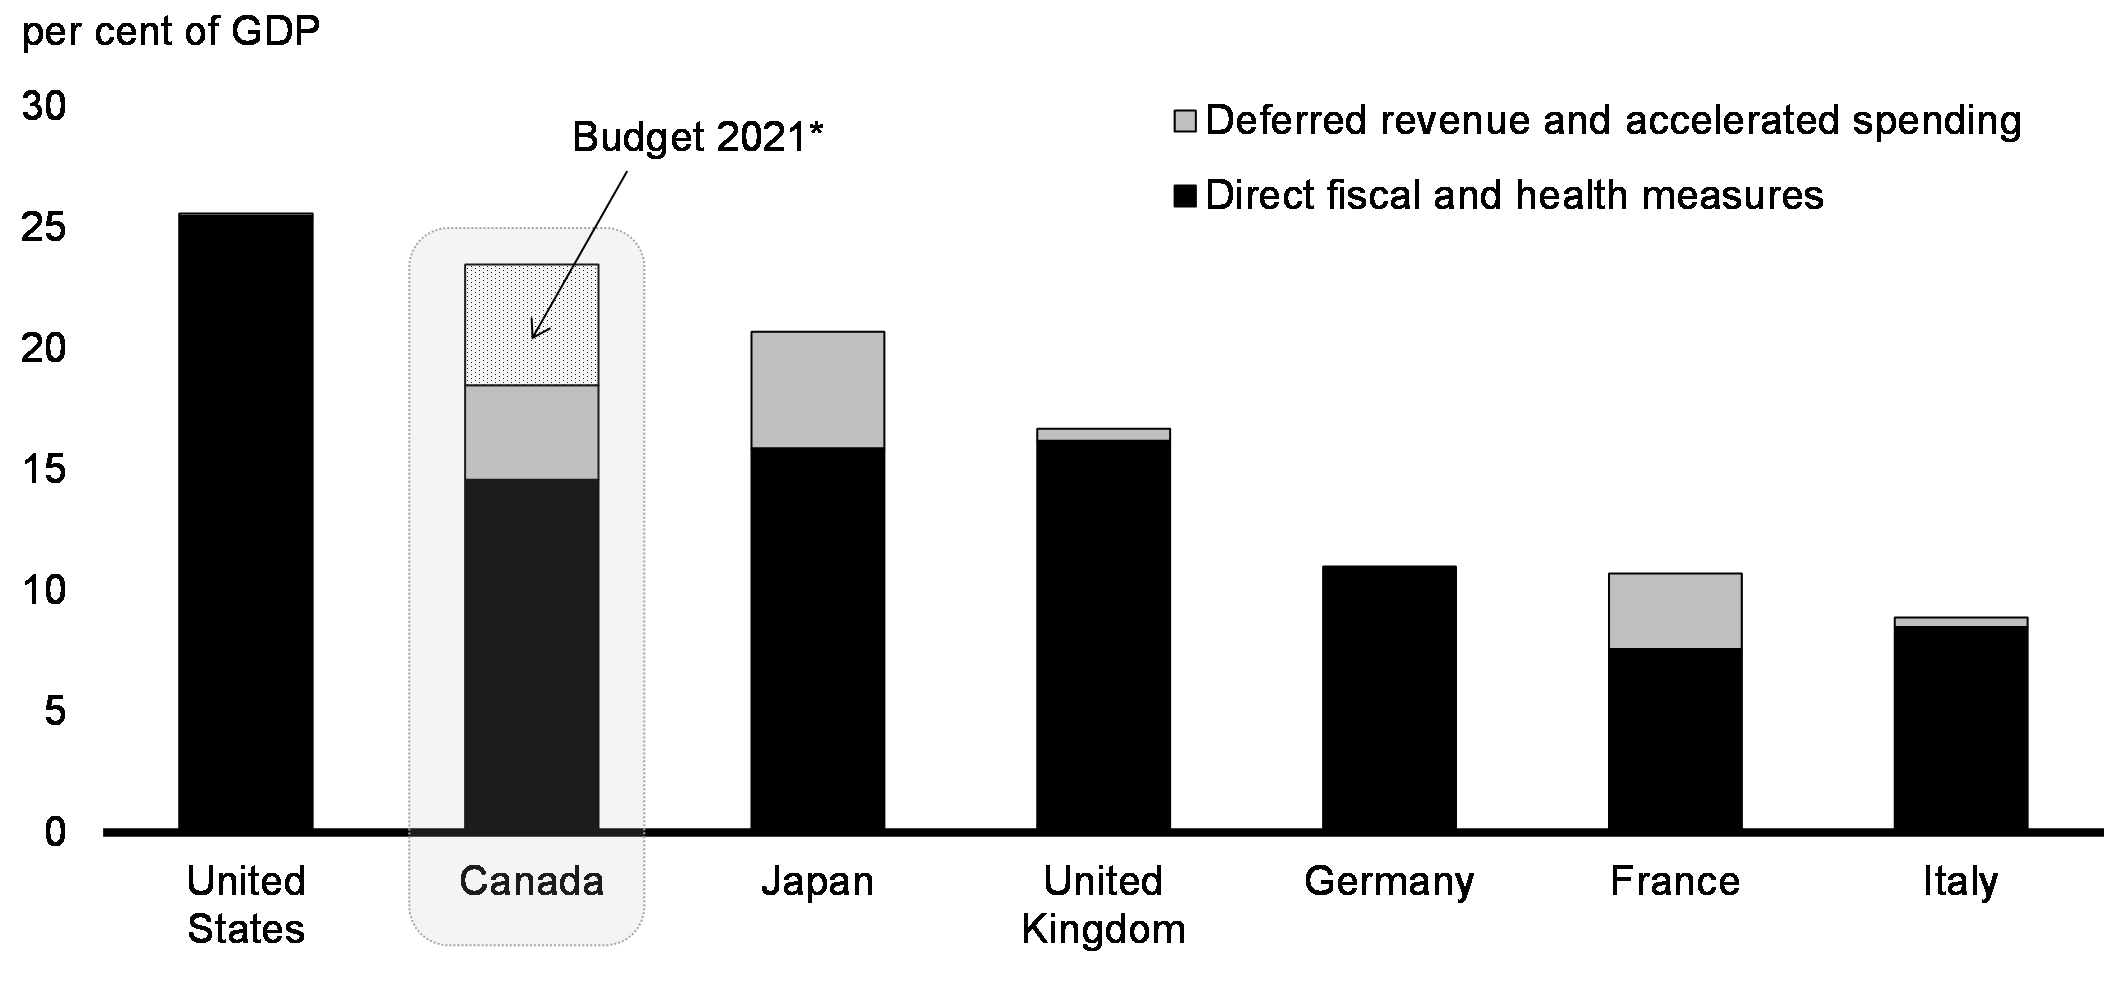
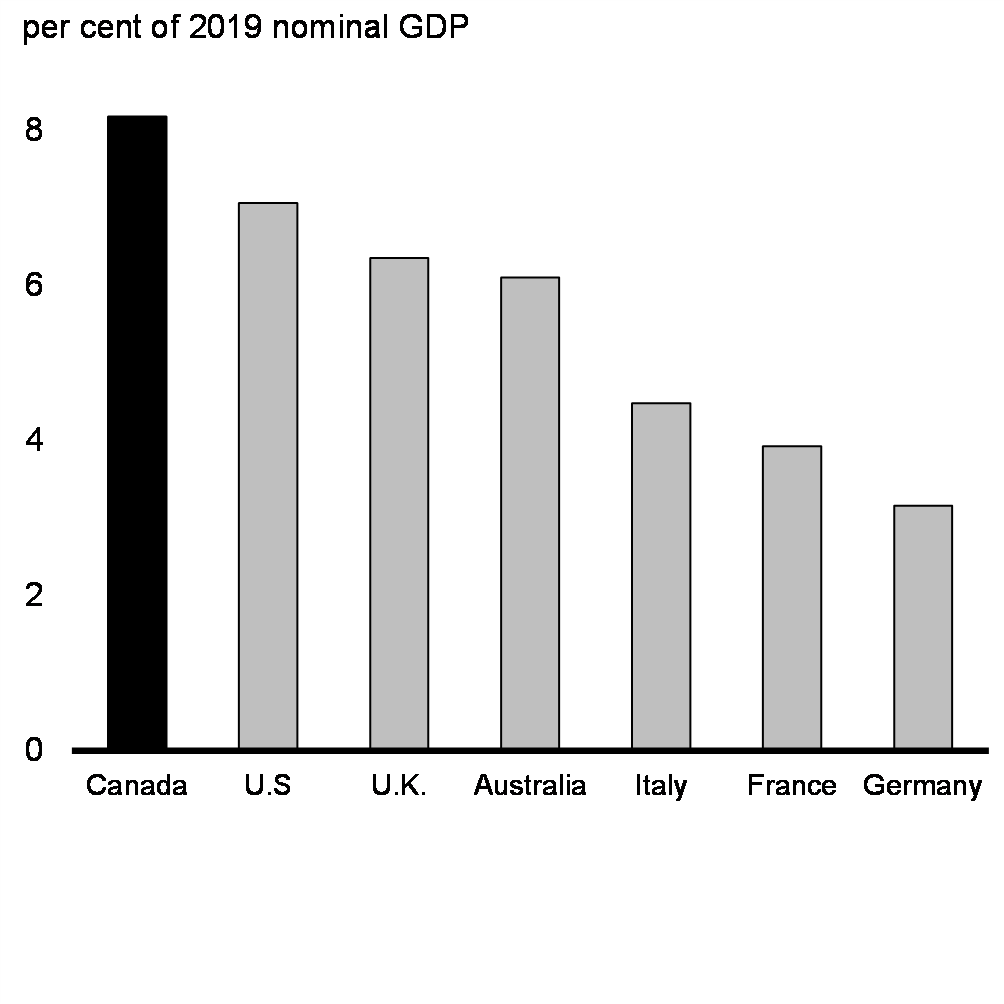
Canada’s COVID-19 economic response — including job protections through the Canada Emergency Wage Subsidy, liquidity support through programs like the Canada Emergency Business Account, and income support through the Canada Emergency Response Benefit and the suite of Recovery Benefits — has been key in bridging Canadians and businesses through the COVID-19 shock waves and stabilized the economy. With fiscal policy support exceeding 23 per cent of GDP, Canada’s response including Budget 2021 investments has been one of the largest and fastest among G7 countries (Chart 7).
Significant Fiscal Policy Support Announced across G7 Countries
Overall, Canada’s comprehensive and flexible response plan has helped engineer a near-term economic turnaround at a faster-than-anticipated pace compared with some peers (Charts 8 and 9).
Real GDP Change from 2019Q4
Total Hours Worked by Country

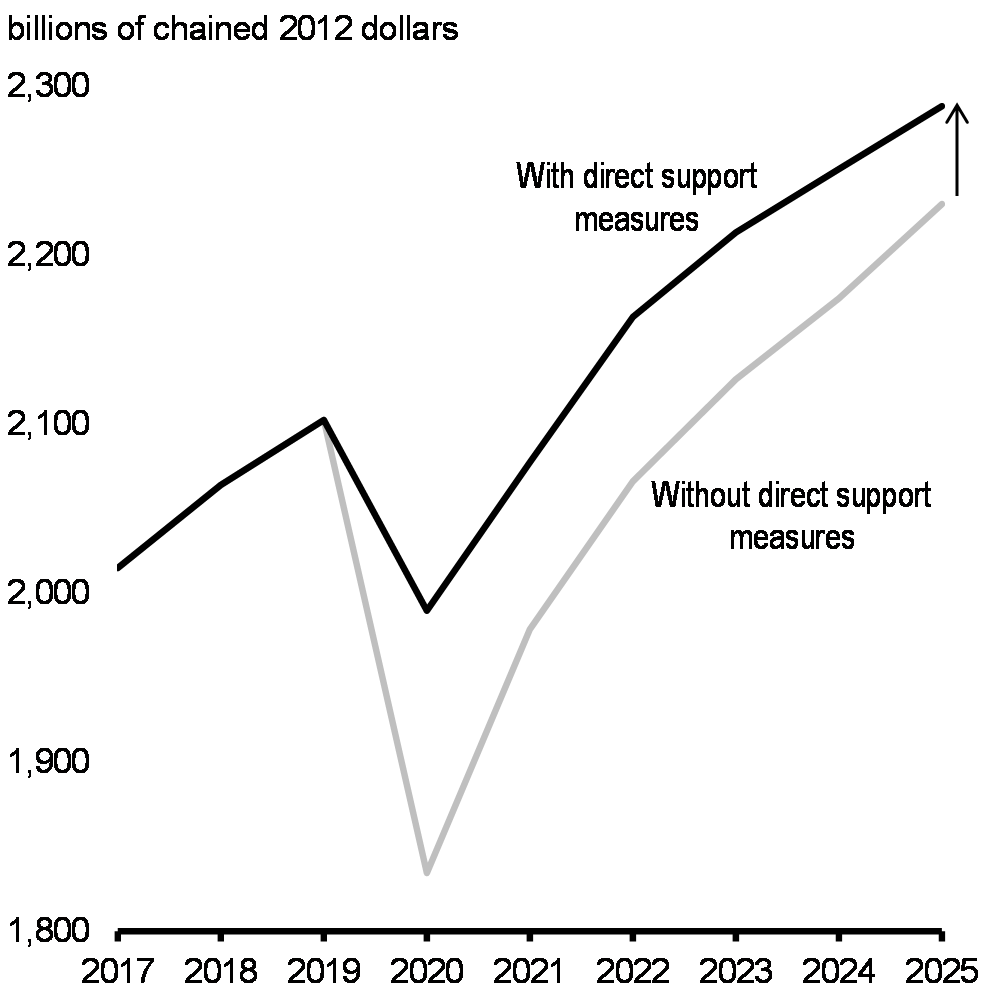
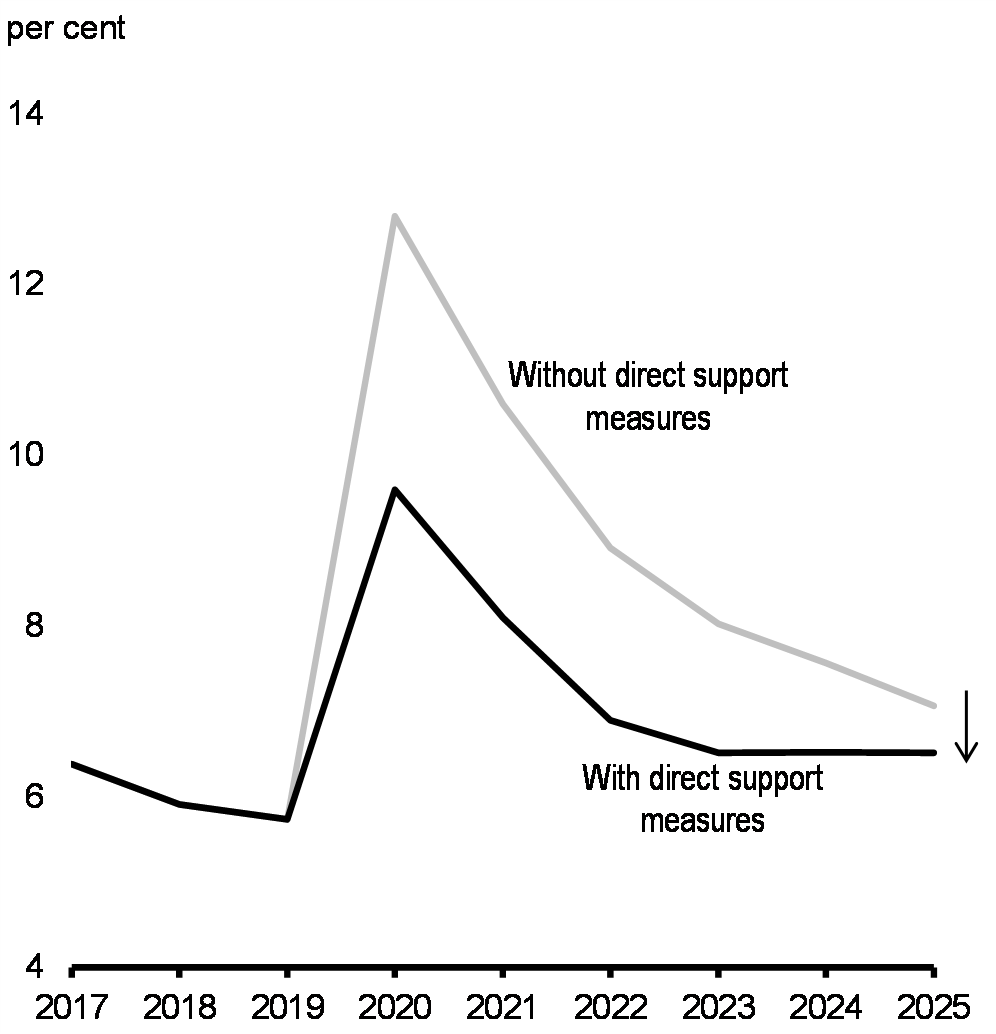
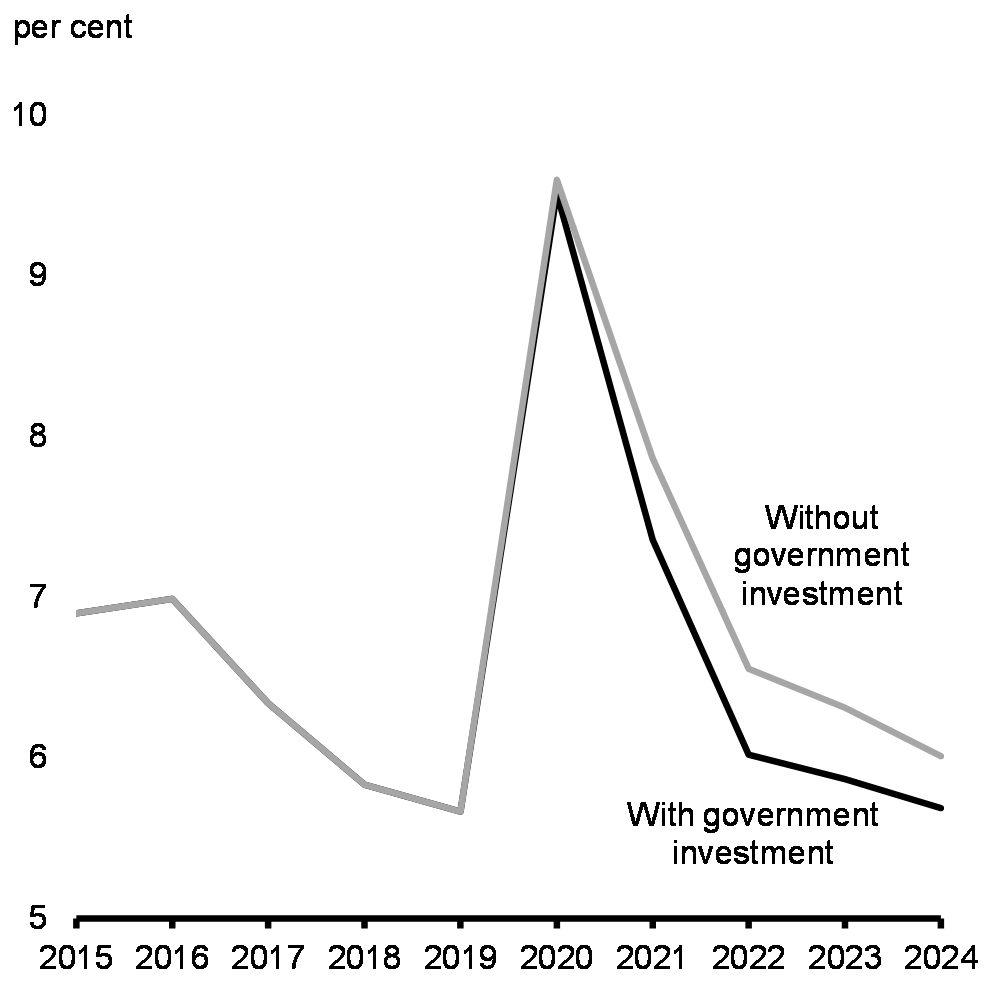
A recent IMF analysis indicates that without direct support measures, Canada’s real GDP would have declined by about 13.2 per cent in 2020 (versus an actual decline of 5.4 per cent), a difference of about 8 percentage points (Chart 10). Further, in its scenario without support measures, the IMF estimates that the unemployment rate would have risen by an additional 3.2 percentage points in 2020 (Chart 11).
Real GDP
Unemployment Rate
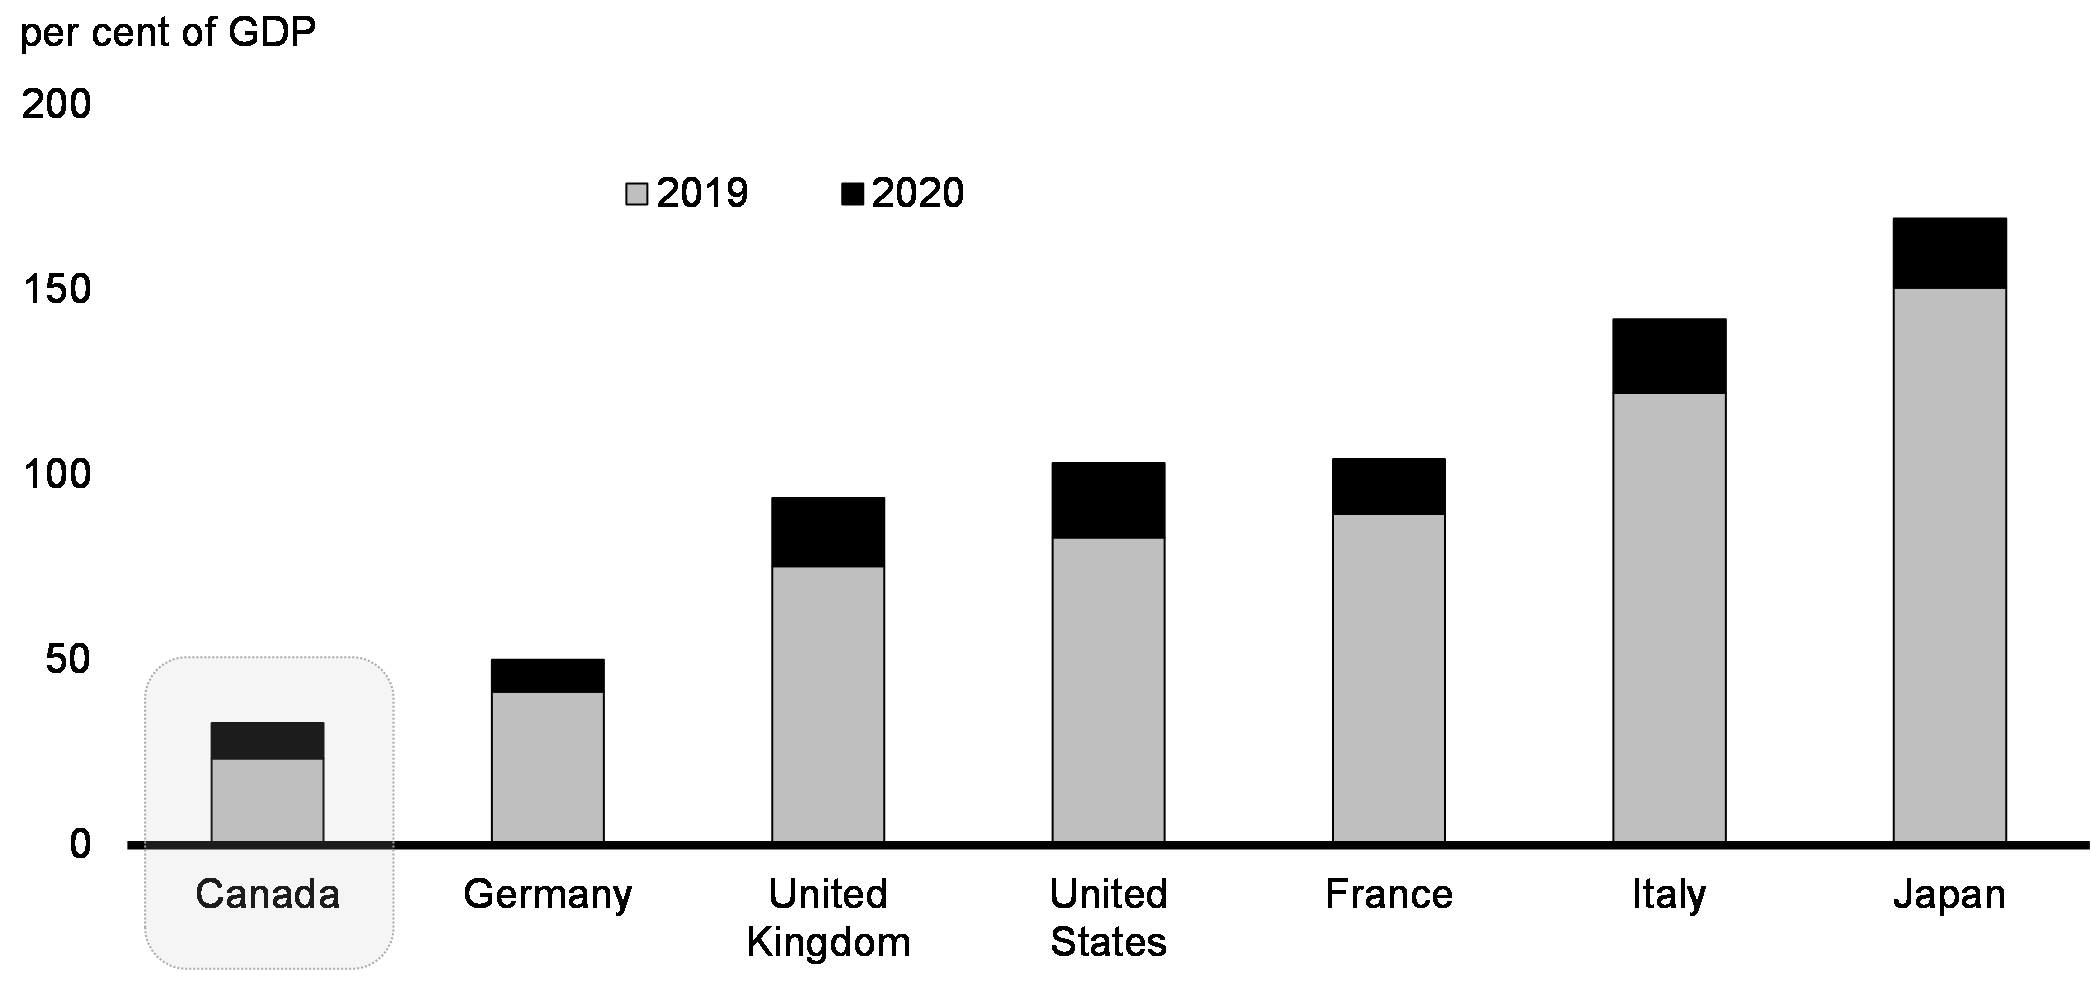
While the fiscal costs have been steep, the impact on the government’s fiscal position would have still been severe if the government had done less. The IMF analysis suggests that, absent direct support measures, the gross debt-to-GDP ratio would not have been significantly smaller than the IMF’s baseline projection (Chart 12).
General Government Gross Debt
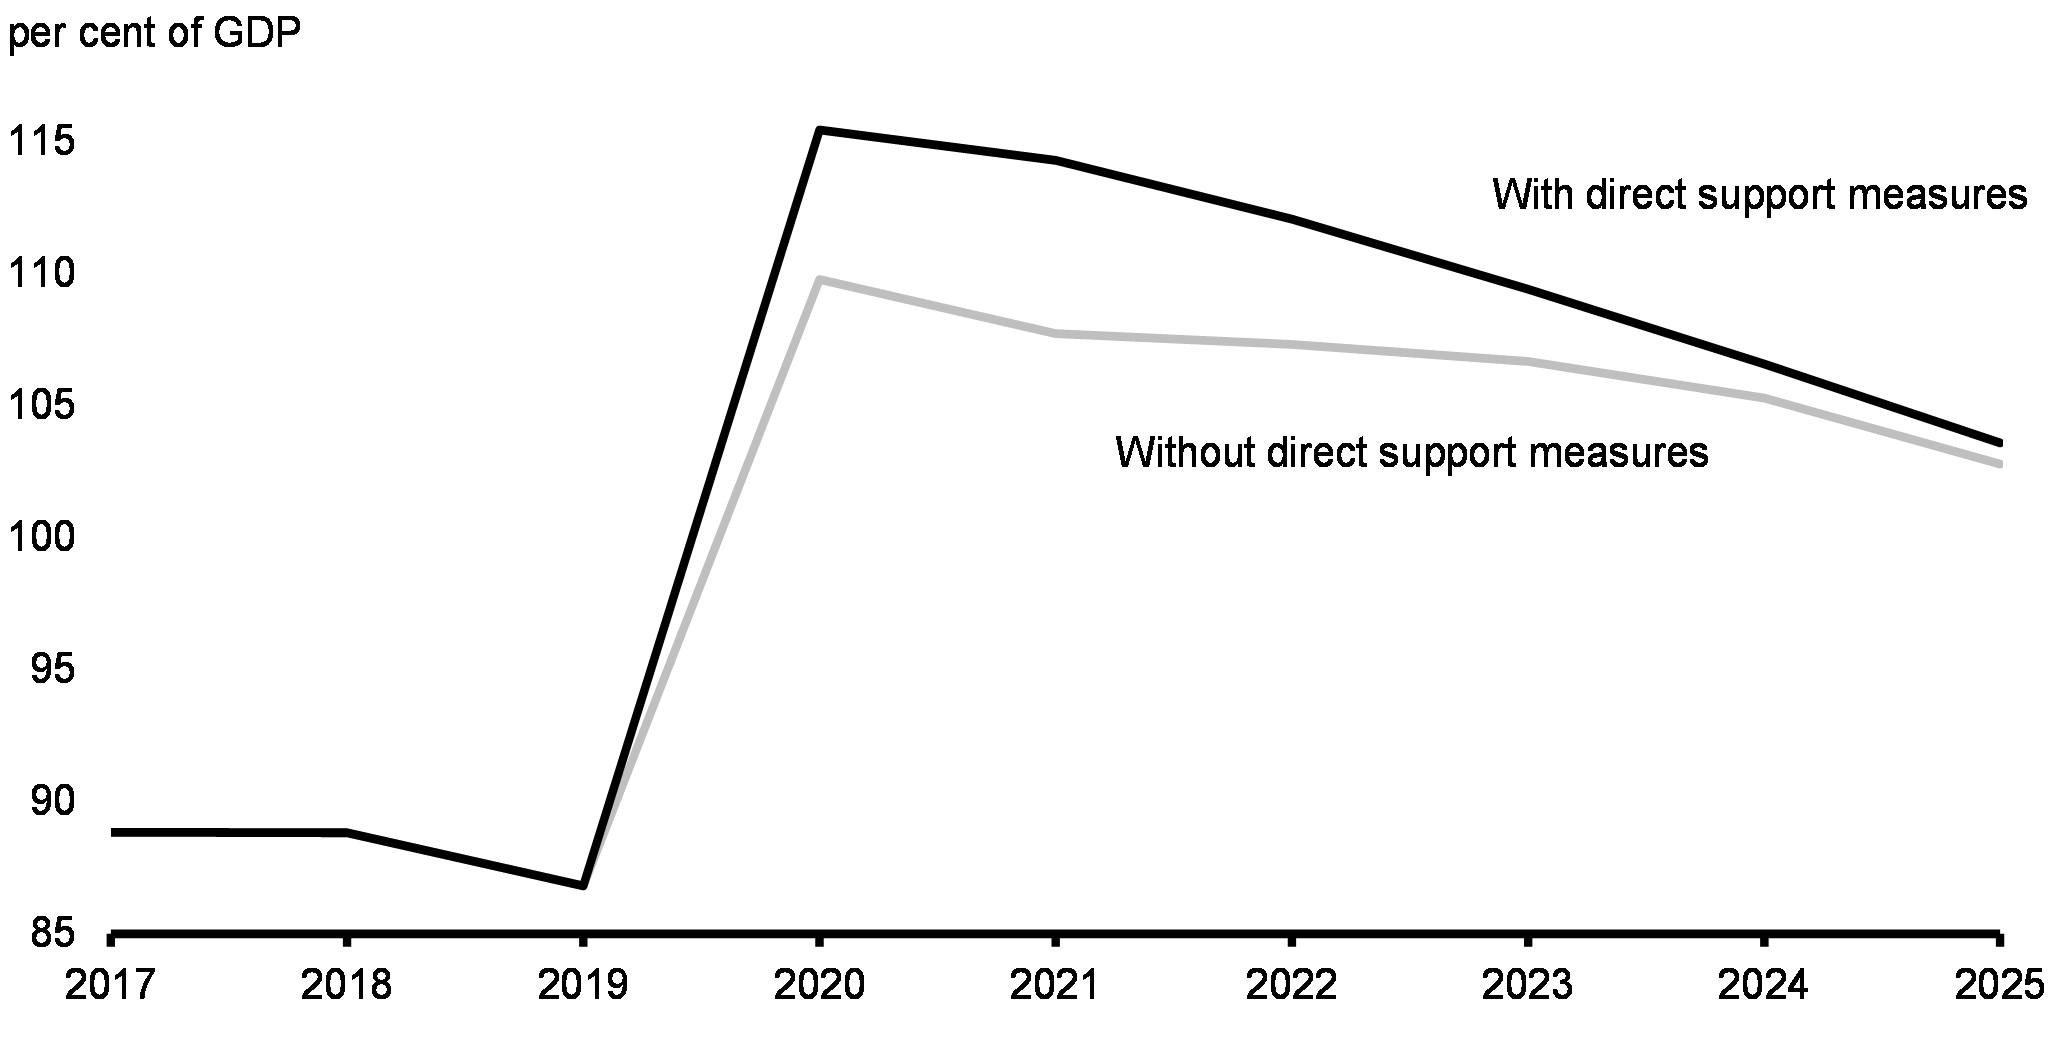
What this means is that a failure to provide support to Canadians and businesses would have resulted in almost as large a debt burden, greater human misery, and greater long-term economic scarring.
…Decisive actions and unprecedented fiscal support helped to avert an even sharper fall in output. While the fiscal deficit and public debt have increased sharply, sizeable fiscal support was necessary to help avert larger economic and social losses…
Jobs recovery continues to progress at an uneven pace for many Canadians
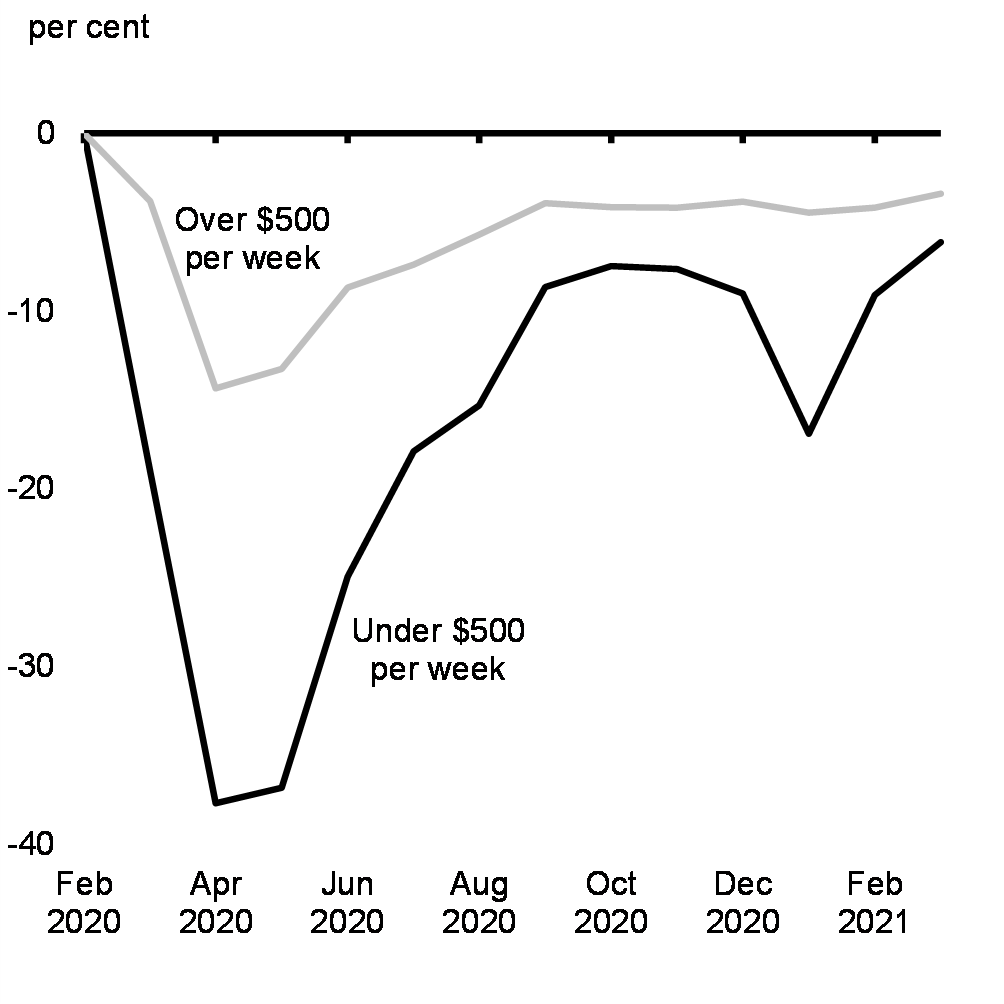
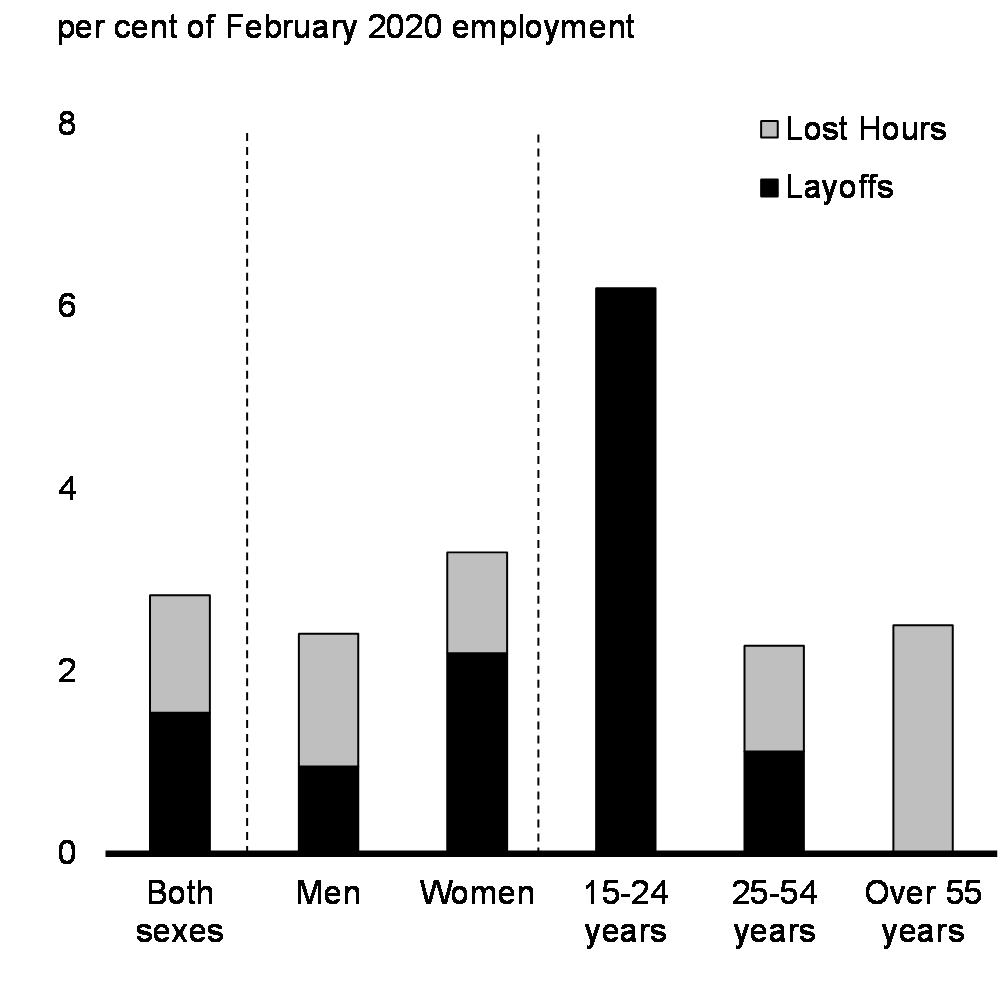
The re-tightening of restrictions has an outsized impact on employment and exacerbated an already-difficult labour market for many Canadians. Workers in close-contact sectors once again bore the brunt of second-wave impacts. Youth, women, and older Canadians, as well as low-wage workers were disproportionally likely to be laid off or to have their hours worked sharply reduced (Charts 13 and 14). Early in the crisis, women’s labour market outcomes deteriorated more than men’s, unlike most previous downturns, with larger rises in unemployment rates and declines in labour force participation.
These uneven impacts across demographic groups — which reflected a combination of women working in affected sectors and taking on unpaid care work when schools or child care centres closed – diminished somewhat as we emerged from the second wave. The risk is exacerbated amidst the latest wave, highlighting the importance of sustained growth for these groups to recover.
Change in Employment by Weekly Earnings since February 2020
Workers Affected by COVID-19 by Age and Sex, March 2021
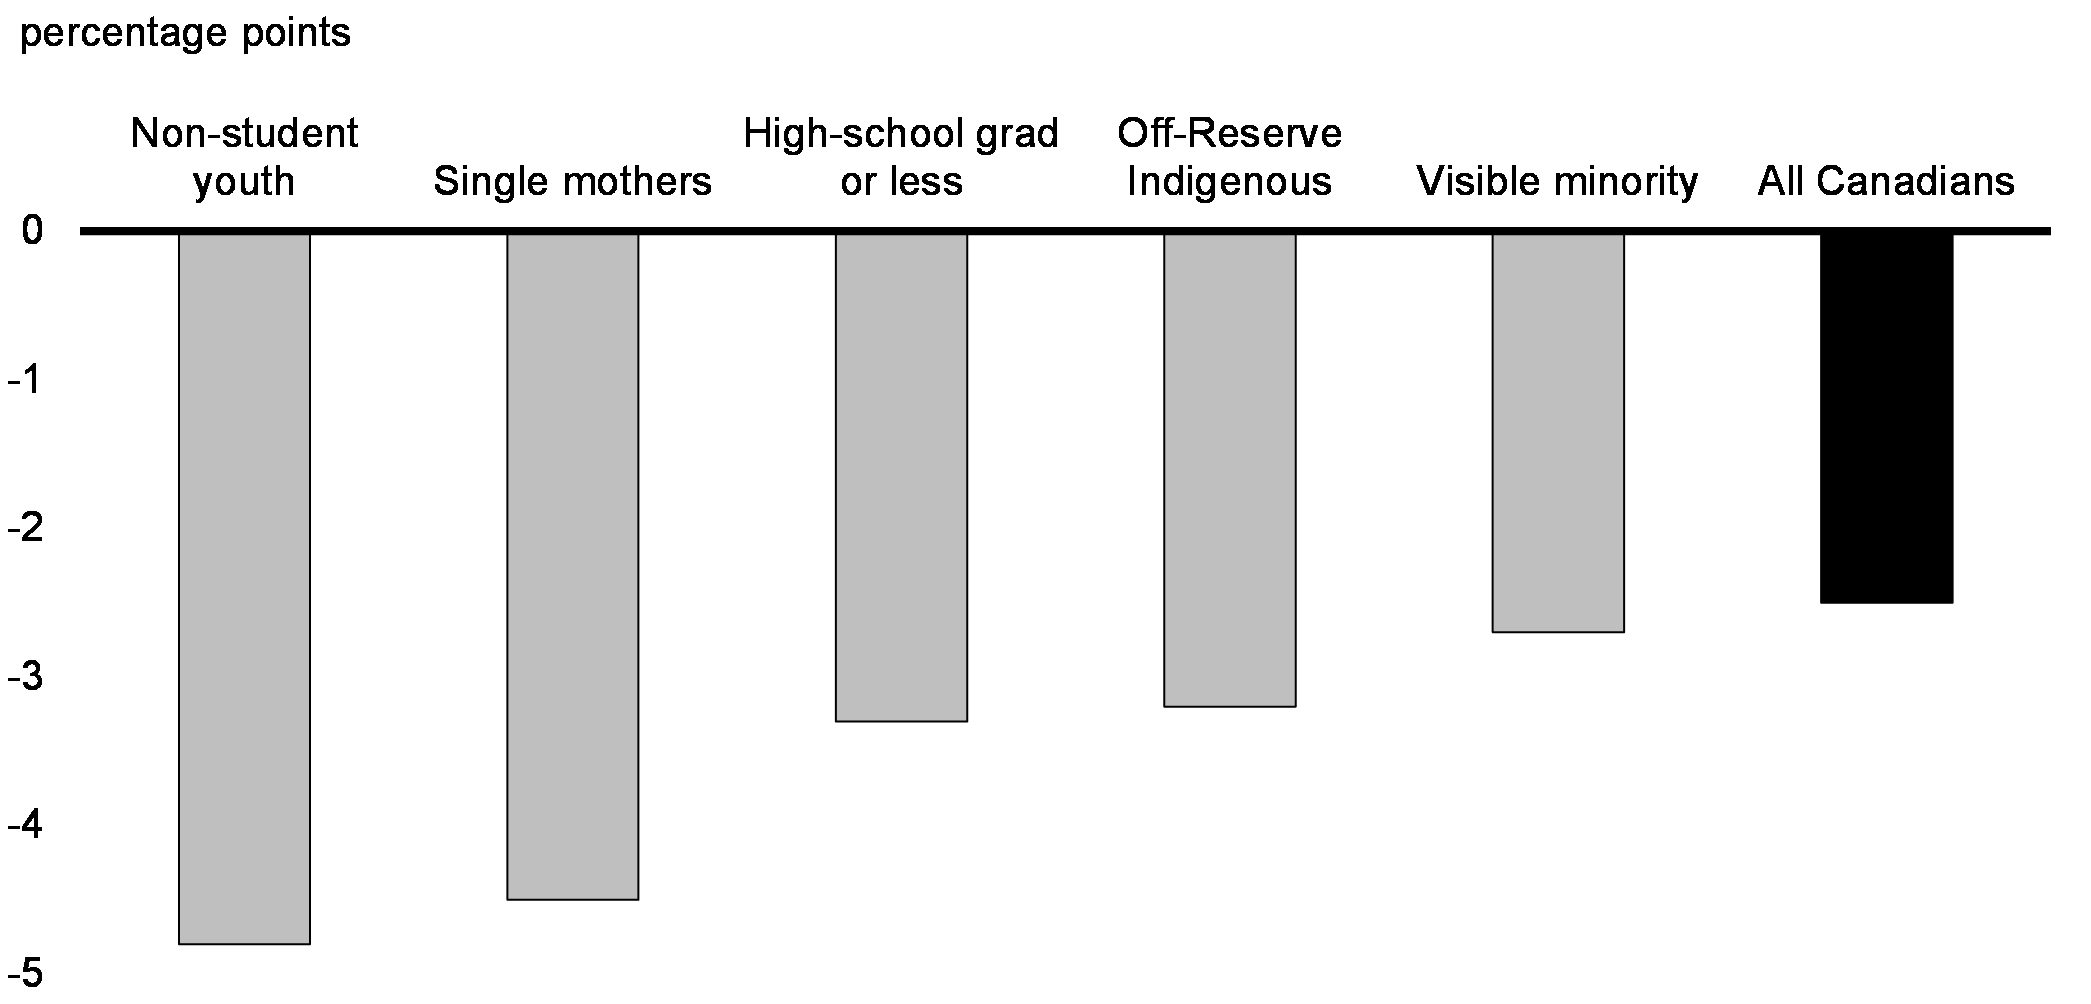
Many vulnerable people remain much more deeply affected than the average worker. Employment rates of single mothers, less educated Canadians, Indigenous peoples, and racialized Canadians, which already tend to be at lower levels, have declined much more than the economy-wide average during this crisis (Chart 15).
Long unemployment spells mean that many vulnerable workers risk withdrawing from the workforce or seeing their skills erode, with lasting impacts on their lifelongs earnings, and on the wider labour market, that could take years to reverse. Not surprisingly, these vulnerable groups are also those that have seen the strongest decline in their mental health and life satisfaction.
Change in the Employment Rate, by Selected Groups,
February 2020 to February 2021
A complete recovery is a shared recovery — shared by working women and men of all ages across Canada.
Fiscal guardrails continue to guide the policy stance
As announced in the Fall Economic Statement, the government tracks progress against several economic indicators to assess and gauge the impact of fiscal policy support, recognizing that no one data point is a perfect representation of the health of the economy.
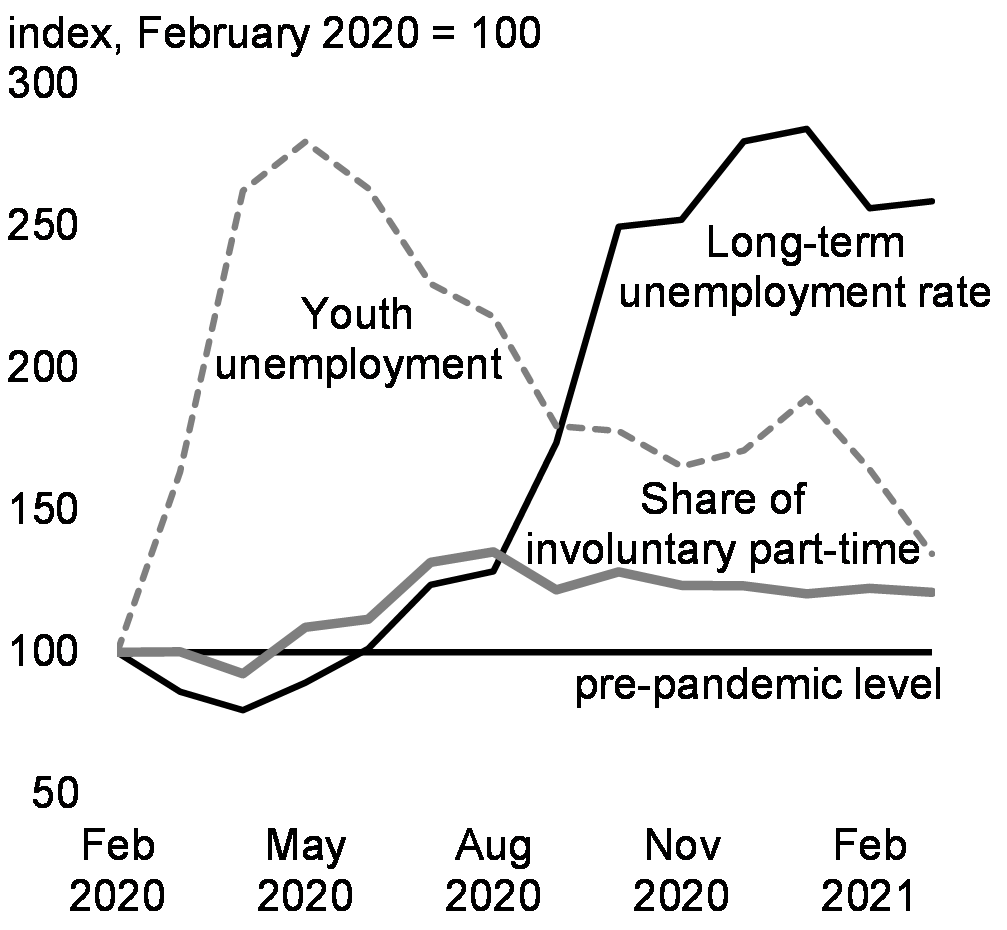
These indicators include key measures of labour market conditions like the employment rate, total hours worked, and the unemployment rate. A comprehensive range of indicators show that the Canadian economy is still far from seeing a strong labour market with broadly shared benefits (Charts 16 to 19). Forward looking expectations will also guide the government’s response.
Fiscal Guardrails and Key Labour Market Metrics
Employment Rate

Unemployment
Total Hours Worked

Additional Labour Market Metrics
Notes: Last data point is March 2021. The employment rate is based on the working age population (15-64).
Sources: Statistics Canada; Department of Finance Canada.
2. Gaining Economic Momentum through 2021
Progress controlling the virus will determine the path forward
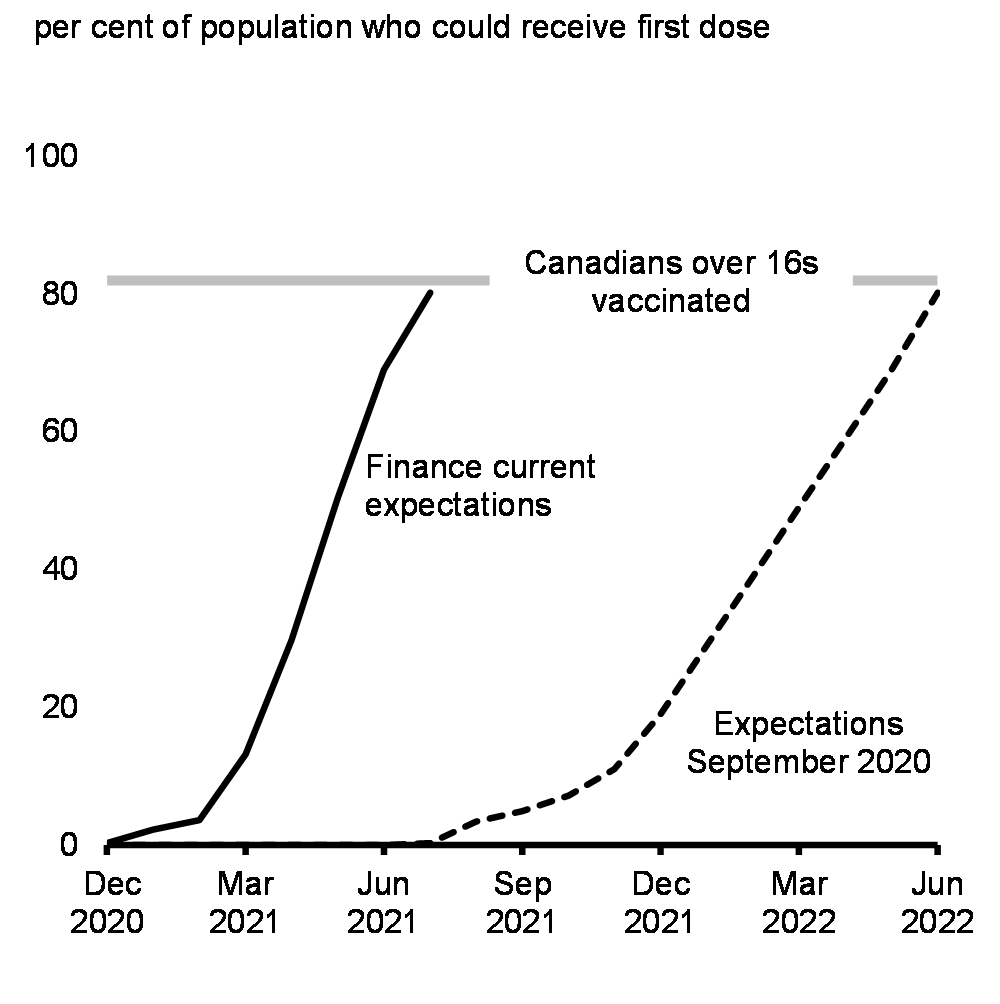
Progress controlling the virus and inoculating Canadians are key factors in how the economic recovery in Canada will unfold in the coming months (Chart 20). The approval of a number of highly effective vaccines and expectations of a near-term acceleration in vaccinations has significantly raised the outlook for growth (Chart 21).
The best way to keep the economy strong is to keep Canadians healthy. Some restrictions will be necessary to limit the spread of the virus and will continue to temporarily impact economic activity. This issue is being compounded by the variant-driven third wave.
Illustrative Vaccination Scenarios
Real GDP Path

Potential for tailwinds to boost the recovery
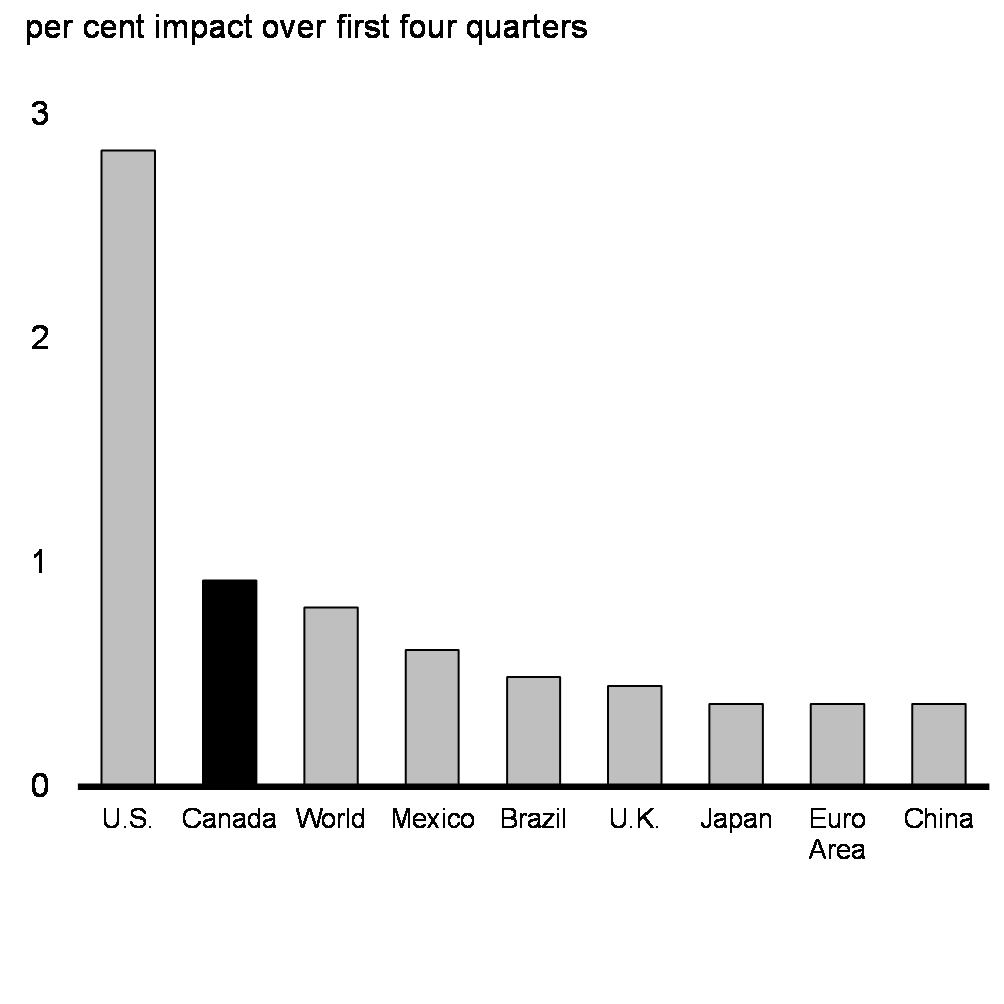
Economic activity could recover faster than in a typical recession due to the fact that the effects of this crisis on the economy are the result of a public health emergency rather than an unwillingness to spend. Over the last year, Canadian households, in particular, have built up significant savings (Chart 22). When the pandemic recedes, the release of pent-up demand could translate into a tangible if temporary boost to economic activity. Additional benefits are possible from the large-scale fiscal support and investment in the U.S., which could have substantial spillover into the Canadian economy (Chart 23).
Accumulation of Excess Household Savings by Country
Real GDP Impact of the American Rescue Plan
Economists expect the pace of economic activity to pick-up as vaccination progresses
Altogether, economists have significantly revised up their views for the recovery path since the Fall Economic Statement (Chart 24). Following a record decline of 5.4 per cent in 2020, real GDP is expected to grow by 5.8 per cent in 2021 and by 4 per cent in 2022. The projected level of real GDP by the end of 2022 is almost 2 per cent higher than projected in the Fall Economic Statement.
Real GDP Growth Forecasts
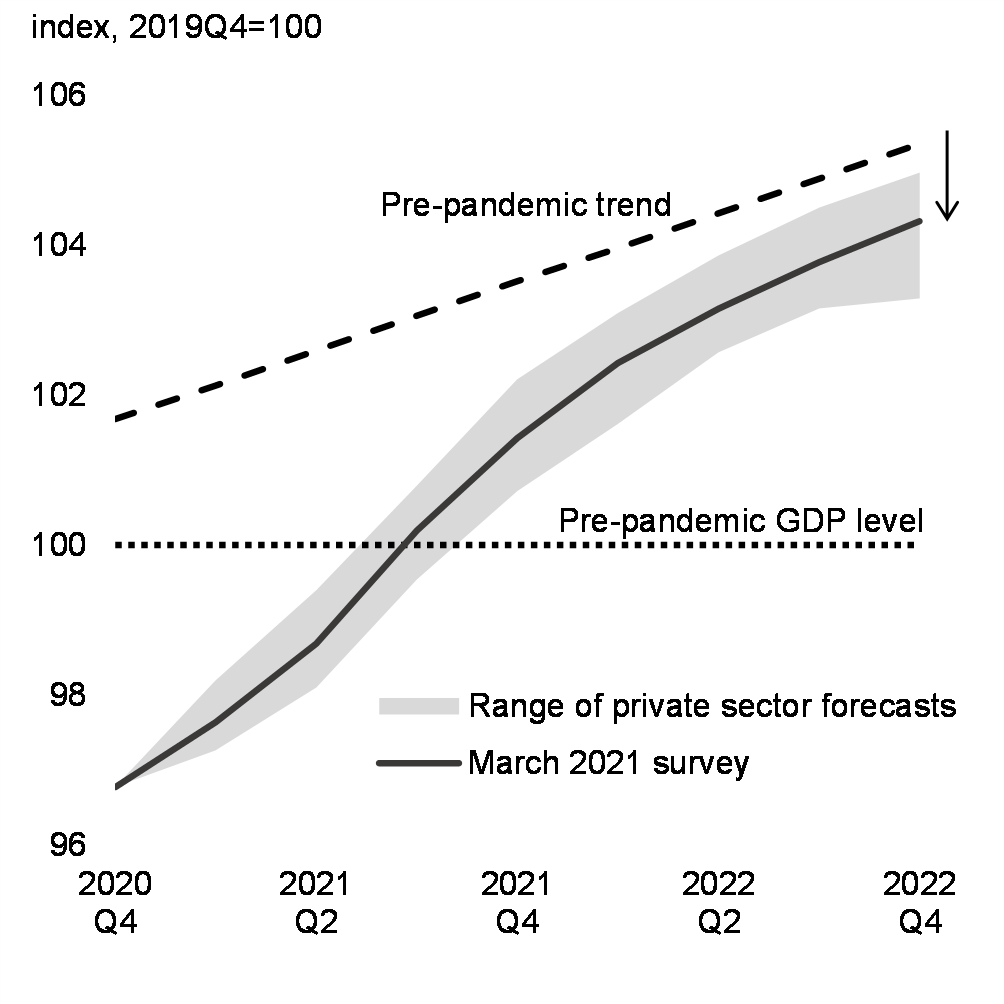
Real GDP is expected to reach its pre-pandemic level over the course of 2021, about six months earlier than previously expected, but there is a high degree of uncertainty among private sector forecasters with respect to this outcome (Chart 25).
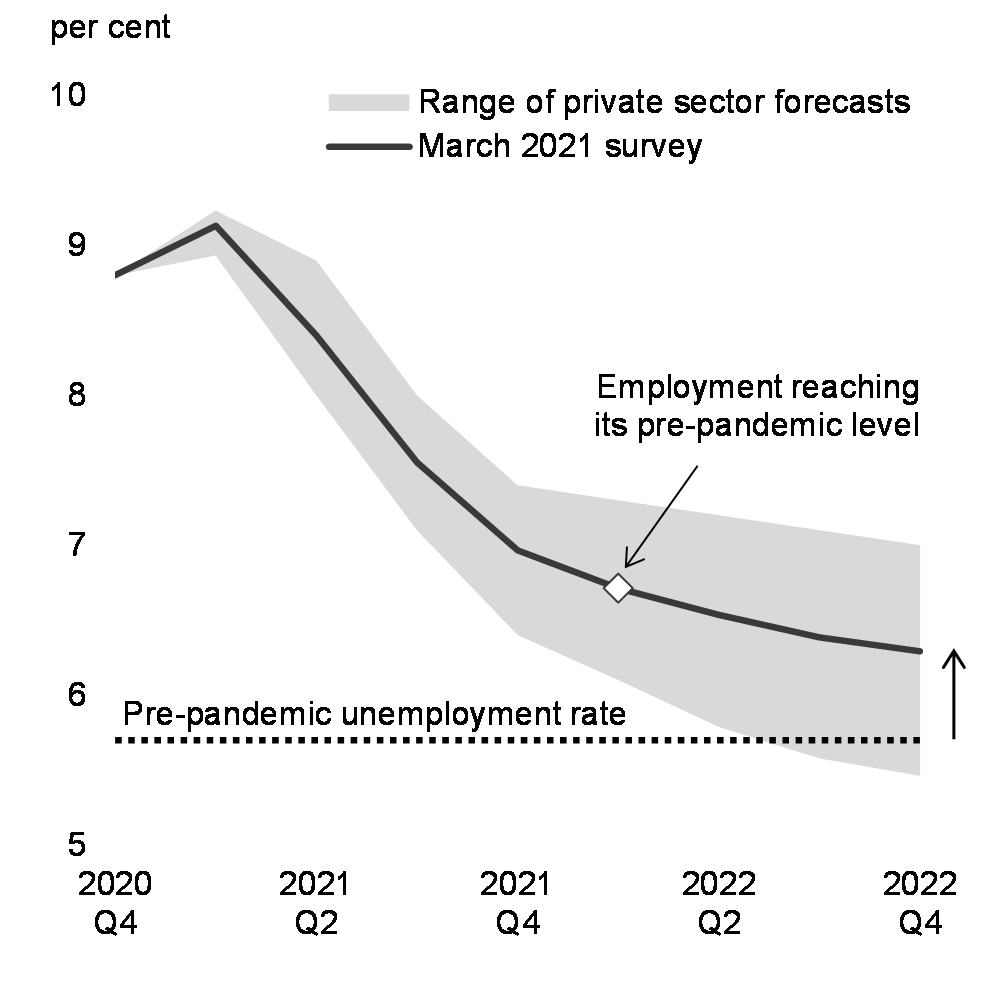
The recovery of the labour market is expected to lag behind the GDP recovery, given the scale of disruptions in labour-intensive sectors and the prospect of workers or businesses facing difficulty reintegrating into the post-pandemic economy (Chart 26). The unemployment rate is expected to decline over the course of the year, but will still be around 7 per cent at the end of this year and 6.3 per cent at the end of next year, reaching around 6 per cent only by 2024.
Real GDP Growth Forecast
Unemployment Rate Forecast
Indeed, there remains a high degree of uncertainty around the trajectory of the recovery, with transmission of more contagious variants of the virus causing regions to re-tighten restrictions yet again. Consistent with this dynamic situation, emergency support measures, such as the Canada Emergency Wage Subsidy and Canada Recovery Benefit, will continue to support workers and businesses until the pandemic abates.
In this context, to illustrate the consequences of different health outcomes and the associated responses of households and businesses, the Department of Finance has also considered two alternative scenarios to the baseline projections: (i) one scenario where improved health outcomes and the current momentum in activity is sustained enabling a stronger recovery; and (ii) another scenario where an acute third wave of infections and delayed, or less effective, vaccination program lead to a slower recovery.
Under the acute third wave ‘slower recovery’ scenario described above, economic growth is reduced by 0.7 percentage points in 2021. In this scenario, slower economic activity would drag on tax revenues, and the costs of the government’s COVID-19 emergency response programs would be expected to increase due to necessary extensions of support, resulting in an estimated fiscal impact of approximately $15 billion in 2021-22. Under the ‘faster recovery’ scenario, estimated positive fiscal impacts are approximately $10 billion in 2021-22. Details of these scenarios can be found in Annex 1.
3. Securing the Recovery and Building a Stronger Economy
The recovery has a long way to go—the longer it takes, the more scars the pandemic recession will leave. Canadians remain underemployed and business activity in some sectors remains sluggish. The pandemic’s severe impacts on investment, immigration, and workers have also placed Canada on a slower long-term growth path. As we emerge from the crisis, we must make up lost ground and put Canada’s economy on a stronger footing, both for Canadians today and future generations. We can build this stronger, more resilient economy by investing in a green recovery, and making sure that every Canadian can participate in a growing economy and benefit from it.
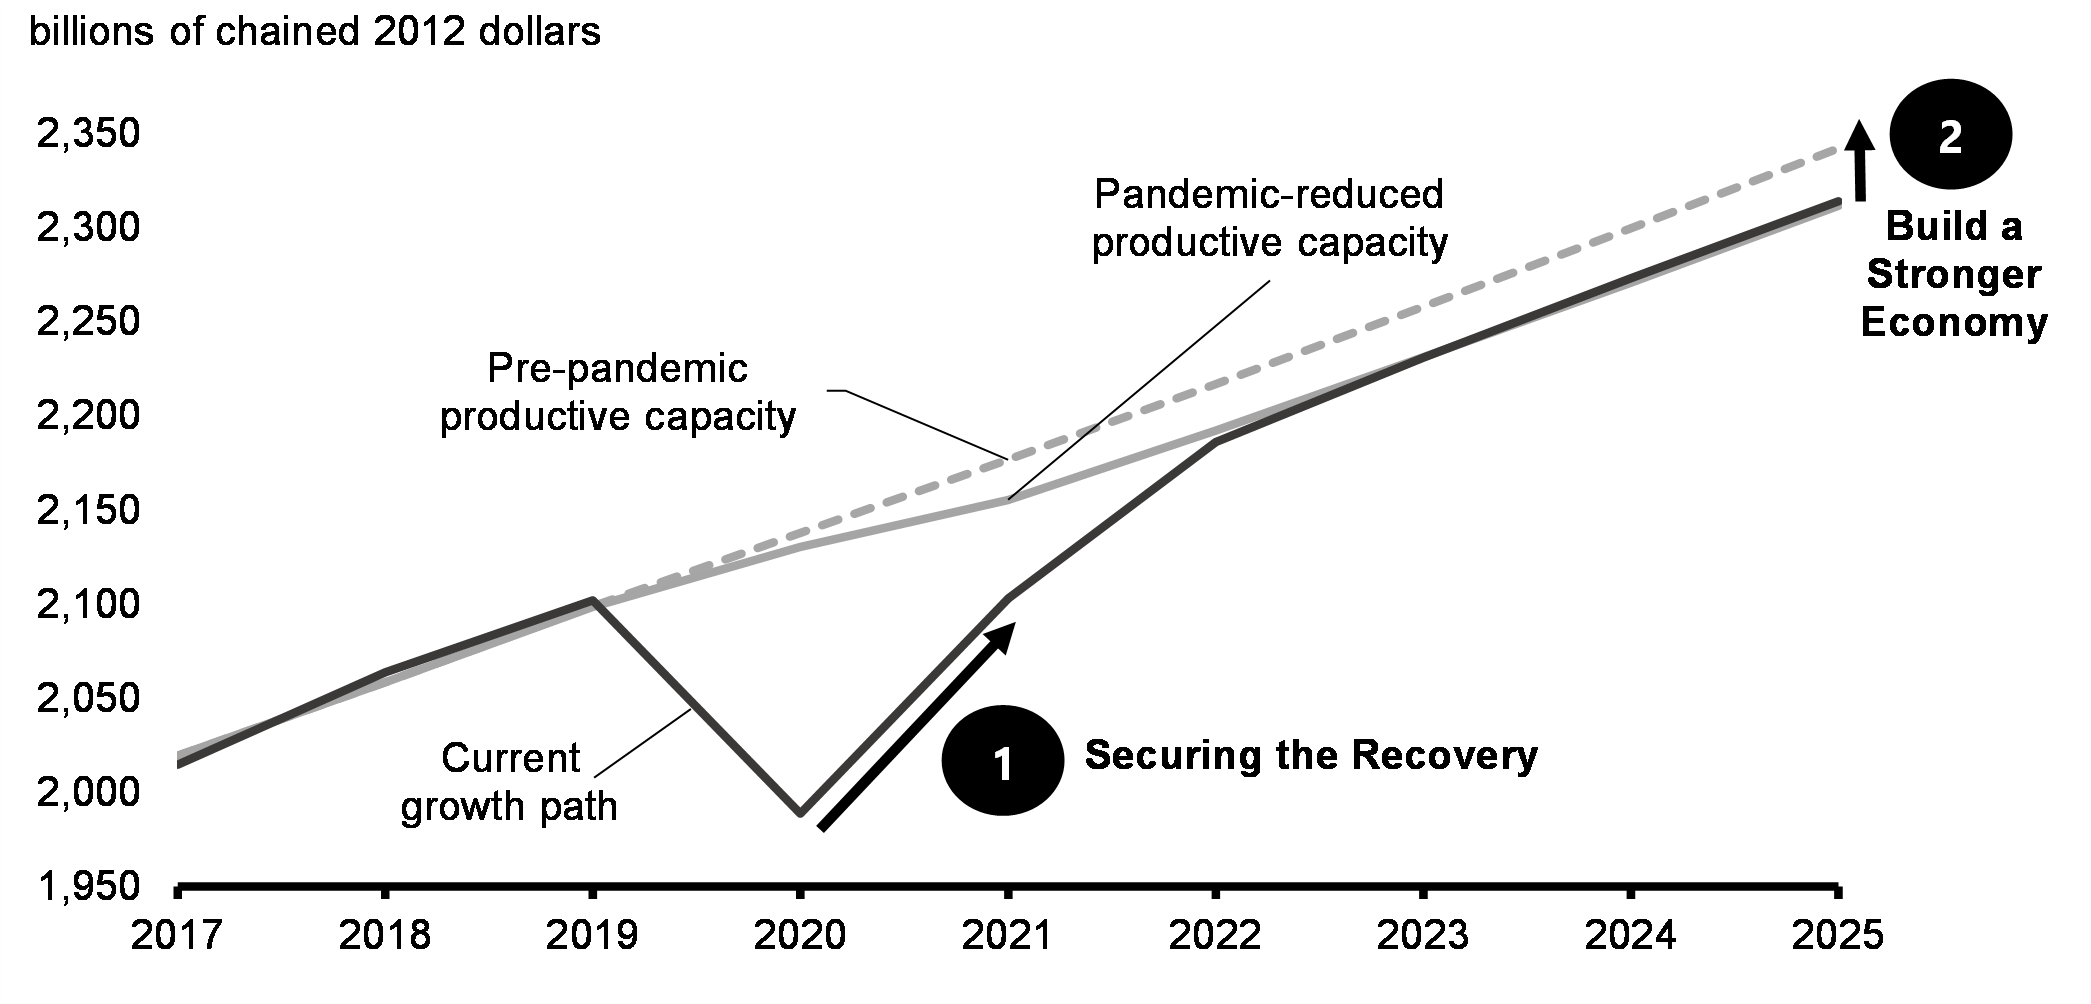
The government’s plan is twofold: first, securing the recovery with effective and time-limited measures; and second, building a stronger economy through smart, forward-looking investments (Chart 27).
Budget 2021 does this by putting forward a plan that concentrates spending in the earliest part of the recovery in order to drive as fast of a return to normal as possible, making long-term investments in initiatives that generate large returns to society and the economy, and producing a fiscal framework that is far stronger and more sustainable than forecasted in the Fall Economic Statement.
Impact of COVID-19 on the Canadian Economy
Securing the recovery
While there is evidence that Canada is well positioned for recovery, the risk of doing too little is very high. Past experience has shown that there are lasting social and economic consequences from deep recessions and slow recoveries.
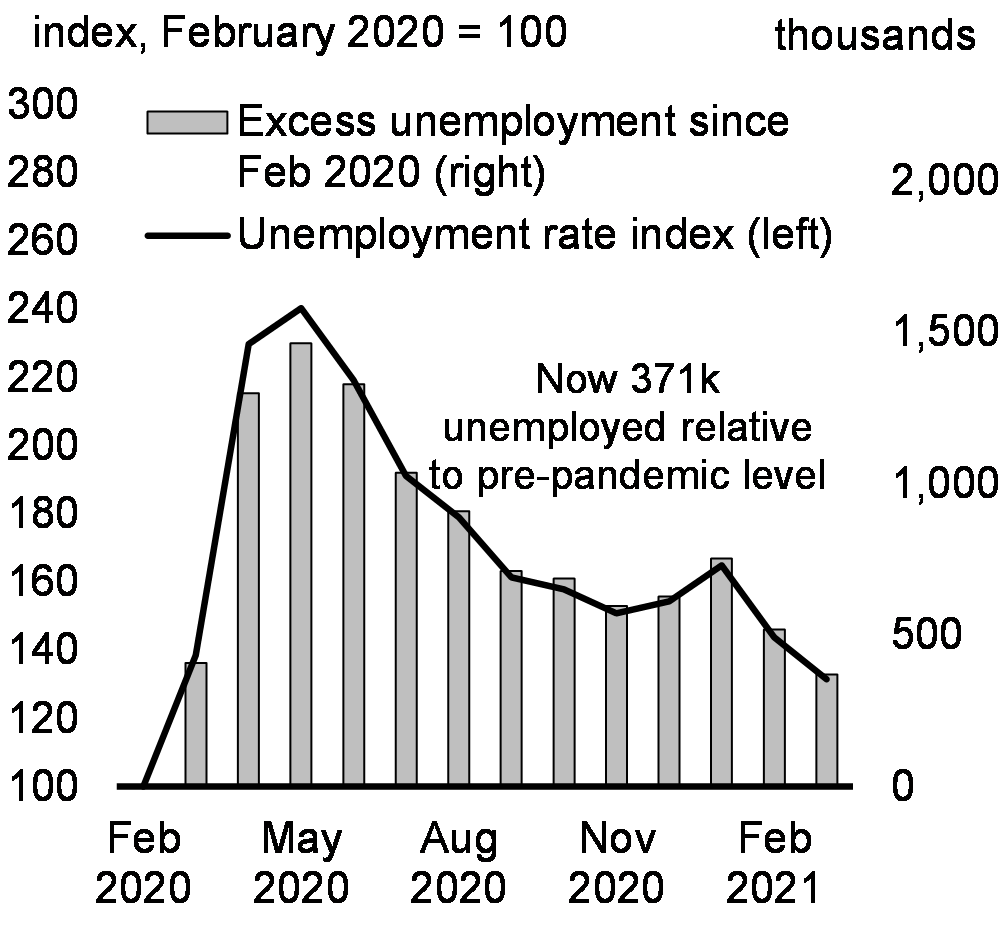
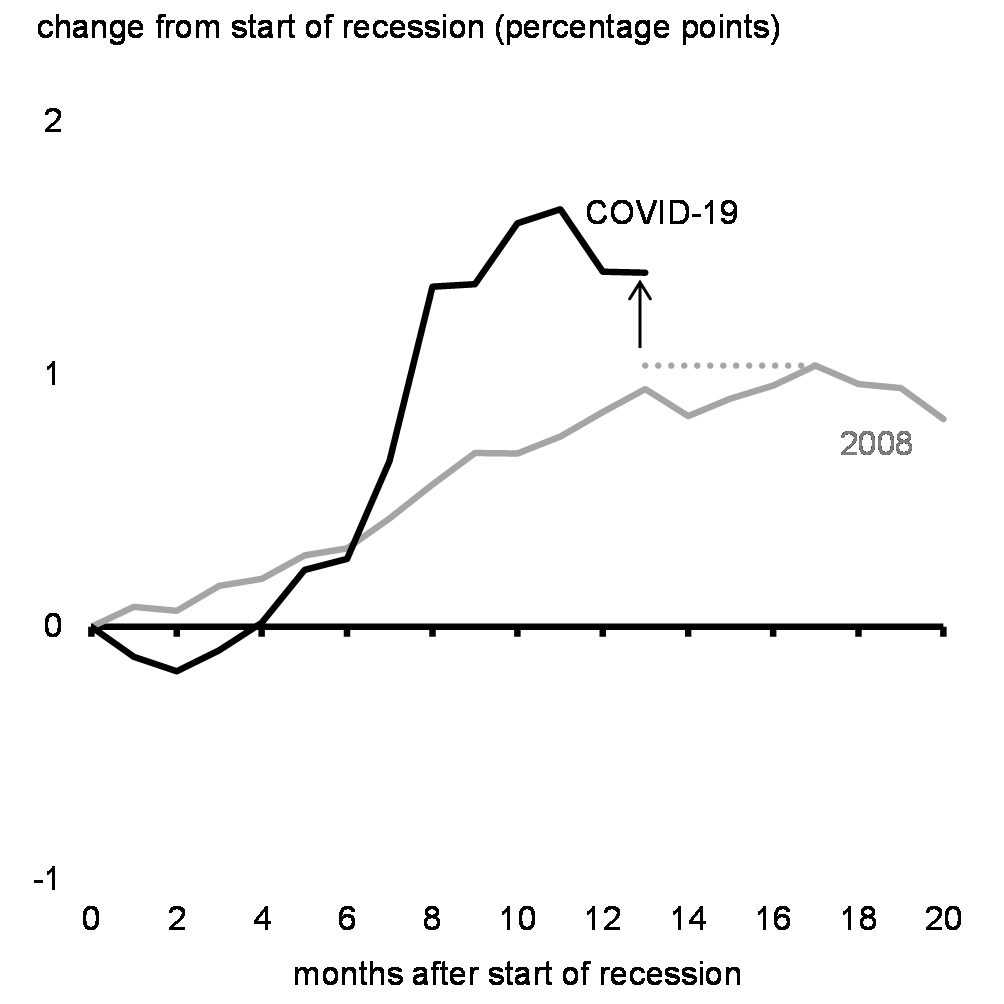
Overall, there remain over 500 thousand workers that have been laid off or faced working hours cuts due to the pandemic, including over 280,000 Canadians who have been unemployed for at least six months, still much higher than at the worst of the 2008-09 recession (Chart 28). The impacts of COVID-19 have also been disproportionate across the population, with adverse labour market outcomes for those that were vulnerable prior to the pandemic. Young people graduating into a weak labour market face lower lifetime earnings. This is an even more pointed concern for young women and racialized communities.
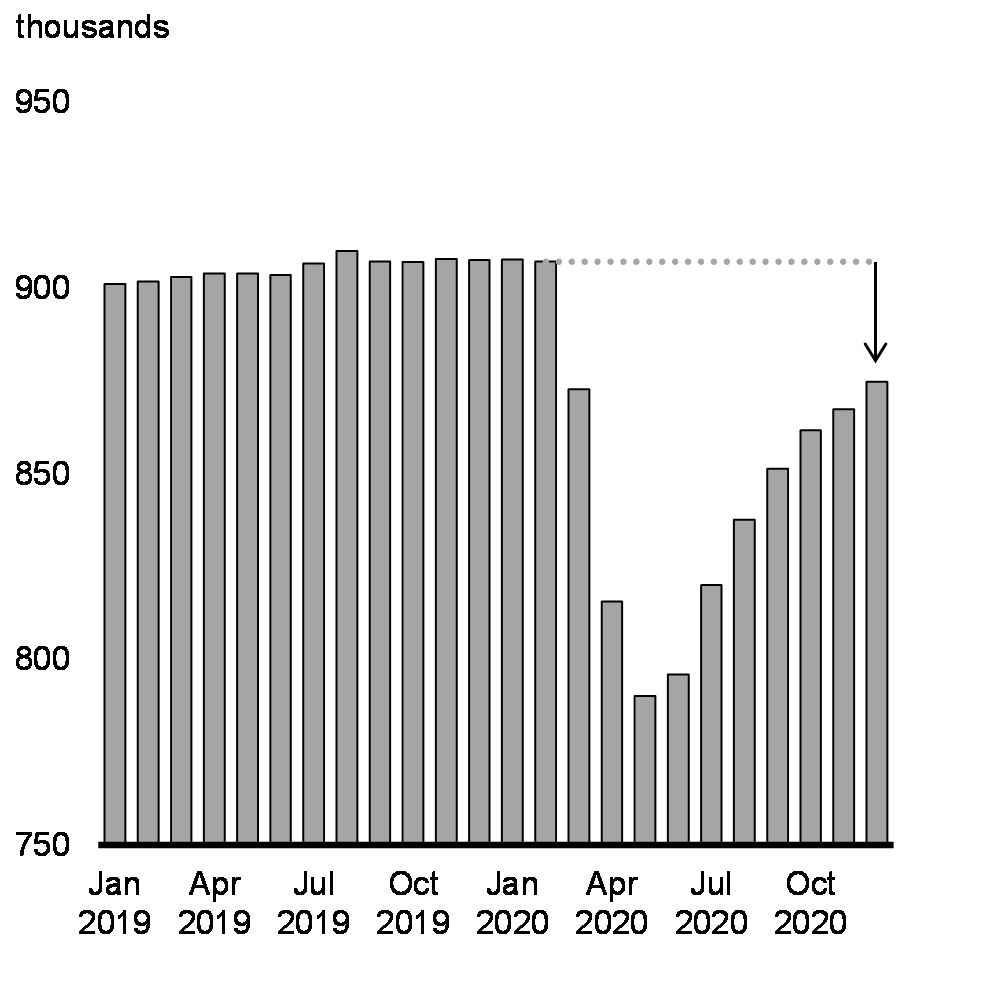
Many businesses remain closed, with the number of active businesses still nearly 4 per cent—or about 30,000 businesses—below pre-crisis levels with closures disproportionally concentrated among smaller businesses (Chart 29). Many of these closures are likely temporary, but risk becoming permanent if not enough is done.
Budget 2021 recognizes that a rapid and sustained economic recovery is the most reliable way to secure higher employment and income levels, improved and expanded job opportunities, and narrower economic disparities. That is why the goverment has a plan for a targeted and robust stimulus.
Change in Long-term Unemployment Rate
Number of Active Businesses
The Economic and Social Benefits of Investing in a Strong and Sustained Recovery
There are lessons to be learned from the recent past. After the 2008-09 recession, many Canadians struggled to find work for an extended period of time, leading many to drop out of the labour force entirely (Charts 30 and 31). Faced with lower demand and an uncertain outlook, businesses remained reluctant to invest (Chart 32). Economic inequalities widened as economic growth failed to bring every one along.
A swift and sustained recovery can prevent this type of long-term scarring and stem rising inequalities by drawing in potential workers who would otherwise sit on the sidelines. In strong labour markets, the persistent disparities facing many vulnerable groups like those with lower education, youth, and recent immigrants, diminish. In fact , just before the pandemic hit, the labour force participation rate of working-age Canadians reached an all-time high, reflecting increasing participation of women and vulnerable groups into the labour market. Many of these gains had emerged only years after the recession when eventually improved job opportunities provided more scope for participation to recover. In strong labour markets the persistent disparities facing many vulnerable groups tend to shrink, particularly for those with lower education, youth, or who are recent immigrants (Chart 33).
A strong recovery may also help rebalance the economy in a more sustainable manner, allowing interest rates to normalize and avoiding excessive dependence on interest-sensitive activities like consumer spending and housing to drive growth.
The risks of sustaining strong labour markets may also be lower now than previously believed. The relationship between the tightness of the labour market and inflation appears to have weakened in recent decades in many advanced economies. This suggests that a strong economy with low levels of unemployment could persist for an extended period before running up against higher inflation.
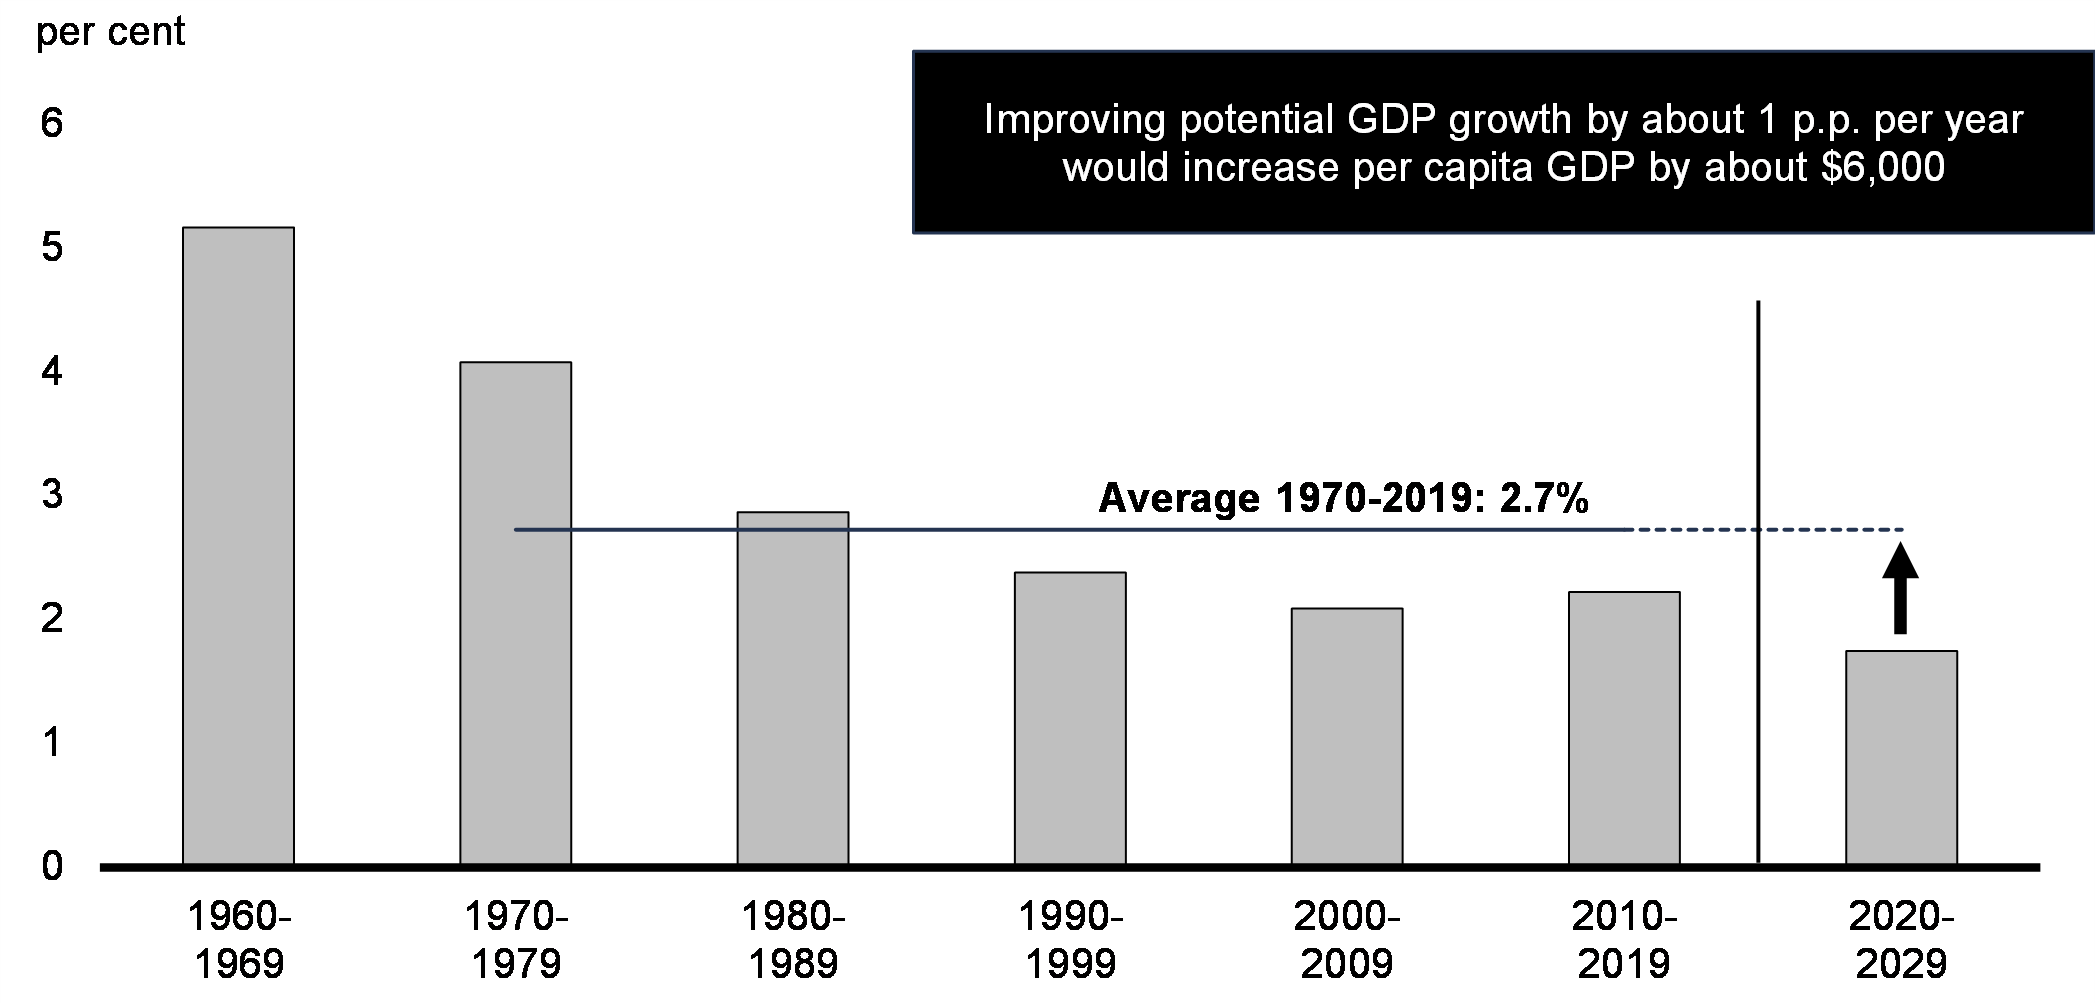
Accelerating the recovery would help to keep permanent economic harm to a minimum. The pandemic was initially expected to lower potential GDP relative to pre-pandemic by 2 per cent by the end of 2025 – or about $50 billion, meaning more than $2,000 on average for every Canadian aged 15 to 64. Although uncertainty surrounding this estimate remains high, medium-term GDP losses are now expected to be minimal partly reflecting extraordinary policy support and additional investments to safeguard a strong recovery.
Long-Term Unemployment Rate

Deviation from Trend in the Labour Force Participation Rate

Real Investment in Machinery and Equipment
Unemployment Rate Differences

Building a stronger economy
Securing the recovery is not enough. Budget 2021 recognizes that the government needs to take action to protect Canada’s long term economic growth prospects. The challenges and fundamental shifts faced by Canada prior to the pandemic, such as climate change, population aging, and unrealized workforce participation by women, will not disappear. These challenges on the horizon will have longer lasting impacts on our future prosperity if not addressed (Chart 34).
Potential Real GDP Growth
With this context in mind, Budget 2021 will focus on pillars of growth to act as the foundation on which to build the economic recovery and move the Canadian economy onto a higher and more inclusive growth path.
Breaking down barriers that prevent people from joining the labour force, such as child care, creating opportunities for young Canadian workers, and helping workers find positions that match their skills will help each worker reach their full potential. Restarting Canada’s immigration system and generating labour market market momentum for new Canadians will restore this key driver of working-age population growth.
As the world confronts the climate emergency and the economy shifts, investments that fight climate change and hasten the development of Canada’s green economy help to create new industries and jobs now. And, as a result, they secure the well-being and prosperity of the next generations of Canadians.
Further, massive disruptions over the last year have potentially derailed new business investments, a critical pillar of Canada’s long-term growth trajectory. Additional incentives to encourage businesses to invest and to adapt new technologies to take advantage of an increasingly digitized economy will help business compete locally and globally.
The crisis has also demonstrated that not everything that matters to Canadians is easily measured or described in economic and financial terms. Important issues such as inequality, housing affordability, access to mental health support and the existential threat from climate change, are fundamental to Canadians’ quality of life. To ensure that it continues to broaden the focus of its policy objectives and takes into account all aspects of Canadians’ quality of life in its decisions, the government is moving forward in developing and refining a quality of life framework, further details of which can be found in Annex 4.
4. An Historic Plan for a Stronger and More Resilient Canada
Budget 2021 outlines a plan that will get Canadians back to work and begin improving Canada’s growth potential. The actions in this budget will build upon the commitments made in the 2020 Fall Economic Statement and the Enhanced Climate Plan, which together comprise a recovery plan that will create shared prosperity, improve Canadians’ quality of life, and power our green transformation.
Overall, better-than-expected economic outcomes and revisions to the estimated costs of some large economic response plan measures since the Fall Economic Statement have had a positive impact on the projected budgetary balance over the forecast horizon.
After accounting for Budget 2021 measures, the budgetary balance is expected to show a deficit of $354.2 billion in 2020-21, improving to $154.7 billion in 2021-22, and gradually declining to a deficit of $30.7 billion in 2025-26, or approximately one per cent of GDP. The federal debt is expected to peak at 51.2 per cent of GDP in 2021-22 before declining to 49.2 per cent of GDP in 2025-26. This balance includes the cost of incremental investments since FES 2020 of $101.4 billion, or 4.2 per cent of GDP, over the next three fiscal years.
As noted in Table 1, the deficit and the federal debt-to-GDP ratio remain below levels shown in the 2020 Fall Economic Statement that incorporated the planned $100 billion in incremental spending and forecasted economic and fiscal impacts of the second wave.
| Projection | |||||||||
|---|---|---|---|---|---|---|---|---|---|
| 2020-2021 | 2021-2022 | 2022-2023 | 2023-2024 | 2024-2025 | 2025-2026 | ||||
| Budgetary Balance (before stimulus) | -381.6 | -121.2 | -50.7 | -43.3 | -30.9 | -24.9 | |||
Economic and fiscal developments since FES 2020 Table A1.4 |
35.2 | 15.8 | 19.3 | 16.0 | 12.8 | 10.3 | |||
Budgetary balance before policy actions and investments |
-346.4 | -105.4 | -31.4 | -27.3 | -18.1 | -14.6 | |||
Policy actions since FES 2020 |
0.2 | 0.3 | 0.9 | -1.1 | -0.7 | -0.3 | |||
| Investments in Budget 2021 (by chapter) | |||||||||
1. Keeping Canadians Healthy and Safe |
-5.0 | -1.2 | -1.0 | -0.9 | -0.8 | -0.7 | |||
2. Seeing Canadians and Businesses Through to Recovery |
-0.2 | -27.0 | -4.2 | -1.0 | -0.7 | 0.7 | |||
3. New Opportunities for Canadians |
-0.5 | -3.9 | -9.0 | -7.5 | -7.6 | -8.8 | |||
4. Helping Canadian Businesses Grow and Succeed |
0.0 | -3.7 | -4.5 | -5.0 | -2.4 | -0.8 | |||
5. A Healthy Environment for a Healthy Economy |
0.0 | -1.2 | -1.9 | -2.0 | -1.8 | -1.9 | |||
6. Strengthening the Cities and Communities We Call Home |
-2.2 | -4.6 | -3.3 | -2.3 | -2.0 | -3.1 | |||
7. A More Equal Canada |
0.0 | -1.8 | -1.6 | -2.1 | -2.2 | -2.4 | |||
8. Strong Indigenous Communities |
0.0 | -4.3 | -3.5 | -3.0 | -1.3 | -1.0 | |||
9. Protecting Our Shared Values |
-0.1 | -1.9 | -1.1 | -0.7 | -0.5 | -0.4 | |||
10. Responsible Government |
0.0 | -0.2 | 0.7 | 1.8 | 2.4 | 2.5 | |||
| Total – Actions since FES 2020 and Budget 2021 Investments | -7.7 | -49.3 | -28.3 | -23.8 | -17.7 | -16.1 | |||
| Budgetary balance | -354.2 | -154.7 | -59.7 | -51.0 | -35.8 | -30.7 | |||
|
Budgetary balance (%GDP)
|
-16.1 | -6.4 | -2.3 | -1.9 | -1.3 | -1.1 | |||
|
Federal Debt (%GDP)
|
49.0 | 51.2 | 50.7 | 50.6 | 50.0 | 49.2 | |||
| Note: FES 2020 Escalated Restrictions Scenario and $100 billion stimulus | |||||||||
Budgetary balance
|
-398.7 | -166.7 | -109.6 | -71.7 | -39.4 | -33.4 | |||
|
Budgetary balance (%GDP)
|
-18.2 | -7.3 | -4.5 | -2.9 | -1.5 | -1.2 | |||
|
Federal Debt (%GDP)
|
51.4 | 56.4 | 58.1 | 58.5 | 57.6 | 56.6 | |||
Accelerating the Rescue and Recovery—International Comparisons
To address the pandemic, governments across the globe have taken swift fiscal policy actions totalling more than 16% of the world’s GDP as of March 17, 2021. The IMF estimates that without such support, the collapse in economic activity registered in 2020 could have been three times worse.
Similar to Canada, a number of peer countries have mobilized additional fiscal resources since the 2020 Fall Economic Statement —ranging from 1.9% of GDP to more than 12% of GDP.
| Selected Country | Fiscal Support Announcements | Size (% of 2021 GDP) | |||||
|---|---|---|---|---|---|---|---|
| United States | COVID-19 Response and Relief Act (4.1% of GDP - Dec. 2020)and American Rescue Plan Act (8.2% of GDP - Mar. 2021) | 12.3% of GDP | |||||
| Canada | Commitments made in Chapter 3 of FES 2020 (0.3% of GDP) and policy actions since, including Budget 2021 (4.2% of GDP) | 4.6% of GDP | |||||
| Germany | Supplementary Budget for 2021 and Budget 2022 net new borrowing for 2022 (Mar. 2021) | 4.0% of GDP | |||||
| Japan | Third Supplementary Budget for 2020 – net new COVID-19 related measures and Budget 2021 – Additional COVID-19 Contingency Fund (Dec. 2020) | 3.6% of GDP | |||||
| UK | Budget 2021 - net borrowing impact of policy decisions over 2020-21 and 2021-22 (Mar. 2021) | 2.9% of GDP | |||||
| Italy | Additional fiscal room through rise in borrowing limit (Jan. 2021) | 1.9% of GDP | |||||
| Sources: Committee for a Responsible Federal Budget; UK Treasury, Bundesministerium der Finanzen; Ministero dell’Economia e delle Finanze; Japan Ministry of Finance; Australian Treasury; Department of Finance Canada calculations.
NOTE: For the United States, the table excludes the proposed American Jobs Plan unveiled on March 31, 2021. Announcements above are not directly comparable as they can cover multiple years (largely focused on 2021 and 2022) and include varying combinations of on-budget items, additional COVID-19 health spending, the extension of existing support measures, off-budget items, as well as contingency or reserve funds yet to be allocated to specific measures. They also generally exclude offsetting financing measures. Totals may not add due to rounding |
|||||||
Delivering on the government’s one million jobs commitment
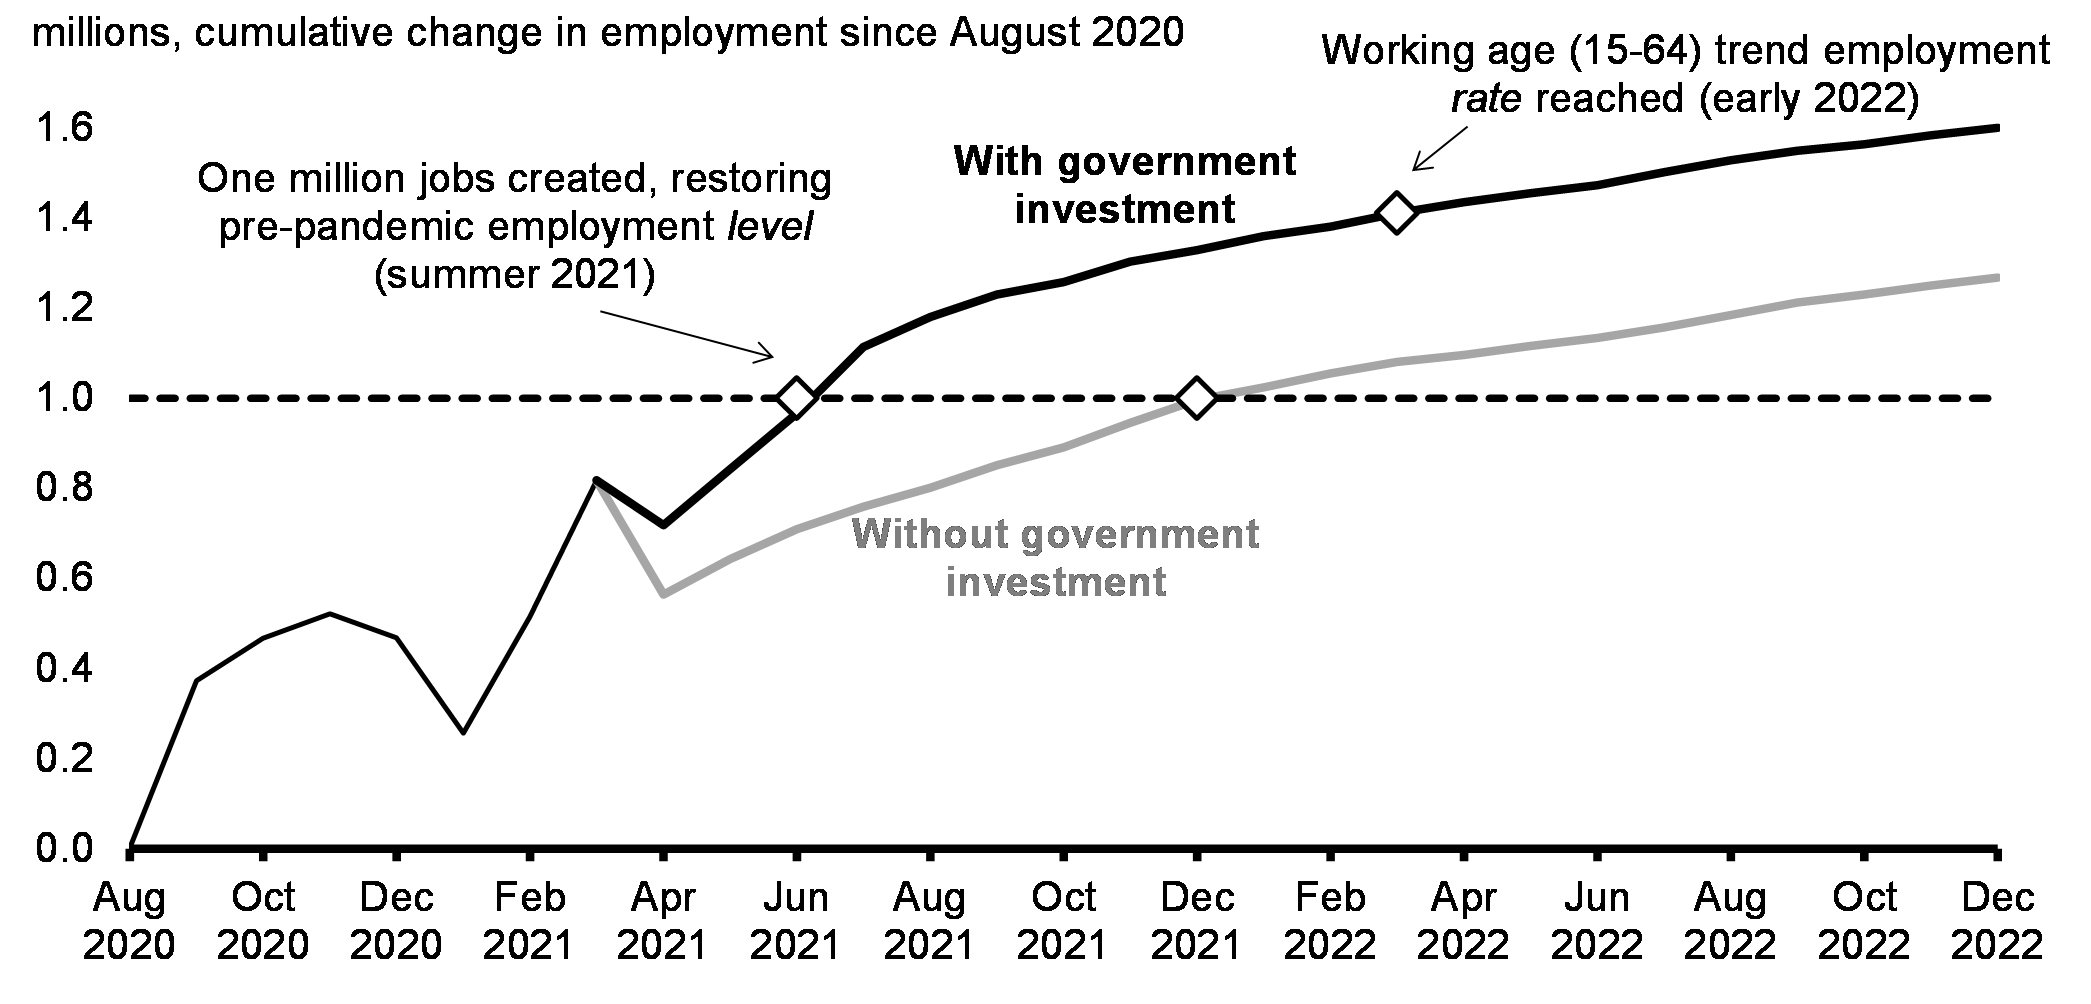
In last fall’s Speech from the Throne, the government announced its commitment to create one million jobs and restore employment to previous levels. Despite the severe impacts of the second wave on Canadian workers and businesses, we are on path to create one million jobs by the end of the year (Chart 35)—ahead of the schedule predicted in the 2020 Fall Economic Statement. The plan outlined in Budget 2021 will continue to support a strong recovery creating more good jobs in the years to come.
Even once this goal is reached there will still be work to do. Population growth means that we will still be short of our pre-pandemic employment rate level. The investments announced in this budget have put us on a path to reach this overall objective by early 2022, almost two years earlier than if the government had failed to make the extraordinary investments that get Canadians back to work and level-up Canada’s growth potential.
Path to One Million Jobs
Estimated Short-Term Economic Impacts
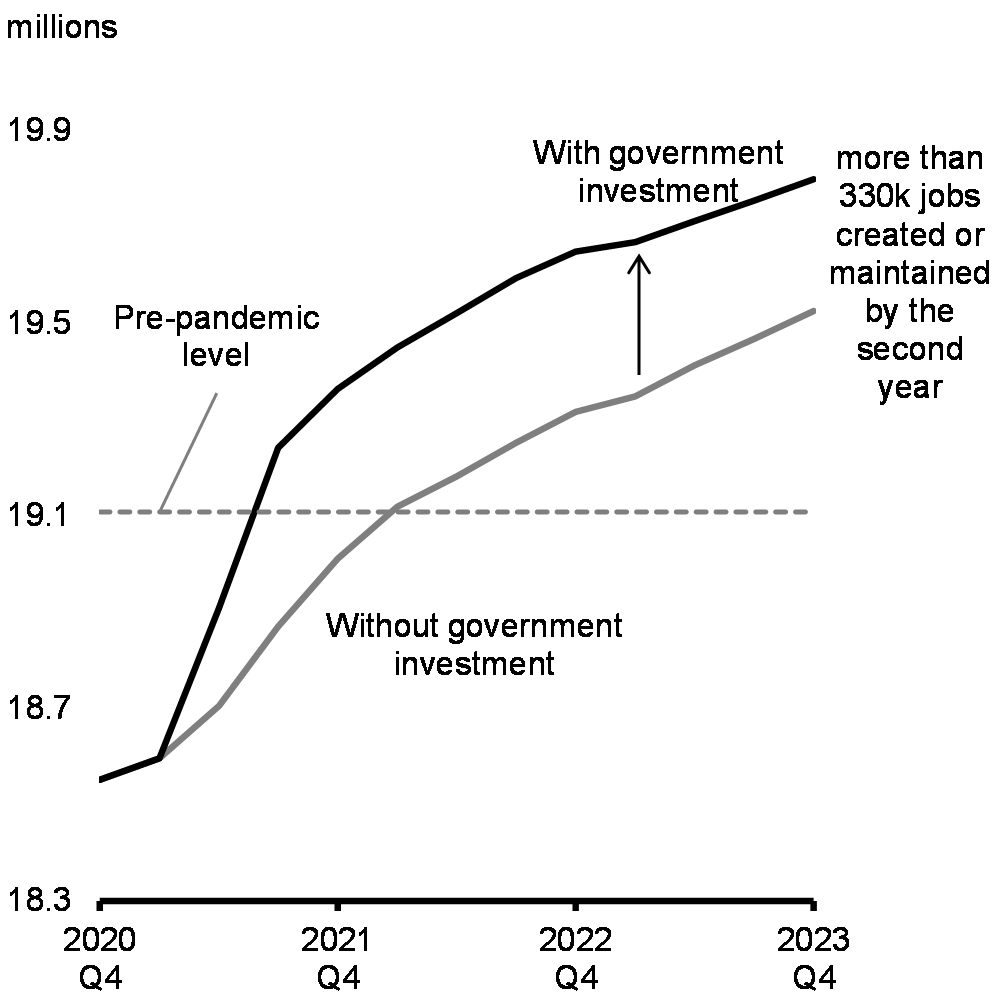
Government investments in the Fall Economic Statement, the Enhanced Climate Plan, and Budget 2021 are expected to raise the level of real GDP by 2.0 per cent by the second year (Table 2). This is expected to translate into an increase in employment of more than 330 thousand jobs created or maintained by 2022-2023 (Charts 36 and 37). Details of these estimates can be found in Annex 1.
Most forecasters see the Canadian economy having a material amount of slack over the medium term—providing some indication that a full recovery will take time. Based on the current track, the output gap is expected to remain open over the near term. Accordingly, while the unemployment rate is expected to decline from where it sits today, it is still expected to be above its pre-crisis level for some time (Charts 38 and 39).
| 2021– 2022 |
2022– 2023 |
2023– 2024 |
|
|---|---|---|---|
| Real GDP (per cent) | 1.6 | 2.0 | 1.9 |
| Employment (jobs created or maintained, thousands) | 315 | 334 | 280 |
Real GDP Projections

Employment Projections
Range of Output Gap Expectations

Unemployment Rate Expectations
5. A Responsible Fiscal Plan
Canada entered this crisis in a strong fiscal position, allowing the government to take decisive action to put in place the support necessary for people and businesses to weather the storm and support a robust and inclusive recovery of the Canadian economy.
However, those actions, combined with lower revenues due to the recession, have increased public debt sharply. Canada’s history of prudent fiscal management means that, despite the unprecedented actions we took to fight the virus, we continue to have, by far, the lowest net debt-to-GDP balance relative to international peers (Chart 40).
General Government Net Debt, G7 Countries
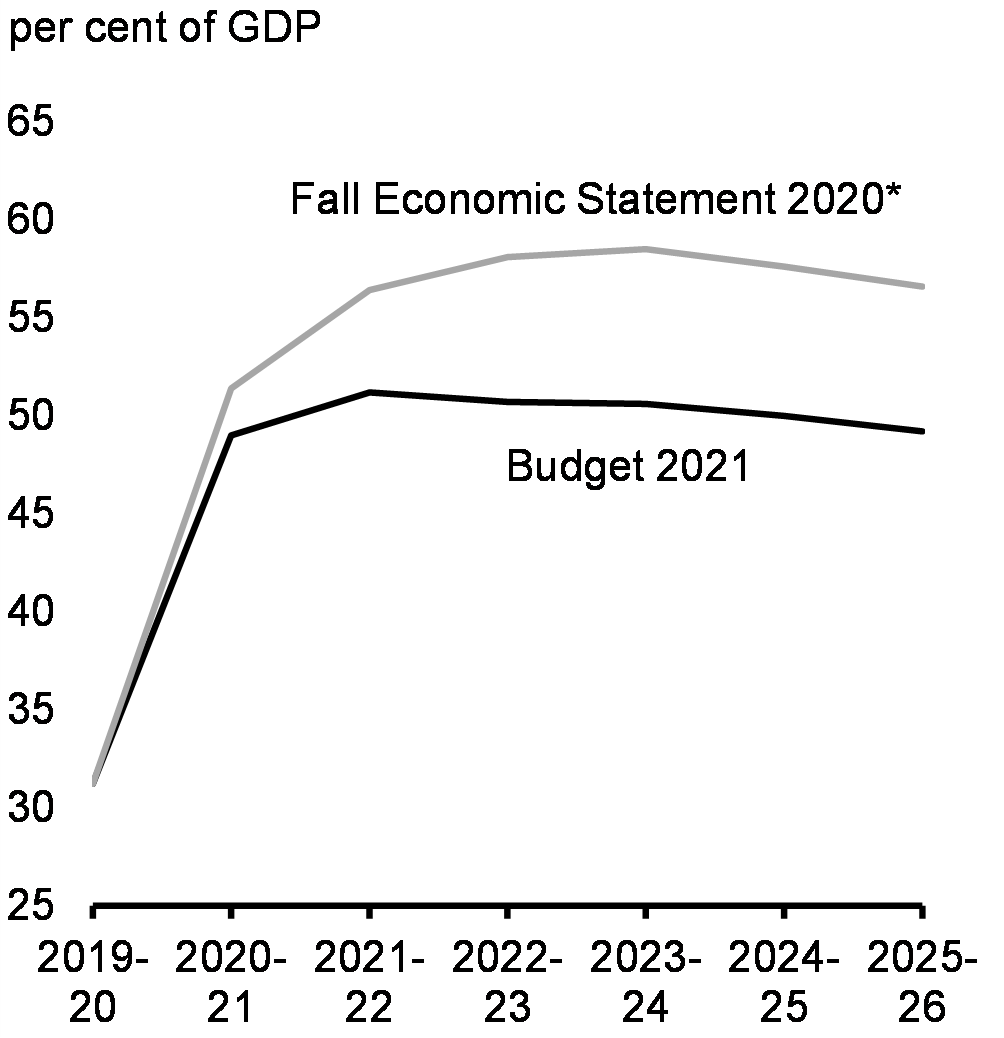
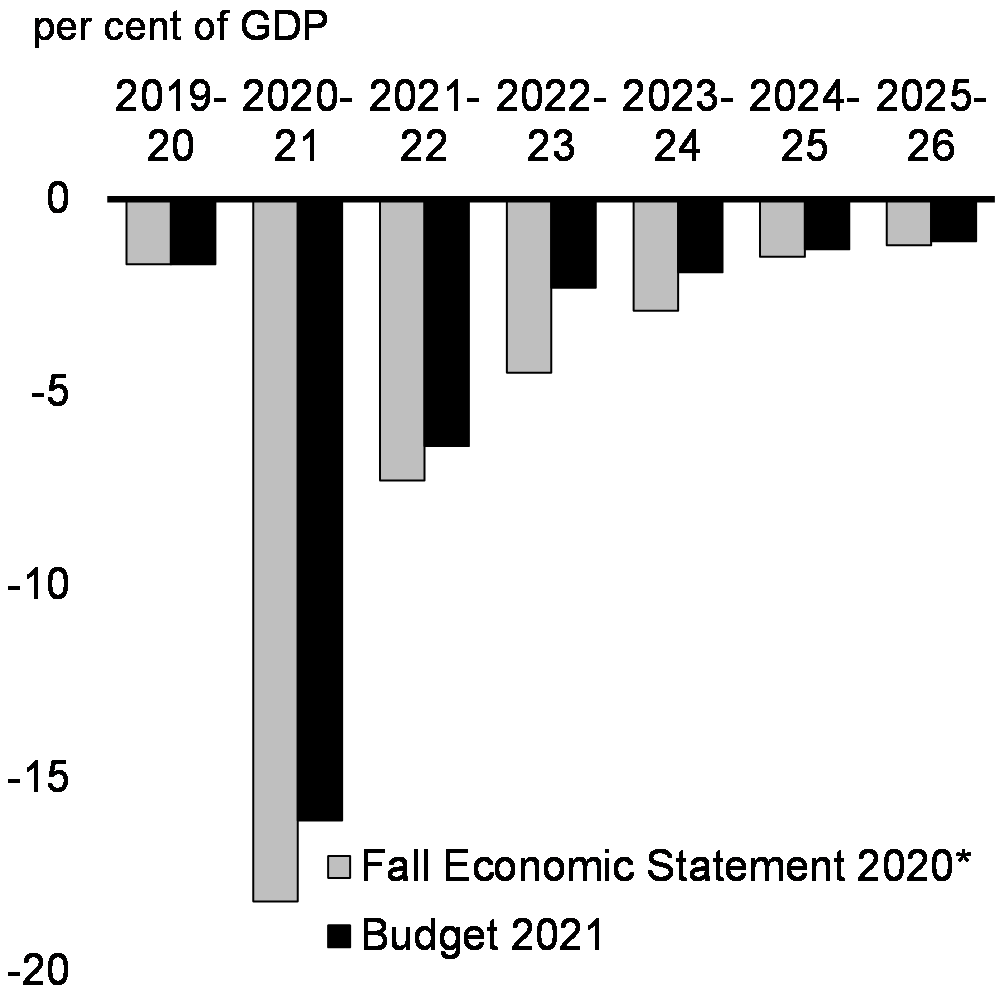
The government is committed to responsible fiscal policy. Budget 2021 deficits and the federal debt-to-GDP ratio remain below levels shown in FES 2020 that incorporated the planned $100 billion in incremental spending and forecasted economic and fiscal impacts of the second wave (Charts 41 and 42).
The government is committed to unwinding COVID-related deficits and reducing the federal debt as a share of the economy over the medium-term. This fiscal anchor will continue to protect Canada’s low debt advantage so that borrowing costs remain low, and future generations are not burdened with COVID-19-related debt. Budget 2021 meets this test, by providing a prudent and sustainable path forward for public finances, as demonstrated by several important indicators:
- After rising over the next year to support concentrated investments to kickstart the recovery, the federal debt-to-GDP ratio returns to a downward track over the following years, and is forecast to be approximately 49 per cent in 2025-26 (Chart 41);
- The deficit-to-GDP ratio, which measures the size of the deficit in relation to the economy, is on a path to fall to 1.1 per cent over the planning horizon (Chart 42), a level that is lower than the forecasted size of the deficit for 2019-20 and 2020-21 when the government tabled its Economic and Fiscal Update in December 2019.
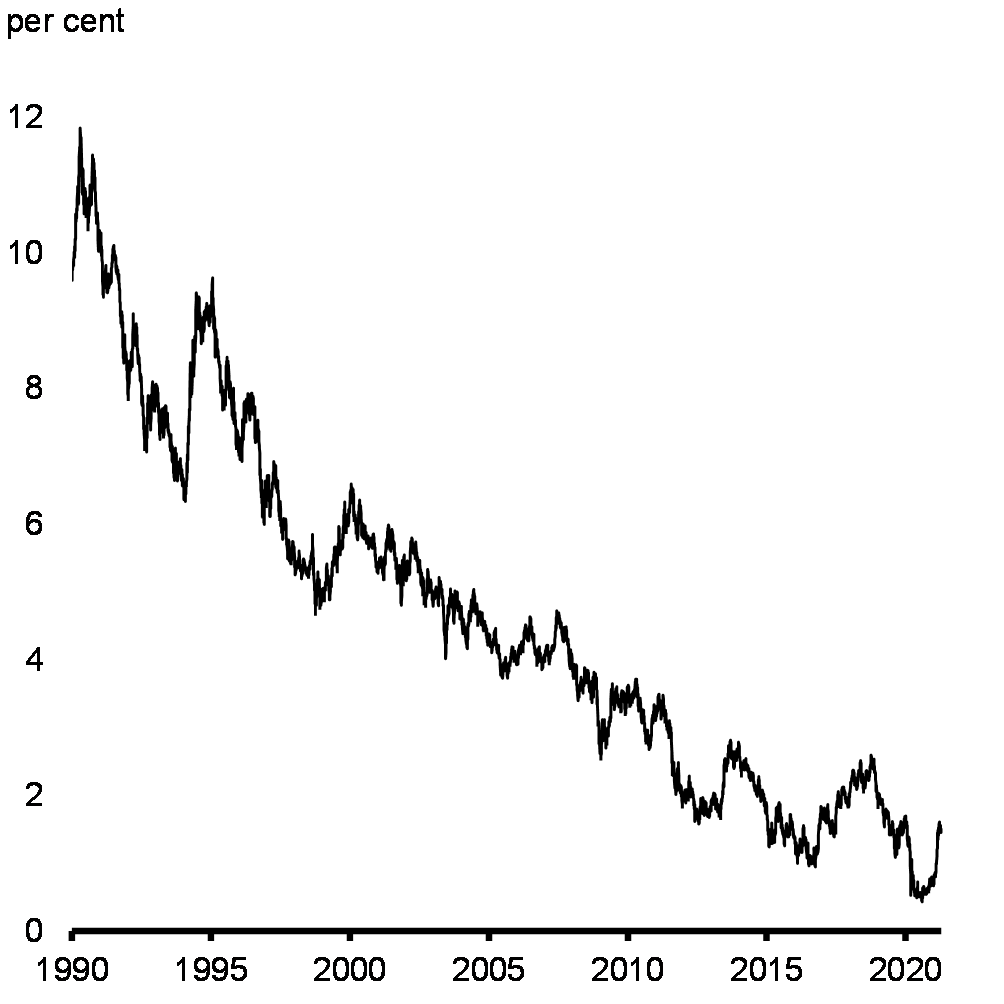
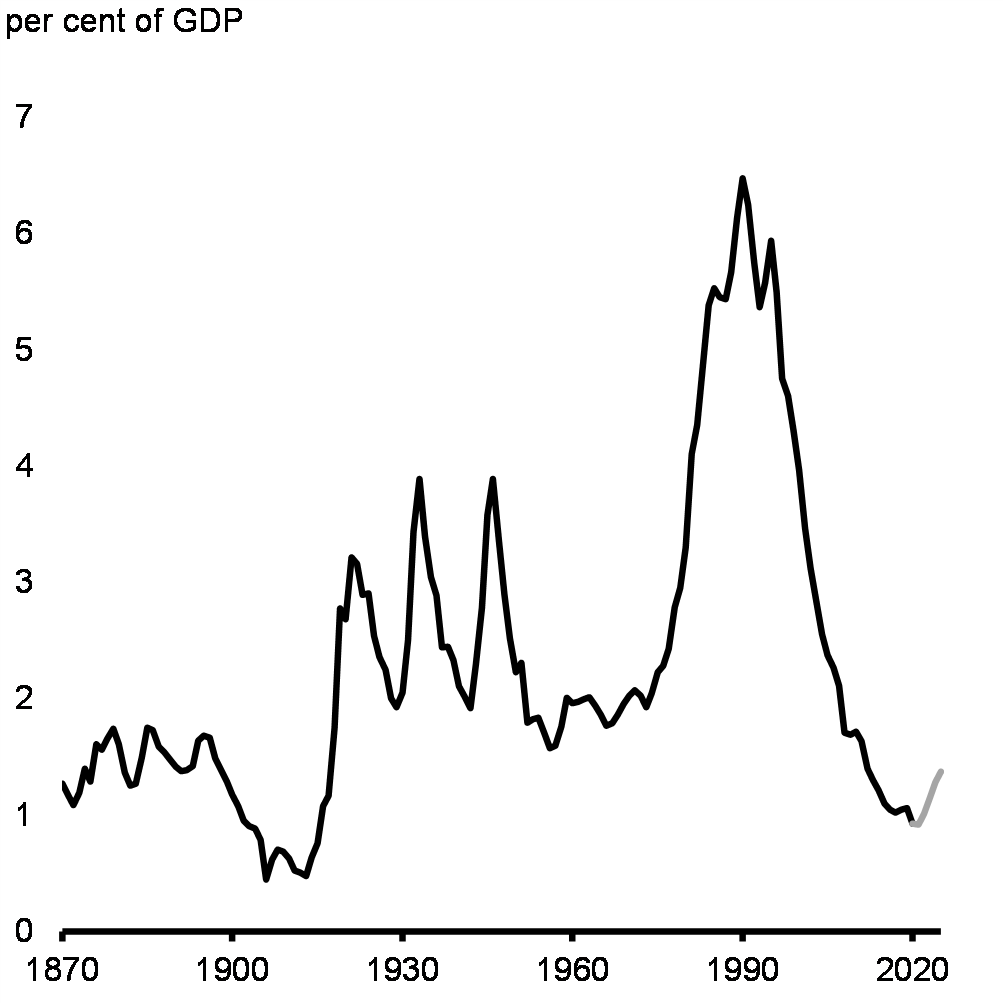
Notwithstanding the sharp increase in the federal debt-to-GDP ratio, public debt charges are projected to remain historically low. Despite recent increases in interest rates in Canada and elsewhere due to a stronger and faster-than-expected recovery (Chart 43), public debt charges as a per cent of GDP are expected to stay near their lowest level in over a century over the forecast horizon (Chart 44).
Federal Debt
Budgetary Balance
10-Year Yields on Government of Canada Bonds
Public Debt Charges, 1870-71 to 2025-26
Building a stronger and more resilient economy will improve fiscal sustainability
In the current low-interest rate environment, growth-enhancing investments can help improve fiscal sustainability by raising GDP growth more than they raise costs in terms of increased debt service over the longer term. Budget 2021 is a plan that uses public investment to address these challenges head-on, by making investments in key measures that will drive future growth and prosperity, including:
- Building Opportunities and Investing in People: Budget 2021 aims at making it easier for parents to fully participate in the labour market by introducing a National Early Learning and Child Care Plan. The addition of 240,000 workers in the labour force stemming from greater access to high quality day care could raise real GDP by as much as 1.2 per cent over the next two decades, boosting real GDP growth by 0.05 p.p. per year over that period. This is one of the most significant actions taken since the introduction of North American Free Trade Agreements to expand economic opportunity for Canadians.
- Connecting People and Businesses and Unleashing Innovation: Budget 2021 supports investments in infrastructure, including public transit and trade infrastructure, and supports firms, particularly SMEs, in innovating and investing in technology so that they grow and take advantage of the new opportunities. Efforts to boost the productivity of Canadian workers will pay long-term dividends. For instance, working to reduce Canada’s productivity gap with the U.S. by just one tenth could raise real GDP by 3 per cent over the next two decades, boosting real GDP growth by 0.15 p.p. per year over that period.
While no single initiative in this budget accomplishes the government’s mission, the potential payoff from acting now in a broad range of policy areas is substantial, as measures tend to reinforce themselves over time and build momentum for further action to boost Canada’s growth trajectory.
Investing to Grow the Economy
Long-term fiscal and economic projections can help assess whether the current fiscal policy trajectory is sustainable or whether fiscal policy adjustments are required. These estimates are not predictions of the future, but useful indicators of how economic and fiscal variables interact under specific conditions and assumptions.
They also help to illustrate that Canada’s long-term fiscal sustainability depends not only on sound fiscal policies as exemplified through a declining debt-to-GDP ratio but also on strong economic policies and growth enhancing investments that contribute to sustained increases in economic growth over the longer term.
Impact of Higher Economic Growth Scenarios on Federal Debt

Report a problem on this page
- Date modified: