This page has been archived on the Web
Information identified as archived is provided for reference, research or recordkeeping purposes. It is not subject to the Government of Canada Web Standards and has not been altered or updated since it was archived. Please contact us to request a format other than those available.
Economic and Fiscal Overview: Progress for the Middle Class
Introduction
The Canadian economy is growing stronger. Supported by the Government's actions and fiscal measures such as investments in infrastructure, the middle class tax cut and the Canada Child Benefit, the pace of economic growth is forecast to pick up in 2017.
While economic growth is projected to strengthen, a number of domestic and global developments confirm the importance of the targeted investments that the Government is making to enhance Canada's long-term growth potential. Budget 2017 continues the Government's plan to invest in the middle class and in the long-term productive capacity of the Canadian economy.
Budget 2017 also demonstrates the Government's commitment to sound fiscal management—balancing the need to make targeted investments to support economic growth while preserving Canada's low-debt advantage for current and future generations.
Notes: This section incorporates data available up to and including March 15, 2017, unless otherwise indicated. All rates are reported at annual rates unless otherwise noted.
The Canadian Economy Is Showing Resilience
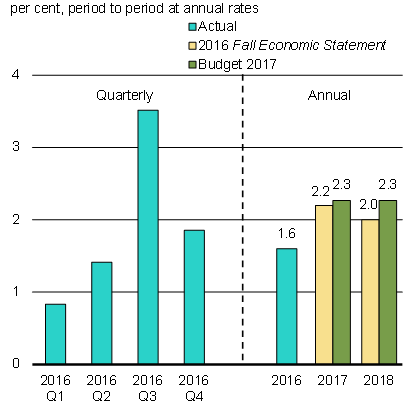
Economic growth in Canada strengthened notably in the second half of last year, in part reflecting a rebound in oil production following the Fort McMurray wildfires (Chart 1). Stronger growth was fuelled by solid consumer spending, and bolstered by an easing of cuts to investment in the oil and gas sector. Canada's economy is proving its resilience, supported by accommodative monetary policy and the Government's fiscal measures. Non-oil-related sectors in particular have remained firm, growing by over 3 per cent since the end of 2014.
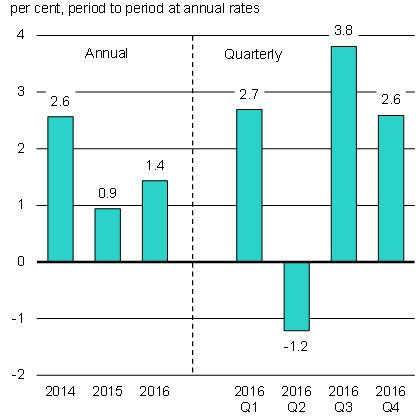
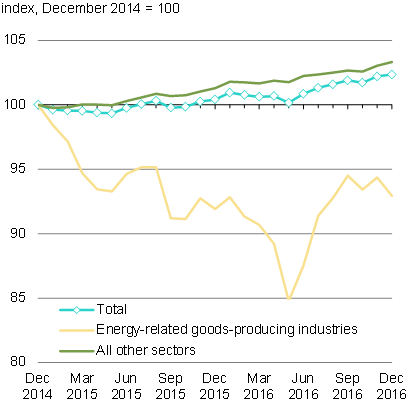
Sources: Statistics Canada; Department of Finance Canada calculations.
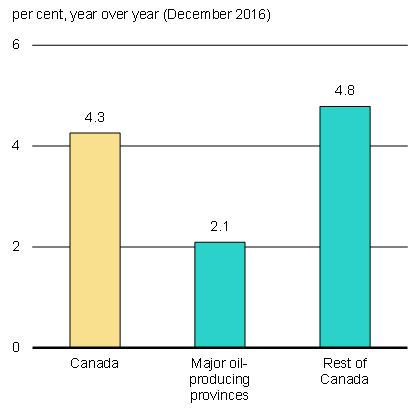
Employment has continued to rise overall since the end of 2015. Relative weakness in major oil-producing provinces has been offset by job gains in the rest of the country (Chart 2). Encouragingly, most job losses in major oil-producing provinces occurred prior to mid-2016, with employment broadly stabilizing in the latter half of last year. Employment in the oil and gas sector itself in these provinces has increased by about 10,000 since July 2016. Since December 2015, total employment in Canada has risen by an average of over 20,000 jobs per month—the strongest pace of job growth since 2012—and the unemployment rate has fallen from 7.1 per cent to 6.6 per cent. Indeed, in the last seven months, the Canadian economy has created a quarter million new jobs. Moreover, most of the recent net job gains have been in full-time positions, a trend that was common across many provinces. This is a positive sign that the Government's investments are starting to benefit the economy.
Sources: Statistics Canada; Department of Finance Canada calculations.
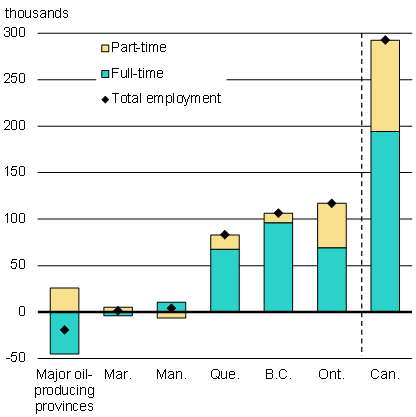
Sources: Statistics Canada; Department of Finance Canada calculations.
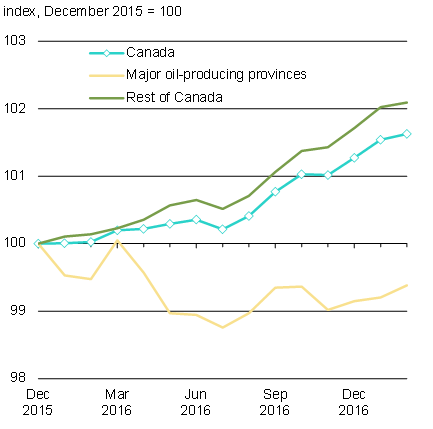
Household spending continued to grow at a solid pace in 2016, supported by still-low interest rates and continued gains in disposable incomes, due in part to the introduction of the middle class tax cut and the Canada Child Benefit (CCB). These measures have played a material role in supporting household spending (Chart 3). Although consumption has been driven by non-oil-producing provinces, retail trade in Alberta has shown indications of picking up since July 2016. The CCB, which came into effect in the third quarter of 2016, will continue to support economic growth across the country over the coming quarters.
Sources: Statistics Canada; Department of Finance Canada calculations.
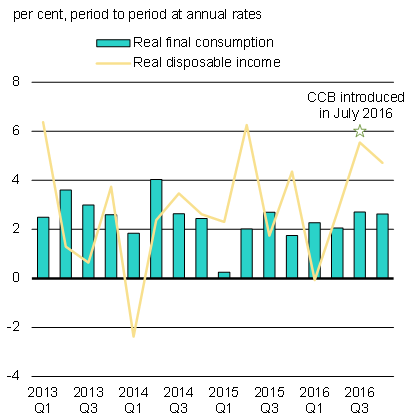
Sources: Statistics Canada; Department of Finance Canada calculations.
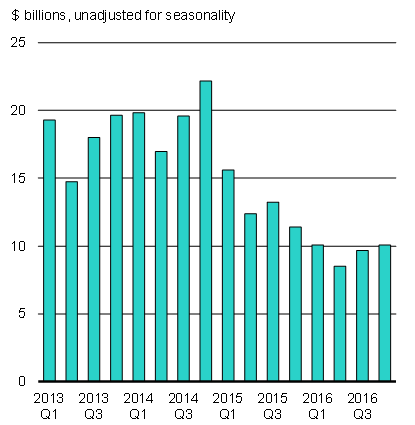
Canadian families will receive approximately $23 billion in Canada Child Benefit (CCB) payments during the 2016–17 benefit year. This is providing a boost to economic activity.
Moreover, the CCB is making a real difference in the lives of millions of families with children.
For example: Samantha earns $30,000 a year and is a single mother living in Victoria with her four-year-old son, Jake. Since CCB payments began in July 2016, she has been receiving $533 per month, tax-free. In the 2016–17 benefit year, she will receive total CCB payments of $6,400 (which is almost $1,470 more than she would have received under the previous system of child benefits).
This will help Samantha buy Jake a new bike and bike helmet, and help with the cost of day camps this summer.
By eliminating tax breaks and benefits for Canada's wealthiest families, the Government is able to provide additional support to families like Samantha's.
Oil and gas investment activity is expected to stabilize in 2017 (Chart 4). By 2018, it is expected that higher capital expenditures required to sustain output for existing oil sands projects, along with increased drilling of conventional wells, should result in additional investment in the sector.
That said, oil prices are expected to remain relatively low (for example, current futures contracts suggest prices could remain around US$50 over the next five years), reflecting persistently high U.S. crude oil inventories, the potential for increased output from U.S. shale oil producers, concerns over the durability of the Organization of the Petroleum Exporting Countries production cuts, and a weak overall global economic environment.
Source: Statistics Canada
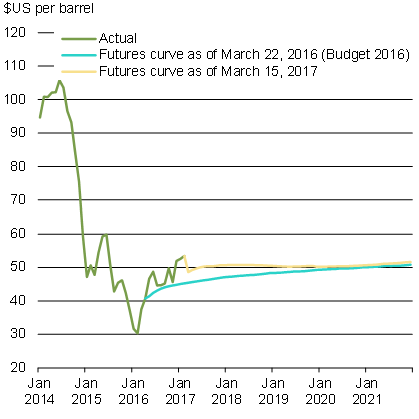
Source: Commodity Research Bureau.
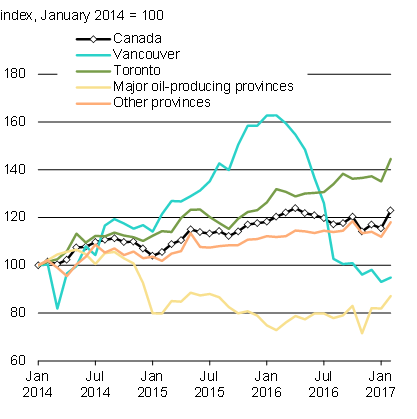
Canada's housing market continued to be marked by four distinct regional patterns in 2016. The most notable developments have taken place in the Vancouver market, where sales dropped sharply between March and August 2016. However, this drop followed a sharp run-up in sales and prices between June 2015 and January 2016. During this latter period, year-over-year growth in housing sales reached 40 per cent, while house price growth peaked at over 30 per cent. Despite the decline, sales volumes in Vancouver remain close to their average pace over the 2010 to 2014 period.
Resale housing market activity continues to be very strong in Toronto and its surrounding areas. This strong demand, in the face of relatively flat supply growth, has resulted in a notable acceleration in price gains since late 2015. In major oil-producing provinces, the housing market is generally soft, though Alberta has shown signs of picking up in recent months. The market is more positive elsewhere (Chart 5).
Source: Multiple Listing Service, Canadian Real Estate Association.
Sources: Statistics Canada; Department of Finance Canada calculations.
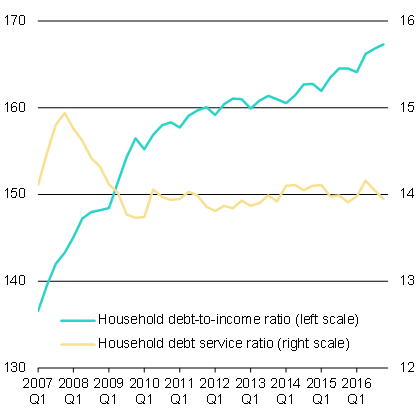
Rising house prices in some markets has coincided with rising household debt. The household debt-to-income ratio continued to trend upward in 2016, as did the share of highly indebted households in many Canadian cities.
The purchase of a home often represents the single largest investment an individual will make in their lifetime. Canadians deserve to feel confident that this significant investment will be protected. To protect the long-term financial security of Canadians, the Government introduced measures in October 2016 to ensure that prospective homebuyers are only taking on mortgages that they can continue to afford even if interest rates rise or their income falls.
These measures are expected to have a modest, temporary impact on housing market activity in the short run. In the long run, they will help to make Canadian homeowners less vulnerable to changes in economic circumstances, and make home ownership more affordable for more Canadians.
Across the country, many middle class families looking to buy their first home see prices climbing, often out of their reach. Those who already own their homes want to know that the market is stable and that their most important investment is safe.
That's why the Government has taken decisive policy action to ensure a healthy and stable housing market, and continues to work with federal agencies as well as provinces and municipalities to ensure the housing needs of Canadian families are met.
In the summer of 2016 the Government created a working group comprised of federal, provincial and municipal officials. The group found that there were important gaps in current nationwide housing data, including the degree of foreign ownership, and in other areas such as detailed geographical data on homeowner demographic and financing characteristics.
Budget 2017 proposes to address these data gaps by providing $39.9 million to Statistics Canada over five years to develop and implement the Housing Statistics Framework (HSF). The HSF builds on the Government's Budget 2016 commitment to develop methods for gathering data on foreign homebuyer activity.
The HSF will leverage existing data from provincial-territorial land registries, property assessment programs and administrative records to create a nationwide database of all residential properties in Canada, and provide up-to-date data on purchases and sales. Statistics Canada will begin publishing initial data in the fall of 2017.
The HSF will represent a significant jump forward in the quality and type of housing data available and will yield significant ongoing benefits by enhancing the ability of housing participants, commentators and policy-makers to monitor and analyze the housing market.
The International Monetary Fund expects that global growth will accelerate from 3.1 per cent in 2016 to 3.4 per cent in 2017. China's economy continues to expand at a robust pace. In Russia and Brazil, economic conditions are improving as recessions related to the oil shock and political uncertainty ease. Euro area growth remains steady, but modest.
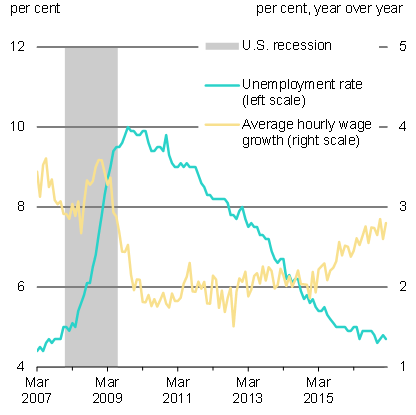
The U.S. economy strengthened in the second half of 2016 after a disappointing start to the year, and is expected to continue expanding at a relatively healthy pace (Chart 6).
Sources: U.S. Bureau of Labor Statistics; U.S. National Bureau of Economic Research.
Private sector forecasts for short-term U.S. growth and inflation have been revised upward since the November presidential election, owing largely to expected tax cuts, infrastructure spending and energy sector deregulation. The Government continues to engage with the new U.S. Administration, and to carefully monitor progress with respect to the form, scale and timing of proposed measures as well as U.S. trade policy.
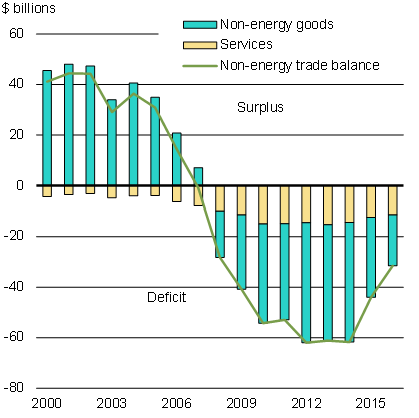
Despite the recent improvement in U.S. growth, U.S. goods imports have been relatively flat since early 2015, which has weighed on Canadian non-energy goods exports (Chart 7). Export categories that have historically been more sensitive to exchange rate movements—such as motor vehicle engine and parts manufacturing, the lumber industry and industrial machinery manufacturing—have generally performed better over the last two years. However, this has not resulted in as strong a boost to Canadian export growth as in the past, in part because the currencies of some of Canada's competitors have depreciated by even more than the Canadian dollar versus the U.S. dollar. As a result, Canada maintained a significant trade deficit in non-energy goods and services with the United States in 2016.
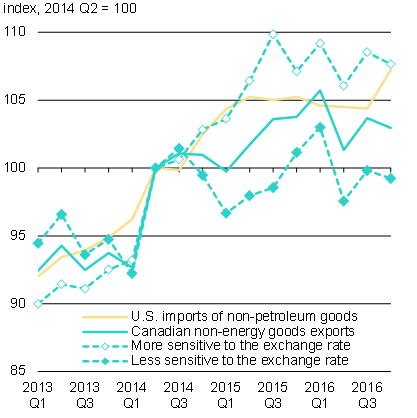
Sources: Statistics Canada; U.S. Bureau of Economic Analysis; Bank of Canada; Department of Finance Canada calculations.
Sources: Statistics Canada; Innovation, Science and Economic Development Canada; Department of Finance Canada calculations.
Expectations of stronger U.S. growth, in particular as a result of anticipated fiscal measures in that country, have led to expectations of higher inflation going forward, in turn resulting in a rapid uptick in government bond yields in late 2016 (Chart 8). Meanwhile, equity markets in advanced economies have continued to reach new highs, buoyed by solid current and expected earnings growth.
Overall, global financial conditions remain supportive of economic activity. Nonetheless, a number of uncertainties and risks could result in renewed financial market volatility, including high and rising debt levels in China, and the potential for sharp capital outflows from emerging markets.
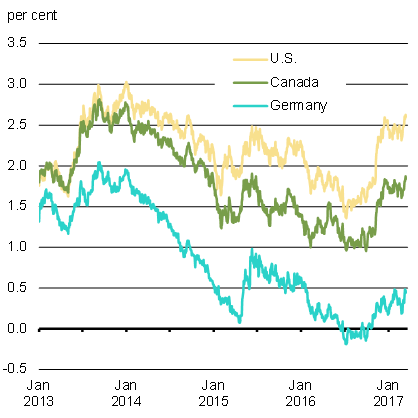
Source: Bloomberg.
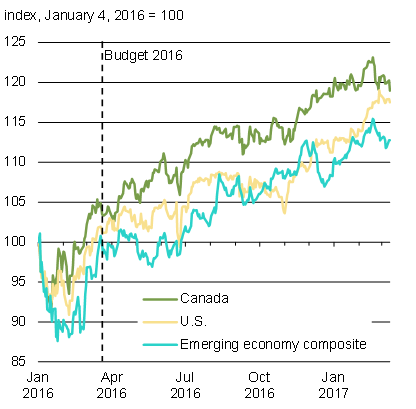
Source: Haver Analytics.
Private Sector Outlook
The fiscal projections contained in this budget are based on the December 2016 survey of private sector economists. In the December survey, forecasters expected growth to rise from 1.3 per cent in 2016 to close to 2 per cent in both 2017 and 2018, broadly in line with expectations at the time of the 2016 Fall Economic Statement—however, the group also revised growth expectations downward modestly thereafter. As a result, the forecasters expected real GDP growth of 1.7 per cent per year, on average, over the 2016–2021 forecast period—down slightly from 1.8 per cent per year projected in the Fall Economic Statement. Details of the full private sector economic outlook are presented in Annex 1.
In the December survey, growth in nominal GDP—the broadest measure of the tax base—averages 3.5 per cent per year over the forecast horizon, compared to 3.7 per cent in the Fall Economic Statement. As a result, the level of nominal GDP is $6 billion lower per year, on average, than was anticipated in the Fall Economic Statement (Table 1).
Risk Assessment
The fourth-quarter Canadian Economic Accounts results were slightly better than expected in the December survey, and suggest firmer economic momentum heading into 2017. While fourth-quarter data suggest some upside risk to the December private sector survey, uncertainty and risk continue to weigh on the domestic and global economy.
For the global economy, there remains uncertainty around key elements of U.S. economic, fiscal and trade policy. In Europe, the timing and form of the U.K.'s withdrawal from the European Union are not yet clear and there are concerns over the future of cross-border integration in Europe, especially given the upcoming elections in France and Germany. In China, the pace of rebalancing toward a more consumer-driven and sustainable growth model remains slow and risks are rising, including the country's high and fast-rising corporate debt and ongoing capital outflows.
For Canada, risks to the economic outlook are still highly contingent on the state of the world economy. On the downside, oil prices could disappoint in the near term should supply rise further, Canadian export growth could remain modest, and possible U.S. policy actions affecting trade could restrain exports to the U.S. even further. Weaker-than-expected global growth, as well as further depreciation of the currencies of Canada's competitors, could also dampen Canadian export prospects. Domestically, Canadian households' high debt levels still represent a key risk to housing and consumer spending, especially if the economy were to face slower income growth.
On the upside, growth in the U.S. could be stronger than expected given indications of a more expansionary fiscal policy. Oil prices could also be higher than expected in the medium term if demand strengthens more than expected, which would lead to higher income and investment in Canada.
Overall, the risks to the December 2016 economic outlook remain broadly balanced, and the outlook is an appropriate basis for fiscal planning.
| 2016 | 2017 | 2018 | 2019 | 2020 | 2021 | 2016–
2021 |
|
|---|---|---|---|---|---|---|---|
| Real GDP growth | |||||||
| Budget 2016 | 1.4 | 2.2 | 2.2 | 2.0 | 1.9 | – | – |
| 2016 Fall Economic Statement | 1.4 | 2.1 | 1.8 | 1.8 | 1.8 | 1.9 | 1.8 |
| Budget 2017 | 1.3 | 1.9 | 2.0 | 1.7 | 1.7 | 1.8 | 1.7 |
| Nominal GDP growth | |||||||
| Budget 2016 | 2.3 | 4.6 | 4.3 | 4.2 | 4.1 | – | – |
| 2016 Fall Economic Statement | 2.0 | 4.3 | 3.7 | 4.0 | 3.9 | 4.0 | 3.7 |
| Budget 2017 | 2.0 | 4.1 | 4.0 | 3.5 | 3.8 | 3.8 | 3.5 |
| Nominal GDP level (billions of dollars) | |||||||
| Budget 2016 | 2,033 | 2,126 | 2,218 | 2,310 | 2,404 | – | – |
| 2016 Fall Economic Statement | 2,026 | 2,114 | 2,191 | 2,279 | 2,368 | 2,463 | – |
| Budget 2017 | 2,025 | 2,109 | 2,194 | 2,271 | 2,357 | 2,447 | – |
| Difference between 2016 Fall Economic Statement and Budget 2017 | -1 | -5 | 3 | -8 | -11 | -16 | -6 |
Economic and Fiscal Developments
Economic and year-to-date developments since the 2016 Fall Economic Statement (FES 2016) have improved the outlook for the budgetary balance over the next four years, ranging from $3.2 billion in 2016–17 to $1.0 billion in 2019–20, while lowering it by $0.4 billion in 2020–21 and $0.7 in 2021–22. A more detailed summary of changes to the fiscal outlook since FES 2016 is provided in Annex 1.
| Projection | ||||||
|---|---|---|---|---|---|---|
| 2016– 2017 |
2017– 2018 |
2018– 2019 |
2019– 2020 |
2020– 2021 |
2021– 2022 |
|
| FES 2016 budgetary balance | -25.1 | -27.8 | -25.9 | -19.3 | -16.8 | -14.6 |
| Economic and fiscal developments since FES 20161 | 3.2 | 2.4 | 1.9 | 1.0 | -0.4 | -0.7 |
| Revised budgetary balance before Budget 2017 measures (policy actions and investments) | -21.8 | -25.4 | -24.0 | -18.3 | -17.3 | -15.3 |
Continued Investments in a Strong Middle Class
Budget 2017 builds on the Government's previous actions, and proposes smart, targeted investments that will help create the conditions required to foster economic growth, and grow the middle class. The net fiscal costs of Budget 2017 proposals are shown in Table 3 below.
Canada's net debt-to-GDP ratio remains the lowest of any Group of Seven (G7) country. The Government continues to believe that fiscal policy has an important role to play in delivering stronger economic growth today and in expanding the economy's growth potential over the long term, while maintaining Canada's low-debt advantage. The responsible spending proposed in Budget 2017 recognizes that more must be done to create opportunities for middle class families to succeed.
| Projection | ||||||
|---|---|---|---|---|---|---|
| 2016– 2017 |
2017– 2018 |
2018– 2019 |
2019– 2020 |
2020– 2021 |
2021– 2022 |
|
| Revised budgetary balance before policy actions and investments | -21.8 | -25.4 | -24.0 | -18.3 | -17.3 | -15.3 |
| Policy actions since FES 20161 | 0.0 | -0.3 | -0.1 | -0.2 | -0.2 | -0.2 |
| Investments in Budget 2017 | ||||||
| Skills, Innovation and Middle Class Jobs | -0.1 | -1.2 | -1.8 | -1.8 | -1.8 | -1.6 |
| Communities Built for Change | 0.0 | 0.0 | -3.4 | -5.2 | -5.7 | -6.3 |
| A Strong Canada at Home and in the World | -0.2 | -0.9 | -1.4 | -1.9 | -2.0 | -1.8 |
| Tax Fairness for the Middle Class | 0.0 | 0.4 | 0.8 | 1.0 | 1.1 | 1.4 |
| Other2 | -0.9 | 0.3 | 0.3 | 0.2 | 0.3 | 0.1 |
| Total investments in Budget 2017 | -1.2 | -1.3 | -5.4 | -7.6 | -8.1 | -8.2 |
| Less funds existing in the fiscal framework, sourced from departmental resources, or projected revenues | 0.0 | 1.5 | 5.2 | 5.7 | 6.8 | 7.9 |
| Net fiscal impact of investments in Budget 2017 | -1.2 | 0.2 | -0.2 | -1.9 | -1.3 | -0.4 |
| Total policy actions and investments | -1.2 | -0.1 | -0.3 | -2.1 | -1.5 | -0.5 |
| Budgetary balance (without risk adjustment) | -23.0 | -25.5 | -24.4 | -20.4 | -18.7 | -15.8 |
| Federal debt (per cent of GDP) (without risk adjustment)3 | 31.5 | 31.4 | 31.3 | 31.1 | 30.8 | 30.3 |
| Adjustment for risk | -3.0 | -3.0 | -3.0 | -3.0 | -3.0 | |
| Final budgetary balance | -23.0 | -28.5 | -27.4 | -23.4 | -21.7 | -18.8 |
| Federal debt (per cent of GDP)3 | 31.5 | 31.6 | 31.6 | 31.5 | 31.3 | 30.9 |
Budget 2017 includes an adjustment for risk of $3.0 billion in 2017–18 and future years, to account for risks and uncertainty in the economic and fiscal forecast. To improve transparency, the risk adjustment has not been applied to the level of nominal GDP in the private sector forecast (reducing government revenues). Rather, the adjustment is being applied directly to the budgetary balance.
Investing in Priorities
The Government is committed to making smart, necessary investments in the economy to ensure a thriving middle class, and remains committed to a responsible approach to fiscal management that maintains Canada's low-debt advantage.
As a first step towards meeting this commitment, Budget 2016 announced annual reductions of $221 million in professional services, travel and government advertising.
Budget 2017 announces that the Government will initiate three new expenditure management initiatives:
1) In 2017–18, the Government will begin a comprehensive review of at least three federal departments, to be determined following Budget 2017, with the aim to eliminate poorly targeted and inefficient programs, wasteful spending, and ineffective and obsolete government initiatives.
2) The Government will initiate a three-year horizontal review of federal fixed assets, staged by asset-type—e.g., engineering assets, science facilities, etc. A comprehensive review of government fixed assets has not been completed in decades. The Government spends roughly $10 billion annually to purchase, construct, renovate, repair, maintain and operate both owned and leased capital assets. This review will look to identify ways to enhance or generate greater value from government assets.
3) The Government will initiate a horizontal review of all federal innovation and clean technology programs across all departments, as federal innovation programs are dispersed. Consistent with the principles of Canada's new Innovation and Skills Plan (discussed in Chapter 1), the horizontal review will look to simplify programming and better align resources to improve the effectiveness of innovation programs.
Over the coming year, the President of the Treasury Board and Minister of Finance will lead these reviews of departmental spending to improve the delivery of results, increase efficiency and ensure better alignment with priorities. The Government will report on the progress of these reviews in Budget 2018.
As mentioned in the 2016 Fall Economic Statement, the Government will introduce legislation to: establish the Parliamentary Budget Officer as an independent Officer of Parliament, with a renewed mandate to focus on costing and financial analysis of the federal government; and bring to an end the secrecy surrounding the Board of Internal Economy.
The Government will also introduce legislative changes to improve the organization and efficiency of government operations, as needed.
The total value of new proposals announced in Budget 2016 was $11.6 billion in 2016–17. This investment was expected to boost real economic activity by 0.5 per cent in the first year of implementation, reflecting increased government expenditure on infrastructure, new programs, as well as increased transfers to households.
These initiatives are mostly on track (Table 4). Measures for middle- and low-income households (such as the Canada Child Benefit) as well as personal and corporate income tax measures (such as the middle class tax cut) have been fully implemented.
Complex infrastructure projects involving multiple levels of government and the private sector can see some slippage. Even if measures are not fully expensed as planned in 2016–17, this is not necessarily inconsistent with a higher level of activity (i.e., agreements having been signed with provinces, provinces having engaged firms to conduct work, and work having commenced). For example, Infrastructure Canada often makes payments to other jurisdictions with a lag once projects are finished or milestones reached.
Overall, the anticipated boost to real economic activity in the first year of Budget 2016 implementation remains broadly in line with expectations at the time of the budget, with the revised impact on real GDP now estimated at 0.4 per cent in the first year of implementation.
| Implementation status indicator1 (proportion of planned investments that are on track) |
2016–17 | |
|---|---|---|
| Housing investment measures | 75% to 100% | 1,359 |
| Infrastructure investment | 50% to 75% | 3,967 |
| Personal income tax measures | 75% to 100% | -1,345 |
| Measures for middle- and low-income households | 75% to 100% | 5,591 |
| Other spending measures | 75% to 100% | 2,100 |
| Corporate income tax measures | 75% to 100% | -102 |
| Total | 11,570 |
Upside and Downside Risks to the Economic and Fiscal Outlook
The fiscal projections presented in Budget 2017 are based on an average of the December survey of private sector forecasters. Based on this consensus view, the federal debt-to-GDP ratio (without risk adjustment) will be 30.3 per cent by 2021–22. Economists surveyed in December, however, offered a wide range of views regarding future economic growth and, therefore, the path of nominal GDP (the broadest measure of the tax base). Changes in economic growth assumptions can also have large impacts on the budgetary balance and debt-to-GDP profile over an extended projection horizon (Charts 9 and 10).
For example, if the Government were to base current fiscal projections on the average of the four highest individual forecasts for nominal GDP—which is equivalent to nominal GDP growth being 0.5 percentage points higher per year, on average, than in the full December survey—the budgetary balance would improve by $5.8 billion per year on average (Chart 9). This would result in a federal debt-to-GDP ratio of 28.4 per cent by 2021–22 (Chart 10). Conversely, basing fiscal projections on the average of the four lowest individual forecasts for nominal GDP—which is equivalent to nominal GDP growth being 0.5 percentage points lower per year, on average, than in the full December survey—the budgetary balance would worsen by $6.2 billion per year, on average, and the federal debt-to-GDP ratio would be 2 percentage points higher by 2021–22.
Federal Budgetary Balance Under Various Economic Growth Scenarios
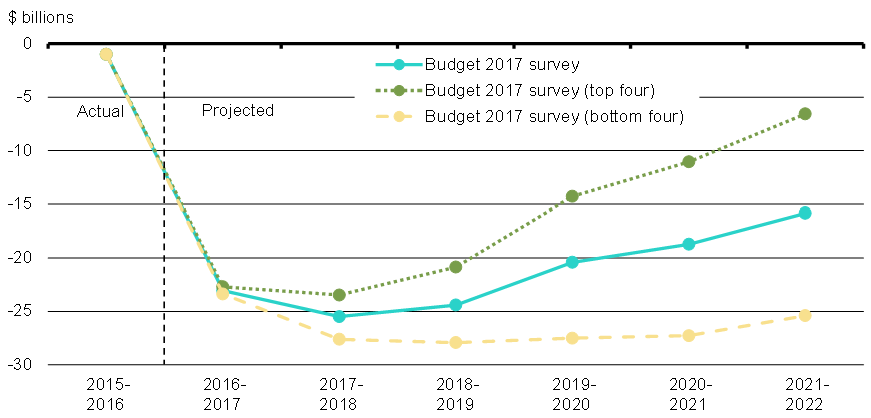
Sources: Department of Finance Canada survey of private sector economists; Department of Finance Canada calculations.
Federal Debt-to-GDP Ratio Under Various Economic Growth Scenarios
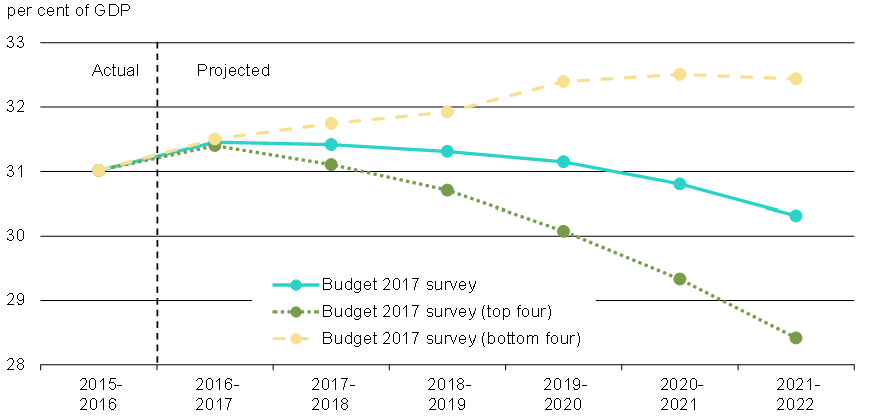
Sources: Department of Finance Canada survey of private sector economists; Department of Finance Canada calculations.
Revitalizing the Economy With Investments to Grow the Middle Class
Budget 2017 takes the next step in a long-term approach to create jobs and strengthen the middle class. By focusing on innovation, skills, partnerships and fairness, the Government is committed to securing a more prosperous future for all Canadians.
Canada's future success depends on building an economy that is as inclusive as it is innovative. The Government's long-term plan to grow the economy will only succeed when everyone benefits from the opportunities that result.
Moving forward, the Government will continue to follow its long-term economic plan, making the investments in the economy that are necessary to ensure a thriving middle class, while continuing to protect our fiscal position.