Introduction - A New Approach
In 2015, Canadians were presented with a plan for real change.
David and Neera are two Canadians looking for that change.
David grew up in Canada and has seen the sense of optimism for his family's future—one enjoyed by his parents and grandparents—steadily erode. Though he loved the community he lived in as a child, when it came time to buy his own family home, he had to look elsewhere. His old neighbourhood simply wasn't affordable.
Neera came to Canada as a student. But she worries about whether they will be able to afford to send their own children to university. Paying for the basics is sometimes tough, even though she and David both work full-time.
Canadians like David and Neera are willing to work hard to build a better future for themselves and their children, and they want a government that will work with them to make that goal a reality.
Budget 2016 is a clear step toward that future. It offers immediate help to those who need it most, and lays the groundwork for sustained, inclusive economic growth that will benefit families like David and Neera's in the years to come.
Most important, Budget 2016 focuses squarely on Canadians and the things that matter most to them. Things like growing the economy, creating jobs, strengthening the middle class and helping those working hard to join it.
Every Canadian deserves a real and fair chance at success. Budget 2016 delivers the first steps in that promise—for David, Neera and all Canadians.
The Promise of Progress
For generations, Canadians worked hard, secure in the belief that their hard work would be rewarded. They trusted that in exchange for their honest efforts, they would realize greater opportunities for themselves, and for their families.
Older Canadians, young Canadians, new Canadians—all believed that with hard work, everyone could build a better life: find a job, get an education, build a family.
It was an era of optimism, an era of new scientific discovery and economic growth, and a time of nation-building. Projects that needed the vision and leadership of government came to life. From the Canadian Pacific Railway opening up the West, to the St. Lawrence Seaway serving as a foundation for prosperity in Ontario and Quebec, to the Trans-Canada Highway, airports, pipelines and canals—these projects enabled Canada to develop its natural resources, power cities, and connect Canadians to each other and the world.
This sense of optimism, paired with government policies that strengthened the middle class, helped to make Canada the country that it is today.
It helped build the many strong communities that Canadians like David and Neera are justly proud to call home.
An Uncertain Future
In the decades since, however, the benefits of economic growth have been shared by fewer and fewer Canadians.
Real Median Wage Income of Canadians, 1976–2015
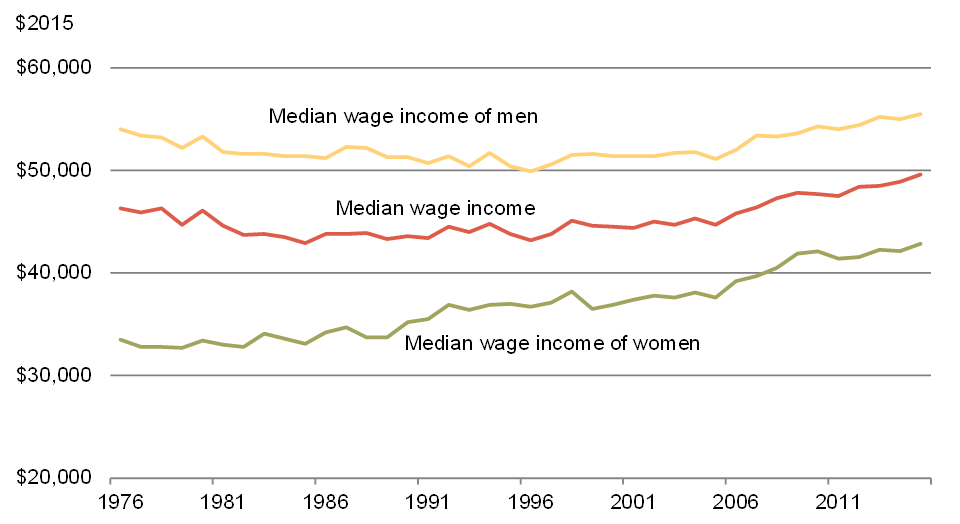
Sources: Statistics Canada; Department of Finance calculations.
Over the past 30 years, the median wage income has barely risen.
For younger Canadians, this unacceptable trend has been a reality for their entire working lives. David, who just turned 40, is finding it difficult to increase his salary without changing jobs or relocating to a different city—something that is less attractive now that his children are in school.
The cost of living for some Canadian families has continued to rise. This is true for things needed today—like healthy food and child care—as well as for post-secondary tuition, something that Canadians rely on for upward mobility.
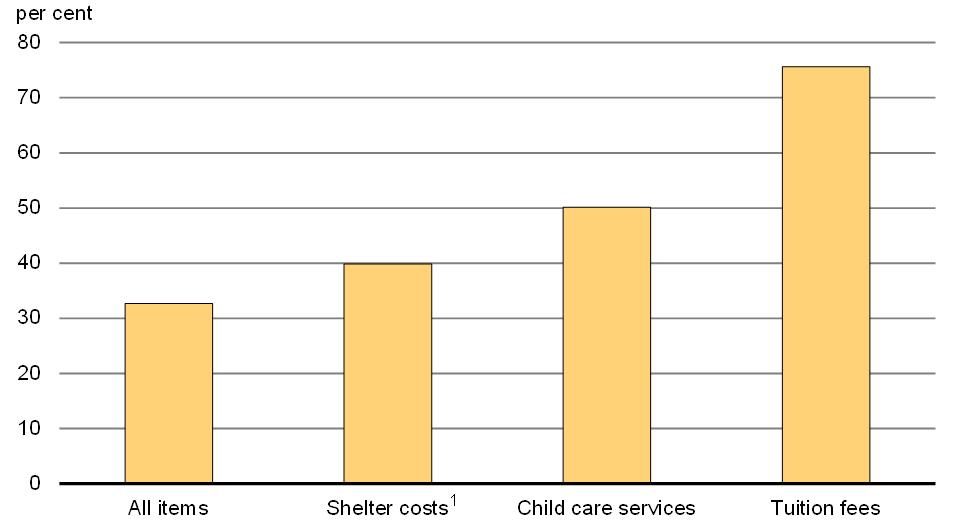
Source: Statistics Canada.
Neera worked hard in school and earned scholarships to help with the cost of her university tuition, but not every student can count on them. Her sister had to take on nearly $30,000 in debt to finish her education, and is still making payments 10 years after graduating from college.
Even though Canadian families have worked hard and are working longer, with flat real wage income, families that face rapidly rising costs are seeing their family budget strained.
Some Canadian families are also taking on more debt to make ends meet. For David and Neera, this debt is a constant source of worry. They took out a line of credit to repair their roof last year, but that necessary repair added to their monthly bills, leaving little room in their budget to save for things like back-to-school clothes and family vacations.
Source: Statistics Canada.
The more that families owe, the harder it is for them to save and plan for their future. As a result, more and more middle class Canadians like David and Neera feel that they are working harder than ever, and not getting any further ahead.
As the ability to pay for their kids' education, for their aging parents' care and for their own retirement diminishes, Canadians are questioning whether the promise of Canadian progress has passed.
The Rise of Inequality
This isn't true for all Canadians, however.
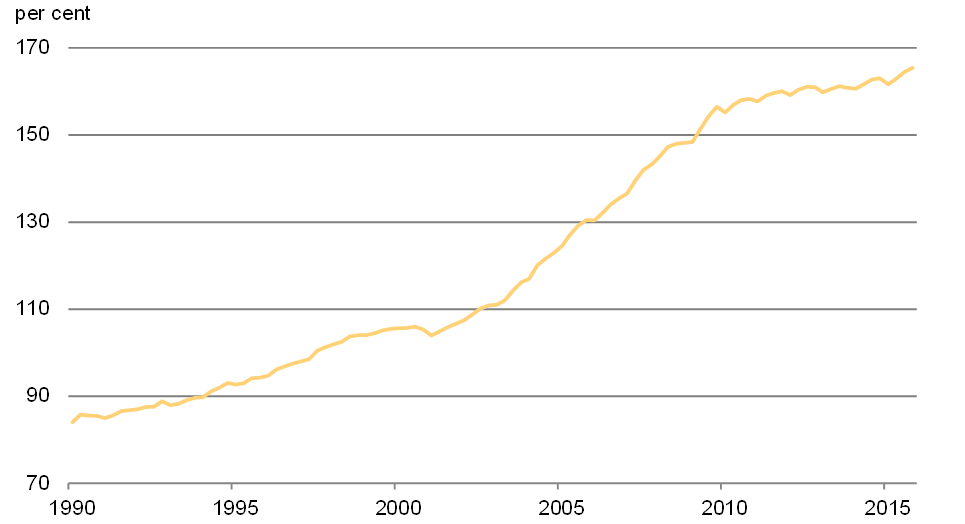
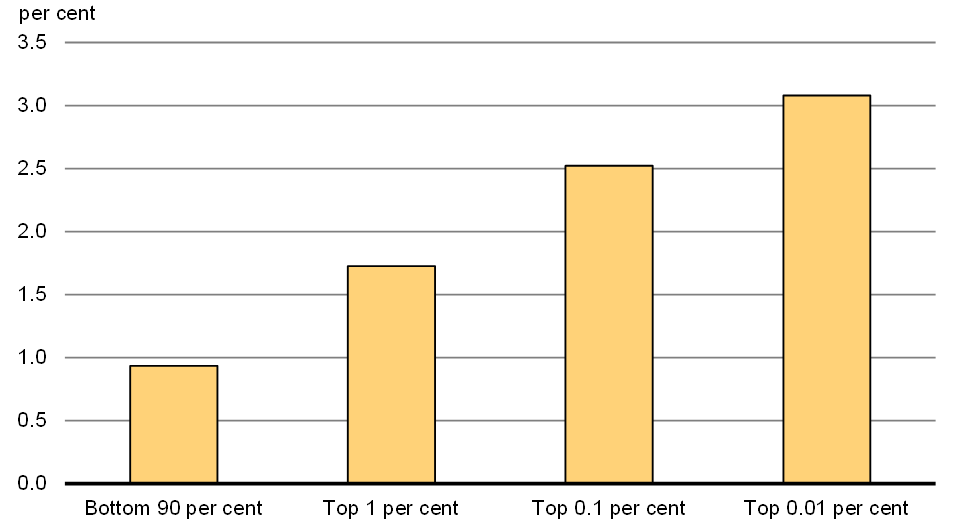
Among the wealthiest 0.01 per cent of Canadians, after-tax after-transfer incomes have risen dramatically in the past 30 years. Individuals earning more than $1.8 million per year have, on average, seen their incomes rise by nearly 156 per cent in that time (or 3.1 per cent per year on average) after taking inflation into account.
Source: Statistics Canada.
The net result is that even though there has been economic growth over the past three decades, it hasn't much benefitted the middle class. Too often, the benefits have been felt only by already wealthy Canadians, while the middle class and those working hard to join it have struggled to make ends meet.
David is grateful to have a full-time job with good benefits, but a lot of the time he feels like he's treading water. Friends who earn more are already talking about when they will retire. David isn't sure if he will be able to retire any time soon.
It's time to invest in growth that will benefit all.
Realizing Change
The need for more inclusive growth is not new. It has long been understood that a strong economy starts with a strong middle class. When middle class Canadians have more money to save, invest and grow the economy, everyone benefits.
When middle class Canadians have confidence in their disposable income, consumer demand is strong and businesses have the confidence to invest.
When middle class Canadians have the ability to save and invest, they have greater confidence in their ability to adapt to unforeseen downturns.
When middle class families are secure in their jobs, they have the ability to invest in the education of their children and save for their retirement.
For example, Neera loves taking her daughters to the Saturday morning market in their neighbourhood. The new middle class tax cut means that she has a few more dollars on her paycheque every two weeks that she and her girls can spend together, supporting local businesses.
With Budget 2016, the Government seeks to restore the confidence that has been missing for too many Canadians, for too long. By listening to Canadians, by putting their interests at the heart of this and future budgets, a better future for all Canadians is possible.
Restoring Hope, Rewarding Hard Work
For decades, Canada succeeded in part because Canadians felt optimistic about the country's future.
That's true for David and Neera's parents. They believed that their hard work would be rewarded with a good standard of living, a secure retirement and better prospects for their children. It's why David's parents worked so hard, why Neera's parents immigrated to Canada and why both families made education such a priority.
It is of vital national interest that this sense of hope and optimism be restored.
The new Government is taking a fundamentally different approach, guided by the things that matter most to Canadians.
Budget 2016 focuses on growth, not austerity. It includes measures that will grow the economy for the benefit of every Canadian.
In an environment of sustained economic weakness and low interest rates, fiscal policy is the right policy lever to use to support long-term growth. Indeed, international organizations, including the International Monetary Fund (IMF) and the Organisation for Economic Co-operation and Development (OECD), have called on countries to make use of available fiscal room.
Investment is needed and the time to invest is now. Smart investments can strengthen and expand the middle class, reduce inequality among Canadians and position Canada for sustained economic growth in the years to come.
Positioning Canada in a Shifting World Economy
In the Canadian economy—and indeed, in economies the world over—dramatic shifts are taking place. Each one has the potential to disrupt economic growth; taken together, they represent both challenges to, and opportunities for, Canada's economy.
One such challenge is a demographic shift. For the first time in Canada's history, there are more seniors over the age of 65 than there are children under the age of 15. Over time, this means that there will be fewer Canadians working to support the overall population. This fact, combined with disappointing productivity gains, will make achieving strong, inclusive growth even more difficult.
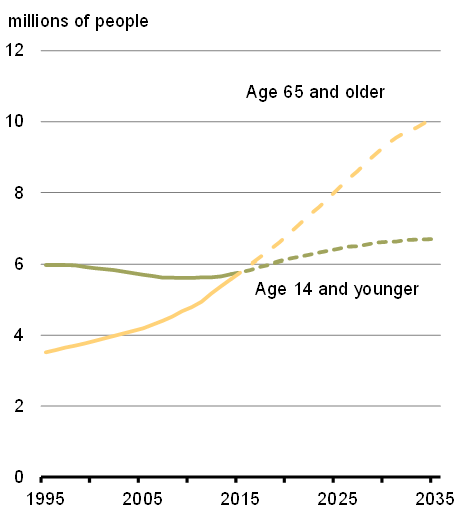
Source: Statistics Canada.
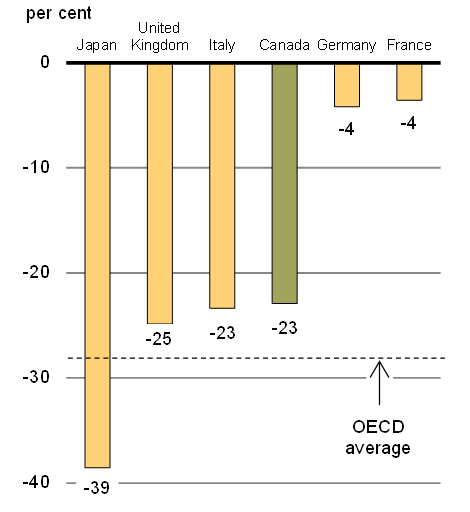
Sources: OECD; Department of Finance calculations.
Managing this demographic shift requires that Canada do more to invest in its next generation, in post-secondary education, and in training and innovation. The standard of living of all Canadians—not just senior Canadians—relies on it.
Global shifts in trade and the uncertain prospects for emerging economies present another challenge. For example, over the past 15 years, Asia's share of the global economy has risen dramatically, a trend that is expected to continue in the short term.
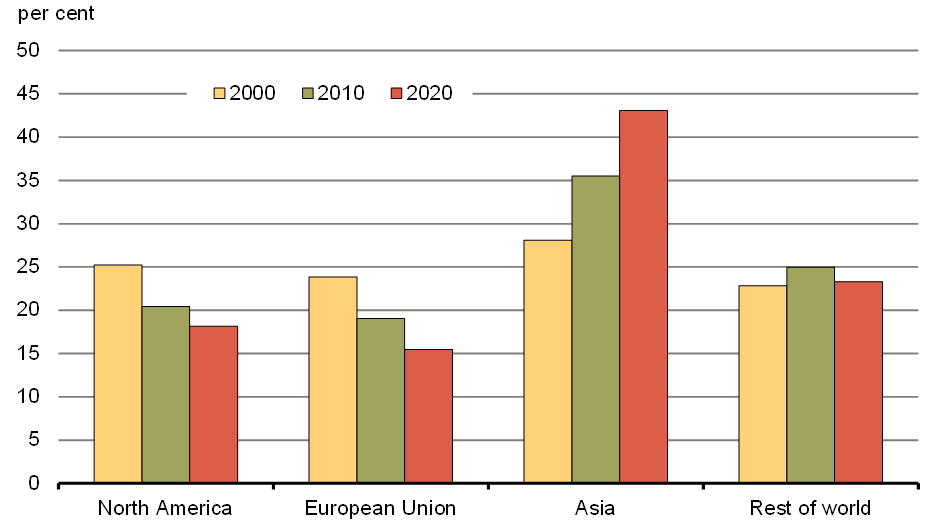
Sources: IMF, October 2015 World Economic Outlook (WEO); Department of Finance calculations.
For Canada, this shift underscores the importance of strengthening economic ties with Asia—but also suggests that any economic shocks in the region will have a bigger effect on the Canadian economy than in the past.
Shifts in technology—toward cleaner economies and more digitally connected ones—also cannot be ignored. Canada can either take advantage of these opportunities or be left behind. For example, over the past decade, global new investment in clean energy has increased fivefold from about US$60 billion in 2004 to almost US$330 billion in 2015.
The Government has a responsibility to make investments that will position Canada for future growth. That means greater investments in the infrastructure that allows Canada to move people and goods, as well as in the skills and technology that make Canada competitive.
It also means that to keep building its workforce, Canada needs to be a welcoming country. This year, Canada intends to welcome more than 300,000 new permanent residents.
And it means taking steps to ensure that Indigenous peoples, Canada's fastest-growing population, are able to prosper and succeed.
A Long-Term Plan for Growth
Budget 2016 recognizes that there are no quick solutions to the challenges facing Canada's economy.
The good news is that Canada is starting from a relatively strong fiscal position in 2016, with the lowest total government net debt-to-GDP (gross domestic product) ratio of all G7 countries.
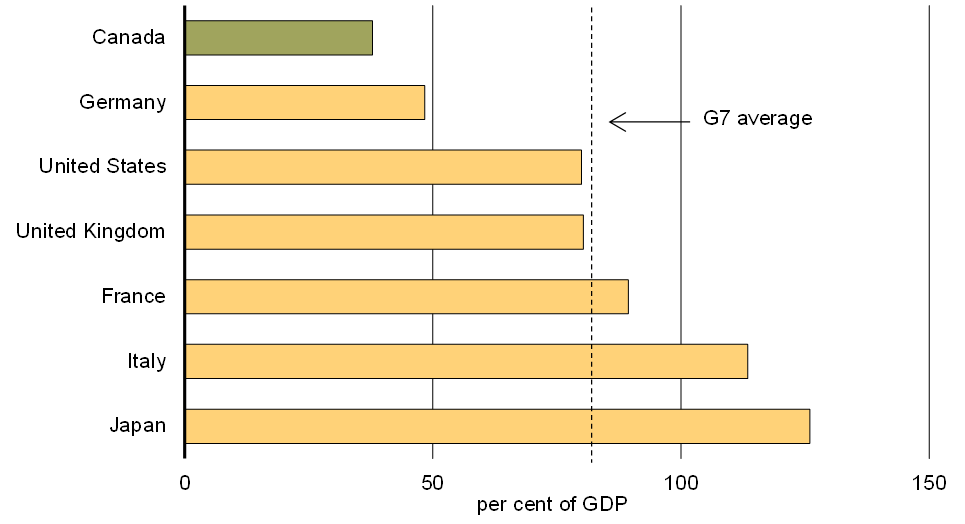
Source: IMF, October 2015 Fiscal Monitor.
This low debt ratio gives the Government room to make strategic investments now that will grow the economy well into the future. Investing in things like better roads and public transit will help David and Neera to get home sooner at the end of a long day—but it will also help to move the people and the products that help grow our economy.
And whether it's expanded public transit or infrastructure that will help mitigate the effects of climate change or build stronger communities that feel like home, David and Neera's daughters will also benefit from these investments, especially if they are made now, when interest rates are at historic lows.
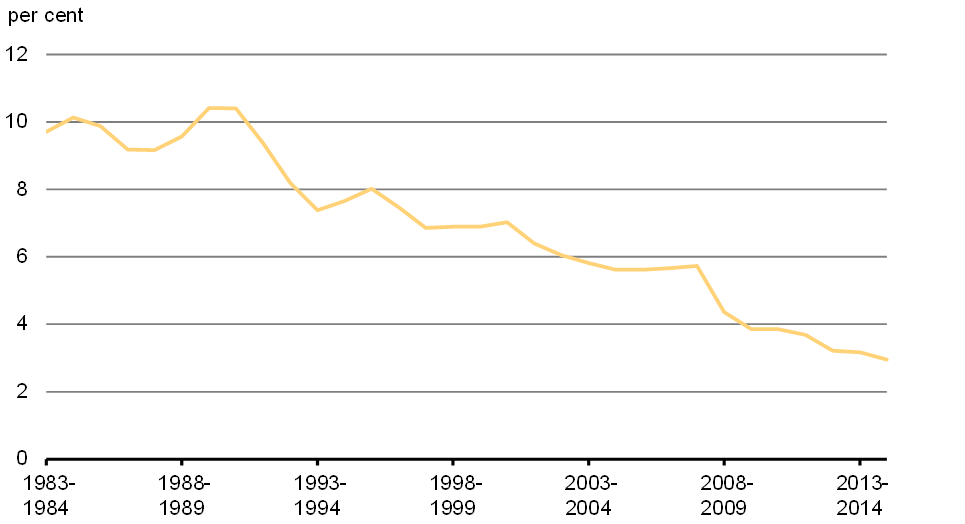
Notes: Effective interest rate is defined as gross public debt charges as a percentage of interest-bearing debt. Last data point is 2014–15 fiscal year.
Source: Department of Finance, Fiscal Reference Tables, September 2015.
When it comes to competing globally, Canada is also well positioned—Canadian workers like David and Neera are highly educated, and Canada's corporate tax rate is one of the lowest among G7 countries.
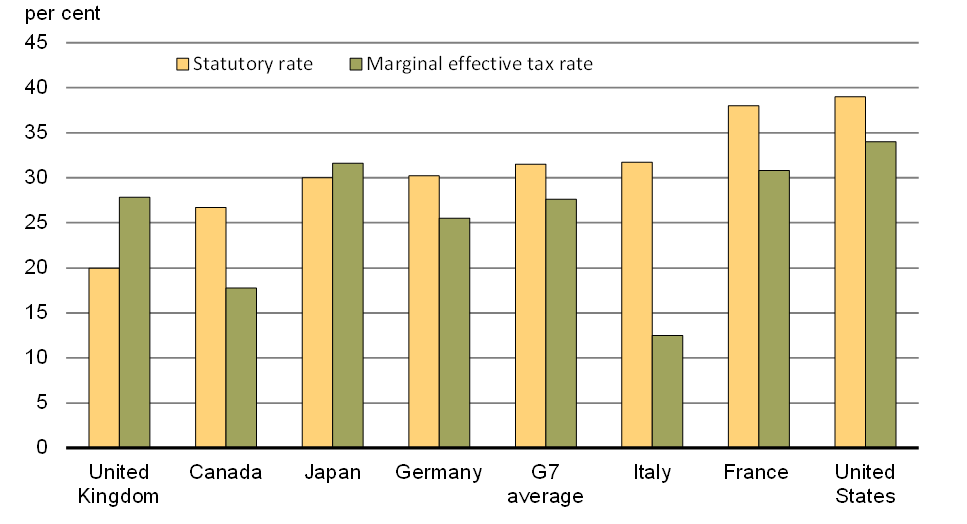
The methodology for calculating METRs is described in the 2005 edition of Tax Expenditures and Evaluations (Department of Finance). It excludes the resource and financial sectors and tax provisions related to research and development.
Tax rates include measures announced as of January 1, 2016 that will be in effect as of December 31, 2016. A change to the New Brunswick corporate income tax rate announced on February 2, 2016 and effective April 1, 2016 is also included. The G7 average does not include Canada.
Source: Department of Finance
Challenges like the ones Canada is facing cannot be solved with short-term solutions, and opportunities can't be realized without smart, sustained investments. By investing in the things Canada's economy needs to prosper over the long term, Budget 2016 sets the stage for stronger economic growth that will benefit more Canadians in the years to come.
Toward More Inclusive Growth
Whatever their own economic circumstances, Canadians overwhelmingly believe in fairness, and in the idea that benefits that come from a strong and growing economy should be accessible to all who work hard for them.
The Government agrees. It is committed to strengthening the middle class, by giving more help to those who need it, and less to those who don't.
Budget 2016 sets a course for fairer, more inclusive growth. It reflects the priorities of Canadians like David and Neera, who expect the Government to be on their side. The Government's priorities are Canadians' priorities.
These priorities include:
Help for the middle class—A strong economy starts with a strong middle class. Budget 2016 introduces the new, fairer, tax-free Canada Child Benefit, eliminates poorly targeted tax breaks and boosts investments in student financial assistance. These measures, combined with the new tax cut for the middle class and a new tax bracket for individuals with more than $200,000 in taxable income per year, will give Canada's middle class the help it needs to grow and prosper.
Growth for the middle class—To strengthen the middle class and deliver more inclusive growth for more Canadians, Budget 2016 makes historic investments in infrastructure and innovation. These investments will both provide immediate help to Canada's middle class and help expand opportunities for those working hard to join it.
A better future for Indigenous peoples—It is time for a renewed relationship between Canada and Indigenous peoples, one based on trust, respect and a true spirit of cooperation. The investments in education, infrastructure, training and other programs contained in Budget 2016 will help to secure a better quality of life for Indigenous peoples—and build a stronger, more unified and more prosperous Canada.
A clean growth economy—A clean environment and a strong economy go hand in hand. Budget 2016 recognizes this, making strategic investments in clean technology and taking concrete steps to address the causes and effects of climate change.
An inclusive and fair Canada—Canada is at its best and most prosperous when all Canadians have a real and fair chance at success. The investments in Budget 2016 help to extend opportunities to more Canadians, and will help to build a healthier, more creative, more generous and more just Canada.
Conclusion
Budget 2016 is about Canadians. About the willingness of people like David and Neera to work hard, and about their hopes for a brighter, more prosperous future for themselves, their children and their future grandchildren.
Canadians understand that a country can't cut its way to prosperity. The Government understands that hard work alone is not enough. A new approach—one that includes smart investments and fair choices—is needed.
Budget 2016 reflects this new approach.