
Common menu bar links
Fiscal Outlook
The Government's overall fiscal situation is now stronger than projected at the time of the November 2006 Economic and Fiscal Update, due to a combination of higher revenues and lower expenses. Budget 2007 builds on these strengths to ensure that taxpayers' dollars are managed effectively.
- For 2006-07, the Government is planning to reduce the federal debt by $9.2 billion. Combined with last year's $13.2-billion surplus, federal debt will have been reduced by $22.4 billion over two years.
- The Government is planning on annual debt reduction of at least $3 billion in 2007-08 and 2008-09, and remains on target to lower the federal debt-to-GDP (gross domestic product) ratio to 25 per cent by 2012-13.
- The Tax Back Guarantee, which will be legislated with Budget 2007, directs over $1 billion per year in recent debt interest savings to ongoing personal income tax reductions.
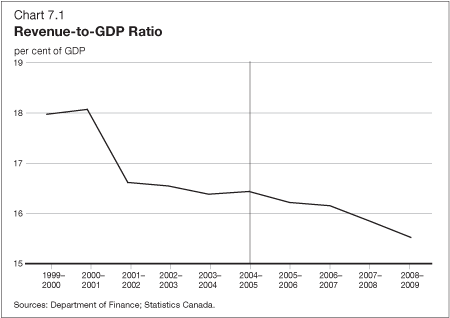
- Revenues as a share of GDP are projected to decline from 16.2 per cent in 2005-06 to 15.5 per cent in 2008-09. This reflects a growing economy and the impact of tax measures legislated with Budget 2007, including the October 2006 Tax Fairness Plan, and Budget 2006.
- The Government will limit growth in program spending, on average, to below the rate of growth in the economy.
Budget Planning and Fiscal Forecasting
This Government has taken a number of significant steps to ensure that budget planning is transparent and enhances accountability, and that taxpayers' dollars are managed effectively. These steps complement the Federal Accountability Action Plan, a wide-ranging set of reforms to strengthen accountability, transparency and oversight throughout government operations.
The Government's approach to budget planning involves a number of important elements.
- Budget 2007 will continue to focus on a two-year horizon, where uncertainties are fewer and the Government can reasonably be held to account.
- The Government continues to plan on achieving annual debt reduction of at least $3 billion. The former practice of adjusting the budget projections for economic prudence has been discontinued.
- Interest savings from federal debt reduction are being dedicated to ongoing personal income tax reductions through the Government's Tax Back Guarantee. Any unplanned surpluses will be used to reduce federal debt and provide more tax relief under the Tax Back Guarantee.
- To incorporate objective economic assumptions, the Government's fiscal projections are based on the average of the private sector economic forecasts (discussed in Chapter 2).
- Quarterly updates of the fiscal outlook for the current year are now provided.
The fiscal projections in Budget 2007 reflect financial results through January 2007 and the most recent private sector forecasts following the release of the fourth-quarter National Income and Expenditure Accounts, released on March 2, 2007. The Government will provide an update of the financial situation for 2006-07 once the monthly results for March 2007 are available (in May 2007). The final results for 2006-07 will be published in the fall.
Fiscal Outlook Before the Measures Proposed in the 2007 Budget
Table 7.1 provides a summary of the main changes in the fiscal projections since the November 2006 Economic and Fiscal Update. The underlying budgetary surplus presented in the November 2006 Economic and Fiscal Update was $7.2 billion for 2006-07, $7.3 billion for 2007-08 and $6.4 billion for 2008-09.
Table 7.1Changes in the Underlying Surplus Since the November 2006 Economic and Fiscal Update (billions of dollars)
| Projection | |||
|---|---|---|---|
| 2006-07 | 2007-08 | 2008-09 | |
| November 2006 Update underlying surplus | 7.2 | 7.3 | 6.4 |
| Impact of economic and fiscal developments | |||
| Budgetary revenues | |||
| Personal income tax | 0.6 | 0.5 | 0.1 |
| Corporate income tax | 2.2 | 1.7 | 2.4 |
| Goods and services tax | -0.5 | -0.8 | -0.7 |
| Other revenues | 1.1 | 0.3 | -0.2 |
| Total | 3.4 | 1.7 | 1.5 |
| Program expenses | |||
| Major transfers to persons | 0.3 | 0.5 | 0.6 |
| Major transfers to other levels of government | 0.0 | 0.0 | -0.1 |
| Direct program expenses | 2.7 | 0.4 | 1.1 |
| Total | 3.0 | 0.8 | 1.7 |
| Public debt charges | 0.5 | 0.9 | 0.9 |
| Total economic and fiscal developments | 6.9 | 3.4 | 4.1 |
| Revised underlying planning surplus (before Budget 2007 measures) | 14.1 | 10.6 | 10.4 |
| Notes: A positive number implies an improvement in the budgetary balance. A negative number implies a deterioration in the budgetary balance. Totals may not add due to rounding. | |||
The Government's overall fiscal situation is now stronger than projected at the time of the November 2006 Economic and Fiscal Update, as a combination of higher revenues and lower expenses have increased the surplus projections by $6.9 billion in 2006-07, $3.4 billion in 2007-08 and $4.1 billion in 2008-09. The result is a revised underlying surplus of $14.1 billion in 2006-07, $10.6 billion in 2007-08 and $10.4 billion in 2008-09.
Budgetary revenues in 2006-07 are now projected to be $3.4 billion higher than projected at the time of the November 2006 Economic and Fiscal Update, owing largely to stronger than expected corporate income tax collections through January 2007. The upward revision to projected revenues diminishes from $3.4 billion in 2006-07 to $1.7 billion in 2007-08 and $1.5 billion in 2008-09 due to the weaker economic outlook of private sector forecasters.
- The underlying projection for personal income tax revenues in 2006-07 is $0.6 billion higher than at the time of the November 2006 Economic and Fiscal Update. This reflects the fact that underlying personal income tax revenues have grown nearly twice as fast as estimated personal income thus far in 2006-07. The projections for 2007-08 and 2008-09 have been revised up by $0.5 billion and $0.1 billion respectively. These upward revisions reflect a reassessment by the Department of Finance of its projection of the sensitivity of personal income tax revenue to changes in personal income (referred to as the personal income tax elasticity, as explained in the box below). The revenue impact of higher assumed elasticity is partially offset by lower growth in personal income in 2007-08 now forecast by the private sector economists, and is almost completely offset by lower forecasts of personal income growth in 2008-09.
- Corporate income tax receipts through January 2007 have been much stronger than expected at the time of the November 2006 Economic and Fiscal Update, rising 12.4 per cent in the first 10 months of the fiscal year. This is significantly stronger than estimated growth in profits of 5.7 per cent in 2006. Corporate income tax collections for the year as a whole are projected to increase by 10.4 per cent. February and March are key months for corporate income tax receipts, generally accounting for over 30 per cent of the year's total receipts. Therefore, collections in the next two months will have a significant bearing on the outcome for the year as a whole. All told, corporate income tax revenues are projected to be higher than projected in the November 2006 Economic and Fiscal Update by $2.2 billion in 2006-07, $1.7 billion in 2007-08 and $2.4 billion in 2008-09.
- Goods and services tax (GST) receipts, on the other hand, have been weaker to date than projected in the November 2006 Economic and Fiscal Update. GST receipts for 2006-07 are now projected to be $0.5 billion lower than projected at the time of the November 2006 Economic and Fiscal Update. Consistent with a weaker outlook for consumer spending over the projection period, GST revenues are forecast to be $0.8 billion weaker in 2007-08 and $0.7 billion weaker in 2008-09 than projected in the November 2006 Economic and Fiscal Update.
- Other revenues are expected to be $1.1 billion higher in 2006-07 than projected in the November 2006 Economic and Fiscal Update, mainly due to strong non-resident income tax withholdings to date in 2006-07. The gain to date is inflated by a one-time payment by a non-resident corporation in respect of a sale of Canadian assets. Other revenues are expected to be $0.3 billion higher than forecast in the November 2006 Economic and Fiscal Update in 2007-08 and $0.2 billion lower in 2008-09.
The income elasticity of personal income tax (PIT) revenues measures the percentage change in PIT revenues resulting from a 1-per-cent change in personal income. It is a key element of the PIT revenue forecast.
PIT revenues usually grow slightly faster than personal income, reflecting the progressive nature of the income tax system, under which marginal tax rates rise as taxable income rises.
In 2006-07, the underlying elasticity is estimated to be about 1.8, well above the elasticity assumption of 1.2 used by most economists. The unusually high elasticity in 2006-07 may be due to a variety of factors, including strong overall real income gains and a concentration of income growth among higher-income earners (who face a higher effective tax rate). It is also possible that current estimates of personal income growth may be somewhat underestimated. Which of these factors is at play in 2006-07 will only be determined two years from now, when detailed data on tax assessments for 2006 is available.
The strength of growth in personal income taxes is not unique to Canada. In recent years, high PIT elasticities have also been observed in other countries, such as the U.S. and Australia. As a result of recent developments, the Department of Finance has reassessed its projection of the PIT elasticity. Microsimulation models based on the current structure of the tax system suggest that, given the private sector forecasts of growth in nominal versus real income, an elasticity of about 1.3 is appropriate. Budget 2007 projections assume that the PIT elasticity will be 1.4 in 2007-08, based on the expectation that some of the factors prevalent in 2006 will persist, and be 1.3 in 2008-09. In the November 2006 Economic and Fiscal Update projection, the elasticity was assumed to return to its long-run average of 1.2 beginning in 2007-08.
Program expenses in 2006-07 are projected to be $3.0 billion lower than projected in the November 2006 Economic and Fiscal Update, reflecting the Government's ongoing commitments to implement new programs only when they are ready and to ensure spending is necessary and effective. Program expenses in 2007-08 and 2008-09 are also projected to be lower than estimated in the November 2006 Economic and Fiscal Update by $0.8 billion and $1.7 billion respectively, largely due to lower projected departmental expenses and due to lower Employment Insurance benefit costs as a result of an improved outlook for the Canadian labour market.
Public debt charges in 2006-07 are forecast to be $0.5 billion lower than projected in the November 2006 Economic and Fiscal Update. In 2007-08 and 2008-09, public debt charges are expected to be $0.9 billion lower than projected in the November 2006 Economic and Fiscal Update. These changes are due to lower levels of debt as a result of the projected $9.2-billion surplus in 2006-07, and lower projected effective interest rates on the debt.
Fiscal Costs of Measures Proposed in the 2007 Budget
The measures proposed in Budget 2007 total $4.9 billion for 2006-07, $7.4 billion for 2007-08 and $7.4 billion for 2008-09. Increased funding for provinces and territories, including the steps to restore fiscal balance, will account for $8.2 billion over the projection period, or about two-thirds of all new spending proposed in Budget 2007. Tax measures legislated with this budget, including the October 2006 Tax Fairness Plan, will amount to $9.7 billion. These costs are reflected in the projections of revenues and expenses presented in the following pages. After accounting for the cost of the measures announced in Budget 2007, planned debt reduction in 2006-07 amounts to $9.2 billion. The Government is planning on reducing the debt in each of 2007-08 and 2008-09 by at least $3 billion.
Table 7.2Fiscal Outlook (Including March 2007 Budget Measures) (billions of dollars)
| Projection | ||||
|---|---|---|---|---|
| 2006-07 | 2007-08 | 2008-09 | Total | |
| Revised Budget 2007 underlying surplus | 14.1 | 10.6 | 10.4 | 35.2 |
| Budget measures | ||||
| A Better Canada (Chapter 3) | 1.4 | 1.3 | 1.1 | 3.8 |
| A Stronger Federation (Chapter 4) | 2.1 | 2.1 | 2.7 | 6.9 |
| A Stronger Economy (Chapter 5) | 1.1 | 3.6 | 3.4 | 8.2 |
| A Safer Canada (Chapter 6) | 0.3 | 0.3 | 0.2 | 0.8 |
| Total budget measures | 4.9 | 7.4 | 7.4 | 19.7 |
Planned debt reduction |
9.2 | 3.0 | 3.0 | 15.2 |
| Remaining surplus | 0.3 | 0.0 | 0.3 | |
| Of measures proposed in budget: | ||||
| Transfers to other levels of government | 3.1 | 2.4 | 2.7 | 8.2 |
| Federal programs | 1.3 | 1.9 | 1.3 | 4.5 |
| Total spending proposed | 4.4 | 4.4 | 4.0 | 12.7 |
| Tax reductions | 0.6 | 3.0 | 3.4 | 7.0 |
| Memorandum | ||||
| Total tax reductions legislated with Budget 2007 |
1.2 | 4.0 | 4.5 | 9.7 |
| Note: Totals may not add due to rounding. 1 Includes tax fairness measures outlined in October 2006 worth $2.7 billion. |
||||
Summary Statement of Transactions
Table 7.3 provides a summary of the Government's financial position, including the cost of all measures proposed in Budget 2007. Budgetary revenues are expected to increase at a rate below that of the overall growth in the economy, reflecting the impact of tax reduction measures. After falling sharply in 2005-06, program expenses as a share of GDP are projected to rise this year and then remain stable. This is after incorporating the spending measures announced in Budget 2007, including the initiatives to restore fiscal balance. Over the budget horizon, program spending as a share of GDP is expected to remain below its 2004-05 level.
Table 7.3Summary Statement of Transactions
(Including March 2007 Budget Measures) (billions of dollars)
| Actual | Projection | ||||
|---|---|---|---|---|---|
| 2004-05 | 2005-06 | 2006-07 | 2007-08 | 2008-09 | |
| Budgetary revenues | 211.9 | 222.2 | 232.3 | 236.7 | 243.5 |
| Program expenses | 176.4 | 175.2 | 189.0 | 199.6 | 206.8 |
| Public debt charges | 34.1 | 33.8 | 34.1 | 33.8 | 33.7 |
| Total expenses | 210.5 | 209.0 | 223.1 | 233.4 | 240.5 |
Planned debt reduction1 |
1.5 | 13.2 | 9.2 | 3.0 | 3.0 |
| Remaining surplus | 0.3 | 0.0 | |||
| Federal debt | 494.7 | 481.5 | 472.3 | 469.3 | 466.3 |
| Per cent of GDP | |||||
| Budgetary revenues | 16.4 | 16.2 | 16.1 | 15.8 | 15.5 |
| Program expenses | 13.7 | 12.8 | 13.1 | 13.3 | 13.2 |
| Public debt charges | 2.6 | 2.5 | 2.4 | 2.3 | 2.1 |
| Total expenses | 16.3 | 15.2 | 15.5 | 15.6 | 15.3 |
| Federal debt | 38.3 | 35.1 | 32.8 | 31.4 | 29.7 |
| Note: Totals may not add due to rounding. 1 Actual debt reduction in 2004-05 and 2005-06. |
|||||
Public debt charges are projected to continue to decline as a percentage of GDP.
The federal debt-to-GDP ratio (accumulated deficit) stood at 35.1 per cent in 2005-06, down significantly from its peak of 68.4 per cent in 1995-96. Taking into account the projected debt reduction, the ratio is expected to fall to 29.7 per cent by 2008-09. The last time it was below 30.0 per cent was in 1981-82. The Government is on track to meet the medium-term objective of reducing the ratio to 25 per cent by 2012-13. With the federal fiscal plan and continued strong provincial fiscal performance, Canada remains on track to eliminate total government net debt by 2021.
Outlook for Budgetary Revenues
Budgetary revenues are projected to increase by 4.5 per cent in 2006-07 and about 2.4 per cent on average in 2007-08 and 2008-09. As a share of GDP, revenues are projected to fall from 16.4 per cent in 2004-05 to 15.5 per cent in 2008-09, reflecting the tax measures to be legislated in Budget 2007, including the October 2006 Tax Fairness Plan, and the tax reductions provided in Budget 2006.
Revenue Outlook (Including March 2007 Budget Measures) (millions of dollars)
|
Actual |
Projection |
||||
|---|---|---|---|---|---|
| 2004-05 | 2005-06 | 2006-07 | 2007-08 | 2008-09 | |
| Tax revenues | |||||
| Income tax | |||||
| Personal income tax | 98,521 | 103,691 | 111,640 | 115,180 | 120,800 |
| Corporate income tax | 29,956 | 31,724 | 35,030 | 36,315 | 35,350 |
| Other income tax | 3,560 | 4,529 | 5,360 | 4,670 | 4,740 |
| Total income tax | 132,037 | 139,944 | 152,030 | 156,165 | 160,890 |
| Excise taxes/duties |
|||||
| Goods and services tax | 29,758 | 33,020 | 30,450 | 30,075 | 31,400 |
| Customs import duties | 3,091 | 3,330 | 3,475 | 3,590 | 3,700 |
| Other excise taxes/duties | 10,008 | 9,806 | 10,510 | 10,500 | 10,165 |
| Total excise taxes/duties | 42,857 | 46,156 | 44,435 | 44,165 | 45,265 |
| Total tax revenues | 174,894 | 186,100 | 196,465 | 200,330 | 206,155 |
| Employment Insurance premium revenues |
17,307 | 16,535 | 16,125 | 16,150 | 16,395 |
| Other revenues | 19,742 | 19,568 | 19,675 | 20,210 | 20,955 |
| Total budgetary revenues | 211,943 | 222,203 | 232,265 | 236,690 | 243,505 |
| Per cent of GDP | |||||
| Personal income tax | 7.6 | 7.6 | 7.8 | 7.7 | 7.7 |
| Corporate income tax | 2.3 | 2.3 | 2.4 | 2.4 | 2.3 |
| Goods and services tax | 2.3 | 2.4 | 2.1 | 2.0 | 2.0 |
| Other excise | 1.0 | 1.0 | 1.0 | 0.9 | 0.9 |
| Total tax revenues | 13.5 | 13.6 | 13.6 | 13.4 | 13.1 |
| Employment Insurance premium revenues |
1.3 | 1.2 | 1.1 | 1.1 | 1.0 |
| Other revenues | 1.5 | 1.4 | 1.4 | 1.4 | 1.3 |
| Total | 16.4 | 16.2 | 16.1 | 15.8 | 15.5 |
| Note: Totals may not add due to rounding. | |||||
Table 7.4 shows the projection of revenues by major revenue sources.
Personal income tax revenues-the largest component of budgetary revenues-are projected to increase by 7.7 per cent in 2006-07-rising slightly as a percentage of GDP-reflecting very strong growth in collections to date. As noted previously, underlying growth in personal income tax revenues (i.e. before taking into account the impact of recent tax reductions) has significantly outpaced recent growth in personal income, rising about 1.8 times as fast as the tax base over the first 10 months of 2006-07 (see the box entitled "Income Elasticity of Personal Income Tax Revenues" earlier in this chapter). The elasticity of personal income tax revenues is projected to be 1.4 in 2007-08 and 1.3 in 2008-09, consistent with the outlook for continued strong real income gains. In the November 2006 Economic and Fiscal Update, the elasticity was assumed to return to its long-run average of 1.2. The higher assumed elasticity is largely offset by the impact of the tax reductions proposed in Budget 2007, including the new $2,000 child tax credit and the Working Income Tax Benefit, as well as measures contained in the October 2006 Tax Fairness Plan and in Budget 2006. As a result, personal income tax receipts are projected to remain stable as a share of GDP through 2007-08 and 2008-09.
Corporate income tax revenues are expected to increase by 10.4 per cent in 2006-07, reflecting gains in profitability, particularly among energy-related industries. Over the next two years, corporate income tax revenues are projected to grow at a slower pace than corporate profits, declining by 2.7 per cent in 2008-09. This reflects measures proposed in Budget 2007, including the temporary two-year write-off of investment in manufacturing and processing equipment, as well as the half-percentage-point reductions in the general corporate tax rate in both 2008 and 2009 and the elimination of the corporate surtax in 2008.
GST revenues are expected to decline by 7.8 per cent in 2006-07, reflecting the 1-percentage-point reduction in the GST rate, effective July 1, 2006. GST revenues are projected to decline further as a share of GDP in 2007-08, the first fiscal year in which the lower GST rate is fully reflected, then remain stable as a share of GDP in 2008-09.
Other excise taxes and duties are projected to rise 7.2 per cent in 2006-07, after a 2.0-per-cent decline in 2005-06. The increase in 2006-07 largely reflects a one-time charge on duty deposit refunds under the Canada-United States Softwood Lumber Agreement, which raises projected revenues by $0.5 billion. There is no net budgetary impact from this charge as the revenue is transferred to U.S. interests under the terms of the Agreement. In addition, other excise taxes and duties are boosted by the introduction of an export charge on softwood lumber exports to the U.S., effective October 12, 2006, consistent with the Agreement. The new export charge will have no net impact on the budgetary balance as export charge revenues collected by the Government of Canada, net of the costs of administering the Agreement, will be transferred to provincial governments. Amounts transferred to both the U.S. and the provinces are included in direct program expenses.
Other income tax receipts-largely withholding taxes levied on payments to non-residents-are expected to increase by 18.3 per cent in 2006-07, following growth of 27.2 per cent in 2005-06. This growth reflects strong growth in dividends paid to non-residents. In addition, the gain in 2006-07 is inflated by a significant one-time payment by a non-resident firm in respect of the sale of Canadian assets.
Consistent with the Employment Insurance (EI) premium rate-setting mechanism adopted in 2005, EI premium revenues are assumed to match projected EI program costs. The EI revenue and expense projections also reflect the implementation of the Quebec Parental Insurance Plan in 2006 and the cost of the labour market pilot projects announced in February 2005. On balance, this results in a decline in projected EI premium revenues in 2006-07. Over the projection period, EI premium revenues are expected to decline as a share of GDP.
Other revenues include those of consolidated Crown corporations, net gains/losses from enterprise Crown corporations, foreign exchange revenues, returns on investments and proceeds from the sales of goods and services. Other revenues are projected to rise only 0.5 per cent in 2006-07, due in part to a $1.0-billion one-time increase in 2005-06 resulting from a change in the accounting treatment of the Government's subscriptions to the International Monetary Fund. Other revenues are projected to remain relatively stable as a share of GDP over the following two years.
Outlook for Program Expenses
As shown in Chart 7.2, program expenses as a share of GDP rose rapidly between 1999-2000 and 2004-05. This trend was reversed in 2005-06, when nominal spending fell by 1 per cent, the first annual decline in nine years. While spending growth is projected to exceed the rate of growth of the economy in 2006-07 and 2007-08, it will drop to 3.6 per cent in 2008-09, below the rate of growth of the economy. This means that from 2004-05 to 2008-09, the rate of growth of program expenses will average 4.1 per cent, below the rate of growth of nominal GDP over this period, which is forecast to average 5 per cent.
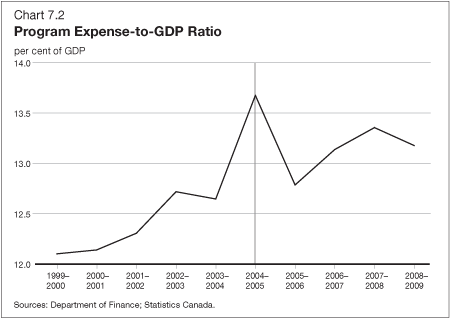
Table 7.5 provides an overview of the projections for program expenses, including the cost of measures proposed in Budget 2007. Program expenses are divided into three components: major transfers to persons, major transfers to other levels of government and direct program expenses-the latter includes subsidies and other transfers, expenses of Crown corporations, and departmental operating expenses, including costs related to National Defence.
Table 7.5Program Expense Outlook (Including March 2007 Budget Measures) (millions of dollars)
| Actual | Projection | ||||
|---|---|---|---|---|---|
| 2004-05 | 2005-06 | 2006-07 | 2007-08 | 2008-09 | |
| Major transfers to persons | |||||
| Elderly benefits | 27,871 | 28,992 | 30,450 | 31,960 | 33,285 |
| Employment Insurance (EI) benefits1 |
14,748 | 14,417 | 14,225 | 14,840 | 15,155 |
| Children's benefits2 | 8,688 | 9,200 | 11,105 | 11,740 | 11,805 |
| Total | 51,307 | 52,609 | 55,780 | 58,540 | 60,245 |
Major transfers to other levels of government |
|||||
| Federal transfers in support of health and other programs |
27,831 | 27,225 | 28,640 | 31,310 | 33,190 |
| Fiscal arrangements | 16,170 | 15,739 | 13,110 | 14,375 | 14,560 |
| Alternative Payments for Standing Programs |
-2,746 | -2,731 | -2,870 | -2,975 | -3,110 |
| Early learning and child care | 700 | 650 | |||
| Canada's cities and communities |
582 | 600 | 800 | 1,000 | |
| Canada ecoTrust for Clean Air and Climate Change |
1,519 | ||||
| Total | 41,955 | 40,815 | 41,649 | 43,510 | 45,640 |
Direct program expenses |
|||||
| Subsidies and other transfers |
25,453 | 24,893 | 30,185 | 31,105 | 31,745 |
| Crown corporations | 8,907 | 7,195 | 7,020 | 6,930 | 6,995 |
| Departmental operating expenses |
48,740 | 49,701 | 54,340 | 59,535 | 62,175 |
| Total | 83,100 | 81,789 | 91,545 | 97,570 | 100,915 |
| Total program expenses | 176,362 | 175,213 | 188,974 | 199,620 | 206,800 |
Per cent of GDP |
|||||
| Major transfers to persons | 4.0 | 3.8 | 3.9 | 3.9 | 3.8 |
| Major transfers to other levels of government |
3.3 | 3.0 | 2.9 | 2.9 | 2.9 |
| Direct program expenses | 6.4 | 6.0 | 6.4 | 6.5 | 6.4 |
| Total program expenses | 13.7 | 12.8 | 13.1 | 13.3 | 13.2 |
| Note: Totals may not add due to rounding. 1 EI benefits include regular EI benefits, sickness, maternity, parental, compassionate care, fishing and work-sharing benefits, and employment benefits and support measures. These represent 90 per cent of total EI program expenses. The remaining EI costs (amounting to $1.6 billion in 2005-06) relate to administration costs. 2 Includes the Canada Child Tax Benefit and Universal Child Care Benefit. |
|||||
Major transfers to persons consist of elderly, EI and children's benefits, including the Universal Child Care Benefit.
- Elderly benefits are projected to grow by $1.5 billion, or 5.0 per cent, in 2006-07, reflecting an $18-per-month increase in the Guaranteed Income Supplement in both January 2006 and January 2007. In the following years, the projected growth in elderly benefits is due to the growth in the elderly population and changes in consumer prices, to which benefits are fully indexed.
- EI benefits are projected to decline by $0.2 billion in 2006-07, reflecting ongoing strength in the labour market. In 2007-08, higher EI benefits are attributable to an increase in the number of beneficiaries and an increase in maximum insurable earnings under the EI program. Starting in 2007, maximum insurable earnings are indexed to the growth in the average industrial wage. The maximum insurable earnings had been frozen at $39,000 since 1996.
- Children's benefits, including the Canada Child Tax Benefit and the Universal Child Care Benefit, are expected to increase by $1.9 billion to $11.1 billion in 2006-07, primarily reflecting the introduction of the Universal Child Care Benefit on July 1, 2006. Starting in 2008-09, the growth in children's benefits is largely determined by the growth in the number of children and changes in consumer prices, to which the Canada Child Tax Benefit is indexed.
Major transfers to other levels of government are expected to increase from $41.6 billion in 2006-07 to $45.6 billion in 2008-09, averaging 4.7-per-cent growth per year. This reflects the action proposed in Budget 2007 to restore the fiscal balance by placing transfers on a predictable and principled footing and to significantly increase funding for those transfers. This includes increased funding for Equalization, Territorial Formula Financing and the Canada Social Transfer.
Following a decline of $1.3 billion in 2005-06, direct program expenses are projected to rise $9.8 billion in 2006-07. Over the two years, growth in direct program expenses is expected to average 5.0 per cent per year. By component, subsidies and transfers are higher in 2006-07 due to increased transfers for farmers, infrastructure, and the forestry industry under the Softwood Lumber Agreement. Departmental operating expenses are higher due to increased estimates of liabilities, as well as growth in operating costs for National Defence, the Royal Canadian Mounted Police, the Canada Border Services Agency and other government departments. Direct program expenses are projected to grow by $6.0 billion, or 6.6 per cent, in 2007-08 and by $3.3 billion, or 3.4 per cent, in 2008-09.
In the November 2006 Economic and Fiscal Update, the Government indicated that savings for the procurement reform initiative announced by the previous government had been significantly overestimated. After further analysis, it has become clear that the revised savings targets will not be realized. The Government, however, has determined that the savings for 2008-09 and beyond will need to be achieved by departments through overall cost efficiencies, including continued efforts to reduce procurement costs. Accordingly, departmental budgets will be reduced to reflect the fiscal targets projected in the November 2006 Economic and Fiscal Update.
The Government is also reviewing the savings targets being pursued by Service Canada. Revised savings targets will be presented in the fall.
Debt-to-GDP Ratio and Public Debt Charges
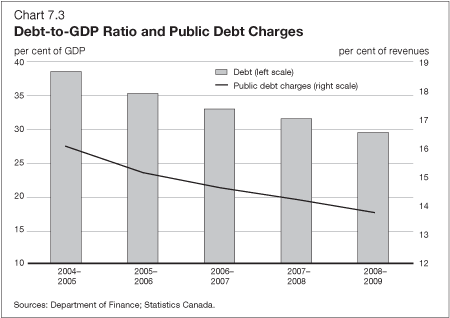
The federal debt-to-GDP ratio (accumulated deficit) stood at 35.1 per cent in 2005-06, down significantly from its peak of over 68 per cent in 1995-96. Taking into account planned debt reduction, along with projected growth in the economy, the debt ratio is expected to fall to 29.7 per cent by 2008-09. The Government is on track to meet the medium-term objective of reducing the ratio to 25 per cent by 2012-13.
The ratio of public debt charges to government revenues has declined in recent years to stand at 15.2 per cent in 2005-06. This ratio is expected to decline further to 13.8 per cent in 2008-09. This means that in 2008-09, the Government will spend roughly 14 cents of each revenue dollar on interest on the federal debt.
As outlined in Advantage Canada, the Government proposes that Canada should aim to eliminate total government net debt by 2021. With the federal fiscal plan set out in Budget 2007 and with a continued solid provincial fiscal outlook, Canada remains on track to meet this objective.
Since 2002-03, the financial statements of the Government of Canada are presented on a full accrual basis of accounting. Under the previous accounting standard-modified accrual accounting-net debt and the accumulated deficit were identical. Under the new standard, net debt now includes a comprehensive costing for financial liabilities but excludes non-financial assets. The accumulated deficit includes both. It is the sum of all surpluses and deficits in the past.
Total Government Net Debt
The full impact of public debt on the economy includes not only the federal government's debt, but also debt of provincial-territorial and local governments, and the assets of the Canada Pension Plan and the Quebec Pension Plan. That is why a standard measure of debt used by organizations such as the Organisation for Economic Co-operation and Development (OECD) is total government net debt.
The OECD definition of total government net debt allows for comparisons across countries. It is calculated on a National Accounts basis. As such, the OECD definition is not directly comparable to federal debt (accumulated deficit) and excludes government employee unfunded pension liabilities, which are fully accounted for in federal debt (accumulated deficit).
Financial Source/Requirement
The budgetary balance is presented on a full accrual basis of accounting, recording government liabilities and assets when they are incurred or acquired, regardless of when the cash is paid or received.
Table 7.6The Budgetary Balance, Non-Budgetary Transactions and Financial Source/Requirement
(billions of dollars)
| Actual | Projection | |||
|---|---|---|---|---|
| 2005-06 | 2006-07 | 2007-08 | 2008-09 | |
| Budgetary balance (planned debt reduction)1 | 13.2 | 9.2 | 3.0 | 3.0 |
| Non-budgetary transactions | ||||
| Pensions and other accounts | 0.1 | 4.8 | 3.8 | 3.6 |
| Non-financial assets | -0.6 | -1.1 | -1.1 | -1.2 |
| Loans, investments and advances | -3.7 | -3.2 | -2.5 | -2.5 |
| Other transactions | -2.3 | -1.3 | -7.9 | 0.6 |
| Total | -6.5 | -0.8 | -7.7 | 0.5 |
| Financial source/requirement | 6.7 | 8.4 | -4.7 | 3.5 |
| Note: Totals may not add due to rounding. 1 Does not include any unallocated surpluses. |
||||
In contrast, the financial source/requirement measures the difference between cash coming in to the Government and cash going out. This measure is affected not only by the budgetary balance but also by the Government's non-budgetary transactions. These include changes in federal employee pension accounts; changes in non-financial assets; investing activities through loans, investments and advances; changes in other financial assets and liabilities; and foreign exchange activities. Non-budgetary transactions also include adjustments made to convert the Government's financial statements from full accrual to cash accounting.
With a projected budgetary surplus of $9.2 billion and a requirement of $0.8 billion from non-budgetary transactions, a financial source of $8.4 billion is projected for 2006-07. In 2007-08, a financial requirement of $4.7 billion is projected, due to budget measures that are expensed in 2006-07 and for which cash payments will be made in 2007-08. It also reflects cash payments related to liabilities recorded in previous years. A financial source of $3.5 billion is expected in 2008-09.
Pensions and other accounts include the activities of the Government of Canada's employee superannuation plans, as well as those for federally appointed judges and Members of Parliament. Since April 2000, the net amount of contributions less benefit payments related to post-March 2000 service has been invested in capital markets. Contributions and payments pertaining to pre-April 2000 service are recorded in the pension accounts. The Government also sponsors a variety of future benefit plans, such as health care and dental plans and disability and other benefits for war veterans and others. The financial source associated with pension and other accounts is expected to increase by $4.7 billion in 2006-07, reflecting actuarial adjustments in the Government's pension liabilities related to prior-year service. In 2005-06, the financial source for pension and other accounts was only $0.1 billion due to the transfer of pension assets to the Canada Pension Plan Investment Board.
Non-financial assets include the cash outlay for the acquisition of new tangible capital assets, proceeds from the sale of tangible capital assets, the amortization of existing tangible assets, losses on the disposal of tangible capital assets, the change in inventories, and prepaid expenses. In the calculation of the budgetary balance, the acquisition of new capital assets is not included; only the amortization of existing tangible assets is included. In the calculation of the financial source/requirement, this is reversed. A net cash requirement of $1.1 billion is estimated for 2007-08.
Loans, investments and advances include the Government's investments in enterprise Crown corporations, such as Canada Mortgage and Housing Corporation, Canada Post Corporation, Export Development Canada and the Business Development Bank of Canada. They also include loans, investments and advances to national and provincial governments and international organizations, and for government programs. Net financial requirements in this component are attributable to the share of annual profits retained by enterprise Crown corporations and loans made under the Canada Student Loans Program.
Other transactions primarily include the conversion of other accrual adjustments included in the budgetary balance into cash, as well as foreign exchange activities.
Borrowing Authority
In a given year, the financial source or requirement, and the need to refinance maturing debt, are the major determinants of the borrowing needs of the Government. The Government proposes to streamline and modernize its approach to borrowing, providing greater transparency and increasing flexibility to meet future borrowing needs.
Authority to borrow in financial markets is provided by Part IV of the Financial Administration Act (FAA), which authorizes the Minister of Finance to issue securities and undertake related activities, including entering into financial contracts and derivatives transactions. Under the FAA, the Government has standing authority to refinance its market debt, and specific authority must be obtained from Parliament to undertake additional borrowing beyond an existing $4 billion of non-lapsing borrowing authority.
Under the FAA, the Minister of Finance is required to annually table in Parliament a report on the plan for managing the public debt for the upcoming fiscal year (the Debt Management Strategy) and a separate report on actual results for the fiscal year recently ended (the Debt Management Report).
The Government proposes to amend the FAA to provide greater transparency and accountability regarding the Government's borrowing activities and increase flexibility to meet future borrowing needs, particularly with respect to the consolidation of Crown borrowings (see Annex 3). The proposal establishes enhanced disclosure requirements through the Debt Management Strategy on anticipated borrowing and planned uses of funds. In addition, information on actual borrowing and uses of funds compared to that forecast would be provided in the Debt Management Report. More detailed information on outcomes would also be included in the Public Accounts, where it would be subject to review by the Auditor General of Canada. With this enhanced transparency and accountability, the Government proposes removing the existing statutory limit on borrowing. Added flexibility will facilitate more efficient, responsive and prudent financial management.
Risks to the Fiscal Projections
Risks associated with the fiscal projections primarily relate to risks to the Canadian economic outlook and volatility in the relationship between fiscal variables and the underlying activity to which they relate.
Risks to the Canadian Economic Outlook
As detailed in Chapter 2, forecasts of the economic outlook contain an unavoidable level of uncertainty. Key economic concerns for the fiscal projections are provided below.
- The principal domestic risk for the outlook relates to future productivity growth. There is a risk that the source of the observed weakness in productivity growth reflects lower underlying productivity growth rather than cyclical factors, which would have negative implications for Canada's future growth potential.
- In terms of external risks, the downside risk to U.S. residential construction activity appears to have lessened since the November 2006 Economic and Fiscal Update, although there remains a risk that the weak housing market could negatively affect U.S. consumer demand.
- As well, although world oil prices have eased from last summer's highs, they remain volatile and subject to geopolitical risks. Rising oil prices could put upward pressure on the Canadian dollar, which would present a challenge to Canadian firms that are highly exposed to trade.
Tables illustrating the sensitivity of the budget balance to a number of economic shocks are provided later in this chapter. These tables are generalized rules of thumb that provide a guide to the impact of changes in economic assumptions on the fiscal projections.
Risks to the Fiscal Projections
Even if the economic outlook were known with certainty, there would still be risks associated with the fiscal projections because of the uncertainty in the translation of economic developments into spending and tax revenues. Growth in tax bases does not always translate in a predictable way into tax revenues.
The following are the key near-term risks to the projections.
- Growth in personal income tax revenues was almost twice the rate of growth in the personal income tax base through the first 10 months of 2006-07, a faster rate of growth relative to the tax base than would normally be expected. The elasticity of personal income tax revenues is projected to be 1.4 in 2007-08 and 1.3 in 2008-09. From year to year, personal income tax elasticity can be very volatile.
- Growth in corporate income tax revenues for a given year may differ substantially from growth in corporate profits for the same year because corporate taxable income includes a number of items not related to current production and which are therefore not reflected in the National Accounts profit measure, such as interest revenues and expenses, and capital gains and losses. Similarly, provisions in the Income Tax Act that allow corporations to smooth taxable income from year to year by shifting losses backward or forward may lower corporate income tax growth relative to profits. In addition, reassessments, which generally pertain to past tax years, may contribute to a divergence between growth in corporate tax revenues and the tax base.
- On the expense side, the extent to which departments and agencies do not fully use all of the resources appropriated by Parliament varies from year to year and can materially affect the fiscal outcome. In addition, during the course of the fiscal year, departments and agencies often incur liabilities for which no payments are made. These liabilities are recognized throughout the year and are updated before the close of the fiscal year as part of the normal year-end accrual adjustments. Changes in estimates of liabilities can be significant.
Sensitivity of the Budget Balance to Economic Shocks
Changes in economic assumptions affect the size of projected tax bases and expenditures that are sensitive to economic factors, such as EI benefits and public debt charges.
The following tables illustrate the sensitivity of the budget balance to a number of economic shocks:
- A one-year, 1-per-cent decrease in real GDP driven equally by lower productivity and employment growth.
- A decrease in nominal GDP resulting solely from a one-year, 1-percentage-point decrease in the rate of GDP inflation.
- A sustained 100-basis-point decrease in all interest rates.
These sensitivities are generalized rules of thumb that assume any decrease in economic activity is proportional across income and expenditure components. EI premium rates are assumed to be fixed during the first calendar year in which the shock occurs, and to adjust for subsequent years, such that EI revenues exactly offset program expenses, consistent with legislation governing EI rate setting. Equal and opposite impacts would result from an increase of equal magnitude in real or nominal GDP growth and interest rates.
Table 7.7Estimated Impact of a One-Year, 1-Per-Cent Decrease in Real GDP on Federal Revenues, Expenses and Budgetary Balance (billions of dollars)
| Year 1 | Year 2 | |
|---|---|---|
| Federal revenues | ||
| Tax revenues | ||
| Personal income tax | -1.0 | -1.3 |
| Corporate income tax | -0.4 | -0.4 |
| Goods and services tax | -0.3 | -0.3 |
| Other tax revenues | -0.2 | -0.2 |
| Total tax revenues | -1.9 | -2.2 |
| Employment Insurance premium revenues | -0.1 | 0.6 |
| Other revenues | 0.0 | 0.0 |
| Total budgetary revenues | -2.1 | -1.6 |
Federal expenses |
||
| Major transfers to persons | ||
| Elderly benefits | 0.0 | 0.0 |
| Employment Insurance benefits | 0.5 | 0.6 |
| Total | 0.5 | 0.6 |
| Other program expenses | -0.1 | -0.1 |
| Public debt charges | 0.0 | 0.1 |
| Total expenses | 0.5 | 0.6 |
| Budgetary balance | -2.6 | -2.2 |
| Note: Totals may not add due to rounding. | ||
A 1-per-cent decrease in real GDP reduces the budgetary balance by $2.6 billion in the first year and $2.2 billion in the second year.
Tax revenues from all sources fall by a total of $1.9 billion in the first year and $2.2 billion in the second year. Personal income tax revenues decrease as employment and wages and salaries fall. Furthermore, due to the progressivity of the tax system, as individuals earn lower real incomes, they pay proportionally less of their income in taxes. Corporate income tax revenues fall as output and profits decrease. GST revenues decrease as a result of lower consumer spending associated with the fall in employment and personal income.
Since EI premium rates for a given year are set based on projections carried out in October of the previous year, EI premium revenues decline marginally in the first year of the shock (reflecting lower wages and salaries), but rise thereafter, reflecting the upward adjustment to the break-even rate necessary to meet increased program costs. For the purpose of the simulations, it is assumed that EI premium rates are increased as a result of the weaker economy. This is consistent with the legislation governing rate setting. The legislation also provides the Government with the option to leave rates unchanged if it believes this to be appropriate.
Expenses rise, mainly reflecting higher EI benefits (due to an increase in the level of unemployment) and higher public debt charges (reflecting a higher stock of debt due to the lower budgetary balance).
Table 7.8Estimated Impact of a One-Year, 1-Percentage-Point Decrease in GDP Inflation on Federal Revenues, Expenses and Budgetary Balance (billions of dollars)
| Year 1 | Year 2 | |
|---|---|---|
| Federal revenues | ||
| Tax revenues | ||
| Personal income tax | -1.3 | -1.3 |
| Corporate income tax | -0.4 | -0.4 |
| Goods and services tax | -0.3 | -0.3 |
| Other tax revenues | -0.2 | -0.2 |
| Total tax revenues | -2.3 | -2.3 |
| Employment Insurance premium revenues | -0.1 | -0.1 |
| Other revenues | -0.1 | -0.1 |
| Total budgetary revenues | -2.4 | -2.4 |
| Federal expenses | ||
| Major transfers to persons | ||
| Elderly benefits | -0.2 | -0.3 |
| Employment Insurance benefits | -0.1 | -0.1 |
| Total | -0.3 | -0.4 |
| Other program expenses | -0.3 | -0.3 |
| Public debt charges | 0.0 | 0.1 |
| Total expenses | -0.5 | -0.6 |
| Budgetary balance | -1.9 | -1.8 |
| Note: Totals may not add due to rounding. | ||
A 1-per-cent decrease in nominal GDP resulting solely from lower GDP inflation (assuming that the Consumer Price Index moves in line with GDP inflation) lowers the budgetary balance by $1.9 billion in the first year and $1.8 billion in the second year.
Lower prices result in lower nominal income and, as a result, personal income tax, corporate income tax and GST revenues all decrease, reflecting declines in the underlying nominal tax bases. Compared to the impacts of the real GDP shock, the effects on personal income tax revenues are more pronounced in the initial year, due to the lag with which changes in the inflation rate are reflected in the tax system (tax brackets are indexed to the percentage change in the Consumer Price Index for the 12-month period ending September 30 of the previous year). For the other sources of tax revenue, the negative impacts are similar under either the real or nominal GDP shocks. EI premium revenues decrease marginally in the price shock in response to lower earnings. Unlike the real GDP shock, EI benefits do not rise since unemployment is unaffected by price changes.
Partly offsetting lower revenues are the declines in the cost of statutory programs that are indexed to inflation, such as elderly benefit payments and the Canada Child Tax Benefit, as well as federal wage and non-wage expenses. Payments under these programs are smaller if inflation is lower. Public debt charges rise due to the higher stock of debt.
Table 7.9Estimated Impact of a Sustained 100-Basis-Point Decrease in All Interest Rates on Federal Revenues, Expenses and Budgetary Balance (billions of dollars)
| Year 1 | Year 2 | |
|---|---|---|
| Federal revenues | -0.4 | -0.6 |
| Federal expenses | -1.4 | -2.0 |
| Budgetary balance | 1.0 | 1.4 |
A decrease in interest rates raises the budgetary balance by $1.0 billion in the first year and $1.4 billion in the second. The improvement stems entirely from decreased expenses associated with public debt charges. The impact on debt charges rises through time as longer-term debt matures and is refinanced at lower rates. Moderating the overall impact is a fall in revenues associated with the decrease in the rate of return on the Government's interest-bearing assets, which are recorded as part of non-tax revenues.
Aligning the Main Estimates With Budget 2007
Table 7.10Reconciliation of Spending Projections in the
Main Estimates (2007-08) and the March 2007 Budget (billions of dollars)
| 2007-08 | |
|---|---|
| Cash appropriations (budgetary) | 210.3 |
| Adjustments | |
| Net-to-gross adjustment | |
| Canada Child Tax Benefit | 9.3 |
| Revenues of consolidated Crown corporations | 1.8 |
| Revenues netted against expenses | 3.7 |
| Total | 14.8 |
Change in estimates of statutory programs |
|
| Major transfers | -0.3 |
| Public debt charges | -0.9 |
| Total | -1.2 |
Accrual and other adjustments, net of lapse |
|
| Consolidation of foundations | 0.9 |
| Capital (amortization expense less cash) | -1.7 |
| Other | 6.0 |
| Total | 5.2 |
| Budget measures | 4.4 |
| Total adjustments | 23.1 |
| Total estimated spending in Budget 2007 | 233.4 |
| Note: Totals may not add due to rounding. | |
The Main Estimates for 2007-08, tabled in Parliament on February 27, 2007, sought authority to spend $210.3 billion, whereas this budget projects spending to be $233.4 billion. The differences are explained below.
Net-to-Gross Adjustment
The budget presents expenses on a gross basis, while the Main Estimates are presented on a net basis, whereby certain revenues are netted against budgetary expenses. Presenting expenses on a gross basis adds about $14.8 billion to total expenses.
Change in Estimates of Statutory Programs
The spending estimates presented in Budget 2007 for statutory programs, such as major transfers to persons and other levels of government, and public debt charges are based on the latest economic data available. They differ from what is presented in the Main Estimates, as these projections were not yet available at the time of its publication. Budget 2007 estimates of the cost of statutory programs are about $1.2 billion lower than presented in the Main Estimates.
Accrual and Other Adjustments
In 2003, the Government adopted full accrual accounting as its accounting standard. In contrast, the Main Estimates present the appropriations of departments on a cash basis. Some amounts published in the Main Estimates therefore have to be adjusted to reflect the differences in standards, for example with respect to expenses of consolidated foundations or capital amortization. These adjustments increase total spending by $5.2 billion. The projections presented in this budget also include amounts for liabilities.
Budget Measures
The budget projections include the spending measures announced in this budget, which were not reflected in the Main Estimates but will be included in Supplementary Estimates to be tabled during the 2007-08 fiscal year.
Table of Contents - Previous - Next -