
Common menu bar links

Archived - Budget 2011
Chapter 5: Plan for Returning to Balanced Budgets (JUNE 6, 2011)
Table of Contents - Previous - Next
- The fiscal outlook has been updated to reflect fiscal developments since March. The deficit projection has been revised down by $4.3 billion in 2010–11 as a result of a downward revision to 2010–11 expenses, including an additional reprofiling of Canada's Economic Action Plan funding largely related to the extension of the completion deadline for four infrastructure programs. This reprofiling of Canada's Economic Action Plan funding also contributes to the slight increase of $0.5 billion in the 2011–12 deficit projection.
- The fiscal outlook has also been adjusted to reflect the following:
- A provision has been made in 2011–12 for $2.2 billion in support of the conclusion of a satisfactory agreement between Canada and Quebec on sales tax harmonization, consistent with the Government's commitment in this regard.
- As part of its commitment to continue strengthening integrity and accountability in government and political activity, the Government is announcing the phase-out of the quarterly allowances for political parties, as promised. Savings related to this measure have been recorded in the updated fiscal outlook.
- As a result, the projected budgetary deficit has fallen from $40.5 billion to $36.2 billion in 2010–11 and has increased from $29.6 billion to $32.3 billion in 2011–12, for a cumulative reduction of $1.6 billion in the projected deficit over those two years. The budgetary balance for the remaining years of the forecast period is largely unchanged.
Highlights
- Budget 2011 builds on the actions taken in Budget 2010 to return to balanced budgets by:
- Delivering on the 2010 round of strategic reviews.
- Taking action to close tax loopholes.
- Launching a comprehensive one-year Strategic and Operating Review aimed at improving the efficiency and effectiveness of government operations and programs to ensure value for taxpayer money.
- The Government has been clear and consistent that it will not raise taxes or cut transfers to persons, including those for seniors, children and the unemployed, or transfers to other levels of government in support of health care and social services, Equalization, and the gas tax transfer to municipalities.
- The Government's plan for returning to balanced budgets is on track. Without including any targeted savings from the Strategic and Operating Review, the Government is projected to return to balanced budgets by 2015–16 at the latest.
- The deficit in 2012–13 is projected to be cut by almost two-thirds from its level in 2009–10. The deficit is projected to continue to decline to $0.3 billion in 2014–15. It is expected that there will be a surplus of $4.2 billion in 2015–16.
- The Strategic and Operating Review will support the return to balanced budgets by 2014–15, and provide fiscal room to continue paying down debt and investing in the priorities of Canadians, including lowering taxes for families.
- The expiration of stimulus measures and the savings measures announced in this budget are expected to lower program spending from 16.0 per cent of gross domestic product (GDP) in 2009–10 to 12.9 per cent of GDP in 2015–16, in line with its pre-recession level.
- The federal debt is projected to decline to 29.7 per cent of GDP in 2015–16, broadly returning to its pre-recession level.
Plan for Returning to Balanced Budgets:
Building on Budget 2010
Budget 2010 set out a three-point plan for returning to balanced budgets over the medium term by:
- Winding down the stimulus provided in Canada's Economic Action Plan as the economy recovers.
- Implementing targeted measures to restrain growth in direct program spending.
- Undertaking a comprehensive review of government administrative functions and overhead costs.
The Government has been clear and consistent that it will not raise taxes or cut transfers to persons, including those for seniors, children and the unemployed, or transfers to other levels of government in support of health care and social services, Equalization, and the gas tax transfer to municipalities.
The emphasis on the careful management of direct program spending reflects the Government's fundamental belief that the private sector is the engine of growth and wealth creation.
Budget 2010 Restraint Measures Are on Track
Budget 2010 implemented targeted measures to restrain direct spending growth and close tax loopholes that are expected to generate savings of $17.6 billion over five years. The Government is on track to meet this spending restraint commitment as:
- The Department of National Defence is on track to achieving the savings required to meet the commitment to restrain growth in defence spending.
- In 2010–11, Canada fulfilled its commitment to double international assistance. The International Assistance Envelope has now been capped at $5 billion.
- Savings of $300 million in 2010–11 have been achieved as departments and agencies absorbed the 1.5-per-cent wage increase for the federal public administration.
- The operating budgets of departments remain frozen at their 2010–11 levels for two years. This freeze was reflected in the 2011–12 Main Estimates tabled on March 1, 2011.
Managing Compensation Costs
In Budget 2010, the Government indicated that it would engage with public sector bargaining agents and assess measures taken by other jurisdictions in Canada to ensure that the total costs of compensation are reasonable.
In order to bring predictability to employees and departments and agencies given the constraints imposed on operating budgets, the Government engaged last fall in early negotiations with bargaining agents. Agreements were reached and signed with a number of bargaining agents, representing over 95,000 employees, which include the elimination of the accrual of severance benefits for resignation and retirement. Eliminating these benefits brings public service compensation more in line with the private sector, where severance benefits for voluntary separation are typically not offered. The Government intends to pursue this approach in its negotiations with other bargaining agents.
The Government is also taking steps to ensure that compensation for non‑represented employees and executives is aligned with that of negotiated agreements. Starting in 2011–12, severance benefits for resignation and retirement will no longer accrue to federal public sector executives.
Building on Budget 2010 Restraint Actions
Budget 2011 builds on the actions taken in Budget 2010 by announcing the following measures that could achieve an additional $17.2 billion in savings over five years:
- Delivering on the 2010 round of strategic reviews.
- Taking action to close tax loopholes.
- Launching a comprehensive one-year Strategic and Operating Review aimed at improving the efficiency and effectiveness of government operations and programs to ensure value for taxpayer money.
2010 Strategic Reviews
Budget 2011 delivers over $500 million in new ongoing savings from the 2010 round of strategic reviews, which were undertaken to ensure that programs are achieving their intended results, are effectively managed, and are appropriately aligned with the priorities of Canadians and federal responsibilities. Together with the measures undertaken by the Department of National Defence to restrain the growth in defence spending as mandated in Budget 2010, the 2010 round identified savings that reach close to $1.6 billion in 2013–14. When combined with the previous three rounds of reviews, the strategic review process has provided more than $2.8 billion in ongoing savings. Detailed outcomes of the 2010 round of strategic reviews are provided in Annex 1.
Tax Fairness—Closing Tax Loopholes
Budget 2011 follows through on the Government's commitment in the 2010 Speech from the Throne to improve the integrity and fairness of the tax system by closing loopholes that allow a few businesses and individuals to avoid paying their fair share of tax. These proposed measures will protect the Government's revenue base—which helps keep tax rates low—and reaffirm the Government's ongoing commitment to tax fairness.
- The deferral of partnership income will be limited by requiring corporations that have a significant interest in a partnership with a fiscal period ending on a date different from the corporation's year‑end, to report partnership income on an accrual basis, subject to a transitional reserve.
- The dividend stop‑loss rules will be extended, in general, to dividends deemed to be received on the redemption of shares held by corporations.
- In order to address complex tax planning schemes, the tax on split income will be extended to schemes involving capital gains of a minor child on the sale of shares of a corporation to a person who does not deal at arm's length with the child if dividends on those shares would be subject to the tax on split income.
- Anti‑avoidance rules will be introduced for Registered Retirement Savings Plans (RRSPs) and Registered Retirement Income Funds (RRIFs) based largely on the Tax‑Free Savings Account anti‑avoidance rules. The new rules will address self‑dealing arrangements and schemes undertaken by a small number of taxpayers to withdraw amounts from RRSPs/RRIFs without paying tax.
- A package of integrity measures for charities will be introduced to help combat fraud and abuse of the charitable donations incentives, thereby protecting the tax base and ensuring that more resources are available for legitimate charities.
- Rules will be introduced to limit excessive tax benefits that can result on the donation of flow-through shares as a result of the interaction between the exemption from capital gains tax on the donation of publicly listed securities and the tax incentives for flow-through shares.
- New limits will be imposed to level the playing field by limiting the extent to which individual pension plans can be used to obtain tax deferrals that are beyond those generally available under other registered plans for retirement saving.
The introduction of these measures will yield $240 million in savings in 2011–12, rising to about $1.0 billion by 2013–14. Further details on these proposals can be found in Annex 3.
Strategic and Operating Review
Building on previous restraint exercises, most notably strategic reviews and the three-point plan set out in Budget 2010 to return to balanced budgets, Budget 2011 launches a comprehensive one-year Strategic and Operating Review across all of government in 2011–12. This review will focus on improving the efficiency and effectiveness of government operations and programs to ensure value for taxpayer money and will replace the next cycle of strategic reviews.
The Strategic and Operating Review will examine direct program spending, as appropriated by Parliament. About $80 billion of direct program spending will be reviewed with the objective of achieving at least $4 billion in ongoing annual savings by 2014–15 or 5 per cent of the review base. The review will place particular emphasis on generating savings from operating expenses and improving productivity, while also examining the relevance and effectiveness of programs.
The review will be led by the President of the Treasury Board, who will chair a specially constituted committee of Treasury Board that will assess proposals put forward by ministers and their departments and agencies to achieve the targeted level of savings. This committee will be guided by experts from outside government who will help design a framework for the review based on private and public sector best practices.
The Government is also looking for ways to improve services and service delivery to Canadians by examining government-wide solutions that will standardize, consolidate and re-engineer the way it does business. The information and opportunities identified through the administrative services review undertaken this past year will inform this aspect of the Strategic and Operating Review. The Government also proposes to enable departments and agencies to find efficiencies through shared services arrangements and transfer of functions.
Savings from the Strategic and Operating Review have not been recorded in Budget 2011. The Government will report on the results of this review in Budget 2012. The Strategic and Operating Review will support the return to balanced budgets by 2014–15, and provide fiscal room to continue paying down debt and investing in the priorities of Canadians, including lowering taxes for families.
In total, Budget 2011 savings measures amount to $6.2 billion in savings over five years. Combined with the targeted savings from the Strategic and Operating Review, total savings could be as much as $17.2 billion over five years. Table 5.1 outlines these major actions.
| 2010– 2011 |
2011– 2012 |
2012– 2013 |
2013– 2014 |
2014– 2015 |
2015– 2016 |
Total | |
|---|---|---|---|---|---|---|---|
| (millions of dollars) | |||||||
| 2010 strategic reviews1 | 194 | 271 | 569 | 525 | 534 | 2,094 | |
| Tax fairness—closing tax loopholes | 240 | 730 | 1,095 | 1,040 | 990 | 4,095 | |
| Total savings recorded in Budget 2011 | 0 | 434 | 1,001 | 1,664 | 1,565 | 1,524 | 6,189 |
| Targeted Strategic and Operating Review savings | 1,000 | 2,000 | 4,000 | 4,000 | 11,000 | ||
| Total savings | 0 | 434 | 2,001 | 3,664 | 5,565 | 5,524 | 17,189 |
| Note: Totals may not add due to rounding. 1 National Defence savings were booked as part of Budget 2010. |
|||||||
Integrity and Accountability
Political parties currently receive taxpayer support in three ways: (a) a tax credit paid to taxpayers for their contributions to political parties; (b) the reimbursement of eligible election expenses; and (c) a quarterly subsidy based on votes cast.
The Government is committed to continue strengthening integrity and accountability in government and political activity. Governments have a duty to use Canadians' tax dollars with great care, and only in the public interest—especially in a time of fiscal restraint, when families are struggling to make ends meet.
For these reasons, the Government will introduce legislation to gradually reduce the $2.04 per year per vote allowance in $0.51 increments starting April 1, 2012 until it is completely eliminated by 2015–16. This will generate annual savings that will ramp up to $30 million by 2015–16.
The Government's Plan for Returning
to Balanced Budgets Is on Track
Table 5.2 shows the evolution of the projected budgetary balance for the 2010–11 fiscal year and the next five fiscal years. The first row shows the projected balance from the October 2010 Update of Economic and Fiscal Projections. The second row indicates the projected budgetary balance in Budget 2011, and the third row indicates the projected budgetary balance in this update of Budget 2011 (as detailed in the following sections of this chapter). These projections take into account recent economic and fiscal developments, as well as the measures introduced in Budget 2011 and this update of Budget 2011, but do not include targeted savings from the Strategic and Operating Review. Finally, the expected savings from the Strategic and Operating Review, as well as the projected budgetary balance in this update of Budget 2011 adjusted for these savings, are presented for reference purposes.
The table indicates that the projected budgetary balance has improved over most of the forecast horizon, reflecting both the improved economic outlook and the Government's prudent fiscal management. Over 2010–11 and the next five years, the projected budgetary balance has improved by a total of nearly $14 billion compared to the projection at the time of the October 2010 Update. Without including any targeted savings from the Strategic and Operating Review, the Government is projected to return to balanced budgets by 2015–16 at the latest. The Strategic and Operating Review will support the return to balanced budgets by 2014–15, and provide fiscal room to continue paying down debt and investing in the priorities of Canadians, including lowering taxes for families.
| 2010– 2011 |
2011– 2012 |
2012– 2013 |
2013– 2014 |
2014– 2015 |
2015– 2016 |
|
|---|---|---|---|---|---|---|
| (billions of dollars) | ||||||
| Balance at the time of the October 2010 Update | -45.4 | -29.8 | -21.2 | -11.5 | -1.7 | 2.6 |
| Balance including measures in Budget 2011 | -40.5 | -29.6 | -19.4 | -9.5 | -0.3 | 4.2 |
| Balance including measures in this update of Budget 2011 |
-36.2 | -32.3 | -19.4 | -9.4 | -0.3 | 4.2 |
| Difference | 4.3 | -2.7 | 0.0 | 0.1 | 0.0 | 0.0 |
| Reference | ||||||
| Strategic and Operating Review targeted savings | 1.0 | 2.0 | 4.0 | 4.0 | ||
| Balance including measures in this update of Budget 2011 and the expected savings from the Strategic and Operating Review |
-36.2 | -32.3 | -18.4 | -7.4 | 3.7 | 8.2 |
| Note: Totals may not add due to rounding. This table has been expanded since Budget 2011. |
||||||
An important measure of fiscal sustainability is the debt-to-GDP ratio. Reductions in the debt-to-GDP ratio before the global financial crisis provided Canada with the flexibility to implement measures to support the economy that were fiscally sustainable as part of Canada's Economic Action Plan. Chart 5.1 shows that the federal debt, measured in relation to the size of the economy, is projected to decline to 29.7 per cent in 2015–16, broadly returning to its pre-recession level.
to its pre‑recession level
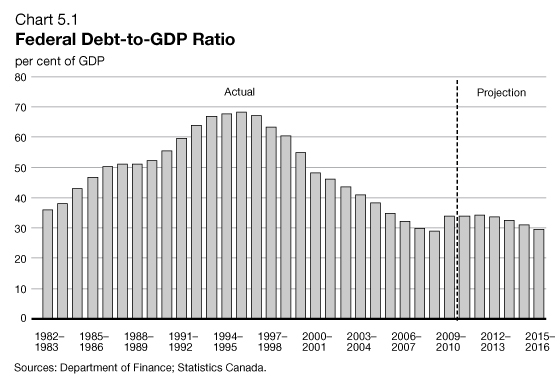
This chart has been updated since Budget 2011.
Fiscal Planning Framework
Approach to Budget Planning
To ensure objectivity and transparency in forecasting, the economic forecast underlying the Government's fiscal projections is based on the average of the private sector economic forecasts. This process has been followed for over a decade. This budget maintains that approach.
However, as described in Chapter 2, although the March 2011 private sector survey is considered to be a reasonable basis for fiscal planning purposes, uncertainty remains and the Government has judged it appropriate to adjust downward the private sector forecast for nominal GDP by $10 billion in each year of the forecast. This represents a downward adjustment of $1.5 billion in fiscal revenues in each year of the forecast (Table 5.3).
| 2011 | 2012 | 2013 | 2014 | 2015 | |
|---|---|---|---|---|---|
| (billions of dollars) | |||||
| March 2011 private sector survey | 1,719 | 1,804 | 1,893 | 1,979 | 2,068 |
| Budget 2011 fiscal planning assumption | 1,709 | 1,794 | 1,883 | 1,969 | 2,058 |
| Adjustment for risk | -10 | -10 | -10 | -10 | -10 |
| 2011– 2012 |
2012– 2 013 |
2013– 2014 |
2014– 2015 |
2015– 2016 |
|
|---|---|---|---|---|---|
| Revenue effect of risk adjustment | -1.5 | -1.5 | -1.5 | -1.5 | -1.5 |
| This table from Budget 2011 has been updated to reflect historical revisions from Statistics Canada released with the first-quarter Canadian Economic Accounts. | |||||
Fiscal Outlook Before the Measures
Announced in Budget 2011
Table 5.4 provides a summary of the changes in the fiscal projections between the October 12, 2010 Update of Economic and Fiscal Projections and Budget 2011. Although budget measures have been presented over two years, this section provides a five-year forecast as part of the Government's medium-term economic plan. In the Update, a budgetary deficit of $45.4 billion was projected for 2010–11. Deficits were forecast to decline steadily over time, with a small surplus of $2.6 billion projected by the end of the planning period in 2015–16.
| 2010– 2011 |
2011– 2012 |
2012– 2013 |
2013– 2014 |
2014– 2015 |
2015– 2016 |
|
|---|---|---|---|---|---|---|
| (billions of dollars) | ||||||
| October 2010 Update budgetary balance | -45.4 | -29.8 | -21.2 | -11.5 | -1.7 | 2.6 |
| Revenue effect of adjustment for risk | -0.3 | -1.5 | -1.5 | -1.1 | -0.8 | -0.8 |
| October 2010 Update budgetary balance before risk adjustment | -45.1 | -28.3 | -19.7 | -10.4 | -1.0 | 3.3 |
| Decisions since the October Update | -0.2 | -1.0 | -0.2 | -0.2 | 0.0 | 0.0 |
| Impact of economic and fiscal developments | ||||||
| Budgetary revenues | 2.9 | 2.9 | 2.8 | 3.3 | 3.8 | 3.4 |
| Budgetary expenses1 | 2.0 | 0.0 | -0.3 | -0.9 | -1.9 | -1.4 |
| Total economic and fiscal developments | 4.9 | 3.0 | 2.5 | 2.3 | 2.0 | 2.0 |
| Revenue effect of adjustment for risk | -1.5 | -1.5 | -1.5 | -1.5 | -1.5 | |
| Revised Budget 2011 status quo budgetary balance | -40.4 | -27.8 | -19.0 | -9.7 | -0.5 | 3.8 |
| Note: Totals may not add due to rounding. 1 A negative number implies an increase in spending and a deterioration in the budgetary balance. A positive number implies a decrease in spending and an improvement in the budgetary balance. |
||||||
The projected Budget 2011 status quo budgetary balance (before actions in Budget 2011) had improved across the entire planning period, with deficits starting at $40.4 billion in 2010–11 and declining to $0.5 billion in 2014–15, followed by a surplus of $3.8 billion in 2015–16.
The revisions reflected three factors: the cost of decisions that had been taken by the Government since the October Update, the impact of economic and fiscal developments up until March, and the increase in the adjustment for risk starting in 2013–14.
The cost of decisions which had been taken since the October Update amounted to $200 million in 2010–11, $1.0 billion in 2011–12, and $200 million in 2012–13 and 2013–14. These costs included the Government's commitment to provide transfer protection payments to provinces in 2011–12 to ensure that no province experiences a decline in its combined entitlements under the Canada Health Transfer, Canada Social Transfer and Equalization. Adjustments will be made to existing legislation to ensure the proper interaction of this measure with the Fiscal Stabilization Program. In addition, these costs reflected the fiscal impact of the provision of training to the Afghan National Security Forces as part of Canada's post-2011 Afghanistan strategy, additional funding for Atomic Energy of Canada Limited to support its ongoing operations, and the three-year extension of federal support to interprovincial ferry services in Eastern Canada.
The projected Budget 2011 status quo budgetary balance also reflected economic and fiscal developments since the October Update. The economic outlook had improved since the October Update, which had a positive effect on then projected revenues. Revenues were revised up by $2.9 billion in 2010–11 and in 2011–12, $2.8 billion in 2012–13, $3.3 billion in 2013–14, $3.8 billion in 2014–15 and $3.4 billion in 2015–16. Projected interest earnings were expected to be higher as a result of the Government's new prudential liquidity plan, which is aimed at ensuring that the Government is able to meet payment obligations in situations where normal access to funding markets may be disrupted or delayed. The prudential liquidity plan has no impact on the projected budgetary balance, as the increase in returns on interest-bearing assets is offset by a corresponding increase in public debt charges. Additional information on the prudential liquidity plan is provided in Annex 2.
Budgetary expenses, which include program expenses and public debt charges, were projected in March to be below the level projected in the October Update in 2010–11, but higher from 2012–13 onwards. Lower spending in 2010–11 reflected the extension of the deadline for completing projects under four infrastructure programs under the Economic Action Plan to October 31, 2011, which meant that some funds originally expected to be spent in 2010–11 would now be spent in 2011–12, as well as lower Employment Insurance benefits due to lower unemployment. Higher spending from 2012–13 onwards largely reflected higher public debt charges due to the prudential liquidity plan mentioned above. Offsetting this somewhat were lower projected children's and elderly benefits, which reflected changes in the composition of the recipient population.
Economic and fiscal developments between the October Update and Budget 2011 led to improvements in the projected budgetary balance of $4.9 billion in 2010–11, $3.0 billion in 2011–12, $2.5 billion in 2012–13, $2.3 billion in 2013–14, $2.0 billion in 2014–15 and $2.0 billion in 2015–16.
Relative to the October 2010 Update, the adjustment for risk was increased from 2013–14 to 2015–16 to reflect uncertainties in the global economic outlook over the medium term. As a result, the revenue projections were reduced by $1.5 billion in each year of the forecast.
Fiscal Cost of Measures Announced in Budget 2011
Table 5.5 sets out the impact of measures announced in Budget 2011. The savings measures announced in Budget 2011 resulted in cumulative savings of $6.2 billion over five years. At the same time, Budget 2011 announced measures designed to support the recovery and to implement the Next Phase of Canada's Economic Action Plan—A Low-Tax Plan for Jobs and Growth. These measures totalled $7.6 billion over six years.
| 2010– 2011 |
2011– 2012 |
2012– 2013 |
2013– 2014 |
2014– 2015 |
2015– 2016 |
|
|---|---|---|---|---|---|---|
| (billions of dollars) | ||||||
| October 2010 Update budgetary balance | -45.4 | -29.8 | -21.2 | -11.5 | -1.7 | 2.6 |
| Economic and fiscal developments up to March (including decisions since the Update and change to risk adjustment) |
5.0 | 2.0 | 2.2 | 1.8 | 1.2 | 1.2 |
| Revised Budget 2011 status quo budgetary balance (before budget measures) |
-40.4 | -27.8 | -19.0 | -9.7 | -0.5 | 3.8 |
| Return to balanced budgets—Budget 2011 savings measures |
||||||
| 2010 strategic reviews | 0.0 | 0.2 | 0.3 | 0.6 | 0.5 | 0.5 |
| Tax fairness—closing tax loopholes | 0.0 | 0.2 | 0.7 | 1.1 | 1.0 | 1.0 |
| Subtotal—savings measures | 0.0 | 0.4 | 1.0 | 1.7 | 1.6 | 1.5 |
| Measures announced in Budget 20111 | ||||||
| Economic Action Plan—supporting the recovery |
0.0 | -0.5 | -0.2 | -0.2 | -0.3 | 0.0 |
| Next Phase of Canada's Economic Action Plan—A Low-Tax Plan for Jobs and Growth |
0.0 | -1.8 | -1.2 | -1.2 | -1.1 | -1.1 |
| Subtotal—policy measures | -0.1 | -2.3 | -1.4 | -1.4 | -1.3 | -1.2 |
| Total (net savings) | -0.1 | -1.8 | -0.4 | 0.3 | 0.2 | 0.3 |
| Budget 2011 budgetary balance (after budget measures) |
-40.5 | -29.6 | -19.4 | -9.5 | -0.3 | 4.2 |
| Notes: Totals may not add due to rounding. The figures presented in this table also reflect the fiscal impact of certain tax and related measures discussed in Annex 3. 1 A positive number implies a decrease in spending and an improvement in the budgetary balance. A negative number implies an increase in spending and a deterioration in the budgetary balance. |
||||||
The Budget 2011 savings measures were designed to build over the medium term as the economy recovers and will provide ongoing savings of $1.5 billion beginning in 2015–16. The cost of announced new policy measures totalled $2.3 billion in 2011–12 and between $1.2 billion and $1.4 billion per year thereafter.
The deficit in 2010–11 was projected to be more than 25 per cent lower than it was in 2009–10, and it was projected to shrink by more than 25 per cent again in 2011–12. The deficit was projected to continue to decline to $0.3 billion in 2014–15. It was expected that there would be a surplus of $4.2 billion in 2015–16. These figures did not reflect targeted savings from the Strategic and Operating Review.
Summary of Changes in the Fiscal Outlook Since Budget 2011
Since Budget 2011, there have been changes to the fiscal outlook. Some of these changes result from economic and fiscal developments. Others result from new measures announced in this budget. Table 5.6 presents these changes.
| 2010– 2011 |
2011– 2012 |
2012– 2013 |
2013– 2014 |
2014– 2015 |
2015– 2016 |
|
|---|---|---|---|---|---|---|
| (billions of dollars) | ||||||
| Budget 2011 budgetary balance (including measures) |
-40.5 | -29.6 | -19.4 | -9.5 | -0.3 | 4.2 |
| Impact of economic and fiscal developments since Budget 2011 |
||||||
| Budgetary revenues | 0.0 | 0.0 | 0.0 | 0.0 | 0.0 | 0.0 |
| Budgetary expenses1 | 4.3 | -0.5 | 0.0 | 0.0 | 0.0 | 0.0 |
| Subtotal | 4.3 | -0.5 | 0.0 | 0.0 | 0.0 | 0.0 |
| New measures | ||||||
| Provision for agreement between Canada and Quebec on sales tax harmonization |
-2.2 | |||||
| Phase-out of quarterly allowances for political parties2 |
0.01 | 0.01 | 0.02 | 0.03 | ||
| Subtotal | 0.0 | -2.2 | 0.0 | 0.0 | 0.0 | 0.0 |
| Updated Budget 2011 budgetary balance (including measures) |
-36.2 | -32.3 | -19.4 | -9.4 | -0.3 | 4.2 |
| Note: Totals may not add due to rounding. 1 A negative number implies an increase in spending and a deterioration in the budgetary balance. A positive number implies a decrease in spending and an improvement in the budgetary balance. 2 For greater transparency, the presentation of this measure includes an additional decimal place. |
||||||
The fiscal outlook presented in Budget 2011 was based on the economic outlook from the March 2011 survey of private sector economists and the year-to-date fiscal results through January. Since that time, there has been no change to the economic outlook for fiscal planning purposes. However, two additional months of fiscal data have become available.
As a result, the deficit projection has been revised down by $4.3 billion for 2010–11 and up by $0.5 billion for 2011–12 from the Budget 2011 forecast. The decrease in 2010–11 is due to a downward revision to 2010–11 expenses, including an additional reprofiling of Canada's Economic Action Plan funding largely related to the extension of the completion deadline for four infrastructure programs, as described in Chapter 3. This reprofiling of Canada's Economic Action Plan funding also contributes to the slight increase in the 2011–12 deficit projection. The remaining elements of the status quo forecast remain largely unchanged.
Two additional changes have been made to the fiscal outlook. As part of its fiscal planning, the Government has made a provision in 2011–12 for $2.2 billion in support of the conclusion of a satisfactory agreement between Canada and Quebec on sales tax harmonization, consistent with the Government's commitment in this regard. Moreover, as announced in this chapter, the Government will gradually phase out the quarterly allowances for political parties, which will achieve annual savings of up to $30 million by 2015–16.
All of these developments have led to an improvement in the projected budgetary balance of $4.3 billion in 2010–11 and a deterioration of $2.7 billion in 2011–12, for a cumulative reduction of $1.6 billion in the projected deficit over those two years. The projected budgetary balance is roughly unchanged for the remainder of the forecast period.
The remaining sections of this chapter reflect this updated fiscal outlook. Details of the changes to the tables are presented in the annex at the end of this chapter.
Summary Statement of Transactions
Table 5.7 summarizes the Government's financial position, including the cost of measures and the savings announced in this update of Budget 2011 (excluding the targeted impact of the Strategic and Operating Review).
| Projection | |||||||
|---|---|---|---|---|---|---|---|
| 2009– 2010 |
2010– 2011 |
2011– 2012 |
2012– 2013 |
2013– 2014 |
2014– 2015 |
2015– 2016 |
|
| (billions of dollars) | |||||||
| Budgetary revenues | 218.6 | 235.6 | 249.1 | 264.4 | 281.2 | 296.8 | 309.2 |
| Program expenses | 244.8 | 240.8 | 248.4 | 247.3 | 252.0 | 257.7 | 265.6 |
| Public debt charges | 29.4 | 30.9 | 33.0 | 36.5 | 38.6 | 39.4 | 39.4 |
| Total expenses | 274.2 | 271.7 | 281.4 | 283.8 | 290.7 | 297.1 | 305.0 |
| Budgetary balance | -55.6 | -36.2 | -32.3 | -19.4 | -9.4 | -0.3 | 4.2 |
| Other comprehensive income | 0.2 | 2.2 | |||||
| Federal debt | 519.1 | 553.1 | 585.4 | 604.8 | 614.2 | 614.5 | 610.3 |
| Per cent of GDP | |||||||
| Budgetary revenues | 14.3 | 14.5 | 14.6 | 14.7 | 14.9 | 15.1 | 15.0 |
| Program expenses | 16.0 | 14.8 | 14.5 | 13.8 | 13.4 | 13.1 | 12.9 |
| Public debt charges | 1.9 | 1.9 | 1.9 | 2.0 | 2.1 | 2.0 | 1.9 |
| Budgetary balance | -3.6 | -2.2 | -1.9 | -1.1 | -0.5 | 0.0 | 0.2 |
| Federal debt | 34.0 | 34.0 | 34.3 | 33.7 | 32.6 | 31.2 | 29.7 |
| Note: Totals may not add due to rounding. This table has been updated since Budget 2011. The annex to this chapter provides details of the updates. |
|||||||
Table 5.7 also shows that other comprehensive income is projected to reduce the federal debt by $2.2 billion in 2010–11 (revised down from $3.1 billion in the March forecast), following a $0.2‑billion reduction in 2009–10. Other comprehensive income represents certain unrealized gains and losses on financial instruments reported by enterprise Crown corporations and other government business enterprises. Based on the recommendations of the Public Sector Accounting Board of the Canadian Institute of Chartered Accountants, other comprehensive income is not included in the Government's annual budgetary balance, but is instead recorded directly to the Government's Statement of Accumulated Deficit and Statement of Change in Net Debt. A significant portion of the projected 2010–11 amount is attributable to unrealized gains resulting from the increase in the value of the Government's holdings of General Motors common shares. The update from Budget 2011 is mainly due to a downward adjustment to that increase as a result of subsequent changes in the share price and exchange rate.
Expressed as a share of the economy, budgetary revenues are projected to increase from a low of 14.3 per cent of GDP in 2009–10 to 15.0 per cent of GDP in 2015–16. This modest increase is due to the economic recovery following the recession. In contrast, the expiration of stimulus measures and the savings measures announced in this budget are expected to lower the ratio of program spending to GDP from 16.0 per cent in 2009–10 to 12.9 per cent in 2015–16. Public debt charges are projected to rise somewhat as a percentage of GDP until 2013–14 as a result of rising interest rates and the prudential liquidity plan. However, they then decrease as a share of GDP as a result of an improvement in the budgetary balance and the repayment of principal on assets maturing under the Insured Mortgage Purchase Program, which reduces the interest-bearing debt of the Government. The budgetary balance is projected to improve steadily from a deficit of 3.6 per cent of GDP in 2009–10 to a surplus of 0.2 per cent of GDP in 2015–16.
The federal debt-to-GDP ratio (accumulated deficit) stood at 34.0 per cent in 2009–10, down significantly from its peak of 68.4 per cent in 1995–96. The debt ratio is expected to decline to 29.7 per cent in 2015–16, broadly in line with its recent low of 29.0 per cent in 2008–09.
Outlook for Budgetary Revenues
| Projection | |||||||
|---|---|---|---|---|---|---|---|
| 2009– 2010 |
2010– 2011 |
2011– 2012 |
2012– 2013 |
2013– 2014 |
2014– 2015 |
2015– 2016 |
|
| (billions of dollars) | |||||||
| Income taxes | |||||||
| Personal income tax | 103.9 | 113.3 | 119.9 | 128.1 | 136.5 | 144.9 | 151.5 |
| Corporate income tax | 30.4 | 29.0 | 32.5 | 33.1 | 35.5 | 37.4 | 39.3 |
| Non-resident income tax | 5.3 | 5.0 | 5.4 | 5.9 | 6.4 | 6.8 | 7.3 |
| Total income tax | 139.6 | 147.3 | 157.8 | 167.1 | 178.4 | 189.1 | 198.1 |
| Excise taxes/duties | |||||||
| Goods and Services Tax | 26.9 | 29.0 | 30.1 | 31.7 | 33.4 | 35.1 | 36.8 |
| Customs import duties | 3.5 | 3.6 | 3.8 | 4.1 | 4.2 | 4.5 | 4.8 |
| Other excise taxes/duties | 10.1 | 10.9 | 11.0 | 10.9 | 10.9 | 10.8 | 10.8 |
| Total excise taxes/duties | 40.6 | 43.4 | 44.8 | 46.7 | 48.5 | 50.4 | 52.5 |
| Total tax revenues | 180.2 | 190.7 | 202.7 | 213.8 | 226.8 | 239.5 | 250.5 |
| Employment Insurance premium revenues |
16.8 | 17.5 | 18.9 | 20.8 | 22.8 | 24.5 | 24.8 |
| Other revenues | 21.7 | 27.3 | 27.6 | 29.8 | 31.6 | 32.8 | 33.8 |
| Total budgetary revenues | 218.6 | 235.6 | 249.1 | 264.4 | 281.2 | 296.8 | 309.2 |
| Per cent of GDP | |||||||
| Personal income tax | 6.8 | 7.0 | 7.0 | 7.1 | 7.2 | 7.4 | 7.4 |
| Corporate income tax | 2.0 | 1.8 | 1.9 | 1.8 | 1.9 | 1.9 | 1.9 |
| Goods and Services Tax | 1.8 | 1.8 | 1.8 | 1.8 | 1.8 | 1.8 | 1.8 |
| Total tax revenues | 11.8 | 11.7 | 11.9 | 11.9 | 12.0 | 12.2 | 12.2 |
| Employment Insurance premium revenues |
1.1 | 1.1 | 1.1 | 1.2 | 1.2 | 1.2 | 1.2 |
| Other revenues | 1.4 | 1.7 | 1.6 | 1.7 | 1.7 | 1.7 | 1.6 |
| Total budgetary revenues | 14.3 | 14.5 | 14.6 | 14.7 | 14.9 | 15.1 | 15.0 |
| Note: Totals may not add due to rounding This table has been updated since Budget 2011. The annex to this chapter provides details of the updates. |
|||||||
Compared to the revenue outlook presented in Budget 2011, total budgetary revenues are unchanged. However, there are slight variations in the individual revenue components that reflect additional information available since March.
Personal income tax revenues—the largest component of budgetary revenues—are projected to increase by $9.3 billion, or 9.0 per cent, to $113.3 billion in 2010–11. This result primarily reflects growth in personal income, combined with the expiration of the Home Renovation Tax Credit on January 31, 2010. Over the remainder of the planning period, personal income tax revenues increase somewhat faster than GDP growth, averaging 6.0‑per‑cent annual growth, reflecting the progressive nature of the income tax system combined with growth in the personal income tax base.
Corporate income tax revenues are expected to decline by $1.3 billion, or 4.4 per cent, to $29.0 billion in 2010–11. This decrease reflects one‑time payments and an accounting refinement that boosted revenues in 2009–10. Absent these factors, corporate income tax revenues would have been projected to grow in 2010–11 as the economy recovers. Annual growth in corporate income tax revenues is projected to average 6.3 per cent over the remainder of the projection period, reflecting growth in corporate profits and the closing of tax loopholes.
Non-resident income tax revenues are expected to be relatively flat in 2010–11, as the recovery in corporate profits is offset by the completion of the phase-out of the withholding tax on non-arm's length interest payments to the U.S. under the Fifth Protocol to the Canada-U.S. Tax Treaty. Non-resident income tax revenues are projected to grow at an average annual rate of 7.6 per cent over the remainder of the forecast period as the economy and, in particular, corporate profits recover.
Goods and Services Tax (GST) revenues are projected to grow by 7.5 per cent in 2010–11. Annual growth in GST revenues is projected to average 4.9 per cent over the remainder of the projection period, in line with growth in taxable consumption.
Customs import duties are projected to increase by $0.1 billion or 2.6 per cent in 2010–11, reflecting year-to-date results, which include tariff relief on manufacturing inputs and machinery and equipment announced in Budget 2010 and the new duty remission framework for certain imported ships announced on October 1, 2010. Over the remainder of the projection period, annual growth in customs import duties is projected to average 6.2 per cent, in line with projected growth in imports. Based on year-to-date results, other excise taxes and duties are projected to rise by 7.1 per cent to $10.9 billion in 2010–11, and to remain close to that level over the projection period.
Employment Insurance (EI) premium revenues are projected to grow by 4.6 per cent in 2010–11. This forecast reflects growth in insurable earnings and the action announced by the Government on September 30, 2010 to limit the potential increase in EI premium rates to 5 cents per $100 of insurable earnings in 2011 and 10 cents in subsequent years. Based on current economic projections, it is expected that the EI account will return to cumulative balance by 2015.
Other revenues include those of consolidated Crown corporations, net gains/losses from enterprise Crown corporations, foreign exchange revenues, returns on investments and revenues from the sales of goods and services. These revenues are volatile, owing partly to the impact of exchange rate movements on the Canadian-dollar value of foreign-denominated interest-bearing assets and to net gains/losses from enterprise Crown corporations. Other revenues are projected to increase by 26.1 per cent in 2010–11, due in part to one-time accounting adjustments that lowered 2009–10 results, as well as stronger projected growth in the profits of enterprise Crown corporations and gains realized on the Government's sale of common equity in General Motors. Annual growth in other revenues is projected to average 4.4 per cent over the remainder of the forecast period.
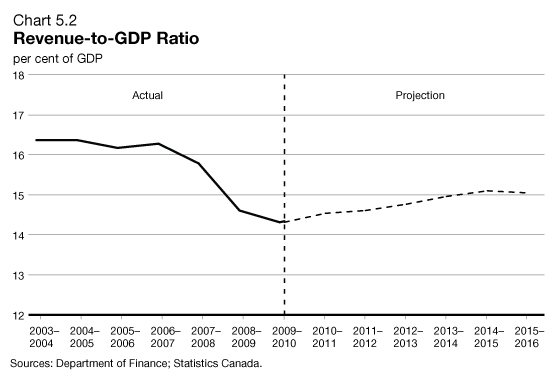
This chart has been updated since Budget 2011.
Chart 5.2 shows that, after reaching a trough of 14.3 per cent in 2009–10 due to the impact of the recession, revenues as a share of GDP are projected to rise to 14.5 per cent in 2010–11. The revenue ratio is expected to increase to 15.0 per cent by 2015–16, but remain below the 2007–08 level of 15.8 per cent as the economy recovers.
Outlook for Program Expenses
| Projection | |||||||
|---|---|---|---|---|---|---|---|
| 2009– 2010 |
2010– 2011 |
2011– 2012 |
2012– 2013 |
2013– 2014 |
2014– 2015 |
2015– 2016 |
|
| (billions of dollars) | |||||||
| Major transfers to persons | |||||||
| Elderly benefits | 34.7 | 35.9 | 38.0 | 40.1 | 42.3 | 44.5 | 46.7 |
| Employment Insurance (EI) benefits1 | 21.6 | 20.1 | 19.5 | 18.9 | 18.7 | 18.8 | 19.0 |
| Children's benefits | 12.3 | 12.7 | 13.1 | 13.5 | 13.7 | 13.8 | 13.9 |
| Total | 68.6 | 68.6 | 70.6 | 72.5 | 74.7 | 77.1 | 79.5 |
| Major transfers to other levels of government | |||||||
| Federal transfers in support of health and social programs |
35.7 | 37.2 | 38.7 | 40.7 | 42.7 | 44.7 | 47.0 |
| Fiscal arrangements2 | 16.2 | 16.4 | 16.9 | 17.8 | 18.7 | 19.5 | 20.4 |
| Alternative Payments for Standing Programs | -2.7 | -3.1 | -3.1 | -3.3 | -3.5 | -3.7 | -3.9 |
| Canada's cities and communities | 1.9 | 2.0 | 2.0 | 2.0 | 2.0 | 2.0 | 2.0 |
| Other3 | 5.9 | 0.5 | 3.8 | 0.3 | 0.2 | 0.2 | 0.2 |
| Total | 57.0 | 53.0 | 58.2 | 57.5 | 60.1 | 62.7 | 65.6 |
| Direct program expenses | |||||||
| Transfer payments | 39.9 | 38.8 | 37.3 | 34.0 | 31.8 | 30.6 | 30.6 |
| Capital amortization | 4.3 | 4.5 | 4.7 | 5.0 | 5.2 | 5.4 | 5.6 |
| Other operating expenses | 21.7 | 21.1 | 23.5 | 24.4 | 25.3 | 25.8 | 26.7 |
| Operating expenses subject to freeze | 53.4 | 54.7 | 54.1 | 53.9 | 54.9 | 56.2 | 57.6 |
| Total | 119.2 | 119.1 | 119.6 | 117.3 | 117.2 | 118.0 | 120.5 |
| Total program expenses | 244.8 | 240.8 | 248.4 | 247.3 | 252.0 | 257.7 | 265.6 |
| Per cent of GDP | |||||||
| Major transfers to persons | 4.5 | 4.2 | 4.1 | 4.0 | 4.0 | 3.9 | 3.9 |
| Major transfers to other levels of government | 3.7 | 3.3 | 3.4 | 3.2 | 3.2 | 3.2 | 3.2 |
| Direct program expenses | 7.8 | 7.3 | 7.0 | 6.5 | 6.2 | 6.0 | 5.9 |
| Total program expenses | 16.0 | 14.8 | 14.5 | 13.8 | 13.4 | 13.1 | 12.9 |
| Note: Totals may not add due to rounding. 1 EI benefits include regular EI benefits, sickness, maternity, parental, compassionate care, fishing and work-sharing benefits, and employment benefits and support measures. These represent 90 per cent of total EI program expenses. The remaining EI costs relate mainly to administration costs. 2 Fiscal arrangements include Equalization, Territorial Formula Financing, the Youth Allowances Recovery and statutory subsidies. 3 Other major transfers to other levels of government include transitional payments, transfer protection payments (2010–11 and 2011–12), payments under the 2005 Offshore Accords and a provision in 2011–12 in support of the conclusion of a satisfactory agreement between Canada and Quebec on sales tax harmonization. This table has been updated since Budget 2011. The annex to this chapter provides details of the updates. |
|||||||
Table 5.9 provides an overview of the projections for program expenses by major component, reflecting fiscal developments since March as well as the cost of measures announced in this budget. The results do not reflect any savings from the Strategic and Operating Review. Program expenses consist of major transfers to persons, major transfers to other levels of government, and direct program expenses.
Major transfers to persons consist of elderly, Employment Insurance (EI) and children's benefits.
Growth in elderly benefits, which include Old Age Security and the Guaranteed Income Supplement, is expected to average roughly 5 per cent annually over the planning period due to increases in the seniors' population, enhanced income support measures for low-income seniors announced in this budget and consumer price inflation, to which benefits are fully indexed.
EI benefits are projected to decrease by 6.9 per cent to $20.1 billion in 2010–11. This is mainly due to an improvement in the unemployment rate. EI benefits are projected to decline by 2.9 per cent in 2011–12, reflecting the phase-out of the temporary enhancements under the Economic Action Plan and the extension of the Working While on Claim and the Best 14 Weeks pilot projects. EI benefits are projected to be relatively stable over the remainder of the planning period, averaging $18.8 billion per year, as higher average benefits are offset by lower unemployment.
Children's benefits, including the Canada Child Tax Benefit and the Universal Child Care Benefit, are projected to increase moderately over the forecast horizon, reflecting changes to benefits implemented in Budget 2009. Benefits are slightly lower than in previous projections due to higher expected family net income over the projection period.
Major transfers to other levels of government include transfers in support of health and social programs, Equalization and Territorial Formula Financing. Current legislation has these transfers on a growing track out to 2013–14. As a planning assumption, major transfers to other levels of government are projected to grow at current legislated rates over the forecast period. These projections are consistent with the Government's commitments on growth in the Canada Health Transfer.
Other major transfers to other levels of government will increase in 2011–12 due to transfer protection payments and the inclusion of a provision in 2011–12 for $2.2 billion in support of the conclusion of a satisfactory agreement between Canada and Quebec on sales tax harmonization. Other major transfers to other levels of government will also be greater throughout the forecast horizon due to an accounting reclassification of certain payments, including the reclassification of the 2005 Offshore Accords, from direct program expenses to major transfers to other levels of government. This reclassification has no impact on transfers to provinces and territories.
Direct program expenses include operating expenses of National Defence and other departments, expenses of Crown corporations, transfers administered by departments for farm income support, natural resource royalties paid to provinces, and student financial assistance. The projection for direct program expenses reflects the extension of the deadline for Economic Action Plan infrastructure programs until October 31, 2011, as well as initiatives included in this update of Budget 2011.
Within direct program expenses, transfers are projected to decline over the projection period, reflecting the wind-down of stimulus provided under the Economic Action Plan, the termination of transfers to provinces following the expiry of the Canada-U.S. Softwood Lumber Agreement in 2013–14, decreasing natural resource revenue transfers to the provinces from projected declines in offshore oil production, and a reduction in activity under the Building Canada Fund.
Amounts for capital expenses are presented on an accrual basis. The amount of capital amortization is expected to increase modestly over the next five years as a result of new investments and upgrades to existing capital.
Other operating expenses include costs for employee pensions and other benefits, non-wage expenses of National Defence and accrual amounts for items such as the allowance for bad debt.
Expenses subject to the operating freeze include the wages and salaries of federal employees, professional services contracts, telecommunications, leases, utilities (heat and hydro), materials and supplies. The projection for these expenses reflects measures included in this update of Budget 2011 (but not the Strategic and Operating Review). The decline in these operating expenses in 2011–12 and 2012–13 is related in part to the expiry of stimulus measures under Canada's Economic Action Plan. The growth in spending in the outer years of the forecast horizon reflects expected cost pressures related to essential services, as well as payments that arise from liabilities and other contingencies.
Chart 5.3 shows program expenses as a share of GDP. Canada's Economic Action Plan, which took significant action to strengthen Canada's economy and support Canadians during the global recession, resulted in a temporary increase in the program expenses-to-GDP ratio. With the wind-down of the stimulus measures, the Government remains committed to focused and disciplined spending that will ensure that spending as a share of GDP declines over the medium term.
By 2015–16, the program expenses-to-GDP ratio is projected to fall to 12.9 per cent. This would bring the program spending ratio in line with its level before the global crisis.
to pre-crisis level
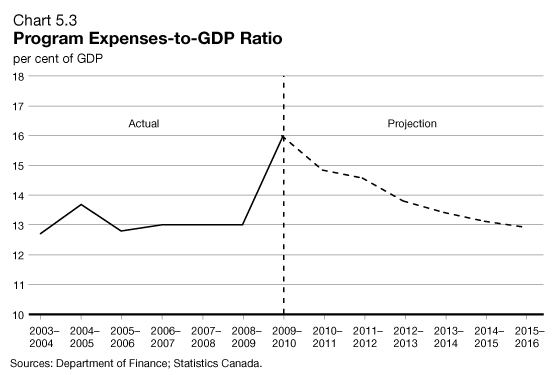
This chart has been updated since Budget 2011.
Financial Source/Requirement
The budgetary balance is presented on a full accrual basis of accounting, recording government liabilities and assets when they are incurred or acquired, regardless of when the cash is paid or received.
In contrast, the financial source/requirement measures the difference between cash coming in to the Government and cash going out. This measure is affected not only by the budgetary balance but also by the Government's non-budgetary transactions. These include changes in federal employee pension accounts; changes in non-financial assets; investing activities through loans, investments and advances; changes in other financial assets and liabilities; and foreign exchange activities.
| Projection | |||||||
|---|---|---|---|---|---|---|---|
| 2009– 2010 |
2010– 2011 |
2011– 2012 |
2012– 2013 |
2013– 2014 |
2014– 2015 |
2015– 2016 |
|
| (billions of dollars) | |||||||
| Budgetary balance | -55.6 | -36.2 | -32.3 | -19.4 | -9.4 | -0.3 | 4.2 |
| Non-budgetary transactions | |||||||
| Pensions and other accounts | 7.5 | 5.0 | 5.8 | 5.5 | 5.1 | 5.1 | 4.9 |
| Non-financial assets | -1.9 | -1.7 | -2.9 | -2.7 | -2.5 | -2.2 | -2.0 |
| Loans, investments and advances | |||||||
| Enterprise Crown corporations | -16.0 | -6.6 | -3.4 | -1.5 | -3.1 | -4.7 | -5.6 |
| Insured Mortgage Purchase Program | -9.3 | 5.2 | 2.6 | 2.1 | 43.7 | 9.9 | 0.0 |
| Other | -2.1 | -1.5 | 1.2 | -0.4 | -0.2 | -0.3 | -0.2 |
| Total | -27.4 | -2.9 | 0.4 | 0.2 | 40.3 | 4.9 | -5.8 |
| Other transactions | 13.7 | -11.4 | -6.6 | 1.3 | 1.6 | 2.1 | 2.7 |
| Total | -8.1 | -11.0 | -3.3 | 4.3 | 44.5 | 9.9 | -0.2 |
| Financial source/requirement | -63.7 | -47.2 | -35.6 | -15.1 | 35.1 | 9.6 | 4.0 |
| Note: Totals may not add due to rounding. This table has been updated since Budget 2011. The annex to this chapter provides details of the updates. |
|||||||
As shown in Table 5.10, significant financial requirements are projected from 2010–11 to 2012–13 ($47.2 billion in 2010–11, $35.6 billion in 2011–12 and $15.1 billion in 2012–13), followed by financial sources of $35.1 billion in 2013–14, $9.6 billion in 2014–15 and $4.0 billion in 2015–16. The requirements over the 2010–11 to 2012–13 period mainly reflect the budgetary balance, whereas the financial sources expected over the 2013–14 to 2015–16 period mainly reflect the repayment of principal on assets maturing under the Insured Mortgage Purchase Program (IMPP).
The financial source associated with pensions and other accounts is expected to be $5.8 billion in 2011–12. Pensions and other accounts include the activities of the Government of Canada's employee superannuation plans, as well as those of federally appointed judges and Members of Parliament. Since April 2000, the net amount of contributions less benefit payments related to post-March 2000 service has been invested in capital markets. Contributions and payments pertaining to pre-April 2000 service are recorded in the pension accounts. The Government also sponsors a variety of future benefit plans, such as health care and dental plans and disability and other benefits for war veterans and others.
Financial requirements for non-financial assets mainly reflect the difference between cash outlays for the acquisition of new tangible capital assets and the amortization of capital assets that are included in the budgetary balance. They also include the proceeds from the net losses or gains of tangible capital assets, losses on the disposal of tangible capital assets, the change in inventories, and prepaid expenses. A net cash requirement of $2.9 billion is estimated for 2011–12.
Loans, investments and advances include the Government's investments in enterprise Crown corporations, such as Canada Mortgage and Housing Corporation (CMHC), Canada Post Corporation, Export Development Canada and the Business Development Bank of Canada (BDC). They also include loans, investments and advances to national and provincial governments and international organizations, and for government programs. The requirements for enterprise Crown corporations projected from 2010–11 to 2015–16 reflect the Government's decision to meet all the borrowing needs of CMHC, BDC and Farm Credit Canada through direct lending. The financial source in the projection period under the IMPP is due to the winding down in March 2010 of purchases of insured mortgage pools under the plan and the subsequent repayments of principal as the assets under the plan mature.
Other transactions include the payment of tax refunds and other accounts payable, the collection of taxes and other accounts receivable, the conversion of other accrual adjustments included in the budgetary balance into cash, as well as foreign exchange activities. The $6.6‑billion net cash requirement in 2011–12 primarily reflects borrowings to improve prudential liquidity management.
Risks to the Fiscal Projections
Risks to the economic outlook are the greatest source of uncertainty to the fiscal projections. To help quantify these risks, tables illustrating the sensitivity of the budgetary balance to a number of economic shocks are provided below.
Beyond the economic outlook, there remain upside and downside risks associated with the fiscal projections, as several key drivers of the fiscal outlook are not directly linked to economic variables (such as the relationship between personal income taxes and personal income or the extent to which departments and agencies do not fully use all of the resources appropriated by Parliament).
The 2010–11 fiscal results are not yet finalized. Therefore, the budgetary balance shown in this update of Budget 2011 for 2010–11 is an estimate subject to changes related to year-end adjustments before the Government's financial statements are finalized. The Government will release the final audited budgetary balance outcome for 2010–11 in the Annual Financial Report of the Government of Canada in the fall.
Overall, the risks surrounding the fiscal projections are considered to be broadly balanced.
Sensitivity of the Budgetary Balance
to Economic Shocks
Changes in economic assumptions affect the projections for revenues and expenses. The following tables illustrate the sensitivity of the budgetary balance to a number of economic shocks:
- A one-year, 1-percentage-point decrease in real GDP growth driven equally by lower productivity and employment growth.
- A decrease in nominal GDP growth resulting solely from a one-year, 1‑percentage-point decrease in the rate of GDP inflation.
- A sustained 100-basis-point increase in all interest rates.
These sensitivities are generalized rules of thumb that assume any decrease in economic activity is proportional across income and expenditure components.
| Year 1 | Year 2 | Year 5 | |
|---|---|---|---|
| (billions of dollars) | |||
| Federal revenues | |||
| Tax revenues | |||
| Personal income tax | -1.7 | -1.8 | -2.1 |
| Corporate income tax | -0.4 | -0.4 | -0.4 |
| Goods and Services Tax | -0.3 | -0.3 | -0.4 |
| Other | -0.2 | -0.2 | -0.3 |
| Total tax revenues | -2.6 | -2.7 | -3.2 |
| Employment Insurance premiums | -0.2 | -0.2 | 1.8 |
| Other revenues | 0.0 | 0.0 | 0.0 |
| Total budgetary revenues | -2.7 | -2.9 | -1.4 |
| Federal expenses | |||
| Major transfers to persons | |||
| Elderly benefits | 0.0 | 0.0 | 0.0 |
| Employment Insurance benefits | 0.7 | 0.7 | 0.8 |
| Children's benefits | 0.0 | 0.0 | 0.0 |
| Total | 0.7 | 0.7 | 0.8 |
| Other program expenses | -0.2 | -0.2 | -0.4 |
| Public debt charges | 0.0 | 0.1 | 0.5 |
| Total expenses | 0.6 | 0.6 | 0.9 |
| Budgetary balance | -3.3 | -3.6 | -2.3 |
| Note: Numbers may not add due to rounding. | |||
A 1-percentage-point decrease in real GDP growth reduces the budgetary balance by $3.3 billion in the first year, $3.6 billion in the second year and $2.3 billion in the fifth year.
- Tax revenues from all sources fall by a total of $2.6 billion in the first year, $2.7 billion in the second year and $3.2 billion in the fifth year. Personal income tax revenues decrease as employment and wages and salaries fall. Corporate income tax revenues fall as output and profits decrease. GST revenues decrease as a result of lower consumer spending associated with the fall in employment and personal income.
- EI premium revenues decrease in the early years as employment and wages and salaries fall before increasing at the end of the period, when the premium rate is raised to recoup the cost of higher benefit payments.
- Expenses rise, mainly reflecting higher EI benefits (due to an increase in the number of unemployed) and higher public debt charges (reflecting a higher stock of debt due to the lower budgetary balance).
| Year 1 | Year 2 | Year 5 | |
|---|---|---|---|
| (billions of dollars) | |||
| Federal revenues | |||
| Tax revenues | |||
| Personal income tax | -1.7 | -1.4 | -1.5 |
| Corporate income tax | -0.4 | -0.4 | -0.4 |
| Goods and Services Tax | -0.3 | -0.3 | -0.4 |
| Other | -0.2 | -0.2 | -0.3 |
| Total tax revenues | -2.6 | -2.3 | -2.5 |
| Employment Insurance premiums | -0.1 | -0.2 | 0.1 |
| Other revenues | -0.1 | -0.1 | -0.1 |
| Total budgetary revenues | -2.7 | -2.6 | -2.5 |
| Federal expenses | |||
| Major transfers to persons | |||
| Elderly benefits | -0.2 | -0.4 | -0.5 |
| Employment Insurance benefits | -0.1 | -0.1 | -0.1 |
| Children's benefits | -0.1 | -0.1 | -0.1 |
| Total | -0.4 | -0.6 | -0.7 |
| Other program expenses | -0.3 | -0.3 | -0.8 |
| Public debt charges | -0.4 | 0.0 | 0.2 |
| Total expenses | -1.1 | -0.9 | -1.3 |
| Budgetary balance | -1.6 | -1.6 | -1.2 |
| Note: Numbers may not add due to rounding. | |||
A 1-percentage-point decrease in nominal GDP growth resulting solely from lower GDP inflation (assuming that the Consumer Price Index moves in line with GDP inflation) lowers the budgetary balance by $1.6 billion in the first year, $1.6 billion in the second year and $1.2 billion in the fifth year.
- Lower prices result in lower nominal income and, as a result, personal income tax, corporate income tax and GST revenues all decrease, reflecting declines in the underlying nominal tax bases.
- EI premium revenues decrease marginally in the early years in response to lower earnings before increasing slightly at the end of the period when the premium rate is raised to return the EI account to cumulative balance. Unlike the real GDP shock, EI benefits do not rise since unemployment is unaffected by price changes.
- Partly offsetting lower revenues are the declines in the cost of statutory programs that are indexed to inflation, such as elderly benefit payments and the Canada Child Tax Benefit, as well as federal wage and non-wage expenses. Payments under these programs are smaller if inflation is lower. Public debt charges decline in the first year due to lower costs associated with Real Return Bonds, then rise due to the higher stock of debt.
| Year 1 | Year 2 | Year 5 | |
|---|---|---|---|
| (billions of dollars) | |||
| Federal revenues | 1.0 | 1.3 | 1.8 |
| Federal expenses | 1.8 | 3.0 | 3.9 |
| Budgetary balance | -0.8 | -1.7 | -2.1 |
An increase in interest rates decreases the budgetary balance by $0.8 billion in the first year, $1.7 billion in the second year and $2.1 billion in the fifth year. The decline stems entirely from increased expenses associated with public debt charges. The impact on debt charges rises through time as longer-term debt matures and is refinanced at higher rates. Moderating the overall impact is an increase in revenues associated with the increase in the rate of return on the Government's interest-bearing assets, which are recorded as part of non-tax revenues.
Annex—Updates to Tables
| Projection | ||||||
|---|---|---|---|---|---|---|
| 2010– 2011 |
2011– 2012 |
2012– 2013 |
2013– 2014 |
2014– 2015 |
2015– 2016 |
|
| (billions of dollars) | ||||||
| Budgetary revenues | 0.0 | 0.0 | 0.0 | 0.0 | 0.0 | 0.0 |
| Program expenses | -4.4 | 2.7 | 0.0 | 0.0 | 0.0 | 0.0 |
| Public debt charges | 0.1 | 0.0 | 0.0 | 0.0 | 0.0 | 0.0 |
| Total expenses | -4.3 | 2.7 | 0.0 | 0.0 | -0.1 | 0.0 |
| Budgetary balance | 4.3 | -2.7 | 0.0 | 0.1 | 0.0 | 0.0 |
| Other comprehensive income | -0.9 | |||||
| Federal debt | -3.3 | -0.6 | -0.6 | -0.7 | -0.7 | -0.7 |
| Per cent of GDP | ||||||
| Budgetary revenues | 0.0 | 0.0 | -0.1 | -0.1 | 0.0 | -0.1 |
| Program expenses | -0.3 | 0.1 | 0.0 | 0.0 | 0.0 | 0.0 |
| Public debt charges | 0.0 | 0.0 | 0.0 | 0.0 | 0.0 | 0.0 |
| Budgetary balance | 0.3 | -0.2 | 0.0 | 0.0 | 0.0 | 0.0 |
| Federal debt | -0.3 | -0.1 | -0.1 | -0.1 | -0.1 | 0.0 |
| Note: Totals may not add due to rounding. | ||||||
| Projection | ||||||
|---|---|---|---|---|---|---|
| 2010– 2011 |
2011– 2012 |
2012– 2013 |
2013– 2014 |
2014– 2015 |
2015– 2016 |
|
| (billions of dollars) | ||||||
| Income taxes | ||||||
| Personal income tax | 0.0 | 0.0 | 0.0 | 0.0 | 0.0 | 0.0 |
| Corporate income tax | 0.4 | 0.4 | 0.4 | 0.4 | 0.3 | 0.4 |
| Non-resident income tax | -0.4 | -0.4 | -0.4 | -0.4 | -0.5 | -0.4 |
| Total income tax | 0.0 | 0.0 | 0.0 | 0.0 | -0.1 | 0.0 |
| Excise taxes/duties | ||||||
| Goods and Services Tax | -0.1 | 0.0 | -0.1 | 0.1 | 0.1 | 0.0 |
| Customs import duties | 0.1 | 0.0 | 0.0 | 0.0 | 0.0 | 0.0 |
| Other excise taxes/duties | 0.1 | 0.1 | 0.0 | 0.0 | 0.1 | 0.0 |
| Total excise taxes/duties | 0.0 | -0.1 | 0.0 | 0.1 | 0.1 | 0.1 |
| Total tax revenues | 0.0 | 0.0 | 0.0 | -0.1 | 0.0 | 0.0 |
| Employment Insurance premium revenues |
0.0 | 0.0 | 0.0 | 0.0 | 0.0 | 0.0 |
| Other revenues | 0.0 | 0.1 | 0.0 | 0.1 | 0.0 | 0.0 |
| Total budgetary revenues | 0.0 | 0.0 | 0.0 | 0.0 | 0.0 | 0.0 |
| Per cent of GDP | ||||||
| Personal income tax | 0.0 | 0.0 | -0.1 | -0.1 | 0.0 | 0.0 |
| Corporate income tax | 0.0 | 0.0 | 0.0 | 0.0 | 0.0 | 0.0 |
| Goods and Services Tax | 0.0 | 0.0 | 0.0 | 0.0 | 0.0 | 0.0 |
| Total tax revenues | -0.1 | 0.0 | 0.0 | -0.1 | 0.0 | 0.0 |
| Employment Insurance premium revenues |
0.0 | 0.0 | 0.0 | 0.0 | 0.0 | 0.0 |
| Other revenues | 0.0 | 0.0 | 0.0 | 0.0 | 0.0 | 0.0 |
| Total budgetary revenues | 0.0 | 0.0 | -0.1 | -0.1 | 0.0 | -0.1 |
| Note: Totals may not add due to rounding | ||||||
| Projection | ||||||
|---|---|---|---|---|---|---|
| 2010– 2011 |
2011– 2012 |
2012– 2013 |
2013– 2014 |
2014– 2015 |
2015– 2016 |
|
| (billions of dollars) | ||||||
| Major transfers to persons | ||||||
| Elderly benefits | 0.0 | 0.0 | 0.0 | 0.0 | 0.0 | 0.0 |
| Employment Insurance (EI) benefits1 | 0.0 | 0.0 | 0.0 | 0.0 | 0.0 | 0.0 |
| Children's benefits | 0.0 | 0.0 | 0.0 | 0.0 | 0.0 | 0.0 |
| Total | 0.0 | 0.0 | 0.0 | 0.0 | 0.0 | 0.0 |
| Major transfers to other levels of government | ||||||
| Federal transfers in support of health and social programs |
0.0 | 0.0 | 0.0 | 0.0 | 0.0 | 0.0 |
| Fiscal arrangements2 | 0.0 | 0.0 | 0.0 | 0.0 | 0.0 | 0.0 |
| Alternative Payments for Standing Programs | 0.0 | 0.0 | 0.0 | 0.0 | 0.0 | 0.0 |
| Canada's cities and communities | 0.0 | 0.0 | 0.0 | 0.0 | 0.0 | 0.0 |
| Other3 | 0.0 | 2.2 | 0.0 | 0.0 | 0.0 | 0.0 |
| Total | 0.0 | 2.2 | 0.0 | 0.0 | 0.0 | 0.0 |
| Direct program expenses | ||||||
| Transfer payments | -1.8 | 0.4 | 0.0 | -0.1 | 0.0 | -0.1 |
| Capital amortization | 0.0 | 0.0 | 0.0 | 0.0 | 0.0 | 0.0 |
| Other operating expenses | -0.9 | 0.0 | 0.0 | 0.0 | 0.0 | 0.0 |
| Operating expenses subject to freeze | -1.7 | 0.0 | 0.0 | 0.0 | 0.0 | 0.0 |
| Total | -4.4 | 0.5 | 0.0 | 0.0 | 0.0 | 0.0 |
| Total program expenses | -4.4 | 2.7 | 0.0 | 0.0 | 0.0 | 0.0 |
| Per cent of GDP | ||||||
| Major transfers to persons | 0.0 | 0.0 | 0.0 | 0.0 | 0.0 | 0.0 |
| Major transfers to other levels of government | 0.0 | 0.1 | 0.0 | 0.0 | 0.0 | 0.0 |
| Direct program expenses | -0.3 | 0.0 | -0.1 | 0.0 | 0.0 | 0.0 |
| Total program expenses | -0.3 | 0.1 | 0.0 | 0.0 | 0.0 | 0.0 |
|
Note: Totals may not add due to rounding 1 EI benefits include regular EI benefits, sickness, maternity, parental, compassionate care, fishing and work-sharing benefits, and employment benefits and support measures. These represent 90 per cent of total EI program expenses. The remaining EI costs relate mainly to administration costs. 2 Fiscal arrangements include Equalization, Territorial Formula Financing, the Youth Allowances Recovery and statutory subsidies. 3 Other major transfers to other levels of government include transitional payments, transfer protection payments (2010–11 and 2011–12), payments under the 2005 Offshore Accords and a provision in 2011–12 in support of the conclusion of a satisfactory agreement between Canada and Quebec on sales tax harmonization. |
||||||
| Projection | ||||||
|---|---|---|---|---|---|---|
| 2010– 2011 |
2011– 2012 |
2012– 2013 |
2013– 2014 |
2014– 2015 |
2015– 2016 |
|
| (billions of dollars) | ||||||
| Budgetary balance | 4.3 | -2.7 | 0.0 | 0.1 | 0.0 | 0.0 |
| Non-budgetary transactions | ||||||
| Pensions and other accounts | -1.1 | 0.0 | 0.0 | 0.0 | 0.0 | 0.0 |
| Non-financial assets | 2.2 | 0.0 | 0.0 | 0.0 | 0.0 | 0.0 |
| Loans, investments and advances | ||||||
| Enterprise Crown corporations | -1.7 | 0.0 | 0.0 | 0.0 | 0.0 | 0.0 |
| Insured Mortgage Purchase Program | 1.7 | 0.0 | 0.0 | 0.0 | -1.7 | 0.0 |
| Other | -1.9 | 1.7 | 0.0 | 0.1 | 0.0 | 0.0 |
| Total | -1.9 | 1.7 | 0.0 | 0.0 | -1.7 | 0.0 |
| Other transactions | -6.2 | -0.6 | 0.0 | 0.0 | 0.0 | 0.0 |
| Total | -7.0 | 1.1 | 0.0 | 0.0 | -1.7 | 0.0 |
| Financial source/requirement | -2.7 | -1.6 | 0.0 | 0.1 | -1.7 | 0.0 |
| Note: Totals may not add due to rounding. | ||||||