
Archived - Economic and Fiscal Overview
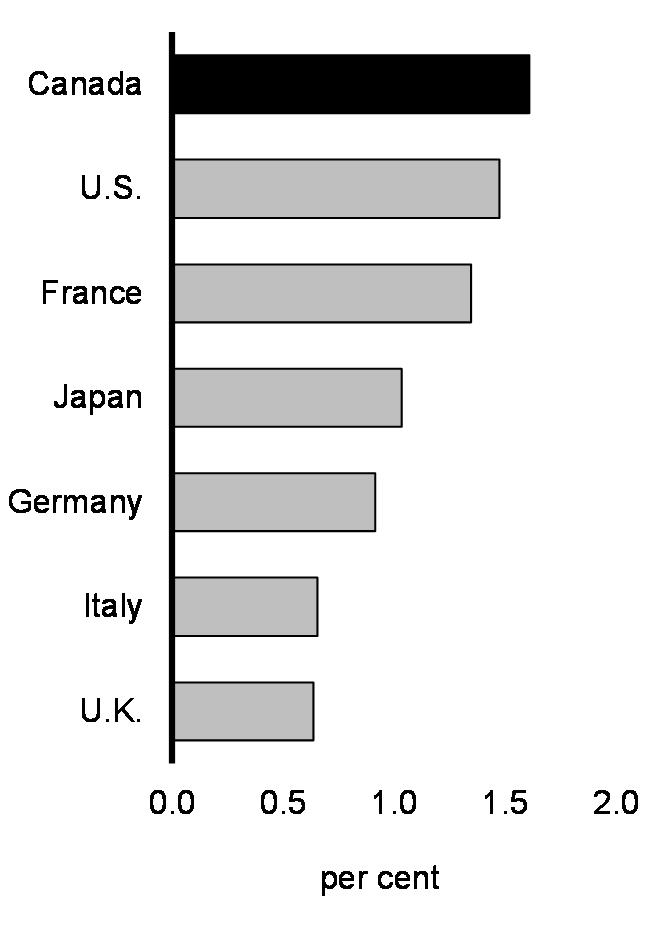
Following a strong recovery from the pandemic recession, Canada's economy has remained resilient. Our unemployment rate remains low, over a million more Canadians are employed compared to when the pandemic hit, and wage growth has outpaced inflation for the past nine months. The International Monetary Fund (IMF) projects that Canada's economic plan will deliver the strongest economic growth in the G7 next year (Chart 1), despite a subdued global economic outlook.
Yet for many Canadians, this remains a challenging time. Higher housing costs and still-elevated consumer prices are putting pressure on families every month. To combat inflation around the world, the world's central banks have implemented the steepest series of interest rate increases in decades. These interest rate increases have led to a slowing of the Canadian economy, though private sector economists do not expect inflation to return to 2 per cent until the end of 2024.
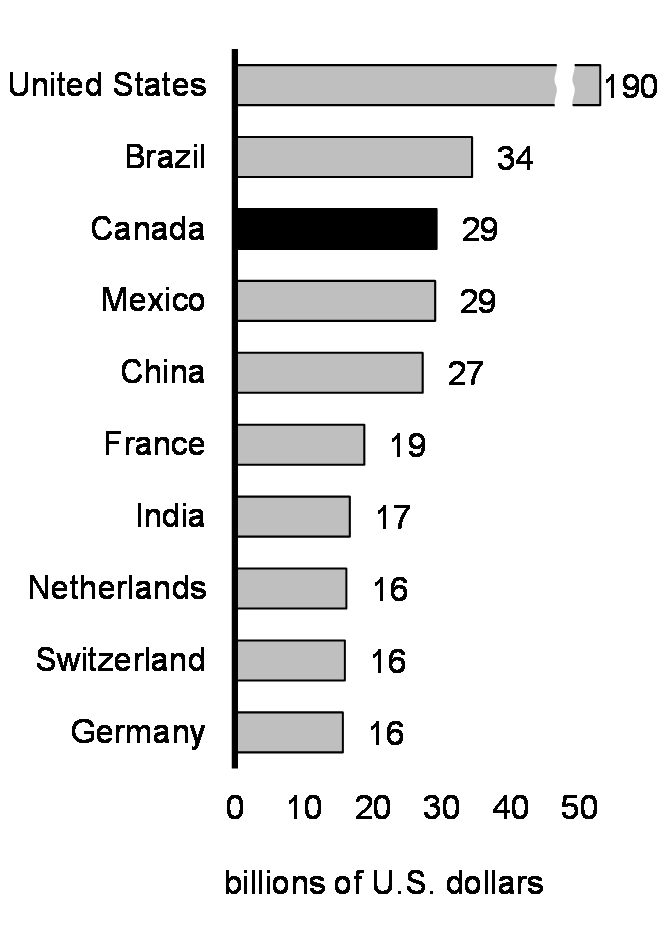
The government's economic plan is helping Canadians navigate these economic headwinds. Investments in Canadians—ranging from the Canada Child Benefit, to enhanced benefits and pensions for seniors, to stronger public health care and a Canada-wide system of affordable early learning and child care—have supported Canadians' incomes and higher numbers of Canadians participating in the labour force, including a record number of working-age women. Historic investments in infrastructure and Canada's growing clean economy will have both short- and long-term economic benefits—helping to create good careers, vibrant communities, and grow our economy for decades to come. Supported by one of the most competitive tax regimes in the first half of 2023, Canada received the third-most foreign direct investment in the world (Chart 2), which is helping to drive economic growth in communities across the country.
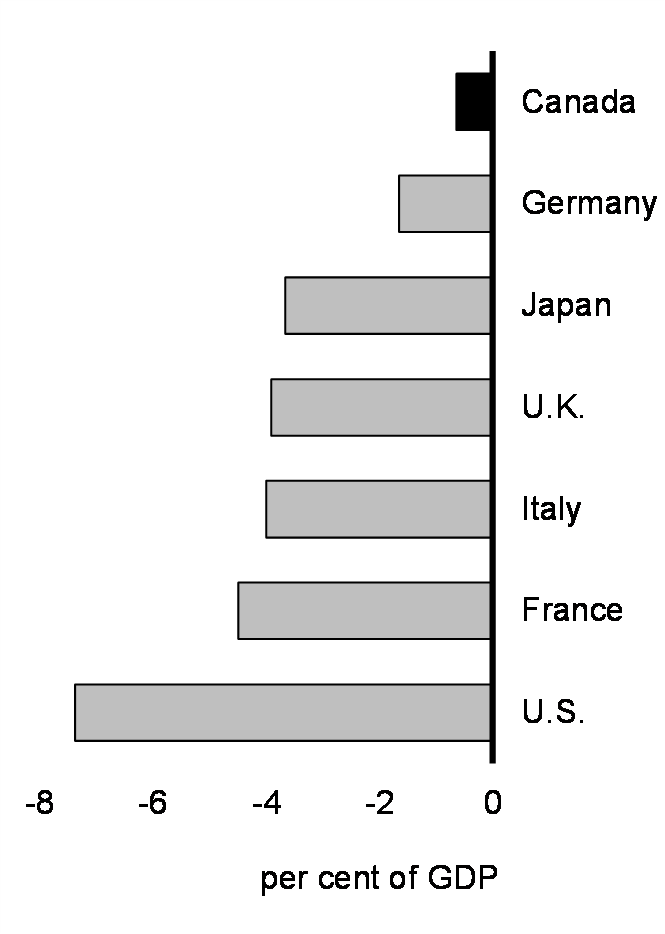
Against this backdrop, the government is also delivering on its commitment to responsible fiscal management. As a result of the government's economic plan, Canada has had the fastest rate of fiscal consolidation in the G7 since the depths of the pandemic and maintains both the lowest deficit- and net debt-to-GDP ratios of all G7 countries (Chart 3). In fact, Canada's net debt as a share of the economy is still lower today than in any other G7 country prior to the pandemic. Over the past three years, despite a volatile global economic environment, the government's responsible economic plan has enabled year-end financial results to consistently better annual deficit targets. This continued commitment to responsible fiscal management, which is the foundation of Canada's AAA credit rating, is essential to the government's ability to continue investing in Canadians and the Canadian economy in the years to come.
IMF Real GDP Growth Projections for 2024, G7 Economies
Top 10 Global Recipients of FDI Inflows, 2023H1
IMF General Government Budgetary Balance Projections for 2024, G7 Economies
1. Recent Economic Developments
Progress on Reducing Inflation
As the global economy recovered from the pandemic, inflation emerged as a major global economic challenge. This reflected a range of external factors, including pandemic-driven economic disruptions, such as lockdowns in China and manufacturing backlogs, as well as surging global commodity prices following Russia's illegal full-scale invasion of Ukraine. Following an easing of these global supply-side challenges and the swift increase in interest rates by central banks around the world, inflation has come down significantly over the past year.
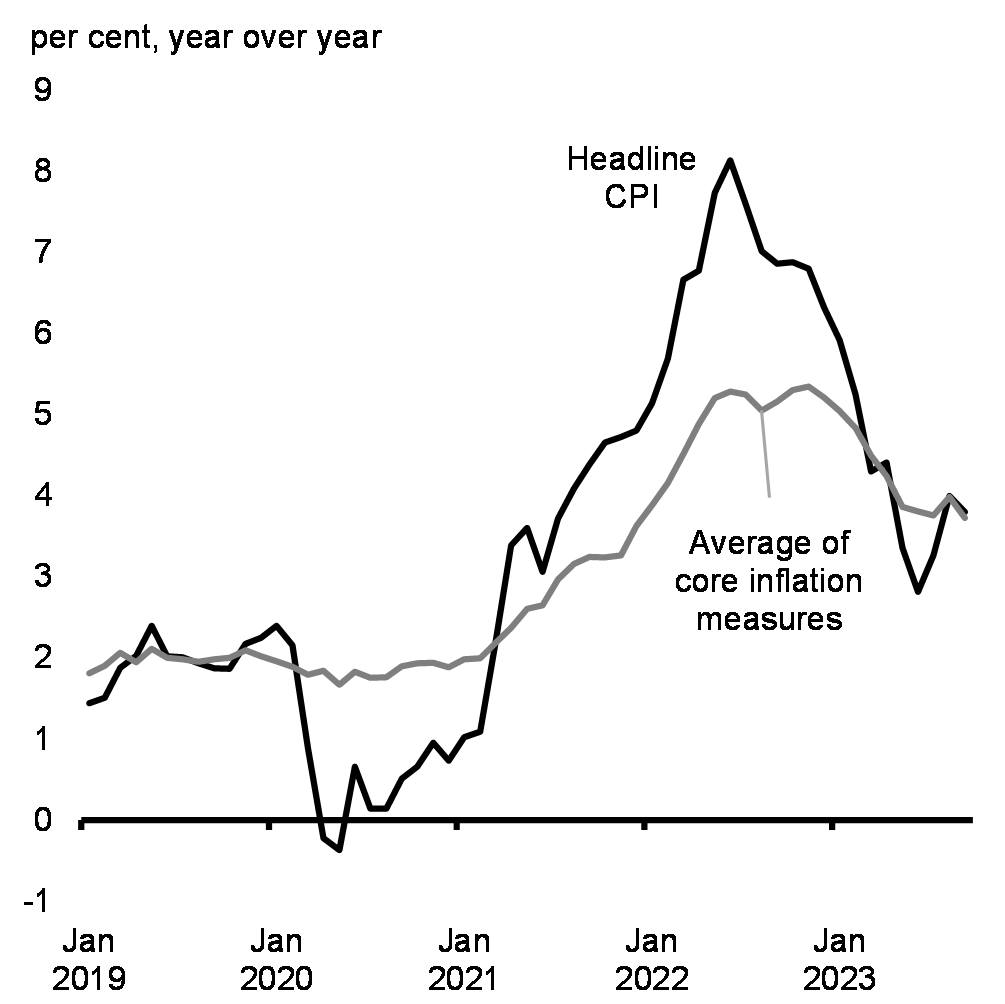
Headline inflation in Canada fell from its June 2022 peak of 8.1 per cent to 3.8 per cent in September 2023 (Charts 4 and 5), while food price inflation has fallen from 11.4 per cent in January 2023 to 5.8 per cent in September 2023.
Consumer Price Inflation Is Falling
Contributions to Decline in Inflation Between June 2022 and September 2023
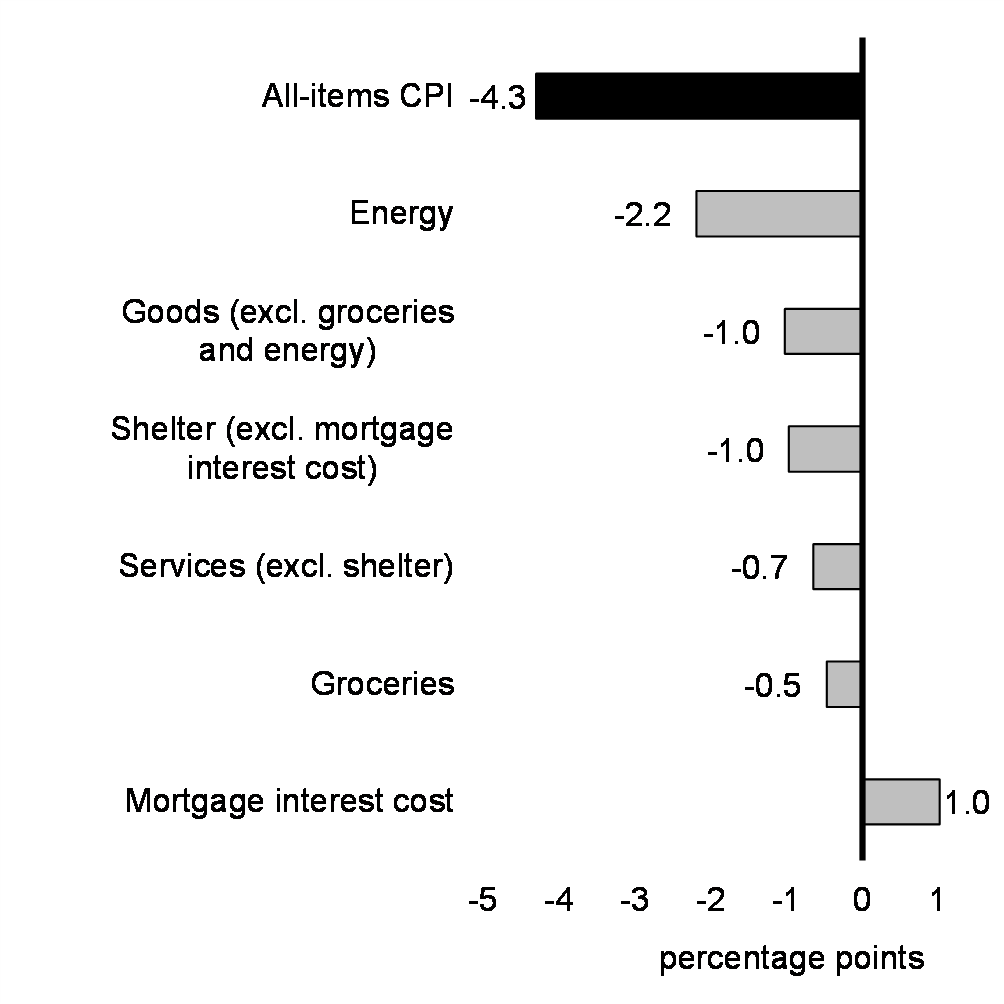
However, the cost of housing remains high, and core inflation measures have remained elevated. Decisions by Saudi Arabia and Russia to cut oil supply have also led to an increase in global energy prices, reversing some of the previous decreases in Canada's headline inflation. Oil prices remain volatile, reflecting uncertainty about global demand and supply conditions, including the impact of the sharp tightening in global financial conditions, notably from higher long-term interest rates, and geopolitical uncertainty stemming from the conflict between Israel and Hamas following the Hamas terrorist attacks perpetrated against Israel.
In response to elevated inflation, central banks around the world have implemented interest rate increases in a swift and coordinated fashion. Since early 2022, the Bank of Canada has increased from historic lows its benchmark interest rate by 4.75 percentage points to 5 per cent in July 2023 and held it steady since. This is the fastest monetary policy tightening cycle since the early 1980s, and the highest benchmark rate in more than 20 years. These actions, combined with global interest rate increases and market uncertainty over how long interest rates may need to remain elevated, have led to a slowing of the Canadian economy and higher borrowing costs for Canadians, businesses, and the government. With core inflation remaining elevated and the full effect of higher interest rates still to materialize, the Bank of Canada projects inflation to be about 3.5 per cent until around the middle of next year before returning to 2 per cent in 2025.
Stabilizing Prices and Making Life More Affordable
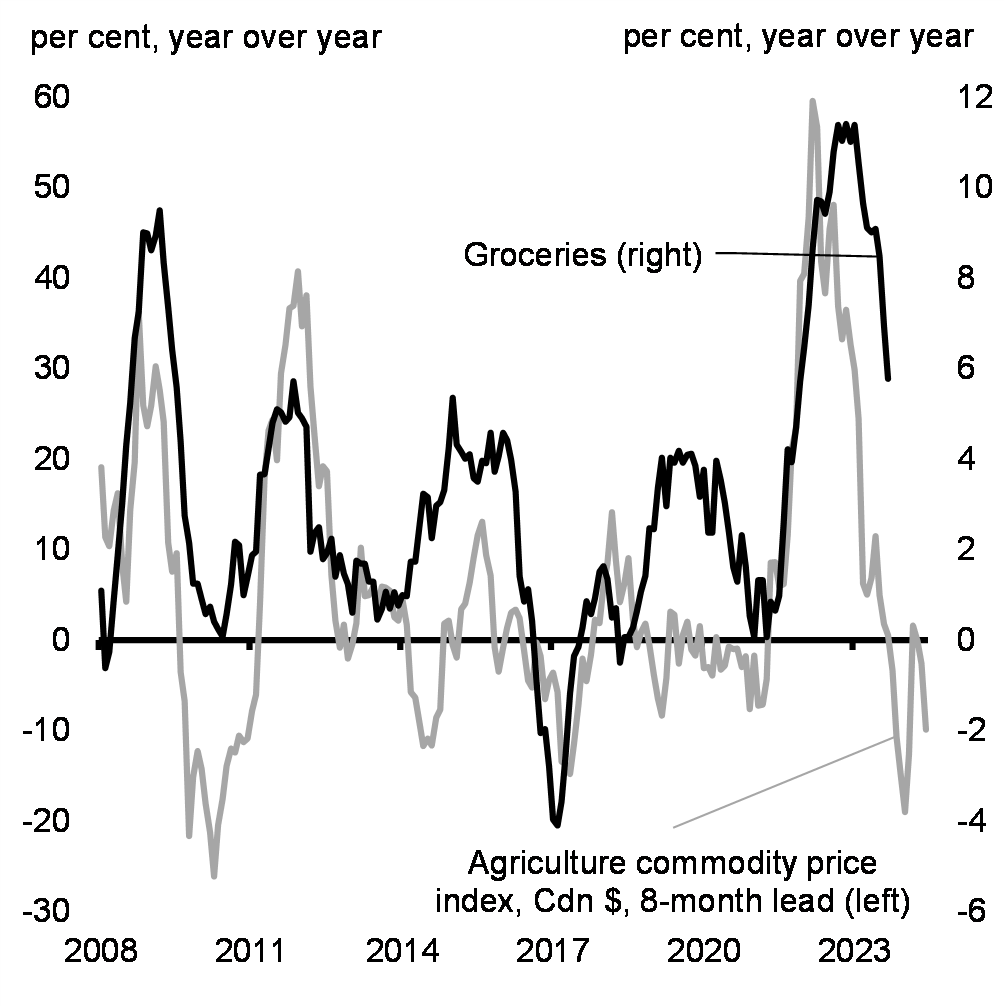
Global food prices rose sharply in 2022, driving up the cost of living for all Canadians. This increase was led by higher commodity prices stemming from the impacts of climate change and the illegal Russian invasion of Ukraine, and was compounded by higher production costs resulting from global supply chain disruptions and global labour shortages. With demand remaining strong, businesses have passed on these cost increases, leaving consumers to bear the full brunt of higher prices. While inflation for groceries has eased after peaking at 11.4 per cent in January 2023, it remains too high at 5.8 per cent as of September 2023 (Chart 6).
The government has taken action to respond to this challenge, including by providing a new Grocery Rebate, of up to $467 for a family of four, to approximately 11 million low- and modest-income Canadians. The government has also secured agreements from Canada's largest grocers and food processors to help stabilize prices, and in September, introduced legislation to amend the Competition Act in order to enhance competition, particularly in the grocery sector.
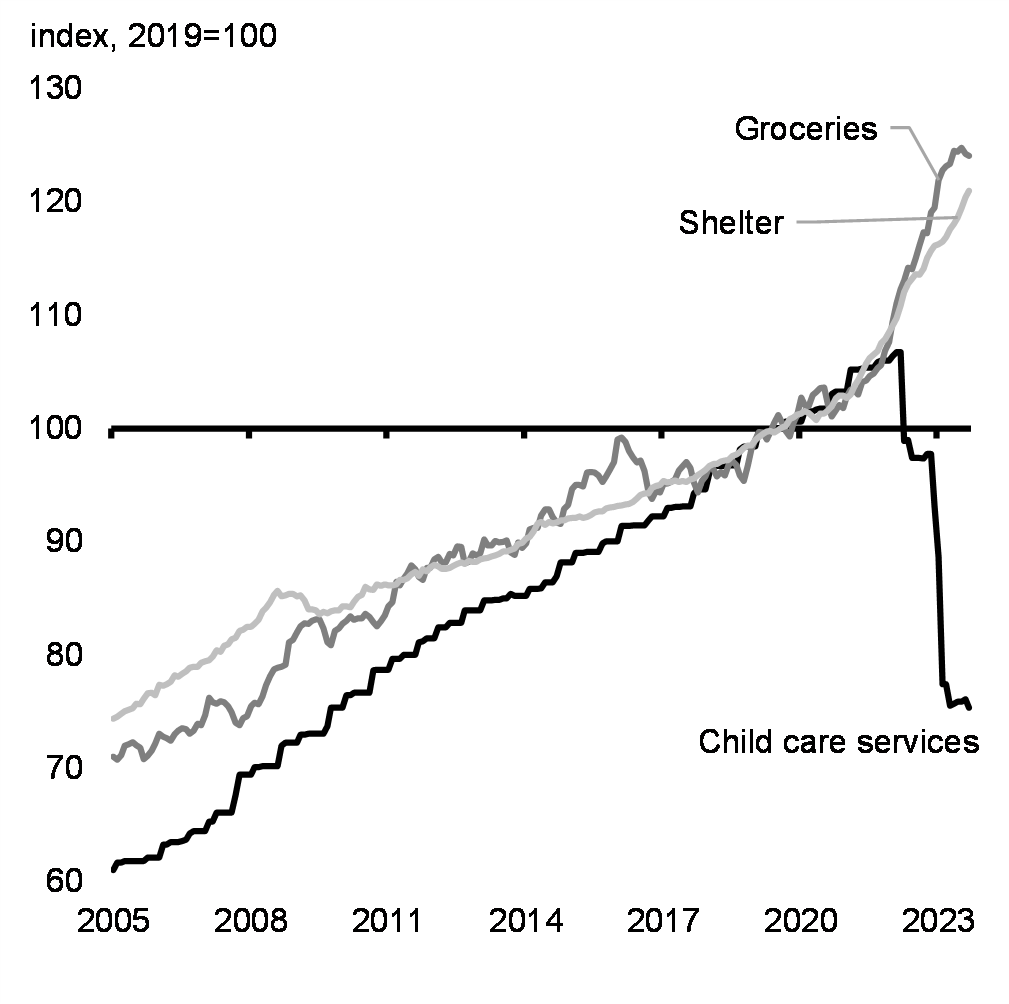
Many key pillars of Canada's social safety net are indexed to inflation, including the Canada Child Benefit, the Guaranteed Income Supplement, and Old Age Security. Other measures, including the federal government's new Canada-wide system of affordable early learning and child care, are also helping to make life more affordable for Canadians today (Chart 7). Already, six provinces and territories—Québec, Manitoba, Saskatchewan, Newfoundland and Labrador, Yukon, and Nunavut—have delivered $10-a-day or less regulated child care, and the remaining provinces and territories have reduced fees by at least 50 per cent and are on track to reaching fees of an average of $10-a-day by March 2026. These investments have also supported Québec to further improve its existing child care system through the creation of new spaces. Provincial estimates across Canada place annual per-child savings from between $2,000 (P.E.I.) to $14,300 (Nunavut), making life more affordable for families and supporting the achievement of a record 85.7 per cent labour force participation rate for Canadian women in their prime working years.
Agriculture Prices and Food Inflation
Consumer Price Index for Child Care, Food, and Housing
Canada's Jobs Market and Economic Fundamentals Remain Strong
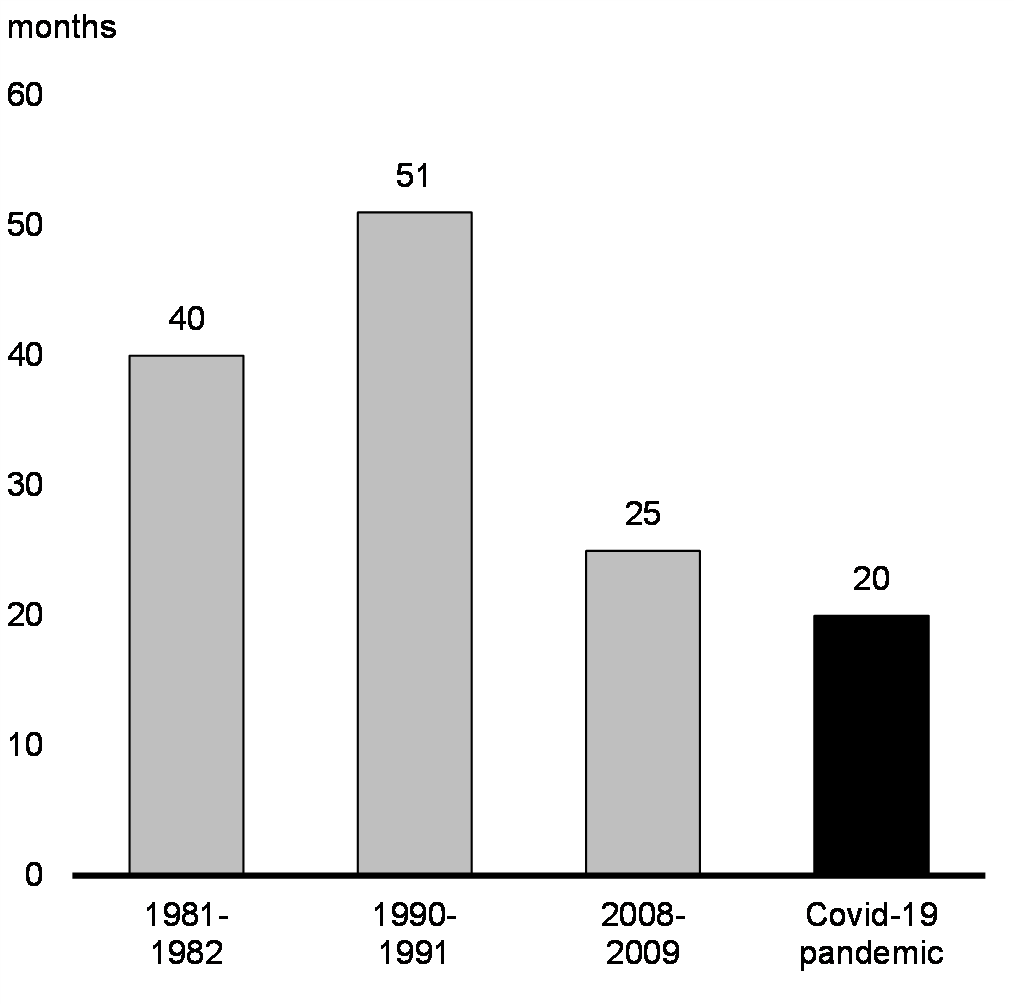
Canada's recovery from the pandemic marked the fastest recovery of the past four recessions (Chart 8). Emergency federal spending, including the Canada Emergency Wage Subsidy and small business supports which helped keep businesses afloat and Canadians on payroll, helped Canada avoid the longer-lasting impacts that have been typical of other economic downturns. Throughout the subsequent period of elevated inflation and rising interest rates, the Canadian economy has demonstrated sustained strength, with Canada posting the fastest growth in the G7 over 2022 and the first half of 2023 (Chart 9).
Among the factors aiding this robust economic activity has been strong population growth. Canada's population has grown by more than double its pre-pandemic pace. A growing number of immigrants, combined with notable improvements in their labour market integration, is positive for Canada's long-run economic prosperity and is a significant economic advantage when compared to the demographic challenges being experienced by many peer countries.
Number of Months to Recover 100 per cent of Pre-Recession Employment
Real GDP Growth in G7 Economies, 2022Q1 to 2023Q2
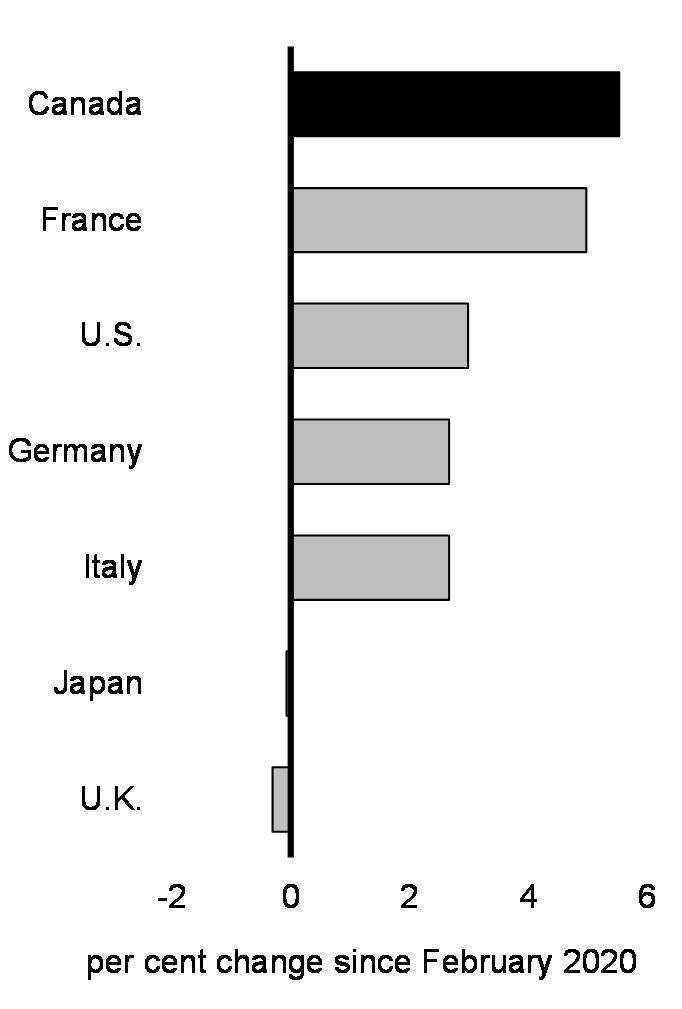
Canada's labour market also continues to be strong. Canada's jobs recovery has been the fastest in the G7 (Chart 10), and over a million more Canadians are employed today than when COVID first hit. The labour market has benefitted from strong population growth and higher labour force participation, including among women (Chart 11). This increased labour supply has been accompanied by a higher share of working-age Canadians employed (Chart 12), helping to meet strong demand for workers across the country and boosting the income of Canadians.
Change in Employment in G7 Economies Since 2020
Women's Labour Force Participation Rate, 25-54 Years Old
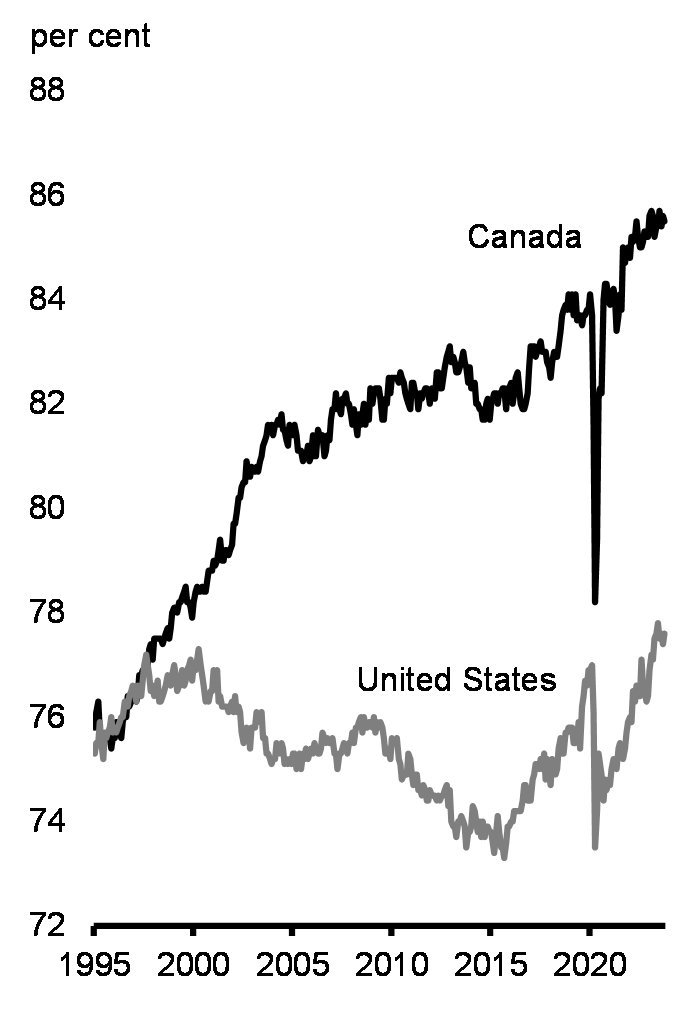
Share of Canadians aged 15 to 64 Employed

Recently, higher interest rates and weaker global economic activity have led to a slowing in the pace of economic growth in Canada. After growing by 3.8 per cent in 2022 and 2.6 per cent in the first quarter of 2023, the Canadian economy contracted modestly in the second quarter. While part of this decline was tied to temporary factors, including a record-breaking wildfire season and a higher than usual number of strikes, higher interest rates also slowed demand for housing and other large purchases.
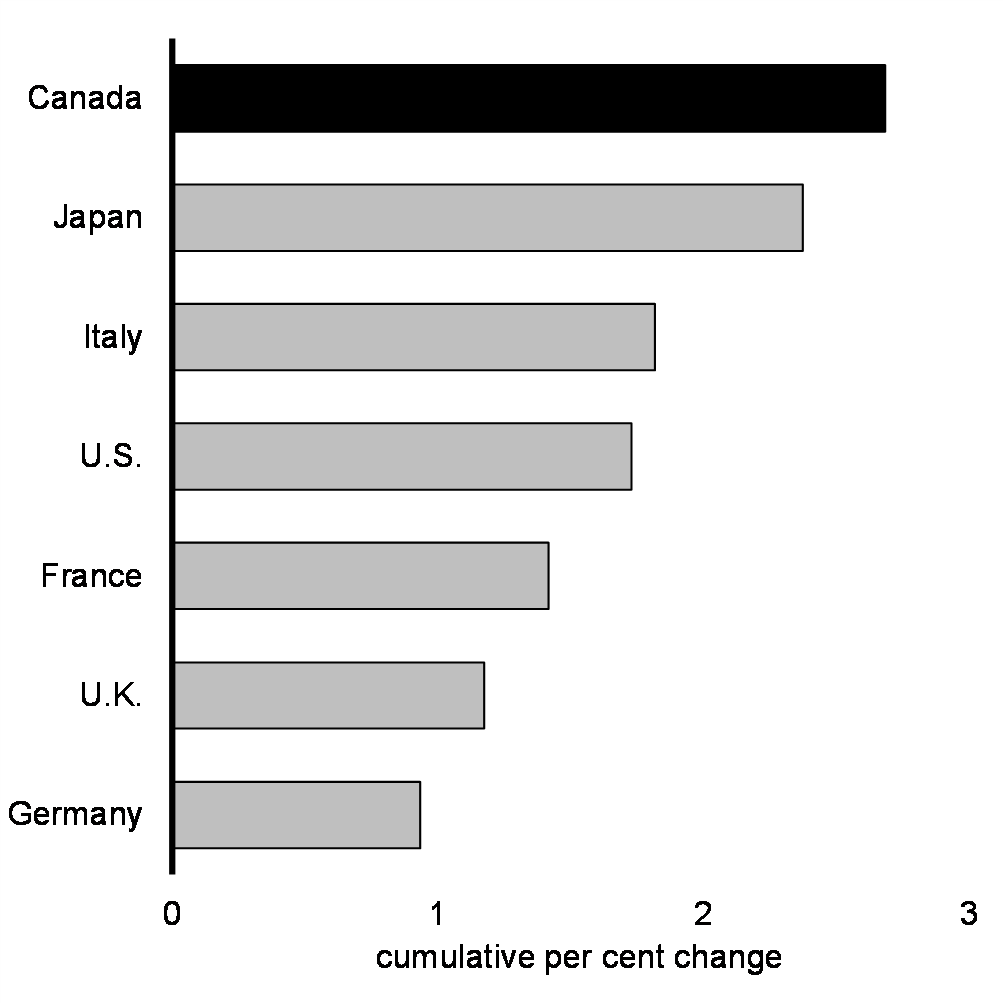
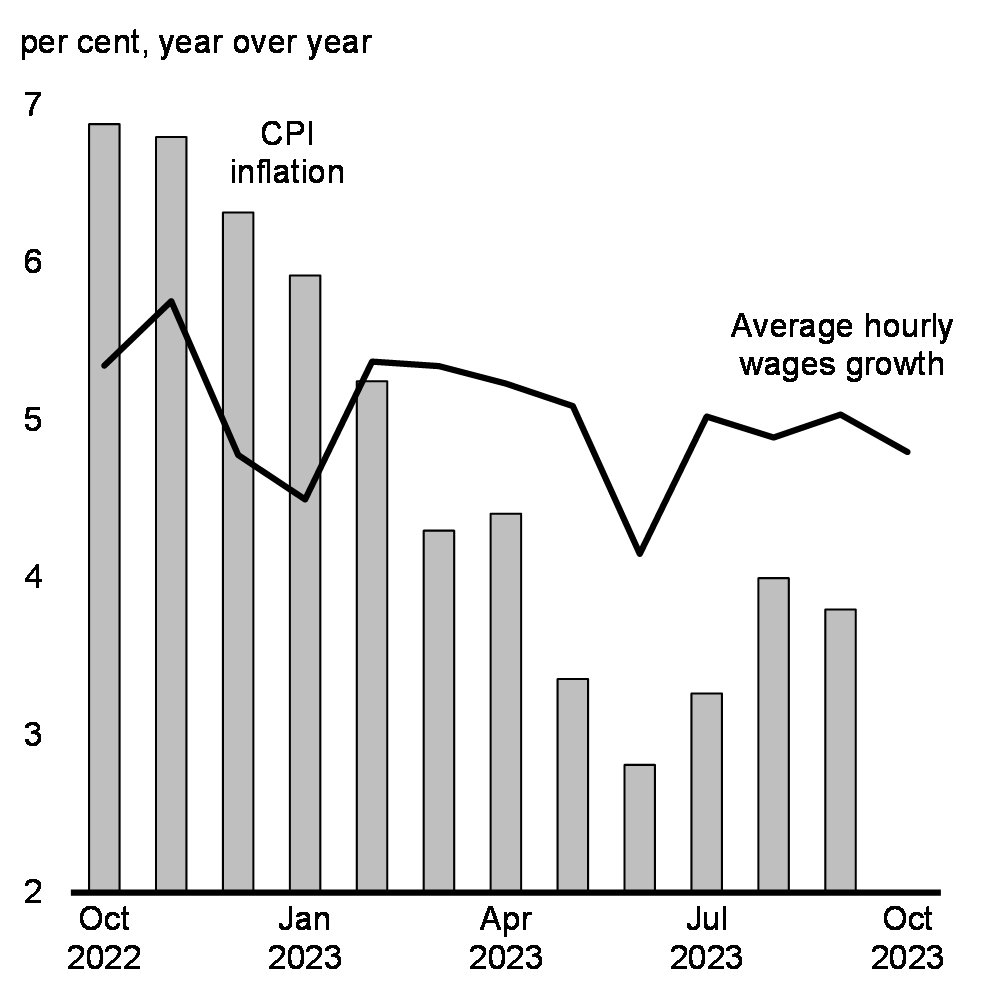
As the economy moderates, the labour market remains strong with no notable rise in layoffs. Canada's unemployment rate is currently lower than it was at any time under the previous government and has remained at or below its pre-pandemic level for 21 consecutive months (Chart 13). Canada's strong labour market has also supported solid wage growth, with wages outpacing inflation for the past nine months (Chart 14). Compared to before the pandemic, inflation-adjusted household disposable income has risen by 8 per cent—driven by a 10-per-cent increase in wage income—and inflation-adjusted wealth has increased by 14 per cent. Improvements in household income and wealth have been broad-based across the income distribution, with the lowest income quintiles seeing the largest increases.
Unemployment Rate

Hourly Wage Growth and Consumer Price Inflation
2. Canadian Economic Outlook
Private Sector Economists Expect Canada to Avoid Recession
The Department of Finance surveyed a group of private sector economists in September 2023. The average of private sector forecasts has been used as the basis for economic and fiscal planning since 1994, helping to ensure objectivity and transparency, and introducing an important element of independence into the government's economic and fiscal forecast.
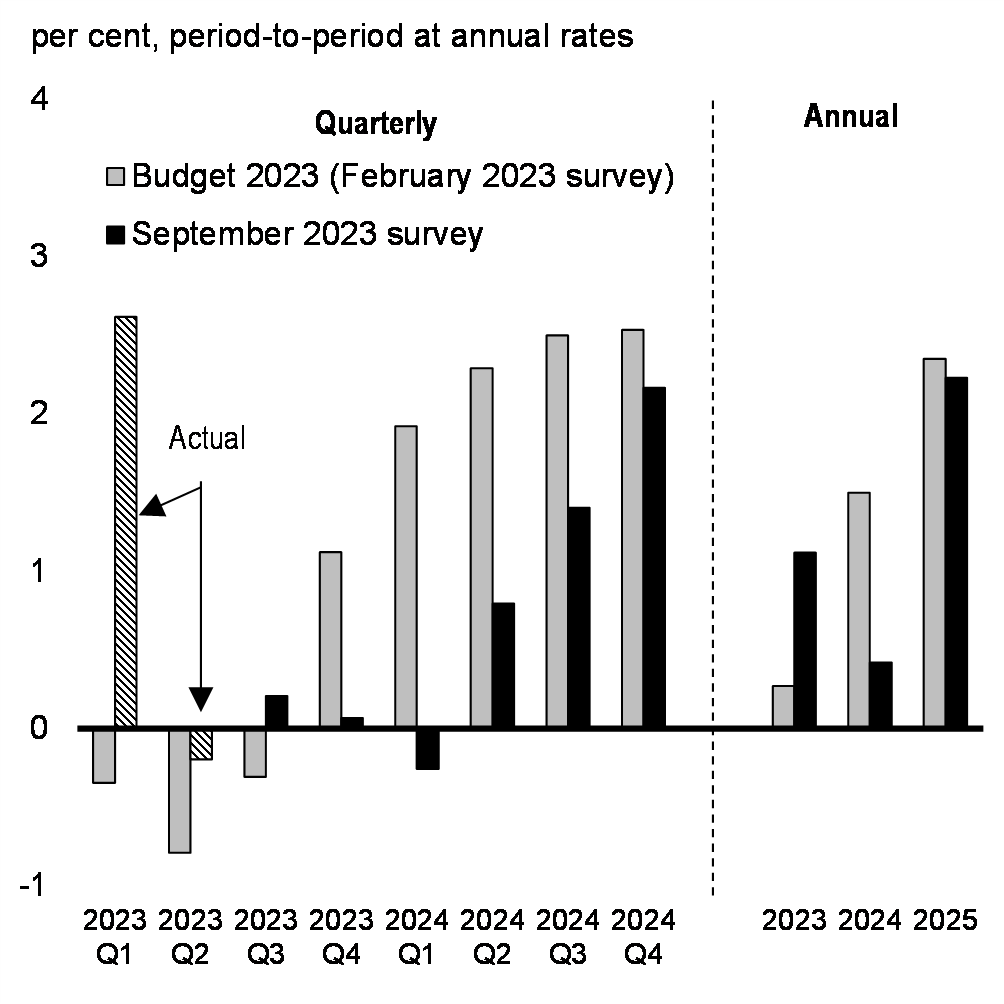
Private sector economists have revised their 2023 forecasts since Budget 2023. The Canadian economy is now expected to avoid a recession, and instead see subdued growth in the coming quarters as the impacts of higher interest rates continue to build (Chart 15). A gradual return to stronger growth is then expected over the course of 2024. Overall, private sector economists expect real GDP growth to be 1.1 per cent in 2023—up from the 0.3 per cent projected in Budget 2023. Growth of 0.4 per cent is expected for 2024, compared to the 1.5 per cent projected in Budget 2023, with growth projected to rebound to 2.2 per cent in 2025.
Largely reflecting stronger economic growth, the level of nominal GDP in 2023 is expected to be $32 billion higher than Budget 2023 projections. However, this stronger growth is being tempered by elevated interest rates. With the economy expected to weaken over the next year, this nominal GDP difference with Budget 2023 narrows to zero in 2024 and is lower by $2 billion in 2025. Nominal GDP is then expected to be about $17 billion higher on average per year over 2026 and 2027 compared to Budget 2023 projections, reflecting a better outlook for real GDP and higher GDP inflation in the outer years.
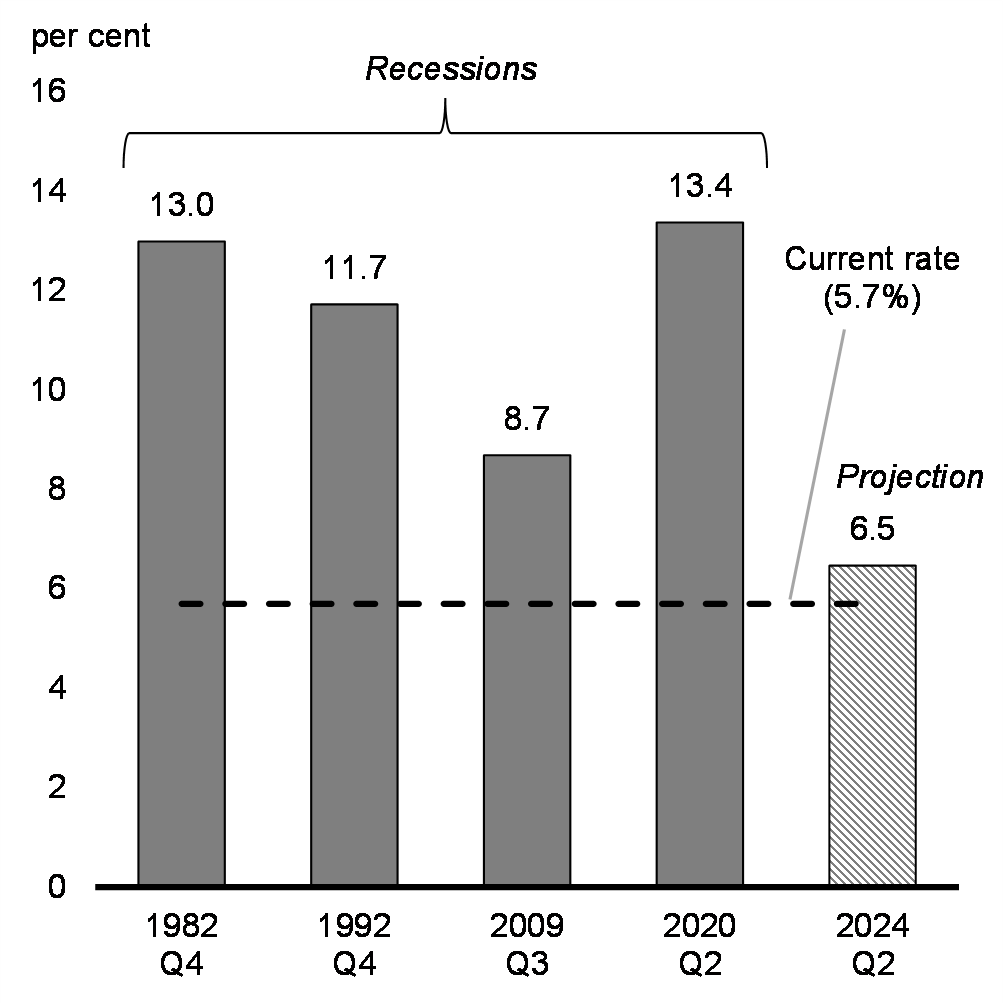
As the economy slows, the unemployment rate is expected to rise to 6.5 per cent in the second quarter of next year, remaining historically low and far below the peaks experienced during recessions (Chart 16). Given solid population growth is expected, much of this adjustment would reflect a slower pace of hiring, rather than a large number of layoffs. The unemployment rate should ease to an average of 6.2 per cent in 2025.
Private sector economists expect CPI inflation to remain at or above 3 per cent through the first quarter of 2024, with an annual average of 3.8 per cent in 2023, consistent with higher global energy prices and recent data suggesting that underlying inflation remains persistent. Inflation is expected to fall below 3 per cent in the second quarter of 2024, reaching 2 per cent by the end of 2024, and averaging 2.5 per cent in 2024 and 2.1 per cent in 2025.
Interest rates are projected to be higher than in Budget 2023, reflecting the economy's resilience, a higher path for inflation in the near-term, and the Bank of Canada's mid-summer resumption of interest rate hikes. On average in the private sector survey, economists expect no further interest rate hikes from the Bank of Canada above the current overnight rate of 5 per cent. The first full rate cut is expected in the second quarter of 2024, with the policy rate gradually declining to 3.75 per cent by the fourth quarter of 2024 and to an average of 2.9 per cent in 2025.
Real GDP Growth Projections
Peak Unemployment Rates
Economic Scenario Analysis
While the September 2023 private sector survey provides a reasonable basis for economic and fiscal planning, the economic outlook is clouded by a number of key uncertainties which could impact the trajectory of inflation, interest rates, and economic growth. In particular, although data on economic growth and inflation released since the survey have been consistent with private sector economists' forecasts, there has been unexpected volatility in oil prices, in addition to elevated long-term interest rates. Oil prices have been volatile since Saudi Arabia and Russia announced steep cuts to oil production and exports in early summer 2023, with WTI hovering at around US$90 per barrel until mid-October and now slightly below US$80 per barrel. Long-term interest rates rose steeply in September in the U.S. and other advanced economies, including Canada, though have since retreated. The increase reflected, in part, market uncertainty over how long interest rates may need to remain elevated in order to bring down inflation. To facilitate prudent economic and fiscal planning, the Department of Finance has developed scenarios that incorporate these recent developments and consider faster or slower growth tracks relative to the private sector economists' survey.
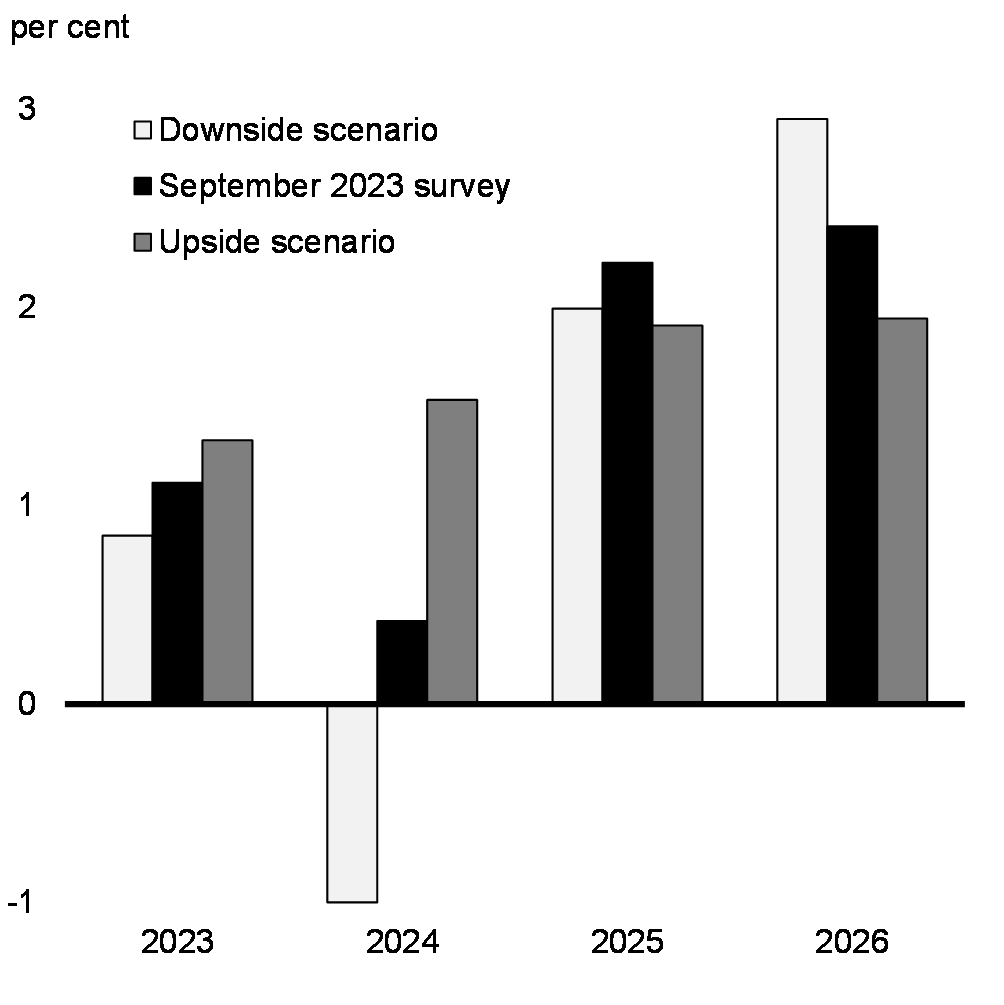
The downside scenario sees a shallow recession in Canada. More persistent underlying inflation—driven by a combination of resilient domestic and global demand, elevated inflation expectations in Canada, and businesses maintaining larger and more frequent price increases—leads to higher interest rates. At the same time, the U.S. also sees persistent inflation, higher rates, and subsequently slower growth. Along with a weak economic recovery in China, this contributes to slower global growth. The combination of higher interest rates and slower global growth results in real GDP in Canada contracting by 1.7 per cent from peak to trough, compared to a period of subdued growth expected in the survey. In addition, slower global growth leads to lower commodity prices, with crude oil prices US$12 per barrel below the survey expectations in 2024. Overall, the level of nominal GDP in Canada is $33 billion below the survey, on average per year, in the downside scenario.
In contrast, the upside scenario sees underlying inflation fall faster than expected in the private sector survey, which allows interest rate cuts to occur sooner. Meanwhile, the healthy labour market and generally resilient household finances continue to support consumer demand, leading to economic growth picking up into 2024. Global demand proves more resilient as China avoids persistent deflation, and resilience in the U.S. labour market supports stronger growth. The improved global outlook, alongside extended crude oil production cuts, leaves oil prices US$10 per barrel above the survey in 2024. Overall, the level of nominal Canadian GDP is $28 billion above the survey, on average per year, in the upside scenario. This is similar to what was projected by the Parliamentary Budget Officer (PBO).
Real GDP Growth
Nominal GDP Level

3. Fiscal Outlook
Canada's Responsible Economic Plan
Years of responsible fiscal stewardship have left Canada in an enviable fiscal position relative to our global peers. In the aftermath of the pandemic, the government's responsible economic plan has enabled proactive investments to support Canadians, while also making critical investments in Canada's long-term prosperity.
Including measures in the 2023 Fall Economic Statement and other new policy actions since Budget 2023, and incorporating the results of the September 2023 survey of private sector economists, the budgetary balance is expected to remain just below the $40.1 billion deficit projected for 2023-24 in Budget 2023, at $40.0 billion or -1.4 per cent of GDP. This improves to an $18.4 billion deficit in 2028-29, or about -0.5 per cent of GDP (Table 1).
| Projection | |||||||
|---|---|---|---|---|---|---|---|
| 2022-2023 | 2023-2024 | 2024-2025 | 2025-2026 | 2026-2027 | 2027-2028 | 2028-2029 | |
| Budgetary balance – Budget 2023 | -43.0 | -40.1 | -35.0 | -26.8 | -15.8 | -14.0 | |
Impact of September private sector survey and other fiscal developments |
7.7 | 2.7 | -0.1 | -7.3 | -7.6 | -6.4 | |
| Budgetary balance before policy actions and measures | -35.3 | -37.4 | -35.1 | -34.1 | -23.3 | -20.4 | -15.1 |
Policy actions since Budget 2023 |
-2.0 | -2.8 | -1.8 | -0.1 | 0.0 | -0.7 | |
2023 Fall Economic Statement measures (by chapter) |
|||||||
Canada's Housing Action Plan |
0.0 | -0.1 | -0.9 | -1.8 | -1.9 | -1.6 | |
Supporting a Strong Middle Class |
-0.3 | 0.1 | 0.2 | -0.2 | 0.0 | 0.0 | |
Building an Economy That Works for All Canadians |
-0.6 | -0.7 | -2.1 | -2.3 | -2.1 | -1.6 | |
Effective Government, a Fair Tax System, and a Stable Financial Sector |
0.1 | 0.2 | 0.5 | 0.5 | 0.6 | 0.6 | |
| Total – Policy actions since Budget 2023 and 2023 Fall Economic Statement measures | -2.7 | -3.4 | -4.2 | -3.8 | -3.4 | -3.3 | |
| Budgetary balance | -35.3 | -40.0 | -38.4 | -38.3 | -27.1 | -23.8 | -18.4 |
Budgetary balance (per cent of GDP) |
-1.3 | -1.4 | -1.3 | -1.2 | -0.8 | -0.7 | -0.5 |
Federal debt (per cent of GDP) |
41.7 | 42.4 | 42.7 | 42.2 | 41.2 | 40.2 | 39.1 |
| Budgetary balance – Upside scenario | -35.3 | -35.2 | -32.0 | -31.4 | -21.6 | -19.4 | -15.0 |
Budgetary balance (per cent of GDP) |
-1.3 | -1.2 | -1.1 | -1.0 | -0.7 | -0.6 | -0.4 |
Federal debt (per cent of GDP) |
41.7 | 42.0 | 41.6 | 41.1 | 40.1 | 39.1 | 38.1 |
| Budgetary balance – Downside scenario | -35.3 | -45.1 | -51.2 | -50.6 | -36.4 | -29.7 | -24.2 |
Budgetary balance (per cent of GDP) |
-1.3 | -1.6 | -1.8 | -1.7 | -1.1 | -0.9 | -0.7 |
Federal debt (per cent of GDP) |
41.7 | 42.7 | 44.2 | 44.0 | 42.9 | 41.8 | 40.8 |
| Budgetary balance – Budget 2023 | -43.0 | -40.1 | -35.0 | -26.8 | -15.8 | -14.0 | |
Budgetary balance (per cent of GDP) |
-1.5 | -1.4 | -1.2 | -0.9 | -0.5 | -0.4 | |
Federal debt (per cent of GDP) |
42.4 | 43.5 | 43.2 | 42.2 | 41.1 | 39.9 | |
|
Note: Totals may not add due to rounding. | |||||||
Alternative Economic Scenarios Analysis
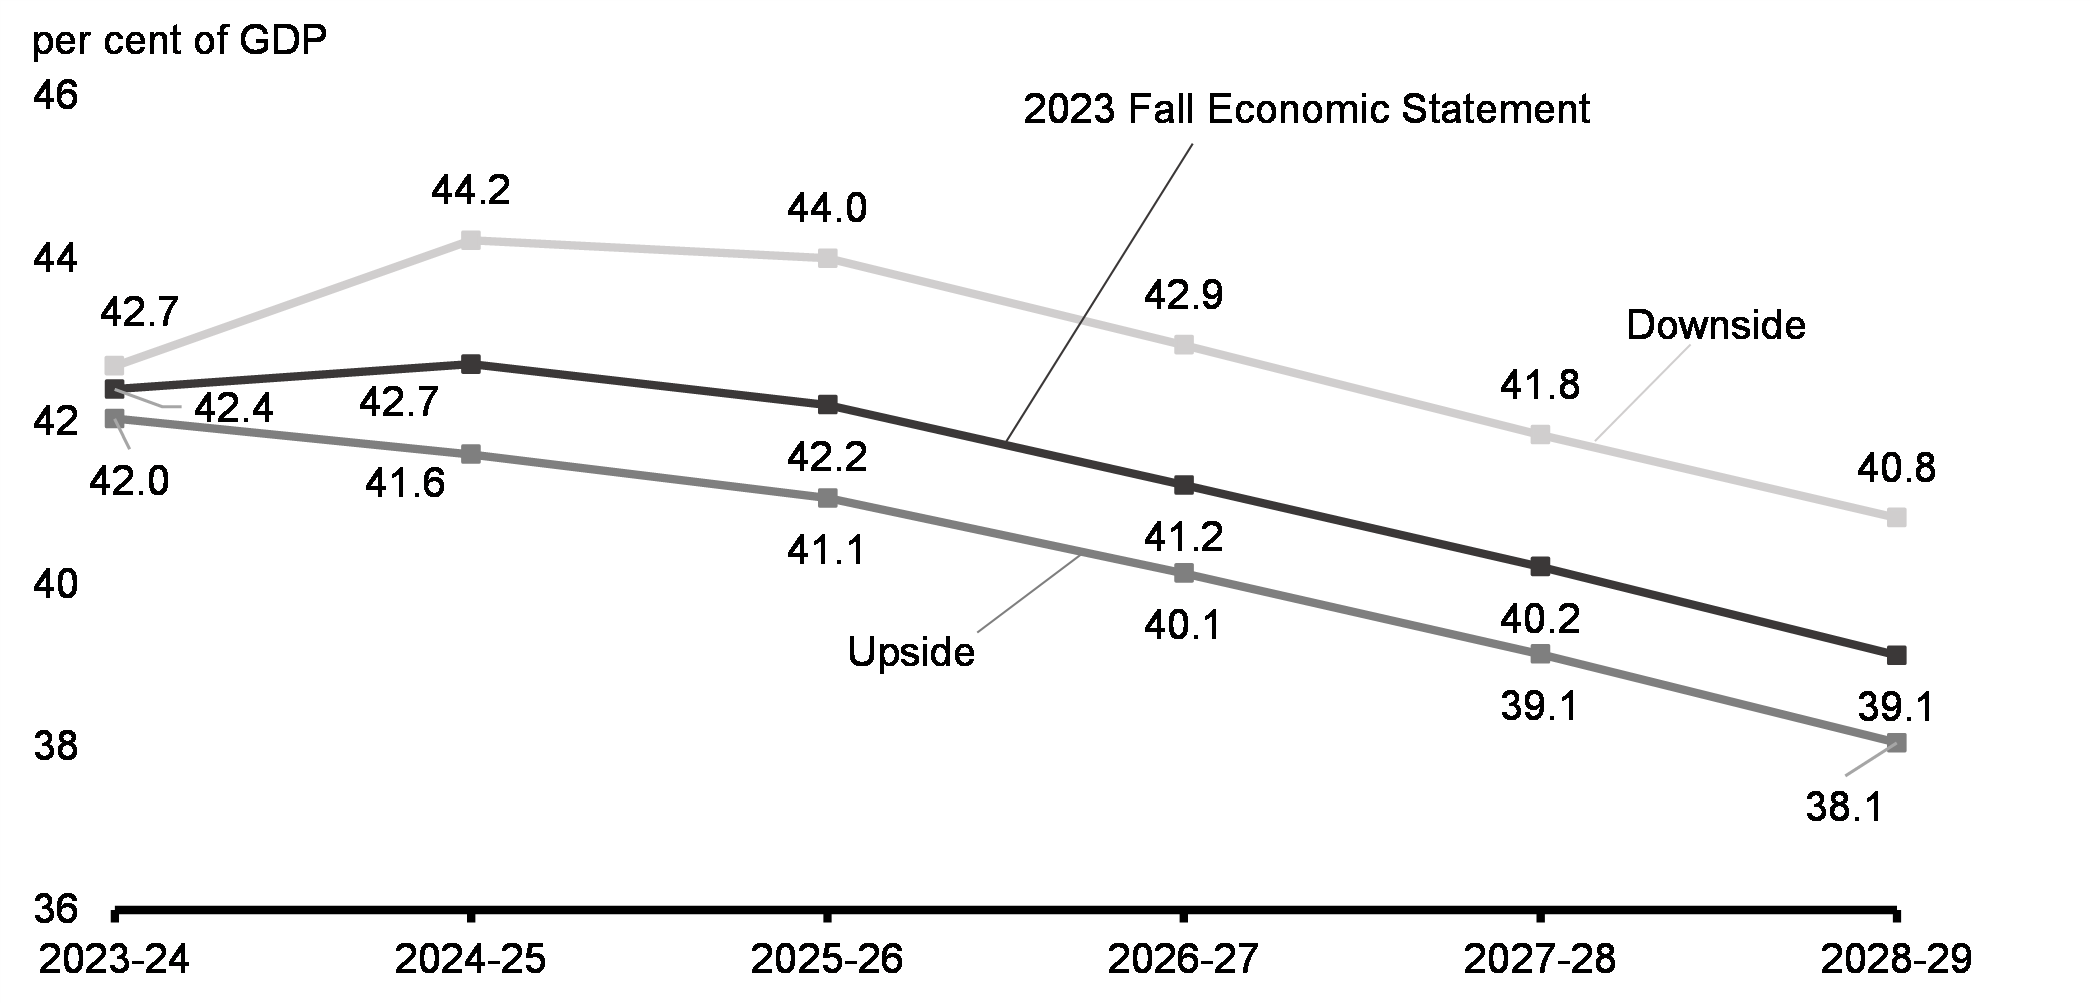
In the upside scenario, the budgetary balance would improve by an average of approximately $5.2 billion per year, and the federal debt-to-GDP ratio would fall to 41.6 per cent in 2024-25 from 42.0 per cent in 2023-24, and be 1.0 percentage point lower than the 2023 Fall Economic Statement outlook in 2028-29 (Chart 19).
In the downside scenario, the budgetary balance would deteriorate by an average of approximately $8.5 billion per year and add 1.7 percentage points to the federal debt-to-GDP ratio by 2028-29. That said, even under the downside scenario, the deficit would remain below 1 per cent of GDP by the end of the forecast horizon, and the federal debt-to-GDP ratio would still be lower in 2028-29 than it is today. Details of the government's fiscal outlook and the fiscal impact of the scenarios can be found in Annex 1.
Federal Debt-to-GDP Ratio Under Economic Scenarios
Fiscal Anchor
Since emerging from the pandemic, the government has maintained a commitment to its fiscal anchor: reducing federal debt as a share of the economy over the medium term. This metric is key not only for fiscal sustainability, but also to preserve Canada's AAA credit rating, which helps maintain investors' confidence and keeps Canada's borrowing costs as low as possible.
A strong federal balance sheet has allowed the government to take necessary action in the face of economic shocks, such as the COVID pandemic or the 2008 financial crisis. Fiscal responsibility today gives the government the ability to respond to future challenges.
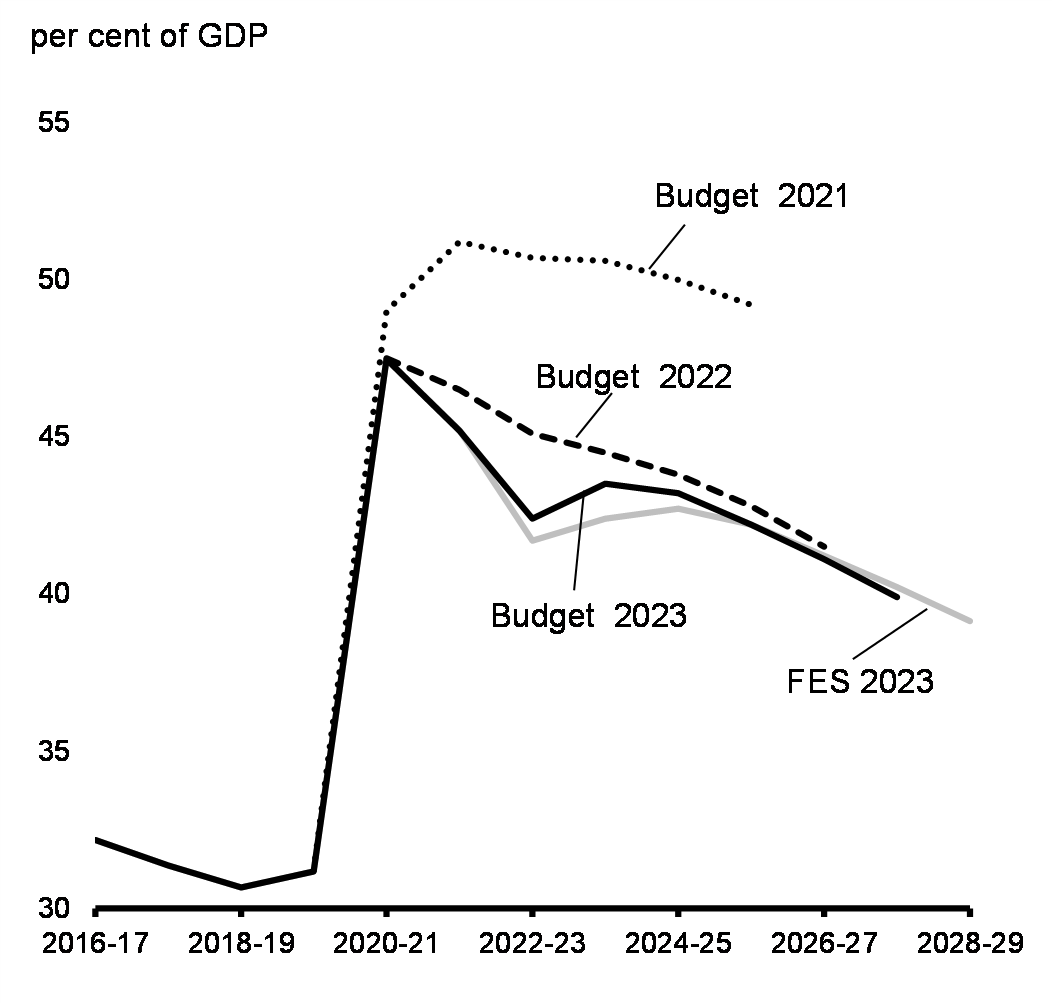
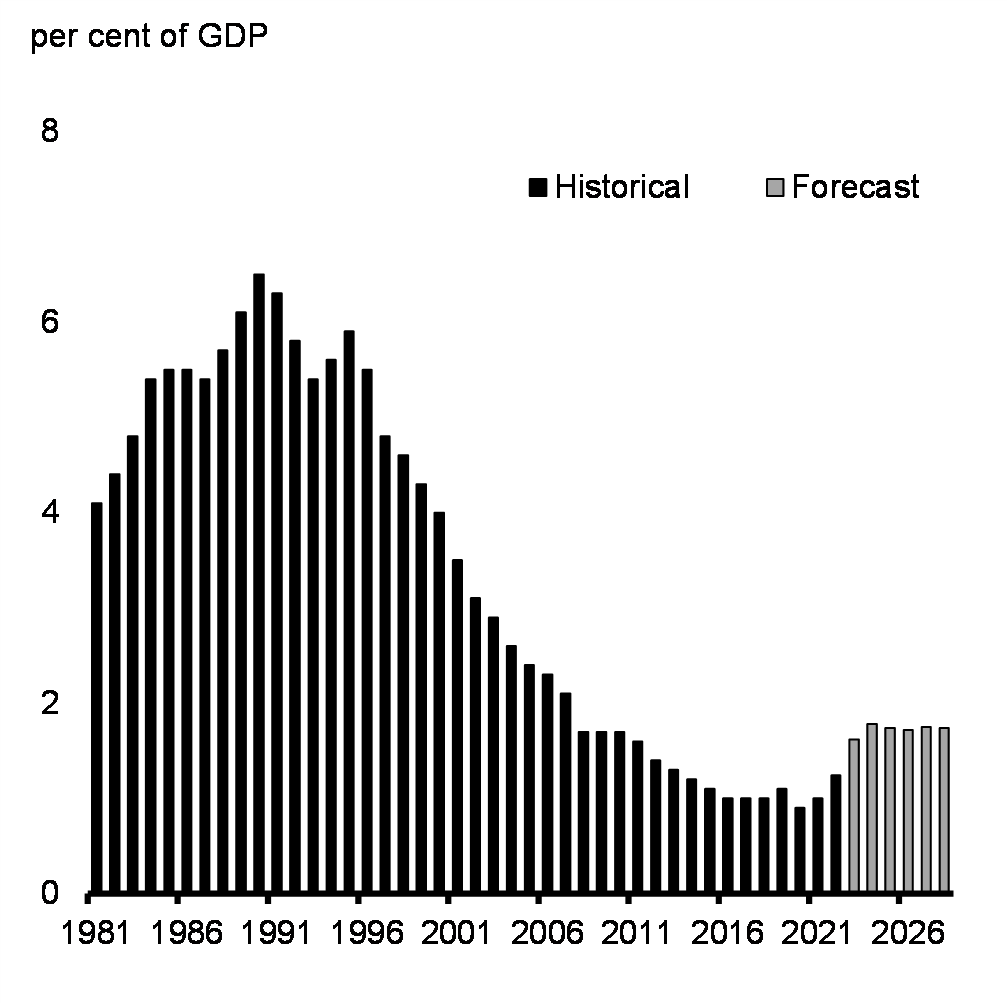
The economic plan outlined in the 2023 Fall Economic Statement delivers on the government's fiscal anchor, enabling Canada's federal debt-to-GDP ratio to decline from 2024-25 onwards, reaching 39.1 per cent in 2028-29 (Chart 20). In addition, public debt charges as a share of the economy are expected to remain near historically low levels (Chart 21).
With softer growth expected in the near-term, the government is taking further action to continue delivering on its fiscal anchor, as outlined in Chapter 4. To reinforce these actions, the government will be focused on the following fiscal objectives in preparing for Budget 2024:
- Maintaining the 2023-24 deficit at or below the Budget 2023 projection of $40.1 billion.
- Lowering the debt-to-GDP ratio in 2024-25, relative to this Fall Economic Statement, and keeping it on a declining track thereafter.
- Maintaining a declining deficit-to-GDP ratio in 2024-25 and keeping deficits below 1 per cent of GDP in 2026-27 and future years.
Federal Debt
Public Debt Charges
Preserving Canada's Fiscal Advantage
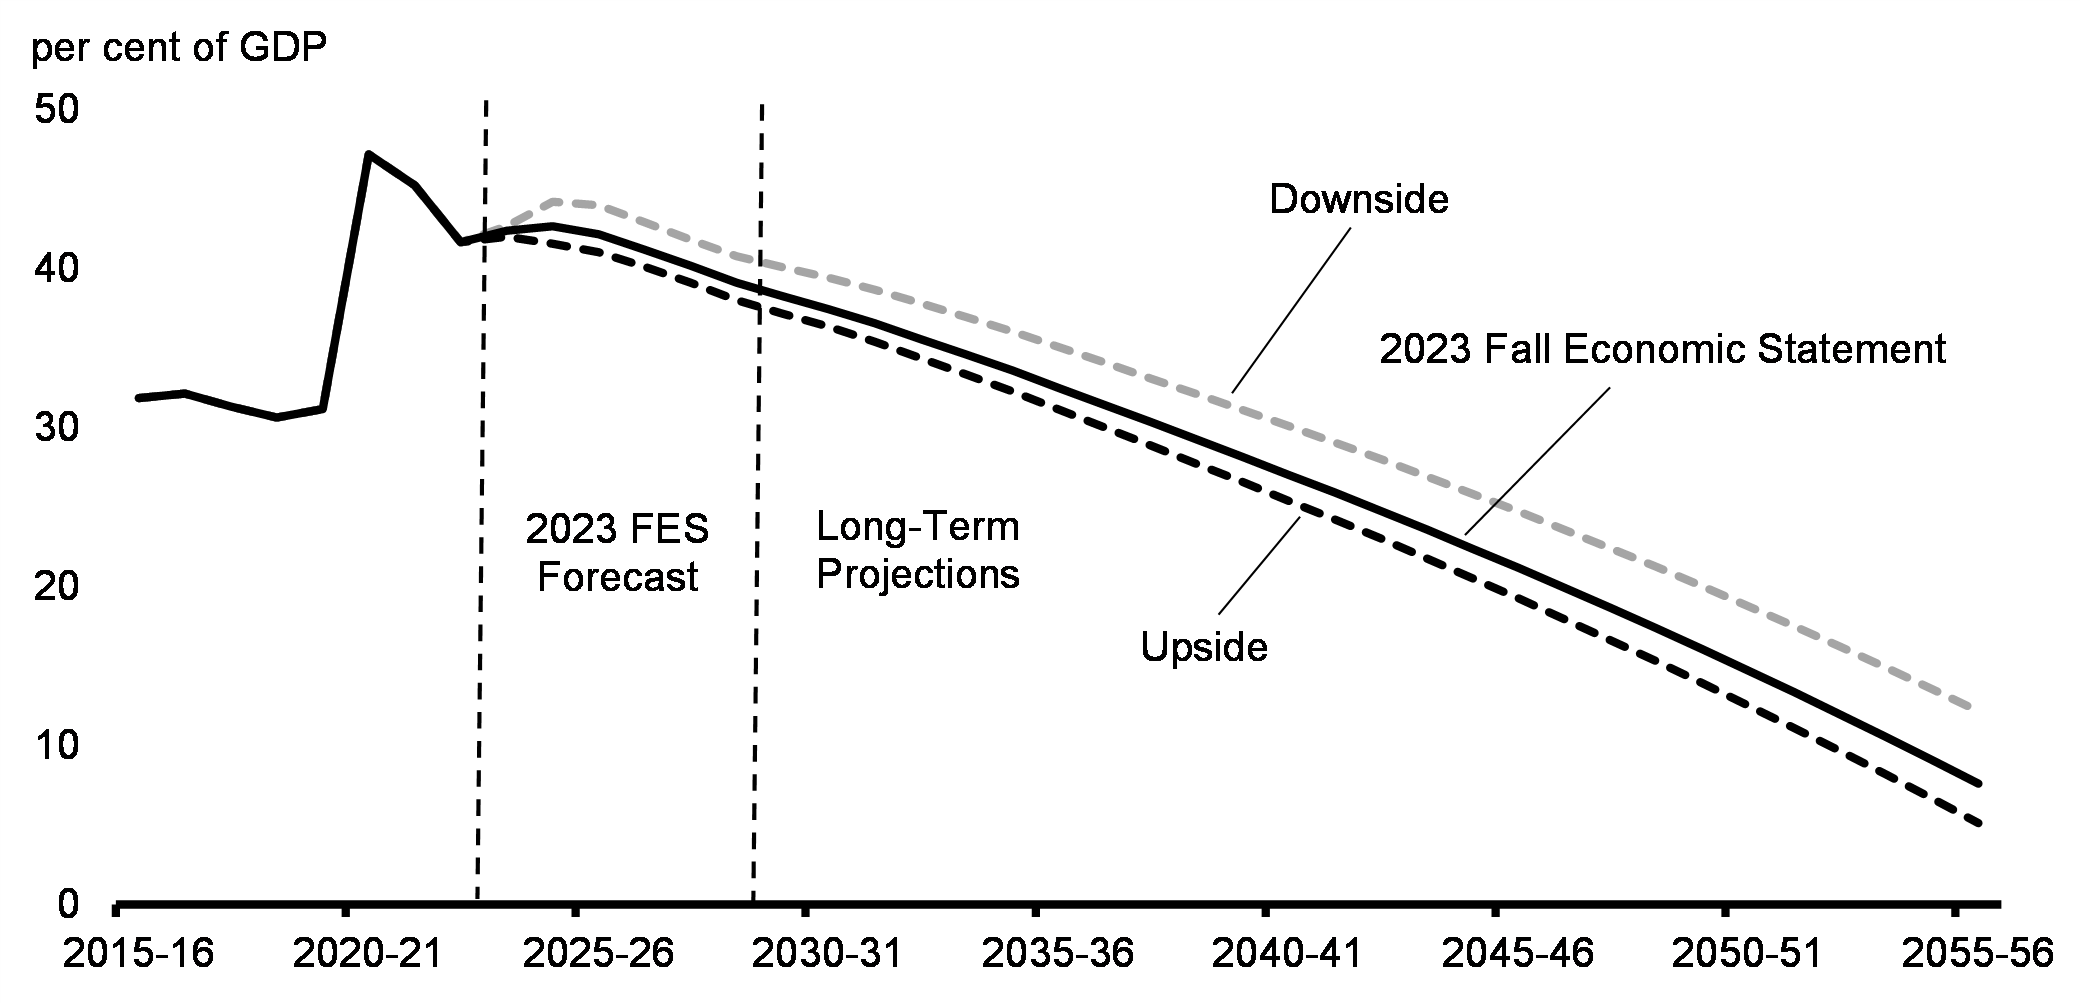
The 2023 Fall Economic Statement forecast shows the federal debt-to-GDP ratio lower than its recent pandemic peak and declining in 2025-26 and throughout the remainder of the forecast—consistent with the government's fiscal anchor. The government's economic plan is also projected to remain fiscally sustainable over the longer term. Modelling scenarios based on a set of reasonable economic and demographic assumptions show the federal debt-to-GDP ratio declining from 2025-26 over the entire long-term projection horizon (Chart 22). This is despite adverse demographic trends, including an aging population and assumed modest future productivity growth rates. Sensitivity analysis around these long-term fiscal projections also indicates fiscal sustainability would be preserved under the downside scenario (see Annex 1 for details).
Long-Term Projection of the Federal Debt
International Comparisons
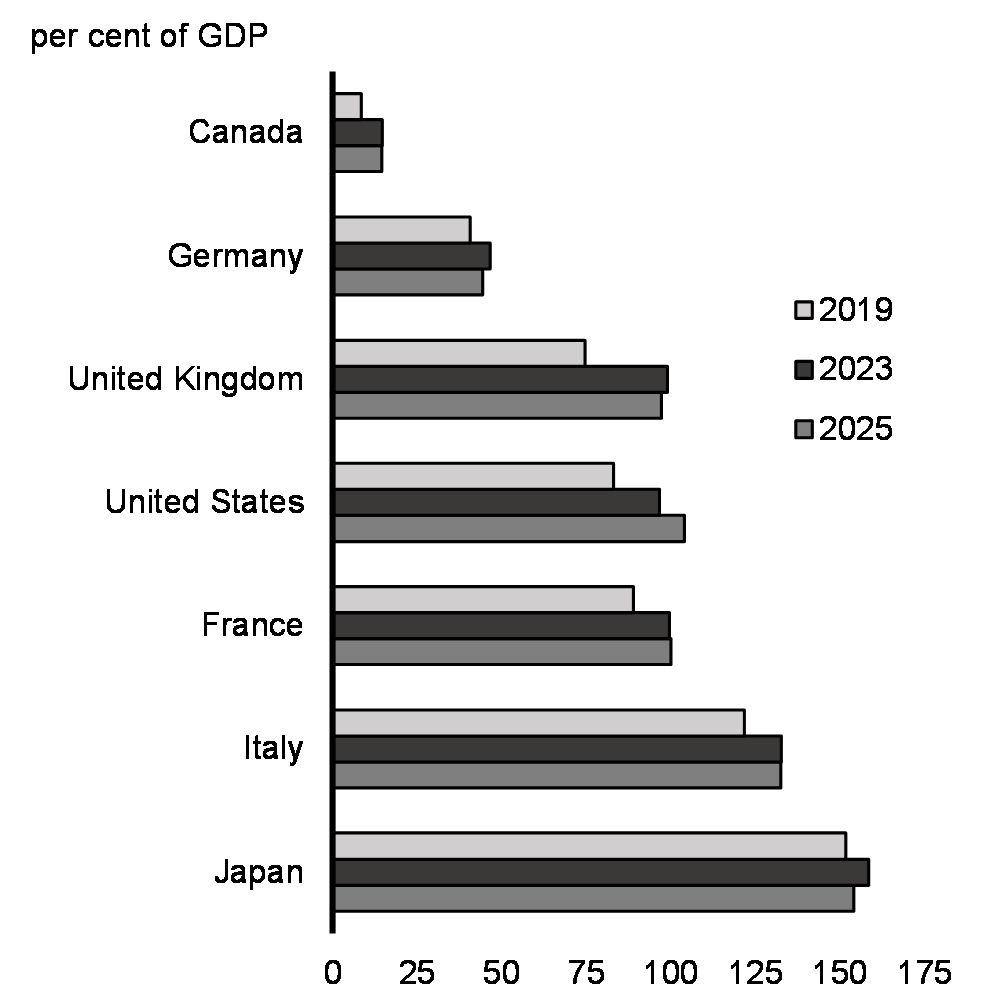
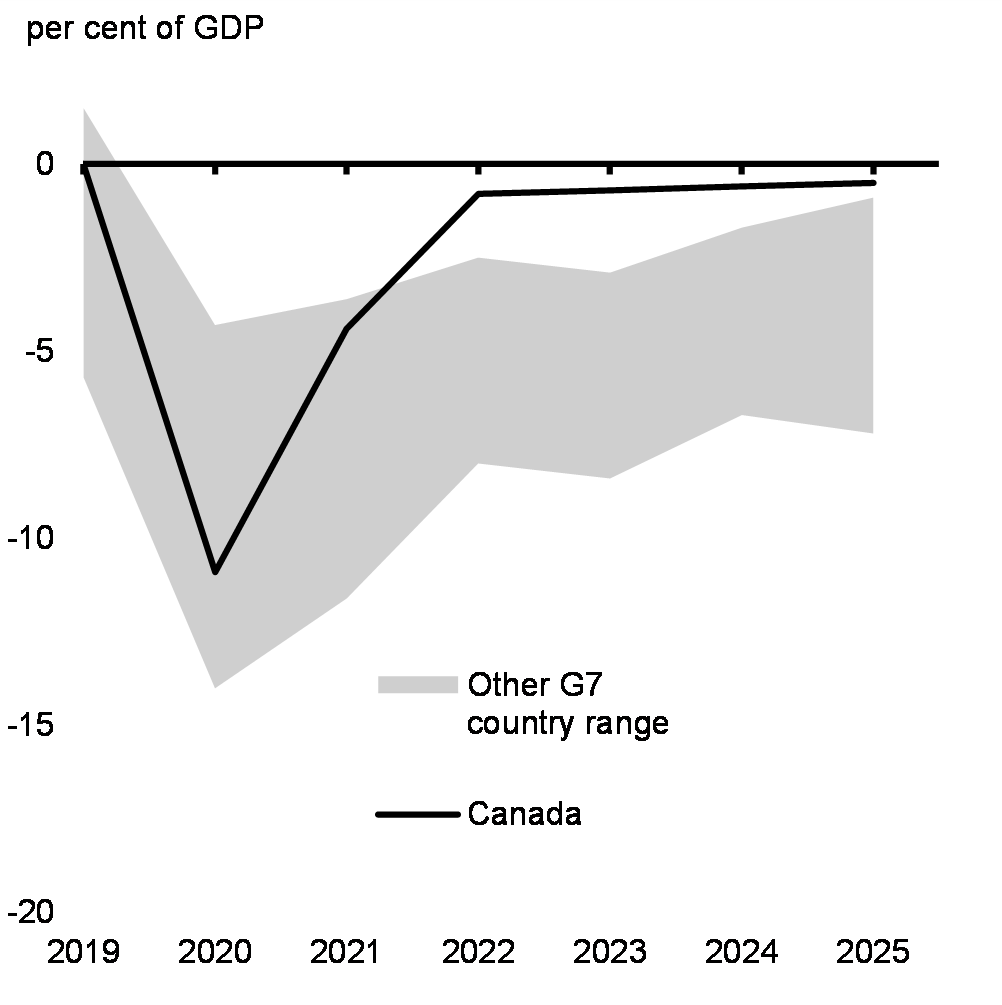
Canada's net debt as a share of the economy is still lower today than in any other G7 country prior to the pandemic—an advantage that Canada is forecasted to maintain (Chart 23). Canada's economic plan has also delivered the fastest fiscal consolidation in the G7 since the depths of the pandemic, resulting in Canada having the smallest deficit in the G7 as a share of the economy over the current and next two years (Chart 24).
A long tradition of fiscal responsibility continues to be a pillar of Canada's excellent credit ratings from Moody's (Aaa), S&P (AAA), and Fitch (AA+), as well as DBRS Morningstar (AAA). With Germany, Canada is one of only two G7 economies to have a AAA rating from at least two of the three major global credit rating agencies.
IMF General Government Net Debt Projections, G7 Economies
IMF General Government Budgetary Balance Projections, G7 Economies
Page details
- Date modified: