Language selection

Search

Archived - Economic Overview
Sound Economic Stewardship in Uncertain Times

On this page:

Around the world, the aftershocks of a once-in-a-century pandemic, combined with external factors including Russia’s illegal invasion of Ukraine, have driven inflation to its highest rates in decades. Canadians are feeling the pinch—at the grocery store, when bills arrive at the end of the month, and when they think about what the future holds.

Despite the challenges we face, Canadians can be confident that our economy will withstand the global economic slowdown that lies ahead. Canada’s unemployment rate is at multi-decade lows, and economic growth has outperformed our G7 peers so far this year. Programs that supported Canadians through the pandemic helped provide the foundations for an unprecedented economic recovery. This will ensure that Canada will face global economic headwinds from a position of fundamental economic strength and resilience.

At a time of elevated inflation, the government has taken a balanced approach in helping people cope with the rising cost of living. Significant, targeted measures have been provided to support the most vulnerable while still ensuring that Canada maintains the fiscal firepower required in these uncertain times.

In the challenging economic landscape that Canada and the world are contending with, economic growth—both here and around the world—is expected to slow. The severity of the slowdown, both in Canada and abroad, will depend critically on how quickly inflation moderates.

In the years to come, structural trends suggest supply will remain an important constraint on global growth. The future will be marked by an ongoing reorientation of global trade patterns, a rapidly aging population, and the dual imperatives of energy security and the transition to net-zero. Investing in measures that encourage middle class job creation and new investment will be key to the future prosperity of workers and businesses in Canada.

The 2022 Fall Economic Statement builds on actions the government has taken to address these essential challenges, while focusing on supporting workers and families through a challenging economic time. And as we work together to weather the economic slowdown to come, the 2022 Fall Economic Statement will help ensure that our economy can create good-paying jobs for workers, and that we maintain the fiscal firepower we need to support Canadians, grow the middle class, and build an economy that works for everyone.

1.1 New Challenges for the Post-COVID Recovery

Inflation Is the Top Global Economic Challenge

Inflation has increased sharply across the world over the past year. Global imbalances between supply and demand, which stem from a series of global supply shocks combined with rebounding demand, are driving up prices for goods and services.

Russia’s illegal and barbaric invasion of Ukraine has disrupted global supply chains and led to a surge in commodity prices, particularly for crude oil, natural gas, food, and agricultural products. Europe is now facing an acute energy crisis as it moves away from dependency on Russian energy, which is driving up manufacturing costs and putting pressure on household budgets. Lockdowns related to China’s zero-COVID policy have prolonged supply chain disruptions. As well, in many advanced economies, including the United States and Canada, inflation pressures have started to broaden with stronger domestic demand and higher wage pressures stemming from tight labour markets.

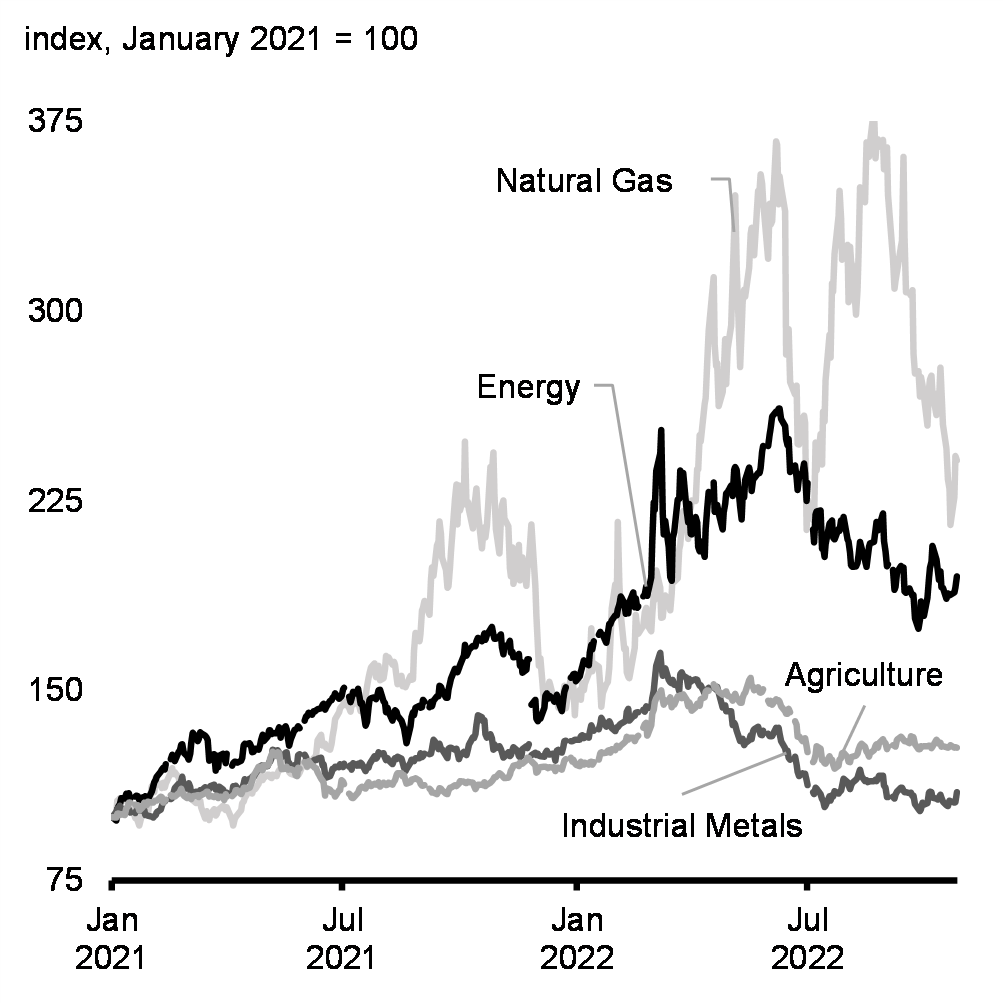
In recent months, some of the global drivers of inflation have begun to ease. Global supply bottlenecks remain elevated but have begun to improve (Chart 1.1) and a range of global commodity prices, including crude oil and agricultural commodities, have fallen from previous highs (Chart 1.2).

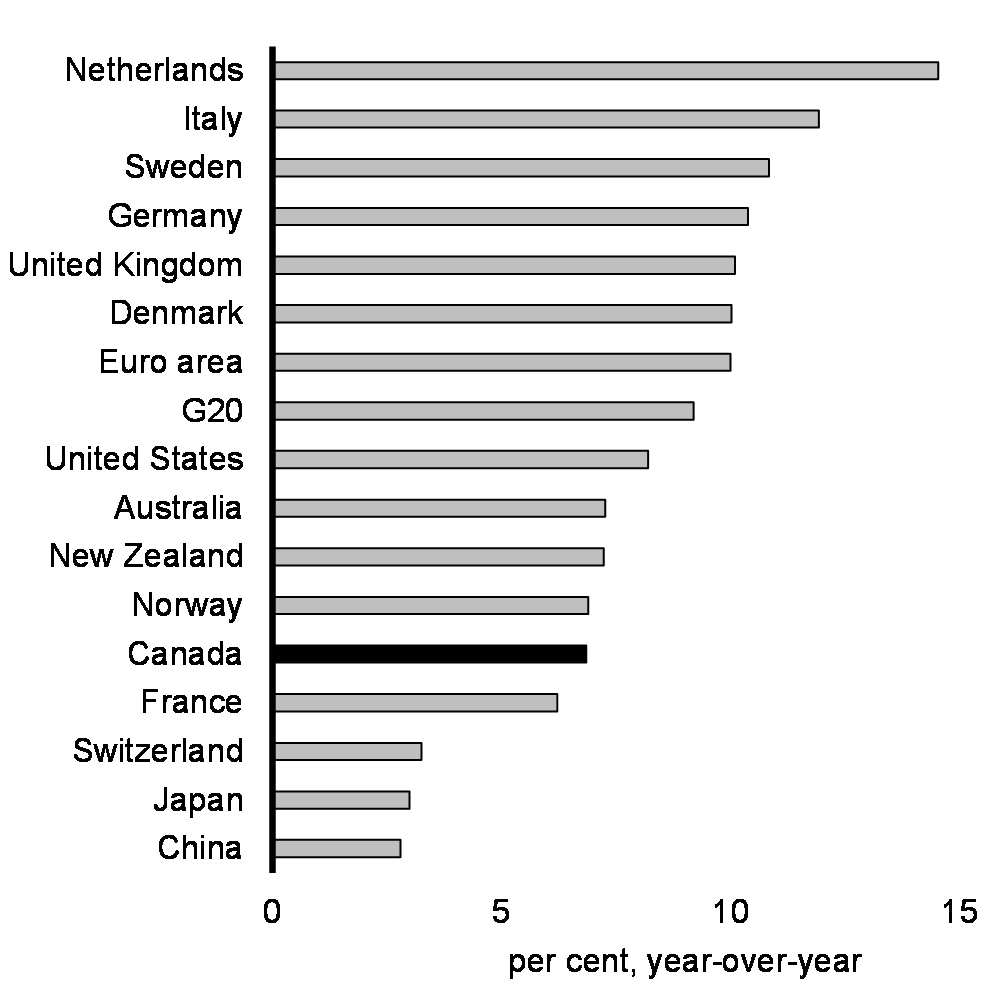
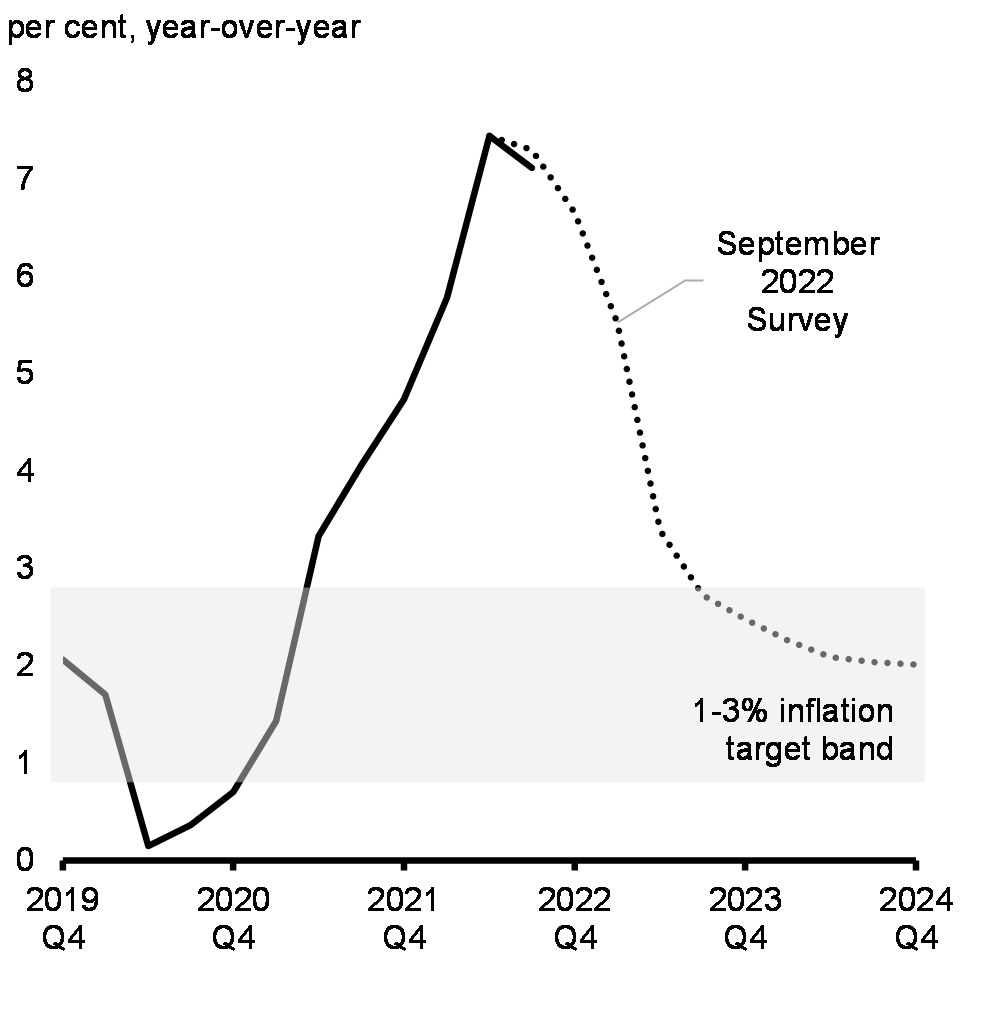
As a result, headline inflation modestly declined in some countries over the summer, including Canada, though it continued to accelerate in other countries, including Italy, Germany, and the U.K. In Canada, headline inflation declined for the third month in a row to 6.9 per cent year-over-year in September, below the 8.1 per cent peak in June, and more moderate than many peer countries (Chart 1.3). That said, inflationary pressures remain high and widespread in Canada. Momentum in core measures of inflation has eased, but core measures remain elevated and inflation is expected to remain above target levels for some time (Chart 1.4).

Chart 1.1
Global Supply Chain Pressures Index
Chart 1.1: Global Supply Chain Pressures Index

Notes: Last data point is September 2022. The index integrates transportation cost data and manufacturing indicators, to gauge global supply chain pressures.

Source: Federal Reserve Bank of New York.

Text version
Date Global Supply Chain Pressure Index, standard deviations from average value
1/1/2010 -0.26
2/1/2010 -0.12
3/1/2010 0.41
4/1/2010 0.27
5/1/2010 0.40
6/1/2010 -0.04
7/1/2010 0.01
8/1/2010 0.35
9/1/2010 0.37
10/1/2010 0.69
11/1/2010 0.42
12/1/2010 0.71
1/1/2011 0.81
2/1/2011 0.40
3/1/2011 0.72
4/1/2011 1.54
5/1/2011 0.94
6/1/2011 0.21
7/1/2011 0.25
8/1/2011 -0.09
9/1/2011 -0.58
10/1/2011 -0.40
11/1/2011 0.10
12/1/2011 -0.07
1/1/2012 0.33
2/1/2012 -0.05
3/1/2012 -0.39
4/1/2012 -0.31
5/1/2012 -0.72
6/1/2012 -0.68
7/1/2012 -0.70
8/1/2012 -0.15
9/1/2012 -0.26
10/1/2012 -0.02
11/1/2012 -0.37
12/1/2012 -0.17
1/1/2013 -0.05
2/1/2013 -0.40
3/1/2013 -0.54
4/1/2013 -0.74
5/1/2013 -0.84
6/1/2013 -0.63
7/1/2013 -0.66
8/1/2013 -0.54
9/1/2013 -0.28
10/1/2013 -0.16
11/1/2013 -0.64
12/1/2013 -0.46
1/1/2014 -0.60
2/1/2014 -0.25
3/1/2014 -0.57
4/1/2014 -0.81
5/1/2014 -0.77
6/1/2014 -0.64
7/1/2014 -0.79
8/1/2014 -0.62
9/1/2014 -0.79
10/1/2014 -0.57
11/1/2014 -0.95
12/1/2014 -0.38
1/1/2015 -0.52
2/1/2015 -0.31
3/1/2015 -0.39
4/1/2015 -0.29
5/1/2015 -0.52
6/1/2015 -0.83
7/1/2015 -0.38
8/1/2015 -0.66
9/1/2015 -0.41
10/1/2015 -0.23
11/1/2015 -0.63
12/1/2015 -0.59
1/1/2016 -0.74
2/1/2016 -0.71
3/1/2016 -0.62
4/1/2016 -0.24
5/1/2016 -0.71
6/1/2016 -0.28
7/1/2016 -0.18
8/1/2016 0.09
9/1/2016 -0.29
10/1/2016 -0.04
11/1/2016 -0.29
12/1/2016 -0.22
1/1/2017 0.20
2/1/2017 0.22
3/1/2017 0.11
4/1/2017 0.05
5/1/2017 -0.08
6/1/2017 0.14
7/1/2017 0.15
8/1/2017 0.44
9/1/2017 0.55
10/1/2017 0.80
11/1/2017 0.86
12/1/2017 0.71
1/1/2018 0.60
2/1/2018 0.12
3/1/2018 0.47
4/1/2018 0.56
5/1/2018 0.37
6/1/2018 0.41
7/1/2018 0.43
8/1/2018 0.53
9/1/2018 0.47
10/1/2018 0.53
11/1/2018 0.44
12/1/2018 0.45
1/1/2019 0.52
2/1/2019 0.12
3/1/2019 0.20
4/1/2019 0.02
5/1/2019 -0.65
6/1/2019 -0.49
7/1/2019 -0.46
8/1/2019 -0.33
9/1/2019 0.11
10/1/2019 0.03
11/1/2019 0.10
12/1/2019 0.01
1/1/2020 0.04
2/1/2020 1.10
3/1/2020 2.46
4/1/2020 3.10
5/1/2020 2.55
6/1/2020 2.30
7/1/2020 2.80
8/1/2020 1.33
9/1/2020 0.60
10/1/2020 0.11
11/1/2020 0.70
12/1/2020 1.64
1/1/2021 1.42
2/1/2021 1.90
3/1/2021 2.18
4/1/2021 2.52
5/1/2021 2.97
6/1/2021 2.70
7/1/2021 2.94
8/1/2021 3.23
9/1/2021 3.24
10/1/2021 3.79
11/1/2021 4.22
12/1/2021 4.30
1/1/2022 3.64
2/1/2022 2.76
3/1/2022 2.78
4/1/2022 3.42
5/1/2022 2.62
6/1/2022 2.32
7/1/2022 1.75
8/1/2022 1.51
9/1/2022 1.05
Chart 1.2
Commodity Prices
Chart 1.2: Commodity    Prices

Note: Last data point is October 26, 2022.

Source: Haver Analytics.

Text version
Natural Gas Energy Industrial Metals Agriculture
01-Jan-21 100 100 100 100
04-Jan-21 101.6542 98.59344 102.0754 99.7386
05-Jan-21 106.4198 103.2272 103.3536 101.4283
06-Jan-21 106.9713 104.5059 103.65 101.3428
07-Jan-21 107.4832 104.8712 104.5784 100.7516
08-Jan-21 105.9945 107.5687 103.4785 101.1099
11-Jan-21 107.499 107.3982 101.2164 100.8801
12-Jan-21 107.3415 109.2431 102.5671 103.4902
13-Jan-21 106.2072 108.6464 102.7605 104.0717
14-Jan-21 103.5841 109.3832 103.0761 105.676
15-Jan-21 106.1836 107.3799 101.8245 105.7051
18-Jan-21        
19-Jan-21 99.60615 108.1106 101.4956 104.9159
20-Jan-21 99.76371 108.5185 102.5081 104.5341
21-Jan-21 98.34579 108.2202 102.6659 104.7408
22-Jan-21 96.73102 106.7223 102.4908 102.5916
25-Jan-21 102.3237 107.8609 102.5612 104.0024
26-Jan-21 103.8204 107.9279 102.7337 105.7997
27-Jan-21 106.4198 108.3602 100.7578 105.5619
28-Jan-21 104.9232 107.4651 100.8587 104.8041
29-Jan-21 100.9846 106.9354 100.5092 106.0547
01-Feb-21 112.2489 109.9982 100.1032 105.7593
02-Feb-21 112.052 112.2816 99.88461 105.6245
03-Feb-21 109.8464 113.8769 100.4673 106.3733
04-Feb-21 115.5967 114.8816 100.745 106.4138
05-Feb-21 112.5876 115.9045 102.0146 106.5716
08-Feb-21 113.1942 118.0539 103.046 108.0242
09-Feb-21 111.3746 118.7359 104.3849 107.8361
10-Feb-21 113.6431 119.4788 105.9778 105.6888
11-Feb-21 111.6975 118.7481 106.1108 106.4527
12-Feb-21 113.2729 120.8793 106.7478 106.8264
15-Feb-21        
16-Feb-21 117.4872 122.9008 107.1526 108.6743
17-Feb-21 119.4171 124.758 107.4523 108.0159
18-Feb-21 116.9752 123.9359 109.098 108.406
19-Feb-21 117.8023 122.1823 111.508 108.1005
22-Feb-21 115.6361 125.8905 113.1359 109.5387
23-Feb-21 112.5246 125.9758 113.1059 109.6813
24-Feb-21 110.0827 128.6915 114.4818 111.2186
25-Feb-21 109.3738 128.8802 115.8983 110.0214
26-Feb-21 109.1374 125.5556 111.6665 108.5495
01-Mar-21 109.3738 124.1612 111.2348 107.5714
02-Mar-21 111.8156 122.6999 113.4966 108.4223
03-Mar-21 110.9098 124.9954 111.894 107.5895
04-Mar-21 108.1528 129.3917 109.1314 107.0505
05-Mar-21 106.6798 133.4409 109.65 108.2207
08-Mar-21 105.4589 131.5168 110.0981 108.414
09-Mar-21 105.6479 130.0554 108.6282 108.7737
10-Mar-21 107.1603 130.713 109.0001 107.9144
11-Mar-21 106.4592 133.6479 110.6037 108.7193
12-Mar-21 103.8204 133.1669 110.5369 108.6434
15-Mar-21 99.36986 132.0952 111.9405 109.4872
16-Mar-21 102.2844 131.3097 110.346 110.1278
17-Mar-21 100.6301 130.3538 111.3652 110.0613
18-Mar-21 98.89719 122.2858 110.9787 108.048
19-Mar-21 101.0634 124.4292 112.1995 108.5386
22-Mar-21 103.1509 124.9345 112.8029 107.9337
23-Mar-21 100.5908 118.4071 110.8551 108.4426
24-Mar-21 101.1422 124.3317 111.3308 108.5561
25-Mar-21 103.0327 119.6797 109.8142 107.4731
26-Mar-21 103.1509 124.2769 112.1266 108.1523
29-Mar-21 104.49 125.1659 110.9329 107.8525
30-Mar-21 103.3083 123.7228 109.6456 106.6347
31-Mar-21 102.7176 121.3725 109.4745 109.1234
01-Apr-21 103.9386 125.0198 109.6283 108.0474
02-Apr-21        
05-Apr-21 98.89719 120.246 109.6283 108.2684
06-Apr-21 96.73102 121.2872 112.2354 108.6572
07-Apr-21 99.25167 121.8291 111.3868 109.2493
08-Apr-21 100 121.8961 112.4407 110.7125
09-Apr-21 100.7326 121.5978 111.4828 110.562
12-Apr-21 102.8042 122.365 110.5818 109.1622
13-Apr-21 105.577 123.2053 111.4831 109.8436
14-Apr-21 106.0654 128.4601 113.2807 111.5676
15-Apr-21 107.5227 129.0994 114.9254 111.5497
16-Apr-21 108.4679 128.7584 114.1689 111.1182
19-Apr-21 110.9886 129.1664 115.2311 111.6226
20-Apr-21 110.3978 127.7781 114.3562 113.2831
21-Apr-21 109.3343 125.6165 116.0597 114.2675
22-Apr-21 111.5006 125.8723 115.8397 116.6413
23-Apr-21 110.9886 127.0779 117.03 117.2794
26-Apr-21 113.1942 126.7004 119.2098 120.0336
27-Apr-21 115.8724 128.588 119.8786 119.9079
28-Apr-21 116.5813 130.6034 120.2953 118.7788
29-Apr-21 114.6514 132.5397 120.584 118.4767
30-Apr-21 115.4392 130.0859 120.2348 120.577
03-May-21 116.8176 131.876 120.2348 120.2435
04-May-21 116.857 134.2873 121.7855 121.3379
05-May-21 115.7148 134.4091 121.8634 123.2359
06-May-21 115.321 132.6859 123.5821 124.7404
07-May-21 116.8649 133.1669 126.668 125.8368
10-May-21 116.2032 133.2461 126.0051 124.0914
11-May-21 117.4241 133.9889 126.4752 125.5737
12-May-21 118.4797 135.6269 125.4504 125.2339
13-May-21 119.1414 131.3706 123.8824 120.7081
14-May-21 118.8657 134.0011 123.6368 118.9642
17-May-21 124.616 135.9618 125.5625 119.2376
18-May-21 121.2288 134.7805 125.6411 119.9867
19-May-21 119.2595 130.6948 121.4416 118.8264
20-May-21 117.8023 128.18 121.5123 118.9688
21-May-21 117.2509 130.5182 119.9171 119.0347
24-May-21 116.5813 134.47 120.469 118.3451
25-May-21 117.1327 134.5978 120.1741 116.6442
26-May-21 119.2202 135.225 121.1245 116.275
27-May-21 116.5025 135.9678 124.5013 119.5625
28-May-21 117.6053 135.2128 124.8305 119.0693
31-May-21        
01-Jun-21 122.2529 138.0381 124.5974 121.6404
02-Jun-21 121.1107 139.9379 123.7311 121.2761
03-Jun-21 119.7716 139.8039 120.3525 119.9861
04-Jun-21 121.9771 141.1983 122.1901 122.0922
07-Jun-21 121.0634 140.3824 121.3469 120.378
08-Jun-21 123.3871 141.795 122.3741 120.1355
09-Jun-21 123.592 141.6246 122.7348 119.5383
10-Jun-21 124.5609 142.1847 122.4481 119.2679
11-Jun-21 130.4057 142.7206 123.1626 117.7085
14-Jun-21 132.6113 142.9702 123.5707 115.1868
15-Jun-21 128.2394 144.3829 120.3 114.4324
16-Jun-21 128.8303 144.7543 120.9403 113.696
17-Jun-21 128.9877 142.4405 116.9642 108.5488
18-Jun-21 127.4517 143.3904 115.517 111.3588
21-Jun-21 126.6246 146.0208 116.1861 110.9214
22-Jun-21 129.0666 146.2827 117.4965 109.8143
23-Jun-21 132.0205 147.2752 119.0824 109.8119
24-Jun-21 135.3682 147.8171 119.101 109.1807
25-Jun-21 138.6373 148.8766 119.8897 108.0884
28-Jun-21 141.5124 146.8672 119.7397 110.6787
29-Jun-21 142.9697 147.2447 120.9097 110.7077
30-Jun-21 143.7574 147.8414 120.517 114.6706
01-Jul-21 144.1906 150.5206 119.7716 114.0947
02-Jul-21 145.7266 151.1173 121.1436 113.1184
05-Jul-21        
06-Jul-21 143.2454 147.5248 119.9521 109.2725
07-Jul-21 141.6305 145.3449 120.4829 108.5886
08-Jul-21 145.0886 146.8794 118.768 107.6433
09-Jul-21 144.4348 149.5342 121.3094 107.4288
12-Jul-21 147.2548 148.7304 120.3907 109.2618
13-Jul-21 145.128 150.6972 121.143 109.612
14-Jul-21 143.6786 147.3239 120.4144 111.1892
15-Jul-21 141.8274 144.8517 121.4604 111.5491
16-Jul-21 144.0724 145.1866 120.8812 112.1331
19-Jul-21 147.8534 136.0835 118.1708 111.1951
20-Jul-21 151.7133 137.6789 119.6982 112.8538
21-Jul-21 155.1004 143.4086 119.4509 113.7468
22-Jul-21 156.8334 146.3862 120.8589 113.1323
23-Jul-21 159.1966 147.0438 121.8756 112.2631
26-Jul-21 160.7719 147.3239 124.1463 113.171
27-Jul-21 155.258 146.6845 123.0472 112.8155
28-Jul-21 156.2426 147.6405 123.5243 113.1294
29-Jul-21 159.8661 150.1674 125.5915 113.8706
30-Jul-21 154.1552 150.4354 124.9249 112.0857
02-Aug-21 154.9822 145.8016 125.1849 113.5651
03-Aug-21 158.6057 144.9857 123.409 113.0927
04-Aug-21 163.7653 141.5028 122.5475 112.6574
05-Aug-21 163.0563 143.2321 123.2716 112.8653
06-Aug-21 163.1666 141.6124 122.4123 113.5568
09-Aug-21 160.1418 138.0259 120.9129 112.7813
10-Aug-21 161.3785 141.0278 122.6301 114.0743
11-Aug-21 160.2442 142.2335 123.2337 114.5864
12-Aug-21 155.4943 141.5697 122.8766 116.6025
13-Aug-21 152.6192 140.1693 123.9425 117.2753
16-Aug-21 155.9669 138.1721 123.0781 117.4676
17-Aug-21 151.6739 136.8751 121.7552 116.0964
18-Aug-21 152.2647 135.2067 119.575 116.5628
19-Aug-21 151.3982 131.5472 118.1307 114.5095
20-Aug-21 152.2647 129.1725 118.9143 113.3114
23-Aug-21 155.9669 135.8765 121.5621 113.7342
24-Aug-21 154.2339 139.5299 122.6792 114.7235
25-Aug-21 154.5884 141.5028 122.77 114.9856
26-Aug-21 165.8527 140.2971 122.1157 115.0622
27-Aug-21 172.8239 143.159 123.3536 115.488
30-Aug-21 169.5549 144.0784 123.3536 114.4886
31-Aug-21 172.3906 143.1773 125.3058 113.1842
01-Sep-21 181.7644 143.4756 123.6116 112.3442
02-Sep-21 182.7885 146.4714 124.0234 112.5122
03-Sep-21 185.5848 145.6311 125.0565 112.5407
06-Sep-21        
07-Sep-21 179.9133 143.4452 124.9539 111.1695
08-Sep-21 193.9188 145.552 125.1287 110.6394
09-Sep-21 198.7948 143.7801 127.0345 109.6796
10-Sep-21 195.3131 146.0452 130.5453 109.595
13-Sep-21 207.3493 147.7562 128.8008 109.0053
14-Sep-21 208.9405 147.8232 126.8335 110.0525
15-Sep-21 216.8964 151.8724 129.1027 111.4118
16-Sep-21 211.9732 151.5801 127.0329 111.32
17-Sep-21 202.6782 150.2953 126.8317 110.6356
20-Sep-21 197.7944 147.1229 124.3377 109.3661
21-Sep-21 190.7049 147.2143 123.3907 109.0477
22-Sep-21 191.217 150.4049 127.0206 110.3836
23-Sep-21 198.6214 153.0171 127.4573 111.5853
24-Sep-21 204.805 154.7159 127.5002 111.7175
27-Sep-21 225.7188 158.6555 126.6988 112.6667
28-Sep-21 231.5872 158.412 126.995 112.2413
29-Sep-21 215.7148 157.2124 125.545 112.6406
30-Sep-21 231.0752 158.8687 122.8426 113.1769
01-Oct-21 221.3076 160.0012 124.0372 114.1274
04-Oct-21 227.0972 164.0382 125.8229 113.9315
05-Oct-21 248.6018 168.1422 125.7089 113.6999
06-Oct-21 223.5131 163.7033 124.472 113.5105
07-Oct-21 224.6948 165.0368 126.8493 114.0845
08-Oct-21 221.4651 166.1633 128.6303 113.8802
11-Oct-21 214.2261 167.6673 131.5656 113.6364
12-Oct-21 221.7959 167.6064 131.153 112.4543
13-Oct-21 226.5853 167.6064 132.8243 111.0143
14-Oct-21 229.8936 169.4879 136.3201 111.7474
15-Oct-21 220.5593 170.864 140.3526 112.7678
18-Oct-21 206.2229 169.4148 139.5611 112.9064
19-Oct-21 210.7128 170.6935 137.8421 112.5568
20-Oct-21 214.5333 172.5811 138.3026 113.7746
21-Oct-21 210.5553 170.1882 132.7291 112.1464
22-Oct-21 215.0847 172.0636 131.3073 112.8481
25-Oct-21 238.5191 174.2617 132.718 113.6682
26-Oct-21 236.4317 175.2238 131.2285 114.1362
27-Oct-21 244.1118 172.0149 126.6689 114.9159
28-Oct-21 227.7275 170.59 128.8928 115.7111
29-Oct-21 213.7061 170.5413 127.3034 115.8925
01-Nov-21 204.2536 171.3938 128.0652 117.4062
02-Nov-21 218.2749 172.3071 126.888 116.9372
03-Nov-21 223.3162 167.168 125.5763 116.5515
04-Nov-21 225.128 164.4401 123.5821 115.851
05-Nov-21 218.1174 167.576 123.9569 115.4969
08-Nov-21 214.9744 168.124 125.7237 115.5156
09-Nov-21 198.2512 169.7193 124.1703 116.7344
10-Nov-21 195.1635 165.0064 124.5494 118.3768
11-Nov-21 206.5774 165.4326 126.5012 119.3474
12-Nov-21 192.2016 163.1614 127.6156 120.3007
15-Nov-21 201.024 163.472 126.2492 120.6659
16-Nov-21 207.562 164.6045 124.1097 120.1436
17-Nov-21 193.5408 159.8733 123.6838 121.597
18-Nov-21 196.7309 161.4687 124.0139 121.1038
19-Nov-21 202.6388 157.0054 126.7911 121.1639
22-Nov-21 191.4533 158.2902 128.0137 122.4636
23-Nov-21 198.3064 162.4368 127.2566 123.5278
24-Nov-21 201.4178 162.4673 128.8475 123.2172
25-Nov-21        
26-Nov-21 215.7148 144.4925 124.4149 122.1585
29-Nov-21 191.1776 146.4592 125.4572 120.4743
30-Nov-21 179.8739 138.8601 124.4458 117.5224
01-Dec-21 167.7038 137.8737 125.1582 117.9133
02-Dec-21 159.7479 138.7079 124.2662 119.5137
03-Dec-21 162.7412 138.9028 124.0641 119.8165
06-Dec-21 144.0331 143.2686 123.8802 120.0185
07-Dec-21 145.7739 147.9145 125.24 119.8551
08-Dec-21 149.6101 149.0592 126.2129 119.662
09-Dec-21 149.5076 146.8489 125.2438 119.3485
10-Dec-21 153.4541 147.9632 124.7455 119.7839
13-Dec-21 148.1292 146.715 125.1439 119.6322
14-Dec-21 146.2387 145.5215 124.3008 119.8214
15-Dec-21 148.1292 145.7773 122.3124 118.2477
16-Dec-21 146.3174 148.4564 126.1731 119.5822
17-Dec-21 143.3241 145.5398 126.6904 119.5142
20-Dec-21 148.011 141.7646 125.4499 118.7473
21-Dec-21 148.6412 146.7332 127.7839 120.773
22-Dec-21 152.0284 149.6133 130.0553 122.2805
23-Dec-21 142.9697 151.2939 130.2876 122.8749
24-Dec-21        
27-Dec-21 155.258 155.0143 129.9623 123.4071
28-Dec-21 153.013 155.678 129.9623 121.9313
29-Dec-21 151.6344 156.4087 130.2877 122.7866
30-Dec-21 140.252 156.6157 130.6786 121.4545
31-Dec-21 146.9082 153.6382 130.7021 120.7654
03-Jan-22 150.256 155.7693 130.7021 120.1911
04-Jan-22 146.3962 157.4377 131.9129 121.9941
05-Jan-22 152.8948 159.6115 132.4551 121.323
06-Jan-22 150.1379 161.9193 131.2587 120.7516
07-Jan-22 152.7373 161.2312 131.9015 121.5924
10-Jan-22 156.794 160.0438 131.4443 120.7589
11-Jan-22 160.7089 165.256 133.8298 121.7137
12-Jan-22 174.5963 168.0935 136.3019 121.8672
13-Jan-22 157.7393 166.3947 135.2945 120.7616
14-Jan-22 160.7326 169.427 134.2168 121.6318
17-Jan-22        
18-Jan-22 159.4328 172.0027 134.7464 122.7269
19-Jan-22 151.4375 173.2144 136.8532 125.328
20-Jan-22 143.7179 172.5446 139.2755 125.7399
21-Jan-22 148.9562 172.0514 138.0236 125.1904
24-Jan-22 152.6192 168.9703 135.6554 125.4227
25-Jan-22 153.3675 172.6542 136.9305 126.237
26-Jan-22 158.9602 176.4842 137.9458 126.5075
27-Jan-22 168.6885 176.2467 137.197 125.4422
28-Jan-22 182.7097 177.7751 135.0907 126.8624
31-Jan-22 191.9653 179.8271 133.9767 126.5506
01-Feb-22 187.1209 179.8575 135.4701 128.1817
02-Feb-22 216.6601 182.1226 135.6162 127.581
03-Feb-22 192.5167 184.1137 136.3918 127.35
04-Feb-22 180.0709 187.28 136.9194 128.2296
07-Feb-22 166.4119 184.7835 137.7712 129.3776
08-Feb-22 166.8373 180.3568 138.1324 129.9466
09-Feb-22 157.2115 180.8439 141.5828 131.849
10-Feb-22 155.4234 180.5334 142.8843 130.5201
11-Feb-22 154.9822 184.8322 138.1785 131.4818
14-Feb-22 163.844 188.7718 139.8137 131.3284
15-Feb-22 167.0342 182.9751 140.1235 129.9911
16-Feb-22 180.0709 186.5433 141.1851 130.9152
17-Feb-22 174.4781 182.8046 141.4115 131.8664
18-Feb-22 172.3906 183.3831 141.5368 132.2233
21-Feb-22        
22-Feb-22 175.6991 187.3592 142.4122 135.3409
23-Feb-22 180.8979 188.029 141.648 136.6513
24-Feb-22 182.7884 191.2135 143.8383 137.2663
25-Feb-22 176.0536 187.4749 143.0403 132.1324
28-Feb-22 173.3754 194.6965 143.391 136.3088
01-Mar-22 180.1102 208.9996 147.0032 140.8026
02-Mar-22 187.5542 224.4596 149.9149 142.4094
03-Mar-22 185.9787 221.4151 154.1816 145.4454
04-Mar-22 197.5581 236.9056 159.8909 146.9322
07-Mar-22 190.5475 243.8531 164.9362 149.3523
08-Mar-22 178.8657 253.0293 160.5231 150.2387
09-Mar-22 179.0862 220.1364 155.9437 146.109
10-Mar-22 183.5919 211.7701 157.7048 144.4108
11-Mar-22 187.7116 217.0249 158.7631 146.1426
14-Mar-22 185.191 206.7649 154.3462 145.5914
15-Mar-22 181.8432 195.0374 153.4094 147.4173
16-Mar-22 188.4206 193.4604 152.9555 143.4775
17-Mar-22 197.755 210.3331 154.3992 145.4371
18-Mar-22 193.0681 212.6895 152.3569 144.5192
21-Mar-22 194.3285 225.5008 152.0653 147.7233
22-Mar-22 205.8684 225.7809 149.7881 147.5789
23-Mar-22 207.7195 237.0152 156.4313 148.2026
24-Mar-22 214.4938 233.4226 157.2825 146.9539
25-Mar-22 220.9925 236.1444 155.8756 148.6694
28-Mar-22 218.1174 220.9036 155.1229 146.4688
29-Mar-22 209.9251 216.4769 151.4672 143.7449
30-Mar-22 220.7562 223.7411 154.7177 145.3866
31-Mar-22 222.2134 211.8797 153.4702 144.0182
01-Apr-22 225.2855 211.7335 153.8607 142.0129
04-Apr-22 224.9704 218.6324 154.429 143.4197
05-Apr-22 237.5738 216.483 154.3873 144.8703
06-Apr-22 237.4556 206.911 153.0469 144.4012
07-Apr-22 251.0594 205.0904 151.8866 144.1258
08-Apr-22 248.4915 208.9813 152.2003 146.5206
11-Apr-22 263.5289 202.8497 148.8137 147.2954
12-Apr-22 265.7109 214.0535 150.2801 149.5366
13-Apr-22 279.4801 221.8535 150.2267 150.2062
14-Apr-22 292.3592 228.5332 151.0559 149.8763
15-Apr-22        
18-Apr-22 313.4305 232.3631 151.0559 152.5553
19-Apr-22 286.6088 220.6844 151.1809 151.0887
20-Apr-22 278.2591 221.2081 150.3228 151.5905
21-Apr-22 279.4801 223.4488 151.5128 150.5957
22-Apr-22 262.4261 220.0085 149.1526 149.4912
25-Apr-22 268.0189 213.6942 143.31 148.4412
26-Apr-22 274.8326 220.5261 143.6773 148.9552
27-Apr-22 289.0507 223.7472 144.3157 149.3758
28-Apr-22 271.2878 227.9121 141.8107 149.6923
29-Apr-22 285.3092 228.6062 141.8696 148.0059
02-May-22 294.4072 231.188 141.8696 147.3451
03-May-22 313.2729 227.0474 136.4174 146.1055
04-May-22 331.4296 237.2405 137.3788 147.7777
05-May-22 345.9236 238.3547 136.4867 148.7298
06-May-22 317.4478 237.3379 134.2145 147.1822
09-May-22 277.9834 222.5476 130.0942 145.212
10-May-22 292.8003 217.6155 130.0297 145.2587
11-May-22 303.6471 226.9683 131.0712 147.1116
12-May-22 308.586 226.3959 128.521 148.6767
13-May-22 305.829 233.2887 129.169 149.2447
16-May-22 317.172 238.1355 130.3431 154.1302
17-May-22 330.6026 235.0971 132.3566 155.0734
18-May-22 333.005 228.8924 130.7092 151.8913
19-May-22 330.8389 233.7332 134.04 151.4947
20-May-22 322.0952 233.9402 134.8392 150.229
23-May-22 347.6565 236.0775 135.8167 151.3702
24-May-22 348.011 236.1018 133.687 149.4256
25-May-22 354.1945 238.0381 132.5496 149.2076
26-May-22 350.3347 244.5047 132.4751 149.6125
27-May-22 343.7179 246.8063 134.1942 150.6014
30-May-22        
31-May-22 320.7956 246.7941 133.0675 146.0275
01-Jun-22 342.497 251.1782 132.043 144.7274
02-Jun-22 334.1867 253.5712 132.043 146.0111
03-Jun-22 335.6832 258.4424 132.043 144.4872
06-Jun-22 367.1523 260.3239 135.2694 146.6362
07-Jun-22 365.892 259.8003 134.6277 145.9184
08-Jun-22 342.3 261.5844 135.3182 146.1177
09-Jun-22 353.3674 261.6331 133.0007 145.6138
10-Jun-22 349.098 257.4499 129.9977 143.9105
13-Jun-22 339.4643 254.5576 127.1539 141.7882
14-Jun-22 282.7884 249.4733 125.3778 140.8623
15-Jun-22 291.6896 246.8733 126.2292 140.9549
16-Jun-22 292.9499 249.4916 123.441 142.7677
17-Jun-22 271.9968 236.4002 122.6196 141.3781
20-Jun-22        
21-Jun-22 267.1523 238.9332 123.856 137.9945
22-Jun-22 270.6577 234.1959 120.6724 136.4484
23-Jun-22 247.4596 229.3369 118.0262 131.7013
24-Jun-22 247.3808 234.6526 116.1356 131.9906
27-Jun-22 257.818 236.5098 117.313 130.0979
28-Jun-22 258.7633 239.7918 117.0246 131.0789
29-Jun-22 255.9275 235.9496 117.2056 131.23
30-Jun-22 213.6274 225.0685 114.6624 128.0822
01-Jul-22 225.6794 232.0831 112.7023 125.651
04-Jul-22        
05-Jul-22 217.5265 213.7186 109.9611 121.6478
06-Jul-22 217.0146 208.6829 109.0844 122.2643
07-Jul-22 248.011 219.631 111.6206 124.6923
08-Jul-22 237.1248 220.8732 111.2141 128.0425
11-Jul-22 251.4061 221.3481 109.0477 127.1214
12-Jul-22 239.3777 205.9733 107.0889 122.5276
13-Jul-22 260.2993 206.8136 106.5735 122.7458
14-Jul-22 256.4395 202.9349 103.8874 121.35
15-Jul-22 272.7845 207.8487 104.5092 121.2185
18-Jul-22 290.7443 216.1542 108.318 124.1507
19-Jul-22 281.6069 216.5865 106.6047 122.9874
20-Jul-22 311.1067 217.2076 108.6444 122.7523
21-Jul-22 307.7983 210.5645 107.9968 120.8554
22-Jul-22 322.7648 209.8581 110.2439 119.1078
25-Jul-22 337.5738 213.9439 109.3015 120.3603
26-Jul-22 347.5777 213.1949 109.7746 122.7452
27-Jul-22 336.9042 217.3172 110.4951 123.2721
28-Jul-22 320.3623 215.4478 112.193 125.2201
29-Jul-22 324.1039 218.6568 115.1683 125.4406
01-Aug-22 326.2307 209.8459 113.7248 123.7872
02-Aug-22 303.5053 208.9509 112.7148 121.8722
03-Aug-22 325.5612 204.6885 111.0883 121.6832
04-Aug-22 319.8897 199.4703 112.392 123.632
05-Aug-22 317.5029 199.0014 113.7078 123.8871
08-Aug-22 298.7238 199.1232 114.7235 124.1993
09-Aug-22 308.3182 200.5176 115.6817 124.9971
10-Aug-22 322.7569 203.5316 116.8957 126.5682
11-Aug-22 349.0743 208.7377 118.7664 128.1575
12-Aug-22 344.3875 206.4909 116.2024 128.9483
15-Aug-22 343.1272 201.4979 114.164 127.7784
16-Aug-22 366.7191 198.9892 114.5898 125.9319
17-Aug-22 363.4502 202.1372 113.7845 125.4877
18-Aug-22 361.1657 206.905 114.0372 123.8883
19-Aug-22 366.8767 208.275 114.3023 125.315
22-Aug-22 379.9527 208.7986 114.1565 126.5113
23-Aug-22 360.5749 213.5603 114.83 128.2997
24-Aug-22 366.2859 216.6961 114.2328 128.8315
25-Aug-22 368.0189 213.4263 115.1478 127.4599
26-Aug-22 365.0649 214.6624 116.349 129.2435
29-Aug-22 367.7038 220.1181 116.349 130.8579
30-Aug-22 356.1244 209.2614 112.5107 129.773
31-Aug-22 359.4721 204.9686 111.5576 129.2973
01-Sep-22 364.7893 199.1414 107.973 126.928
02-Sep-22 346.0417 199.8356 107.8045 127.8223
05-Sep-22        
06-Sep-22 320.7956 197.6801 108.1545 128.3397
07-Sep-22 308.8617 189.8252 107.2453 128.2262
08-Sep-22 312.178 191.037 108.871 127.8514
09-Sep-22 315.6833 196.7485 110.1598 130.658
12-Sep-22 325.7896 199.3302 111.6521 131.7569
13-Sep-22 327.8456 197.3452 111.5579 131.3303
14-Sep-22 361.0476 198.7578 110.39 130.5872
15-Sep-22 329.7361 189.3503 109.8045 130.0169
16-Sep-22 307.6408 188.6744 109.8939 129.9352
19-Sep-22 307.365 190.4707 109.4999 129.2149
20-Sep-22 306.1047 188.8145 109.5868 131.9495
21-Sep-22 308.2709 187.4262 108.2804 131.5373
22-Sep-22 283.3005 187.8889 108.5768 131.6362
23-Sep-22 275.384 178.5179 105.1866 128.9043
26-Sep-22 276.2505 174.4322 103.1543 126.8464
27-Sep-22 266.2465 178.0247 102.354 126.8694
28-Sep-22 273.9267 185.3985 103.1859 127.9936
29-Sep-22 270.7364 183.5048 105.7958 127.7839
30-Sep-22 266.4828 179.6444 105.0135 128.0484
03-Oct-22 254.8247 186.6711 105.4578 128.0999
04-Oct-22 269.2792 194.3372 109.708 128.2482
05-Oct-22 272.9421 198.4595 109.9753 128.2979
06-Oct-22 274.5963 200.9377 109.7946 127.1639
07-Oct-22 268.1291 207.1607 107.6304 127.8703
10-Oct-22 258.9444 201.8328 107.3069 130.6187
11-Oct-22 267.6329 196.919 106.8417 129.7379
12-Oct-22 263.8755 193.7648 107.872 129.0888
13-Oct-22 277.7865 197.1199 108.9048 129.4816
14-Oct-22 268.8854 190.8847 107.6418 127.8914
17-Oct-22 255.1792 190.5803 106.0958 128.0612
18-Oct-22 245.6478 186.318 104.8022 127.6622
19-Oct-22 233.4777 188.4248 104.3625 127.3493
20-Oct-22 229.933 187.7306 106.4377 127.8844
21-Oct-22 215.5179 187.7854 106.3216 128.3999
24-Oct-22 226.5852 188.8266 105.7175 127.4725
25-Oct-22 242.8515 190.9152 105.9757 127.6314
26-Oct-22 241.0004 195.1714 109.961 127.5383

Indeed, there are still significant challenges to the inflation outlook around the world, most notably in the United States. The global economy remains highly disrupted by energy shortages and effects of the war in Ukraine. Global demand remains elevated, as do inflation expectations. It is unlikely that inflationary supply chain pressures will fully abate until demand for goods in the United States—the world’s largest economy—has normalized. The full effect on inflation of higher interest rates is expected to take time to materialize.  Altogether, these trends suggest that the global path back to moderate inflation will be gradual.

Chart 1.3
Consumer Price Inflation in Selected Economies and Regions
Chart 1.3: Consumer Price Inflation in Selected Economies and Regions

Note: The chart represents year-over-year headline CPI inflation readings for September 2022, except for G20 (August 2022), Australia and New Zealand (2022Q3), Germany, Italy and France (October 2022).

Sources: Haver Analytics; Organisation for Economic Co-operation and Development.

Text version
  China Japan Switzerland France Canada Norway New Zealand Australia United States G20 Euro area Denmark United Kingdom Germany Sweden Italy Netherlands
Last data point 2.8 2.997003 3.252485 6.219114 6.857943 6.893617 7.233273 7.26817 8.2 9.2 10 10.0189 10.09563 10.38844 10.83762 11.93182 14.532
Chart 1.4
Actual and Forecast Consumer Price Inflation, Canada
Chart 1.4: Actual and Forecast Consumer Price Inflation, Canada

Notes: Dashed and dotted lines are projections. Solid lines are actual data. Last actual data point is 2022Q3.

Sources: Statistics Canada; Department of Finance Canada September 2022 survey of private sector economists; Department of Finance Canada calculations.

Text version
  Actual September 2022 Survey
2019
Q4
2.1  
2020
Q1
1.7  
2020
Q2
0.1  
2020
Q3
0.4  
2020
Q4
0.7  
2021
Q1
1.4  
2021
Q2
3.3  
2021
Q3
4.1  
2021
Q4
4.7  
2022
Q1
5.8  
2022
Q2
7.4 7.4
2022
Q3
7.1 7.3
2022
Q4
  6.7
2023
Q1
  5.5
2023
Q2
  3.4
2023
Q3
  2.7
2023
Q4
  2.5
2024
Q1
  2.3
2024
Q2
  2.1
2024
Q3
  2.0
2024
Q4
  2.0

Interest Rates Are Rising Around the World

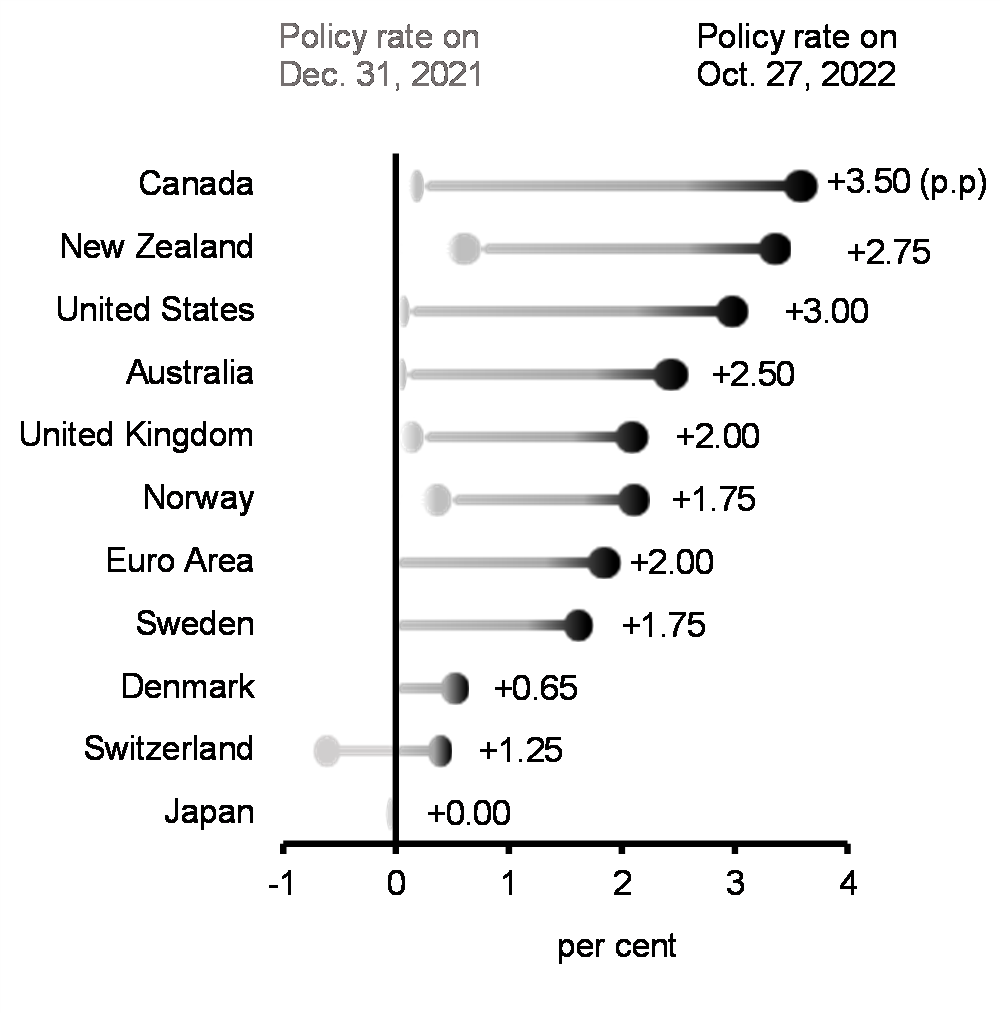
To slow demand and anchor inflation expectations, central banks, including the Bank of Canada and the U.S. Federal Reserve, have been raising interest rates in one of the most synchronized monetary tightening cycles in decades (Chart 1.5). For many advanced economies, interest rates are now reaching levels not seen in nearly 15 years.

Chart 1.5
Change in Central Bank Policy Rates Since January 2022, Advanced Economies
Chart 1.5: Change in Central Bank Policy    Rates Since January 2022, Advanced Economies

Notes: For the Euro Area the main refinancing rate is used, for the United States the Fed funds target rate, average, is used. Others are official rates.

Source: Haver Analytics.

Text version
  Japan Switzerland Denmark Sweden Euro Area Norway United Kingdom Australia United States New Zealand Canada
Rate on Dec 31, 2021 -0.10 -0.75 0.00 0.00 0.00 0.50 0.25 0.10 0.13 0.75 0.25
Rate on Oct 27, 2022 -0.10 0.50 0.65 1.75 2.00 2.25 2.25 2.60 3.13 3.50 3.75
Chart 1.6
U.S. Policy Rate Expectations
Chart 1.6: U.S. Policy Rate Expectations

Notes:  Last data point is December 2024. Fed funds futures pricing converted into market-based odds of future Federal Reserve announcements of the target interest rate.

Source: Bloomberg.

Text versionThe chart shows the Fed funds futures pricing converted into market-based odds of future United States Federal Reserve announcements of the target interest rate. It shows that U.S. policy rate rates were expected to peak just above 3.4 per cent next year, as of June 30, 2022. As of August 31, 2022 policy rates were expected to peak around 4 per cent next year. As of October 26, they were expected to peak slightly below 5 per cent in 2023.

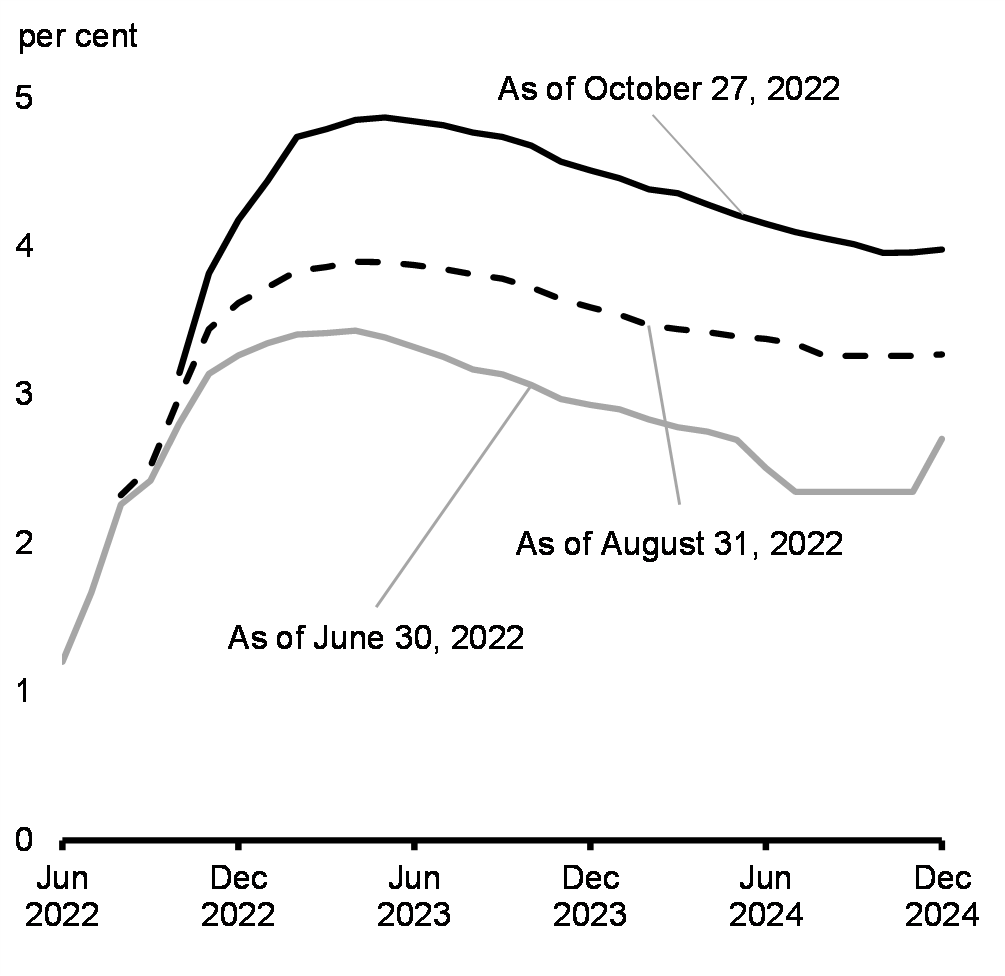
In recent months, market expectations for future policy rates have increased substantially, as underlying inflation and inflation expectations have remained elevated and the U.S. Federal Reserve has shown increased resolve to tame inflation. The ramifications are being felt worldwide in a surging U.S. dollar, rising interest rates, and volatile financial markets. Only a few months ago, U.S. policy rates were expected to peak just above 3 per cent, while markets now see them peaking at nearly 5 per cent (Chart 1.6). Central banks have also largely ended quantitative easing programs, with some allowing their balance sheets to shrink, drawing down liquidity. Primarily in response to the shift in monetary policy and expectations of further rate hikes, financial markets have undergone a notable repricing, with equity markets in particular registering significant declines. Higher interest rates have been deployed by central banks to fight inflation, but will markedly slow economic growth.

The Bank of Canada has been clear that it remains committed to using its monetary policy tools to return to the 2 per cent target and keep inflation expectations well-anchored. In late October, the Bank of Canada reiterated that it expects inflation to decline to around 3 per cent, the upper bound of its inflation target, in late 2023, and return to 2 per cent by the end of 2024.

Global Growth Is Expected to Slow and Recession Risks Have Risen

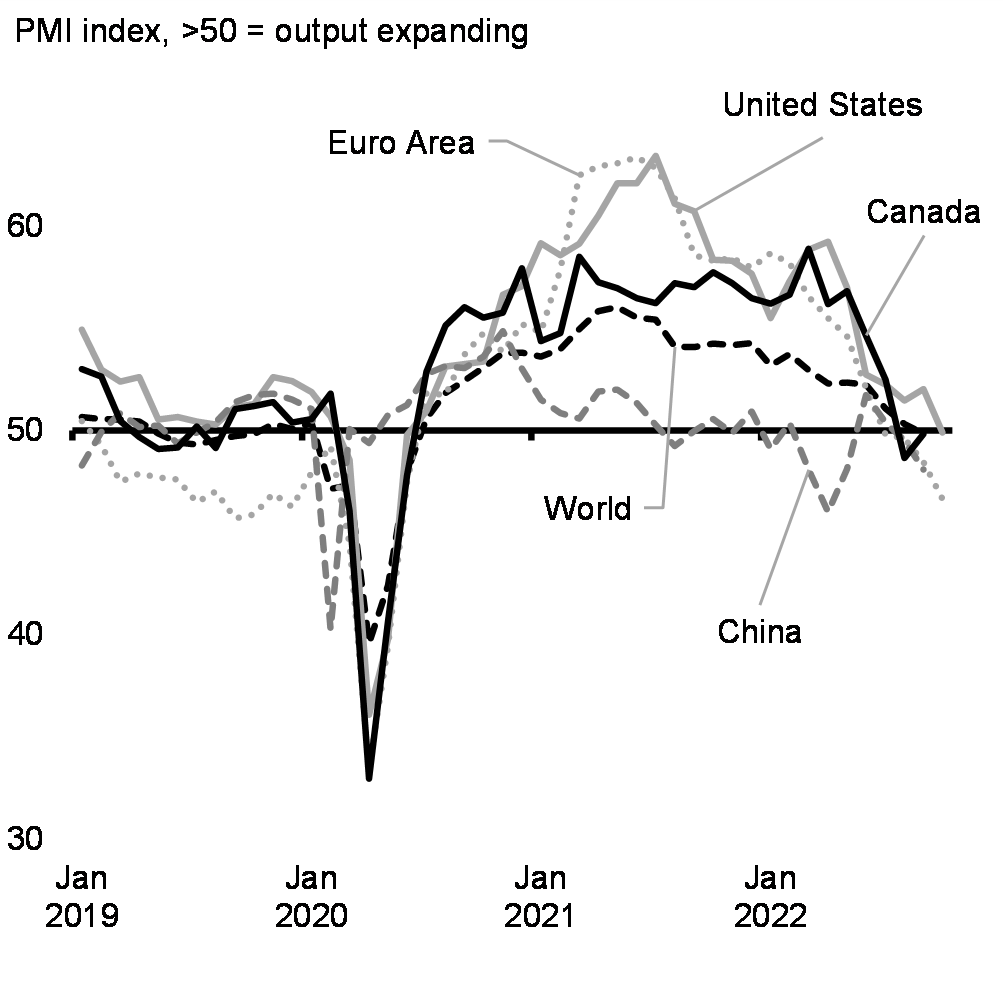
Global growth is expected to slow sharply in the second half of 2022 and in 2023, with the global economy at risk of falling into recession (Chart 1.7). The substantial tightening of financial conditions, as well as the European energy crisis driven by Russia’s illegal invasion of Ukraine, are the main sources of slowing growth in many economies. There are signs that global business activity has begun to weaken (Chart 1.8) and consumer confidence has deteriorated. However, it takes time for tighter financial conditions to have their full effect on production, investment, and consumption decisions. As a result, there is uncertainty about how much global growth will slow.

The sharp rise in U.S. interest rates, coupled with growing concerns over global growth, has fueled a sizeable appreciation of the U.S. dollar against most major currencies, including the Canadian dollar, adding to the increase in prices for imported goods. Given the dominant role of the U.S. dollar in international finance, a strong dollar is also raising debt service costs for non-U.S. borrowers who have debt denominated in U.S. dollars. As a result, developing countries will most acutely feel spillover effects from tightening U.S. monetary policy.

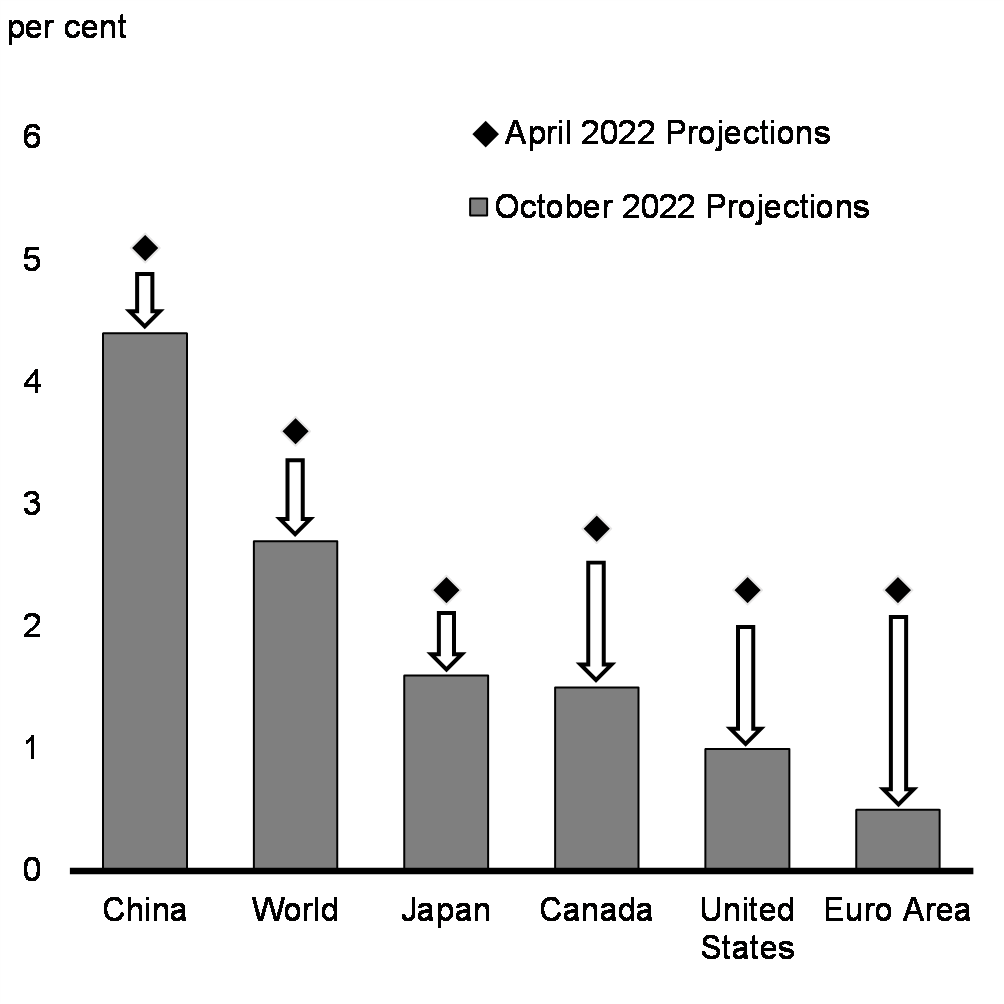
In some major economies, the effects of tighter financial conditions are amplified by unique challenges. The energy crisis in Europe threatens to tip its economy into recession this winter. China is undergoing a marked slowdown in growth amid a necessary correction in its property sector and, at the same time, ongoing restrictions to contain resurgent waves of COVID-19.

Chart 1.7
Revisions to 2023 Real GDP Growth IMF Forecasts for Major Economies
Chart 1.7: Revisions    to 2023 Real GDP Growth IMF Forecasts for Major Economies

Source: International Monetary Fund (IMF) World Economic Outlook, October 2022.

Text version
  October 2022 Projections April 2022 Projections
China 4.4 5.1
World 2.7 3.6
Japan 1.6 2.3
Canada 1.5 2.8
United
States
1 2.3
Euro Area 0.5 2.3
Chart 1.8
Global Manufacturing Activity
Chart 1.8: Global Manufacturing Activity

Note: Last data point is October 2022 for Euro Area and United States, September 2022 for all others.

Source: PMI by S&P Global.

Text versionThe chart shows S&P Global's Purchasing Managers' Index (PMI) for the Manufacturing sector in Canada, United States, Euro Area, mainland China and the world, from the beginning of 2019 to September 2022. The PMI reading for Canada, United States, Euro Area, and the world was above 50 through 2021 and the first half of 2022, indicating that global output was expanding. In mid-2022, the PMI index for these regions fell sharply, indicating global growth in manufacturing has slowed. The PMI Manufacturing index for China has been weaker than other regions, having fallen below 50 at various times through 2021 and 2022, indicating contraction in China's manufacturing sector.

Canada Has Seen a Strong Recovery

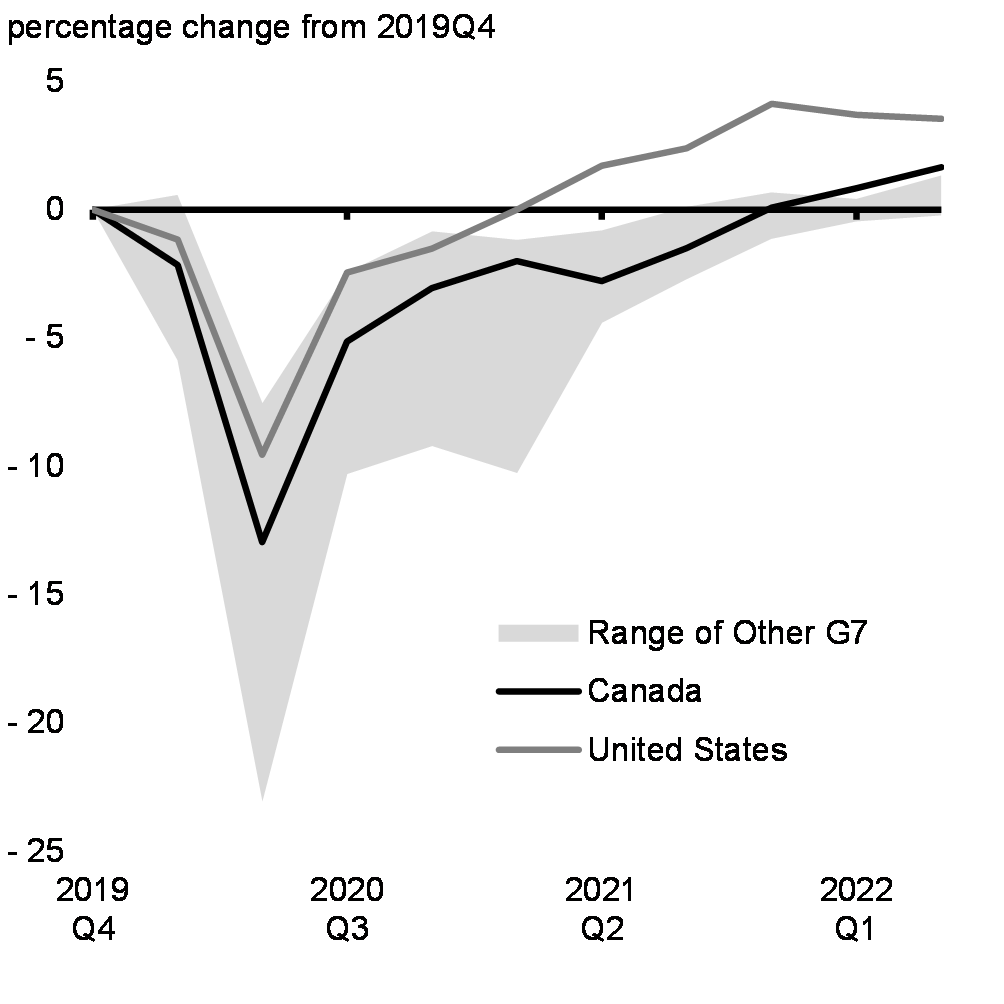
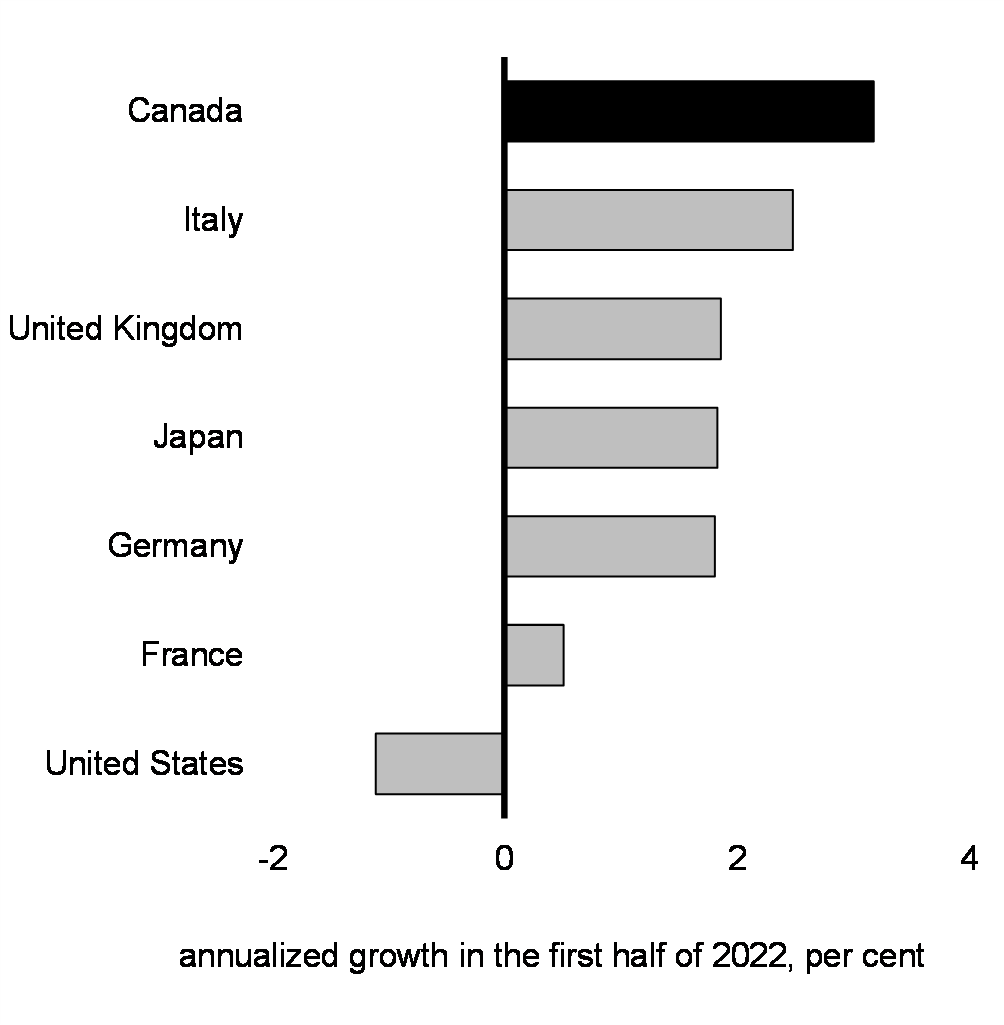
Canada’s economic recovery from the pandemic recession has been strong, with real gross domestic product (GDP) having returned to pre-pandemic levels in the fourth quarter of 2021—the fastest recovery of the last three recessions. Despite slowing global economic growth, the Canadian economy has demonstrated resilience, having seen strong growth in the first half of 2022 (Chart 1.9), with real GDP growing by 3.2 per cent at an annual rate—by far the fastest pace in the G7 (Chart 1.10). Canada’s economy is now 102.6 per cent the size that it was before the pandemic.

Chart 1.9
Real GDP Recovery From Pandemic in G7 Economies
Chart 1.9: Real GDP Recovery From Pandemic in G7 Economies

Note: Last data point in 2022Q2.

Sources: Haver Analytics; Statistics Canada.

Text version
  Canada United States G7 Minimum G7 Maximum
2019
Q4
0.0 0.0 0.0 0.0
2020
Q1
-2.2 -1.2 -5.9 0.6
2020
Q2
-13.0 -9.6 -23.1 -7.5
2020
Q3
-5.1 -2.5 -10.3 -2.4
2020
Q4
-3.1 -1.5 -9.2 -0.9
2021
Q1
-2.0 0.0 -10.3 -1.2
2021
Q2
-2.8 1.7 -4.4 -0.8
2021
Q3
-1.5 2.4 -2.7 0.1
2021
Q4
0.1 4.1 -1.1 0.7
2022
Q1
0.8 3.7 -0.5 0.4
2022
Q2
1.7 3.5 -0.2 1.3
Chart 1.10
Real GDP Growth in G7 Economies, 2021Q4 to 2022Q2
Chart 1.10: Real    GDP Growth in G7 Economies, 2021Q4 to 2022Q2

Sources: Haver Analytics; Statistics Canada.

Text version
  Canada
United States -1.1
France 0.5
Germany 1.8
Japan 1.8
United Kingdom 1.9
Italy 2.5
Canada 3.2

The Labour Market Is Strong

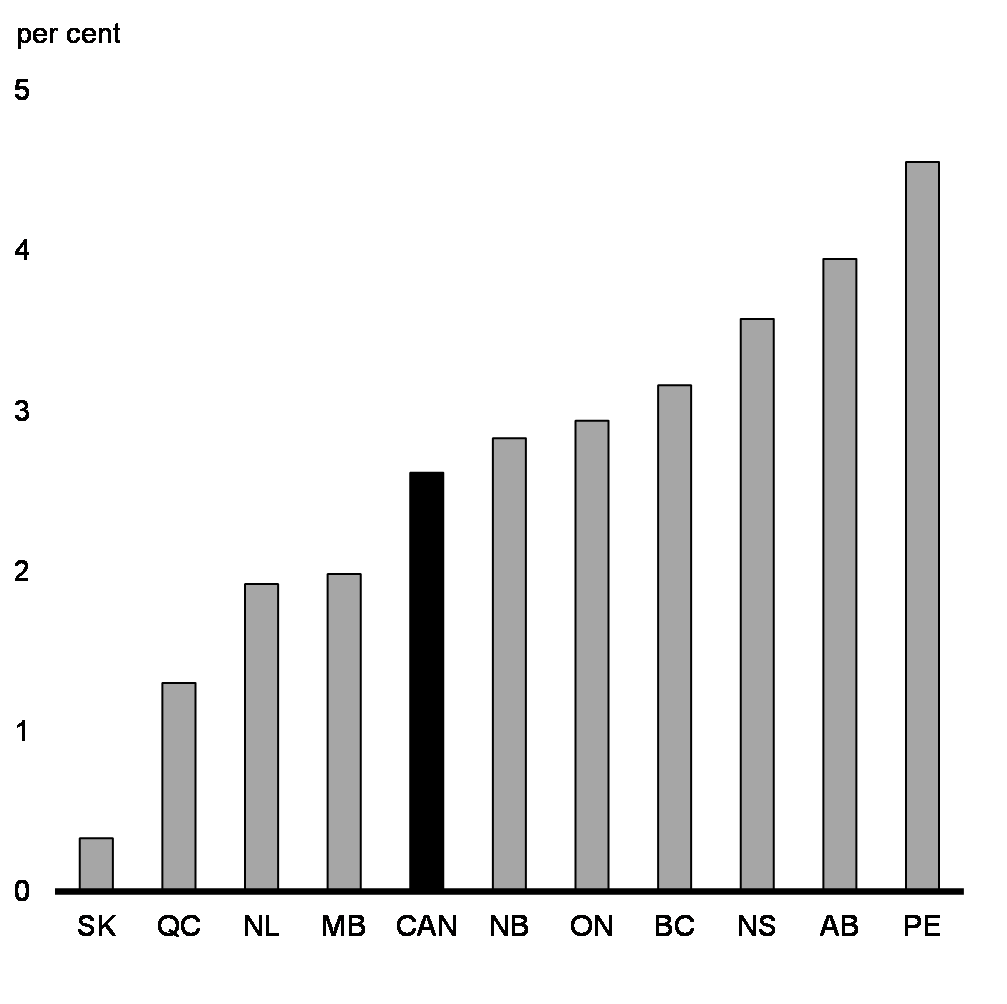
The strength of Canada’s recovery has been particularly evident in the labour market. Canada has seen one of the fastest jobs recoveries in the G7, in large part due to the broad-based pandemic support the federal government provided to workers and businesses. About 400,000 more Canadians are working today than before the pandemic, and the unemployment rate of 5.2 per cent in September is near its record low (Chart 1.11). These strong conditions are apparent across the country, with employment above pre-pandemic levels in every province (Chart 1.12). Compared to the United States, the economy to which Canada’s is most closely linked, labour force participation is particularly strong. In Canada, about 79 per cent of working-age Canadians participated in the labour market in September, compared to just 74 per cent in the United States.

However, employers have struggled to fill available positions, partly fuelled by a shortfall in immigration earlier in the pandemic (Chart 1.13). Employers were seeking to fill over one million jobs in the second quarter, a record high, though the most timely data suggests some easing in labour demand. Canada’s strong employment recovery has reduced the number of available workers, limiting the potential for further sizeable job gains. This tightness in the labour market has also resulted in a solid rise in wage growth, which has helped lessen the impacts for some of the rising cost of living.

Chart 1.11
Unemployment Rate
Chart 1.11: Unemployment Rate

Note: Last data point is September 2022.

Source: Statistics Canada.

Text version
  Unemployment Rate
Jan-1976 7.1
Feb-1976 7.0
Mar-1976 6.7
Apr-1976 6.8
May-1976 6.9
Jun-1976 6.9
Jul-1976 7.4
Aug-1976 7.1
Sep-1976 7.0
Oct-1976 7.4
Nov-1976 7.4
Dec-1976 7.5
Jan-1977 7.6
Feb-1977 7.9
Mar-1977 7.8
Apr-1977 7.9
May-1977 7.8
Jun-1977 7.8
Jul-1977 8.1
Aug-1977 8.2
Sep-1977 8.3
Oct-1977 8.4
Nov-1977 8.5
Dec-1977 8.5
Jan-1978 8.3
Feb-1978 8.3
Mar-1978 8.5
Apr-1978 8.4
May-1978 8.6
Jun-1978 8.4
Jul-1978 8.3
Aug-1978 8.4
Sep-1978 8.4
Oct-1978 8.2
Nov-1978 8.3
Dec-1978 8.3
Jan-1979 8.2
Feb-1979 8.0
Mar-1979 7.9
Apr-1979 8.0
May-1979 7.6
Jun-1979 7.4
Jul-1979 7.2
Aug-1979 7.1
Sep-1979 7.0
Oct-1979 7.2
Nov-1979 7.2
Dec-1979 7.2
Jan-1980 7.5
Feb-1980 7.6
Mar-1980 7.6
Apr-1980 7.7
May-1980 7.8
Jun-1980 7.7
Jul-1980 7.6
Aug-1980 7.6
Sep-1980 7.3
Oct-1980 7.3
Nov-1980 7.2
Dec-1980 7.3
Jan-1981 7.4
Feb-1981 7.4
Mar-1981 7.4
Apr-1981 7.1
May-1981 7.2
Jun-1981 7.2
Jul-1981 7.2
Aug-1981 7.1
Sep-1981 8.1
Oct-1981 8.3
Nov-1981 8.3
Dec-1981 8.7
Jan-1982 8.6
Feb-1982 8.9
Mar-1982 9.3
Apr-1982 9.8
May-1982 10.3
Jun-1982 11.1
Jul-1982 11.9
Aug-1982 12.0
Sep-1982 12.4
Oct-1982 12.9
Nov-1982 12.9
Dec-1982 13.1
Jan-1983 12.7
Feb-1983 12.7
Mar-1983 12.5
Apr-1983 12.4
May-1983 12.4
Jun-1983 12.4
Jul-1983 11.9
Aug-1983 11.7
Sep-1983 11.4
Oct-1983 11.3
Nov-1983 11.3
Dec-1983 11.3
Jan-1984 11.3
Feb-1984 11.3
Mar-1984 11.3
Apr-1984 11.5
May-1984 11.7
Jun-1984 11.3
Jul-1984 11.2
Aug-1984 11.3
Sep-1984 11.8
Oct-1984 11.3
Nov-1984 11.4
Dec-1984 11.1
Jan-1985 10.6
Feb-1985 10.8
Mar-1985 11.0
Apr-1985 10.8
May-1985 10.6
Jun-1985 10.7
Jul-1985 10.4
Aug-1985 10.3
Sep-1985 10.2
Oct-1985 10.3
Nov-1985 10.3
Dec-1985 10.1
Jan-1986 9.8
Feb-1986 9.9
Mar-1986 9.8
Apr-1986 9.7
May-1986 9.5
Jun-1986 9.6
Jul-1986 9.6
Aug-1986 9.6
Sep-1986 9.5
Oct-1986 9.4
Nov-1986 9.4
Dec-1986 9.5
Jan-1987 9.5
Feb-1987 9.5
Mar-1987 9.4
Apr-1987 9.2
May-1987 8.9
Jun-1987 8.9
Jul-1987 8.7
Aug-1987 8.6
Sep-1987 8.4
Oct-1987 8.3
Nov-1987 8.2
Dec-1987 8.0
Jan-1988 8.1
Feb-1988 7.8
Mar-1988 7.8
Apr-1988 7.7
May-1988 7.8
Jun-1988 7.6
Jul-1988 7.8
Aug-1988 7.8
Sep-1988 7.8
Oct-1988 7.8
Nov-1988 7.8
Dec-1988 7.5
Jan-1989 7.5
Feb-1989 7.6
Mar-1989 7.5
Apr-1989 7.8
May-1989 7.7
Jun-1989 7.5
Jul-1989 7.5
Aug-1989 7.3
Sep-1989 7.3
Oct-1989 7.2
Nov-1989 7.5
Dec-1989 7.7
Jan-1990 7.9
Feb-1990 7.7
Mar-1990 7.3
Apr-1990 7.6
May-1990 7.8
Jun-1990 7.6
Jul-1990 7.9
Aug-1990 8.1
Sep-1990 8.5
Oct-1990 8.8
Nov-1990 9.1
Dec-1990 9.5
Jan-1991 9.8
Feb-1991 10.2
Mar-1991 10.5
Apr-1991 10.3
May-1991 10.2
Jun-1991 10.5
Jul-1991 10.5
Aug-1991 10.5
Sep-1991 10.3
Oct-1991 10.3
Nov-1991 10.4
Dec-1991 10.3
Jan-1992 10.4
Feb-1992 10.5
Mar-1992 10.9
Apr-1992 10.7
May-1992 10.9
Jun-1992 11.4
Jul-1992 11.3
Aug-1992 11.7
Sep-1992 11.6
Oct-1992 11.4
Nov-1992 12.1
Dec-1992 11.7
Jan-1993 11.2
Feb-1993 11.0
Mar-1993 11.2
Apr-1993 11.6
May-1993 11.6
Jun-1993 11.7
Jul-1993 11.6
Aug-1993 11.2
Sep-1993 11.5
Oct-1993 11.3
Nov-1993 11.2
Dec-1993 11.4
Jan-1994 11.4
Feb-1994 11.1
Mar-1994 10.6
Apr-1994 10.9
May-1994 10.7
Jun-1994 10.3
Jul-1994 10.1
Aug-1994 10.2
Sep-1994 10.1
Oct-1994 10.0
Nov-1994 9.7
Dec-1994 9.6
Jan-1995 9.6
Feb-1995 9.6
Mar-1995 9.7
Apr-1995 9.5
May-1995 9.5
Jun-1995 9.5
Jul-1995 9.6
Aug-1995 9.5
Sep-1995 9.2
Oct-1995 9.3
Nov-1995 9.2
Dec-1995 9.4
Jan-1996 9.4
Feb-1996 9.5
Mar-1996 9.6
Apr-1996 9.3
May-1996 9.2
Jun-1996 9.8
Jul-1996 9.7
Aug-1996 9.4
Sep-1996 9.9
Oct-1996 9.9
Nov-1996 9.9
Dec-1996 9.7
Jan-1997 9.5
Feb-1997 9.5
Mar-1997 9.3
Apr-1997 9.4
May-1997 9.4
Jun-1997 9.1
Jul-1997 8.9
Aug-1997 8.9
Sep-1997 8.8
Oct-1997 8.9
Nov-1997 8.9
Dec-1997 8.5
Jan-1998 8.8
Feb-1998 8.6
Mar-1998 8.4
Apr-1998 8.3
May-1998 8.3
Jun-1998 8.4
Jul-1998 8.3
Aug-1998 8.1
Sep-1998 8.2
Oct-1998 8.0
Nov-1998 8.0
Dec-1998 8.1
Jan-1999 7.9
Feb-1999 7.9
Mar-1999 7.9
Apr-1999 8.2
May-1999 7.9
Jun-1999 7.6
Jul-1999 7.6
Aug-1999 7.4
Sep-1999 7.5
Oct-1999 7.2
Nov-1999 6.9
Dec-1999 6.8
Jan-2000 6.8
Feb-2000 6.9
Mar-2000 6.9
Apr-2000 6.7
May-2000 6.6
Jun-2000 6.7
Jul-2000 6.8
Aug-2000 7.0
Sep-2000 6.9
Oct-2000 7.0
Nov-2000 6.9
Dec-2000 6.8
Jan-2001 6.9
Feb-2001 7.0
Mar-2001 7.1
Apr-2001 7.1
May-2001 7.0
Jun-2001 7.2
Jul-2001 7.1
Aug-2001 7.2
Sep-2001 7.2
Oct-2001 7.3
Nov-2001 7.5
Dec-2001 8.1
Jan-2002 8.0
Feb-2002 8.0
Mar-2002 7.9
Apr-2002 7.7
May-2002 7.8
Jun-2002 7.6
Jul-2002 7.6
Aug-2002 7.4
Sep-2002 7.5
Oct-2002 7.6
Nov-2002 7.4
Dec-2002 7.5
Jan-2003 7.5
Feb-2003 7.5
Mar-2003 7.4
Apr-2003 7.6
May-2003 7.8
Jun-2003 7.6
Jul-2003 7.7
Aug-2003 7.8
Sep-2003 7.8
Oct-2003 7.6
Nov-2003 7.4
Dec-2003 7.3
Jan-2004 7.3
Feb-2004 7.3
Mar-2004 7.3
Apr-2004 7.2
May-2004 7.1
Jun-2004 7.2
Jul-2004 7.1
Aug-2004 7.0
Sep-2004 6.9
Oct-2004 7.1
Nov-2004 7.2
Dec-2004 7.1
Jan-2005 7.0
Feb-2005 7.0
Mar-2005 6.9
Apr-2005 6.7
May-2005 7.0
Jun-2005 6.8
Jul-2005 6.7
Aug-2005 6.7
Sep-2005 6.7
Oct-2005 6.7
Nov-2005 6.4
Dec-2005 6.6
Jan-2006 6.6
Feb-2006 6.4
Mar-2006 6.4
Apr-2006 6.3
May-2006 6.1
Jun-2006 6.1
Jul-2006 6.4
Aug-2006 6.4
Sep-2006 6.4
Oct-2006 6.2
Nov-2006 6.4
Dec-2006 6.2
Jan-2007 6.3
Feb-2007 6.2
Mar-2007 6.2
Apr-2007 6.2
May-2007 6.0
Jun-2007 6.1
Jul-2007 6.0
Aug-2007 5.9
Sep-2007 5.9
Oct-2007 5.9
Nov-2007 6.1
Dec-2007 6.1
Jan-2008 5.9
Feb-2008 6.0
Mar-2008 6.2
Apr-2008 6.1
May-2008 6.1
Jun-2008 6.1
Jul-2008 6.1
Aug-2008 6.1
Sep-2008 6.1
Oct-2008 6.2
Nov-2008 6.6
Dec-2008 6.9
Jan-2009 7.4
Feb-2009 8.0
Mar-2009 8.2
Apr-2009 8.3
May-2009 8.7
Jun-2009 8.7
Jul-2009 8.7
Aug-2009 8.6
Sep-2009 8.4
Oct-2009 8.5
Nov-2009 8.5
Dec-2009 8.5
Jan-2010 8.3
Feb-2010 8.3
Mar-2010 8.3
Apr-2010 8.2
May-2010 8.1
Jun-2010 8.0
Jul-2010 8.0
Aug-2010 8.1
Sep-2010 8.2
Oct-2010 8.0
Nov-2010 7.7
Dec-2010 7.7
Jan-2011 7.8
Feb-2011 7.7
Mar-2011 7.7
Apr-2011 7.7
May-2011 7.6
Jun-2011 7.6
Jul-2011 7.3
Aug-2011 7.3
Sep-2011 7.4
Oct-2011 7.4
Nov-2011 7.6
Dec-2011 7.5
Jan-2012 7.7
Feb-2012 7.5
Mar-2012 7.3
Apr-2012 7.3
May-2012 7.4
Jun-2012 7.2
Jul-2012 7.3
Aug-2012 7.3
Sep-2012 7.3
Oct-2012 7.5
Nov-2012 7.4
Dec-2012 7.3
Jan-2013 7.1
Feb-2013 7.1
Mar-2013 7.3
Apr-2013 7.2
May-2013 7.0
Jun-2013 7.2
Jul-2013 7.1
Aug-2013 7.1
Sep-2013 7.1
Oct-2013 7.1
Nov-2013 7.0
Dec-2013 7.3
Jan-2014 7.1
Feb-2014 7.1
Mar-2014 7.0
Apr-2014 7.1
May-2014 7.1
Jun-2014 7.1
Jul-2014 7.1
Aug-2014 7.0
Sep-2014 6.9
Oct-2014 6.7
Nov-2014 6.7
Dec-2014 6.7
Jan-2015 6.7
Feb-2015 6.8
Mar-2015 6.9
Apr-2015 6.9
May-2015 6.9
Jun-2015 6.9
Jul-2015 6.9
Aug-2015 7.0
Sep-2015 7.1
Oct-2015 6.9
Nov-2015 7.1
Dec-2015 7.2
Jan-2016 7.2
Feb-2016 7.3
Mar-2016 7.1
Apr-2016 7.2
May-2016 7.0
Jun-2016 6.9
Jul-2016 7.0
Aug-2016 7.0
Sep-2016 7.0
Oct-2016 7.0
Nov-2016 6.9
Dec-2016 7.0
Jan-2017 6.8
Feb-2017 6.6
Mar-2017 6.7
Apr-2017 6.5
May-2017 6.6
Jun-2017 6.5
Jul-2017 6.3
Aug-2017 6.2
Sep-2017 6.2
Oct-2017 6.3
Nov-2017 6.0
Dec-2017 5.9
Jan-2018 6.0
Feb-2018 5.9
Mar-2018 5.9
Apr-2018 5.9
May-2018 6.0
Jun-2018 6.1
Jul-2018 5.8
Aug-2018 6.0
Sep-2018 5.9
Oct-2018 5.9
Nov-2018 5.7
Dec-2018 5.8
Jan-2019 5.9
Feb-2019 5.9
Mar-2019 5.8
Apr-2019 5.8
May-2019 5.4
Jun-2019 5.5
Jul-2019 5.8
Aug-2019 5.8
Sep-2019 5.6
Oct-2019 5.7
Nov-2019 6.0
Dec-2019 5.8
Jan-2020 5.6
Feb-2020 5.7
Mar-2020 7.9
Apr-2020 13.0
May-2020 13.4
Jun-2020 12.2
Jul-2020 10.9
Aug-2020 10.3
Sep-2020 9.2
Oct-2020 9.2
Nov-2020 8.7
Dec-2020 8.9
Jan-2021 9.4
Feb-2021 8.3
Mar-2021 7.5
Apr-2021 8.0
May-2021 8.0
Jun-2021 7.6
Jul-2021 7.4
Aug-2021 7.1
Sep-2021 7.0
Oct-2021 6.8
Nov-2021 6.1
Dec-2021 6.0
Jan-2022 6.5
Feb-2022 5.5
Mar-2022 5.3
Apr-2022 5.2
May-2022 5.1
Jun-2022 4.9
Jul-2022 4.9
Aug-2022 5.4
Sep-2022 5.2
Chart 1.12
Change in Employment Relative to Pre-Pandemic Level
Chart 1.12: Change    in Employment Relative to Pre-Pandemic Level

Note: Percentage change from 2019Q4 to 2022Q3.

Source: Statistics Canada.

Text version
  Employment, Percentage Change from 2019Q4 to 2022Q3
SK 0.3
QC 1.3
NL 1.9
MB 2.0
CAN 2.6
NB 2.8
ON 2.9
BC 3.2
NS 3.6
AB 3.9
PE 4.6

A strong rebound in immigration has helped drive the recovery in population growth and the labour force. Canada has experienced the fastest population growth among G7 countries over the past several years (Chart 1.14). After declining sharply early in the pandemic, the number of new permanent residents in Canada surged by about 275,000 so far in 2022, with the government well on track to achieving its 2022 immigration target. Further, the numbers of students and temporary foreign workers also increased significantly. The economic benefits of immigration, which are in addition to the social and familial benefits, depend on how well newcomers integrate into the labour market. Canada is doing well in this regard as newcomers to Canada have steadily improved their labour force participation over the past few years. Canada continuing to be a destination of choice for those looking to build a better future for themselves and their families will be an important factor in our continued economic growth.

Chart 1.13
Job Searchers per Vacancy
Chart 1.13: Job Searchers    per Vacancy

Notes: Last data point is 2022Q2. Job searchers includes the unemployed but excludes future-start and temporary layoff unemployment.

Source: Statistics Canada.

Text version
Quarter Job searchers per vacancy
2016
Q1
3.509274624
2016
Q2
3.371086006
2016
Q3
3.185407939
2016
Q4
3.16126559
2017
Q1
2.864092481
2017
Q2
2.690093646
2017
Q3
2.503980684
2017
Q4
2.278513791
2018
Q1
2.146221387
2018
Q2
2.062350058
2018
Q3
1.984760994
2018
Q4
1.89589551
2019
Q1
2.015216432
2019
Q2
1.851447633
2019
Q3
1.87604568
2019
Q4
2.051875036
2020
Q1
1.905829923
2020
Q2
4.02709879
2020
Q3
3.557117729
2020
Q4
2.739209402
2021
Q1
2.45470765
2021
Q2
2.002698548
2021
Q3
1.454731164
2021
Q4
1.269920144
2022
Q1
1.145948778
2022
Q2
0.958781544
Chart 1.14
Population Growth, G7 economies
Chart 1.14: Population Growth, G7 economies

Notes:  Last data point is 2020 for United Kingdom and 2022 for other countries. Population estimated as of July 1 for Canada and United States, and as of January 1 for other countries.

Sources: Statistics Canada; National Statistical Offices; Eurostat.

Text version
  France Italy Germany United Kingdom Canada United States Japan
2015 100 100 100 100 100 100 100
2016 100.2712 99.78607 101.2047 100.8105 101.1388 100.727383 100.0094
2017 100.5291 99.66089 101.6307 101.5277 102.3593 101.366532 99.84726
2018 100.8548 99.4874 101.9641 102.1898 103.8153 101.901546 99.66618
2019 101.2524 98.38979 102.2435 102.7658 105.317 102.366722 99.44968
2020 101.5459 98.10163 102.4252 103.3493 106.454 103.355376 99.19065
2021 101.8034 97.43501 102.4108   107.0683 103.4779 98.9088
2022 102.0832 97.01872 102.5119   109.0385 103.7722 98.65607

Canada’s Economic Growth Has Slowed From Its Robust Pace

While Canada’s recovery has been solid, the economy is now showing signs of slowing and life has become more expensive for Canadians. Elevated inflation, combined with rising interest rates and lower equity prices, are weighing heavily on household finances and will slow household spending. At the same time, a weakening global economy is weighing on commodity prices and will ultimately have an impact on demand for Canadian exports. Overall, real GDP expanded by 1.8 per cent at an annual rate from May to August—a notable deceleration from a growth pace of 7.1 per cent between January and April.

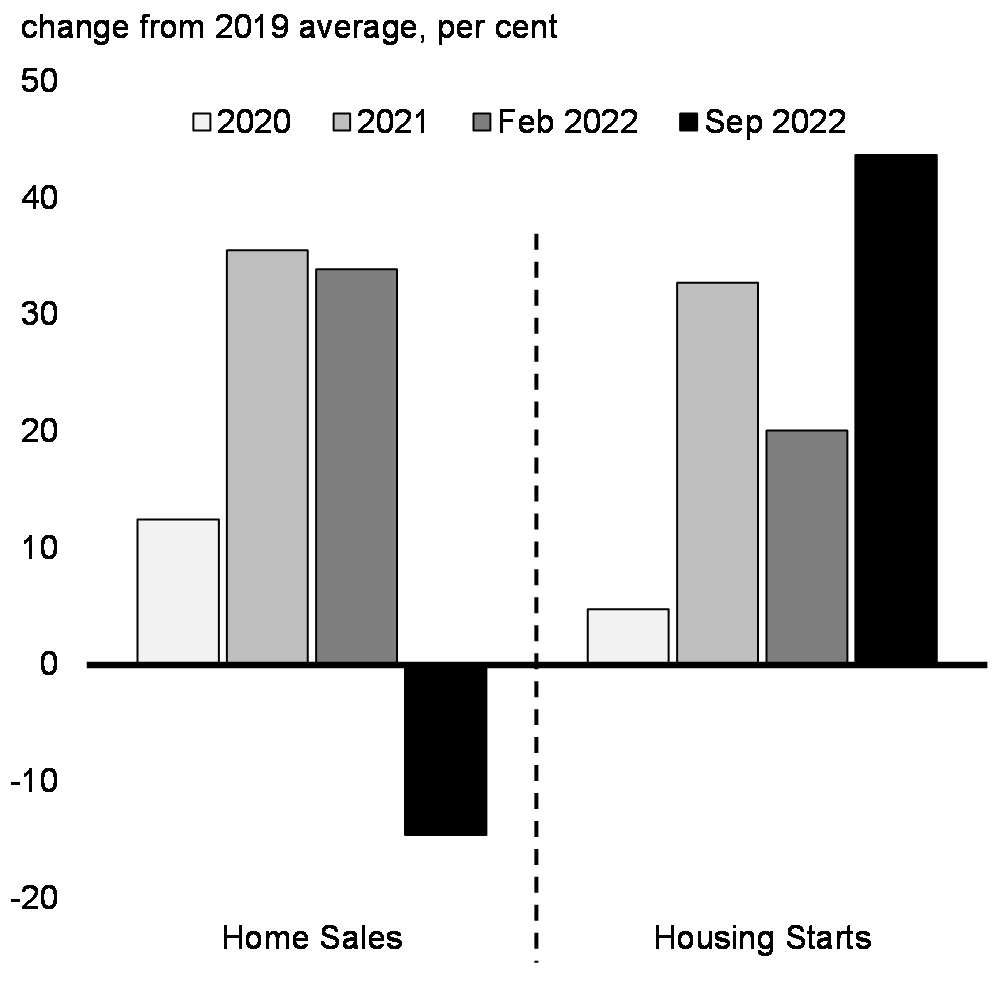
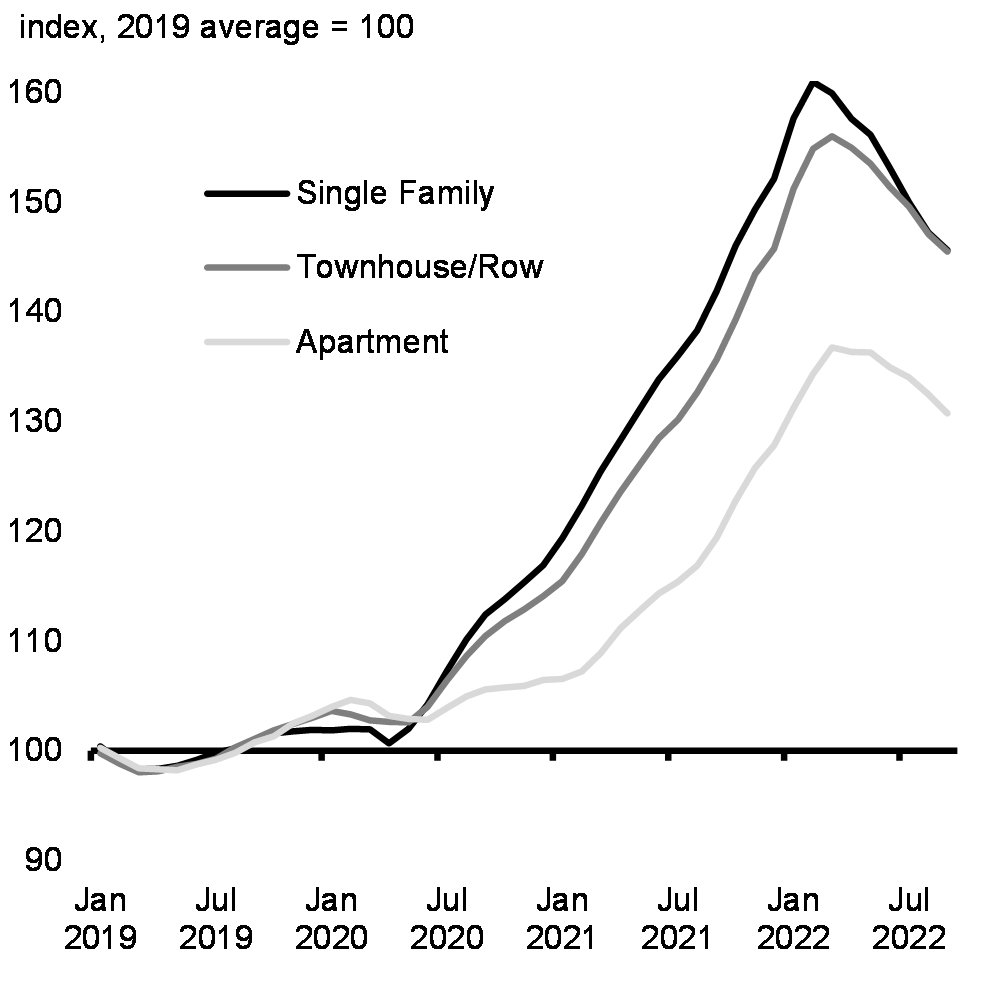
So far, the moderation in growth has been most evident in housing markets, which are undergoing a sharp pullback following unprecedented heights during the pandemic. Triggered by higher mortgage rates, resales are down 36 per cent from their peak in February, while house prices are down 9 per cent (Charts 1.15 and 1.16). The cooling in overheated house prices will help slow inflation and make it more affordable for Canadians to enter the housing market. Encouragingly, new construction has been quite resilient, which will also contribute to supply and help moderate housing prices.

Consumer spending, which surged earlier this year as public health restrictions were lifted, is also weakening. High inflation has increased the cost of virtually all goods and services. Bringing inflation under control is critical to ensuring working Canadians do not fall behind. Rising interest rates have raised the cost of borrowing over the past year, while falling home and equity prices have reduced household net worth. That said, there are some factors that may help buoy consumer spending. Notably, many households accumulated an unusually large amount of savings during the pandemic as people stayed home. Labour market conditions are also expected to remain solid.

Meanwhile, the global slowdown is beginning to impact Canadian exporters. The current moderation of commodity prices is weighing on export revenues and could reduce activity in commodity-producing sectors. The slowdown in global manufacturing activity will also drag on non-commodity exporters in the coming months. Despite a deterioration in global economic conditions, some factors could support exports and business investment as the global economy recovers through 2024. The rebound in international travel, the unwinding of global supply chain disruptions, and the recent depreciation of the Canadian dollar should partially offset the impact of weaker global activity on non-commodity exports. Capital expenditures could also increase in response to ongoing capacity constraints facing many businesses.

Chart 1.15
Key Measures of Housing Activity
Chart 1.15: Key Measures of Housing Activity

Sources: Canadian Real Estate Association; Canada Mortgage and Housing Corporation.

Text versionThe chart shows the change in Canadian home resales (from the Canadian Real Estate Association) and Canadian housing starts (from the Canada Mortgage and Housing Corporation) since 2019. Specifically, it provides the percentage change from the 2019 average level of home resales and housing starts to the (1) 2020 average level, (2) 2021 average level, (3) February 2022 level, and (4) September 2022 level. Home resales and housing starts increased substantially during the pandemic, rising to more than 30 per cent above the 2019 average in 2020 and remaining elevated through to February 2022. Since February, home resales have fallen sharply and are now about 15 per cent below the 2019 average as of September 2022, while housing starts remain elevated (up more than 40 per cent from 2019).
Chart 1.16
Evolution of House Prices
Chart 1.16: Evolution    of House Prices

Note: Last data point is September 2022.

Source: Canadian Real Estate Association.

Text versionThe chart shows the evolution of house prices from January 2019 to September 2022. It provides indexes showing the percentage change in house prices relative to the 2019 average for three types of dwellings: (1) single-family homes, (2) townhouse/row homes, and (3) apartments. House prices for all types of dwellings increased markedly during the pandemic, with single-family homes reaching a peak increase of about 60 per cent in early 2022, followed by townhouse/row homes (up about 55 per cent) and apartments (up about 35 per cent). Since early 2022, house prices for all types of dwellings have declined significantly but remain well above pre-pandemic levels as of September 2022.

1.2 Canadian Economic Outlook

The Department of Finance surveyed a group of private sector economists in early September 2022. The average of private sector forecasts has been used as the basis for economic and fiscal planning since 1994, helping to ensure objectivity and transparency, and introducing an element of independence into the government’s economic and fiscal forecast.

Since the private sector survey was conducted in early September, global economic and financial conditions have continued to deteriorate. While the macroeconomic inputs of the September survey continue to provide a reasonable basis for economic and fiscal planning (see Annex 1 for details of the economic and fiscal projections), the balance of risks to the growth outlook are tilted to the downside, with growth more likely to come in below the survey than above. To facilitate prudent economic and fiscal planning, the Department of Finance has developed an alternative scenario that illustrates a slower growth track relative to the September survey.

Private Sector Economists Expect Economic Growth to Slow Further

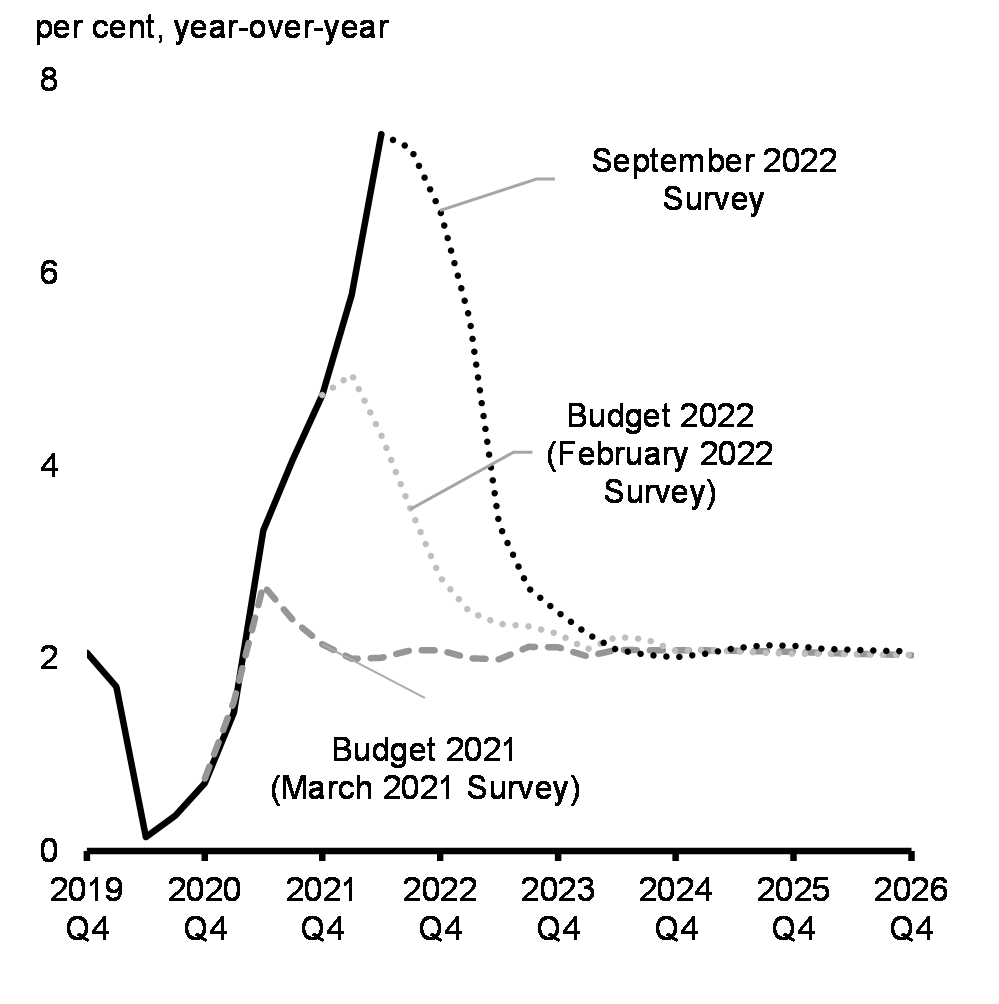
Inflation has been much higher than projected by private sector economists in Budget 2022, which was based on a survey conducted in early February 2022, before Russia’s illegal invasion of Ukraine. While private sector economists continue to believe Consumer Price Index (CPI) inflation will return to the Bank of Canada’s target, this process is taking longer than previously expected. CPI inflation was projected to remain above 3 per cent until the third quarter of 2023—almost a year later than private sector economists predicted in Budget 2022—before reaching 2 per cent in mid-2024 (Chart 1.17).

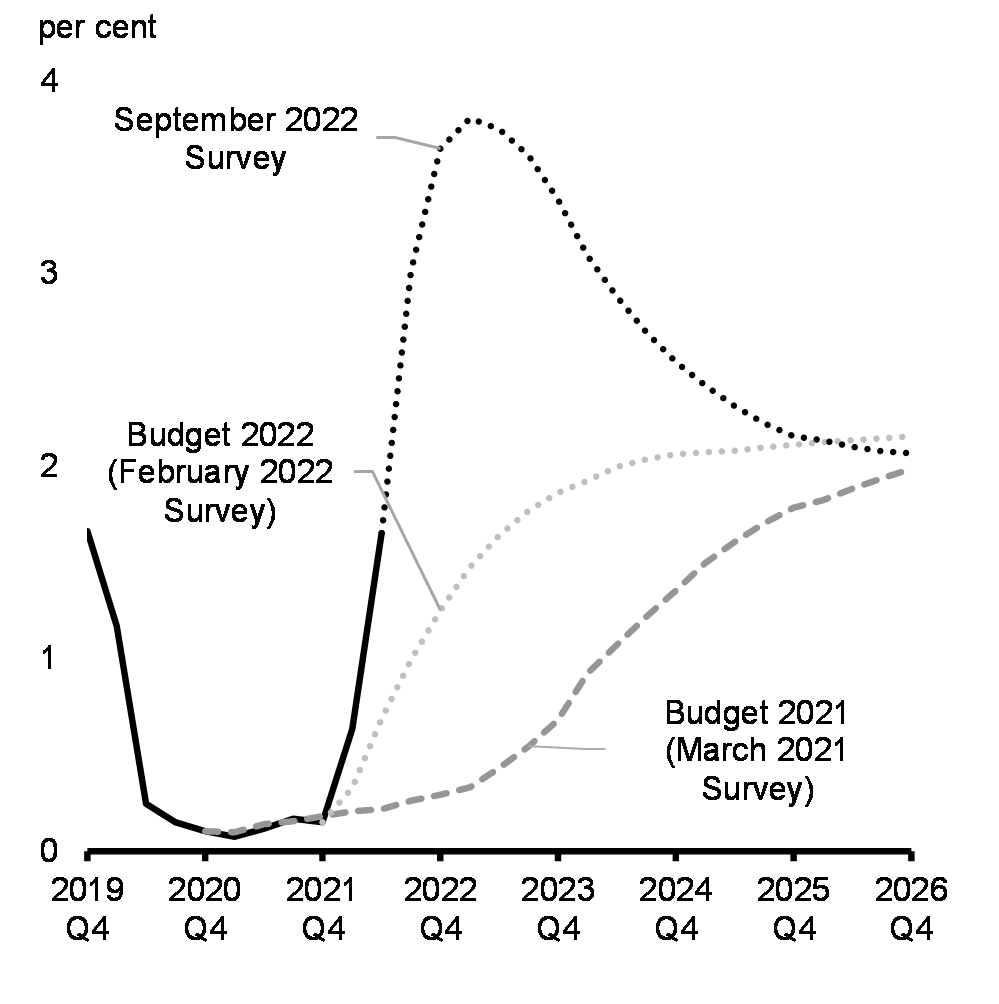
Persistent inflationary pressures have also led to a sharp increase in interest rates. At 3.0 per cent in the third quarter of 2022, short-term interest rates were roughly 200 basis point higher than expected by private sector economists in Budget 2022. Further ahead, private sector economists expected short-term interest rates to peak at 3.8 per cent in the first half of 2023 (Chart 1.18). This represents a substantial increase in the outlook for interest rates from that expected by private sector economists in Budget 2022.

Chart 1.17
Consumer Price Inflation Projections
Chart 1.17: Consumer    Price Inflation Projections

Notes: Dashed and dotted lines are projections. Solid lines are actual data.

Sources: Statistics Canada; Department of Finance Canada March 2021, February 2022 and September 2022 surveys of private sector economists; Department of Finance Canada calculations.

Text version
  Actual Budget 2021
(March 2021 Survey)
Budget 2022
(February 2022 Survey)
September 2022 Survey
2019
Q4
2.1      
2020
Q1
1.7      
2020
Q2
0.1      
2020
Q3
0.4      
2020
Q4
0.7 0.8    
2021
Q1
1.4 1.6    
2021
Q2
3.3 2.8    
2021
Q3
4.1 2.4    
2021
Q4
4.7 2.1 4.7  
2022
Q1
5.8 2.0 5.0  
2022
Q2
7.4 2.0 4.3 7.4
2022
Q3
  2.1 3.5 7.3
2022
Q4
  2.1 2.8 6.7
2023
Q1
  2.0 2.5 5.5
2023
Q2
  2.0 2.4 3.4
2023
Q3
  2.1 2.3 2.7
2023
Q4
  2.1 2.3 2.5
2024
Q1
  2.0 2.1 2.3
2024
Q2
  2.1 2.2 2.1
2024
Q3
  2.1 2.2 2.0
2024
Q4
  2.1 2.1 2.0
2025
Q1
  2.1 2.1 2.1
2025
Q2
  2.1 2.1 2.1
2025
Q3
  2.1 2.1 2.1
2025
Q4
  2.1 2.1 2.1
2026
Q1
  2.1 2.1 2.1
2026
Q2
  2.1 2.0 2.1
2026
Q3
  2.0 2.0 2.1
2026
Q4
  2.0 2.0 2.1
Chart 1.18
Short-Term Interest Rate Projections
Chart 1.18: Short-Term    Interest Rate Projections

Notes: Dashed and dotted lines are projections. Solid lines are actual data.

Sources: Statistics Canada; Department of Finance Canada March 2021, February 2022 and September 2022 surveys of private sector economists; Department of Finance Canada calculations.

Text version
  Actual Budget 2021
(March 2021 Survey)
Budget 2022
(February 2022 Survey)
September 2022 Survey
2019
Q4
1.7      
2020
Q1
1.2      
2020
Q2
0.2      
2020
Q3
0.2      
2020
Q4
0.1 0.1    
2021
Q1
0.1 0.1    
2021
Q2
0.1 0.1    
2021
Q3
0.2 0.2    
2021
Q4
0.1 0.2 0.1  
2022
Q1
0.6 0.2 0.3  
2022
Q2
1.7 0.2 0.7 1.7
2022
Q3
  0.3 1.0 3.0
2022
Q4
  0.3 1.3 3.7
2023
Q1
  0.3 1.5 3.8
2023
Q2
  0.4 1.6 3.8
2023
Q3
  0.5 1.8 3.6
2023
Q4
  0.7 1.9 3.4
2024
Q1
  0.9 1.9 3.1
2024
Q2
  1.1 2.0 2.9
2024
Q3
  1.2 2.0 2.7
2024
Q4
  1.4 2.1 2.5
2025
Q1
  1.5 2.1 2.4
2025
Q2
  1.6 2.1 2.3
2025
Q3
  1.7 2.1 2.2
2025
Q4
  1.8 2.1 2.2
2026
Q1
  1.8 2.1 2.1
2026
Q2
  1.9 2.1 2.1
2026
Q3
  1.9 2.1 2.1
2026
Q4
  2.0 2.2 2.1

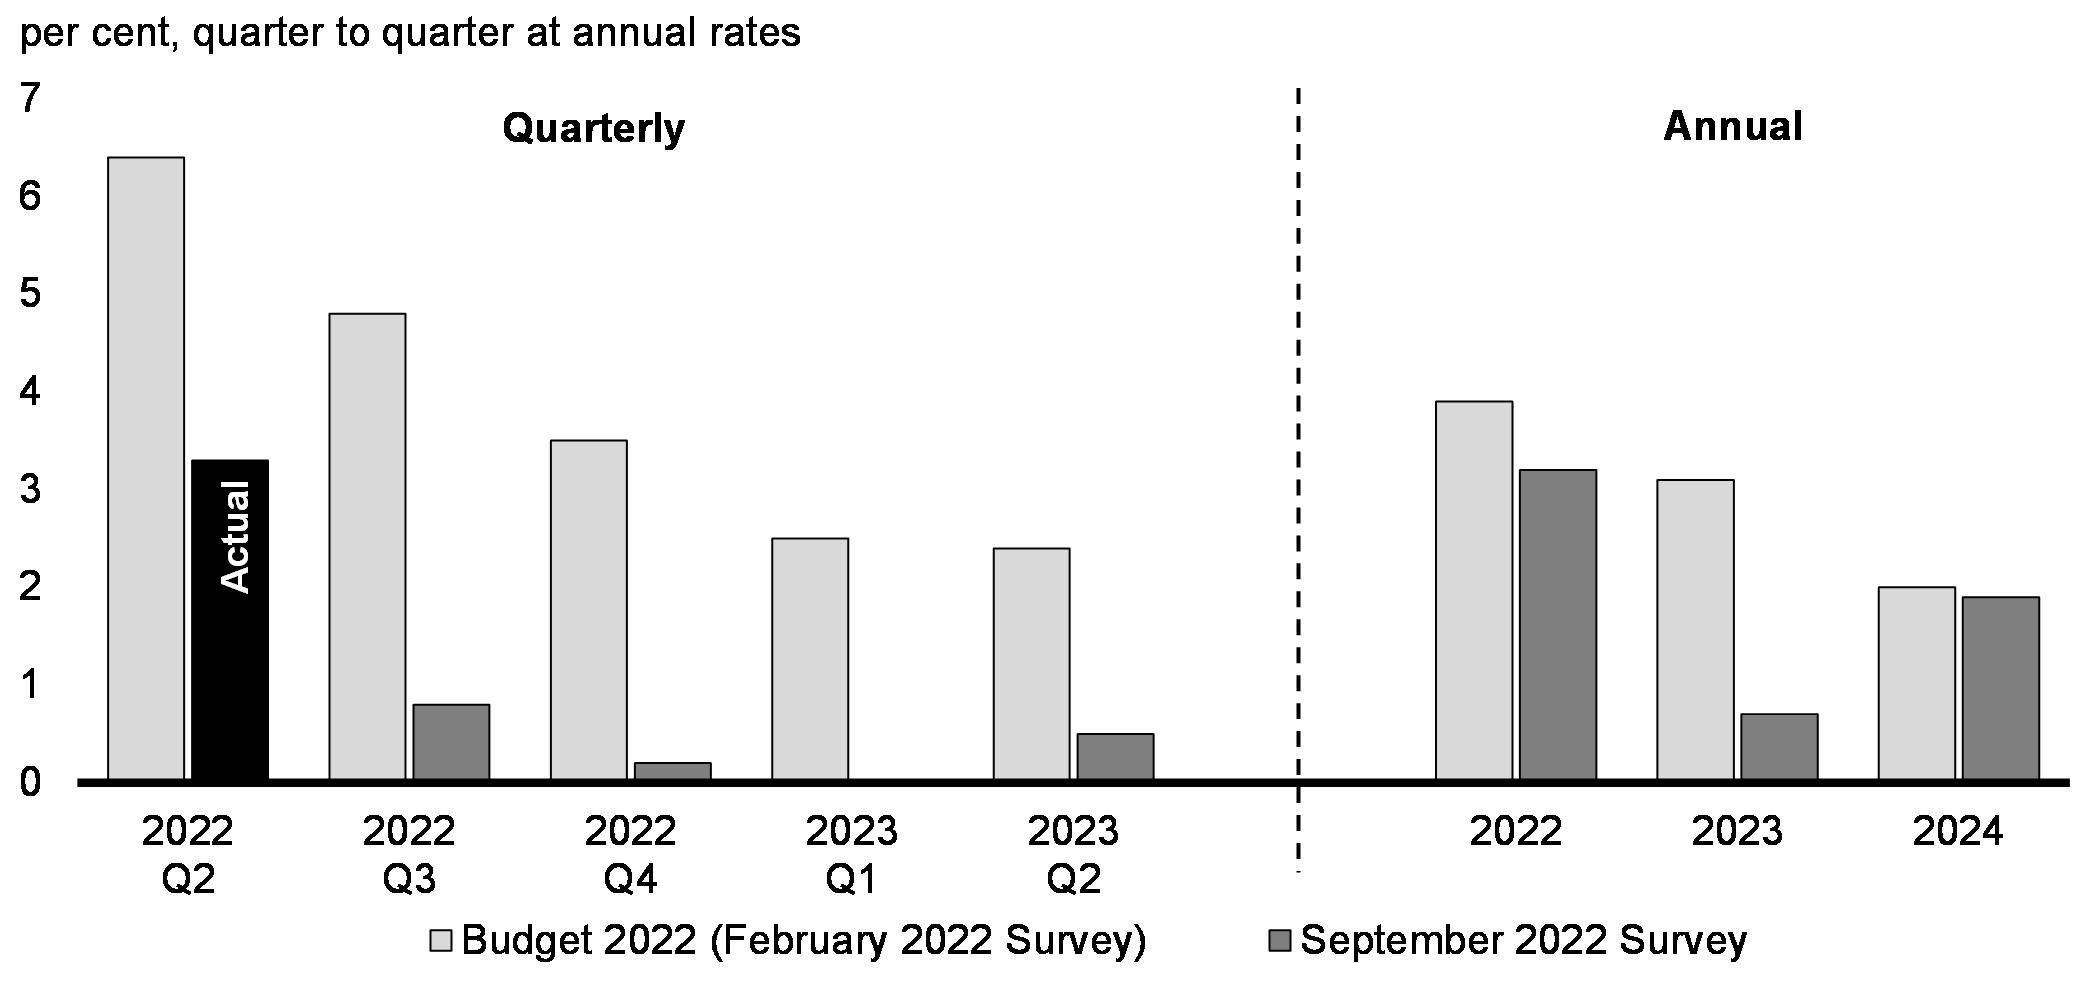
With higher inflation and interest rates, as well as slower economic growth in the United States and globally, private sector economists anticipated in their survey that Canada would see significantly weaker growth than anticipated in Budget 2022 (Chart1.19). Real GDP was projected to expand by a still strong 3.2 per cent in 2022 (from 3.9 per cent in Budget 2022) but growth was expected to slow to 0.7 per cent in 2023 (from 3.1 per cent). By the end of 2026, the level of real GDP was expected to remain about 2 per cent below Budget 2022 projections.

Overall, the September 2022 survey average indicates that the Canadian economy was expected to see a period of subdued growth. Real GDP growth was projected to be just above zero for the next several quarters. As a result, the unemployment rate was expected to increase from the current rate of 5.2 per cent to 6.3 per cent by the end of 2023—above Budget 2022 projections (5.5 per cent) but low by historical standards. The unemployment rate was then expected to decline to 5.7 per cent by the end of the forecast horizon.

Chart 1.19
Real GDP Growth Projections
Chart 1.19: Real GDP Growth Projections

Sources: Statistics Canada; Department of Finance Canada February 2022 and September 2022 surveys of private sector economists; Department of Finance Canada calculations.

Text version
  Budget 2022 (February 2022 Survey) September 2022 Survey
2022
Q1
1.0 3.1
2022
Q2
6.4 3.3
2022
Q3
4.8 0.8
2022
Q4
3.5 0.2
2023
Q1
2.5 0.0
2023
Q2
2.4 0.5
     
2022 3.9 3.2
2023 3.1 0.7
2024 2.0 1.9

Despite lower growth prospects since Budget 2022, the Canadian economy has seen a significant boost to national income from higher commodity prices following Russia’s illegal invasion of Ukraine. Higher prices for a range of commodities that Canada exports pushed up our terms of trade (the ratio of export prices to import prices) to an all-time high in the second quarter of 2022 (Chart 1.20). Higher export prices have, in turn, boosted the revenues of Canadian exporters, corporate profits, and GDP inflation (a measure of price changes for all of the goods and services produced in the economy). These trends have been widespread across sectors and regions of Canada, supporting revenues of all orders of government, including provinces and territories.

As a result, the projected level of nominal GDP (the broadest measure of the tax base) in the September survey is $94 billion above Budget 2022 expectations for 2022 (Chart 1.21). However, with a reduced outlook for real GDP growth in 2023, the boost to nominal GDP was expected to partly unwind next year, leaving the projected level of nominal GDP up by an average of $54 billion per year over the entire forecast horizon relative to Budget 2022 projections.

Chart 1.20
Terms of Trade and Commodity Prices
Chart 1.20: Terms of Trade and Commodity Prices

Note: Last data point is 2022Q3.

Sources: Statistics Canada; Bank of Canada.

Text version
  Commodity price index (left) Terms of trade (right)
2007
Q1
85.35837 96.8
2007
Q2
91.95551 97.8
2007
Q3
90.59338 97.5
2007
Q4
99.11997 101.2
2008
Q1
110.9731 105.2
2008
Q2
133.2333 107.4
2008
Q3
123.5032 104.5
2008
Q4
75.674 93.6
2009
Q1
64.09998 89.9
2009
Q2
73.18583 91.5
2009
Q3
76.04236 94.1
2009
Q4
84.50603 97.6
2010
Q1
90.67404 99.4
2010
Q2
89.06025 97.8
2010
Q3
86.75652 96.7
2010
Q4
94.37162 99.1
2011
Q1
104.5314 101.6
2011
Q2
111.4764 102.3
2011
Q3
105.4337 100.9
2011
Q4
103.2902 101.3
2012
Q1
103.8248 100.8
2012
Q2
99.06028 98.5
2012
Q3
99.77172 99.4
2012
Q4
97.34324 101.3
2013
Q1
99.35174 101.4
2013
Q2
100.5875 101
2013
Q3
102.9509 100.7
2013
Q4
96.06178 99.5
2014
Q1
101.4748 101.5
2014
Q2
104.7852 100
2014
Q3
100.2444 99.4
2014
Q4
84.04464 96.2
2015
Q1
64.45167 93.4
2015
Q2
70.08246 93.6
2015
Q3
59.98672 91.6
2015
Q4
54.91196 90.5
2016
Q1
49.09402 88.8
2016
Q2
58.8897 91
2016
Q3
58.5278 91.9
2016
Q4
60.61266 93.3
2017
Q1
64.62644 94.9
2017
Q2
64.54524 93.6
2017
Q3
65.30185 94
2017
Q4
68.58913 95.8
2018
Q1
71.47309 95.9
2018
Q2
78.15895 96.8
2018
Q3
73.67142 95.9
2018
Q4
63.50307 91.1
2019
Q1
69.31079 94.1
2019
Q2
71.14721 94.6
2019
Q3
68.92684 93.7
2019
Q4
67.29261 94.4
2020
Q1
59.35002 89.8
2020
Q2
49.0096 87.1
2020
Q3
64.43392 92.6
2020
Q4
67.39908 94.9
2021
Q1
84.00001 101
2021
Q2
95.85367 105.7
2021
Q3
96.41884 104
2021
Q4
103.5403 105.2
2022
Q1
125.8796 109.9
2022
Q2
137.1476 115.4
2022
Q3
116.6232
Chart 1.21
Nominal GDP Projections
Chart 1.21: Nominal GDP Projections

Sources: Statistics Canada; Department of Finance Canada December 2019, February 2022 and September 2022 surveys of private sector economists; Department of Finance Canada calculations.

Text version
  Pre-pandemic track Budget 2022
(February 2022 Survey)
September 2022 Survey
2021
Q4
107.5 110.9 110.9
2022
Q1
108.4 111.9 115.0
2022
Q2
109.5 114.1 119.8
2022
Q3
110.5 115.8 119.8
2022
Q4
111.5 117.2 120.3
2023
Q1
112.6 118.5 120.7
2023
Q2
113.7 119.8 121.4
2023
Q3
114.7 120.9 122.1
2023
Q4
115.8 121.9 123.1
2024
Q1
116.9 123.2 124.4
2024
Q2
118.0 124.4 125.7
2024
Q3
119.1 125.6 127.1
2024
Q4
120.2 126.8 128.3
2025
Q1
121.4 127.9 129.7
2025
Q2
122.6 129.1 131.0
2025
Q3
123.7 130.3 132.4
2025
Q4
124.9 131.5 133.7
2026
Q1
126.1 132.7 135.1
2026
Q2
127.3 133.9 136.4
2026
Q3
128.5 135.1 137.8
2026
Q4
129.7 136.4 139.1

Increasing Probability of a More Pronounced Slowdown

At the time of the September 2022 survey, most private sector economists continued to expect that Canada would avoid a “hard landing”—that is, inflation will moderate without a recession. This growth outlook is subject to significant downside risks. Primarily, this relates to the path of inflation. How quickly inflation moderates will determine how high interest rates will rise and how long they remain elevated, and therefore how sharply global activity will cool. A more pronounced slowdown, both in Canada and globally, is possible if high inflation becomes more deeply entrenched.

Even without a further upward drift in inflation, several factors are contributing to the risk of an unexpectedly steep downturn in global activity:

In addition, since the survey was conducted in early September, global economic and financial conditions have continued to deteriorate. At the time of the survey, forecasters attached a roughly 40 per cent probability to a recession in 2023. Since then, the U.S. Federal Reserve’s more aggressive posture on inflation has led to a substantial shift in sentiment that has caused widespread volatility in financial markets. There have also been further signs that the global economy is slowing more quickly than anticipated. All of this suggests that since the survey was completed, the trajectory of the global economy has led to increasing uncertainty about how much growth in Canada will slow.

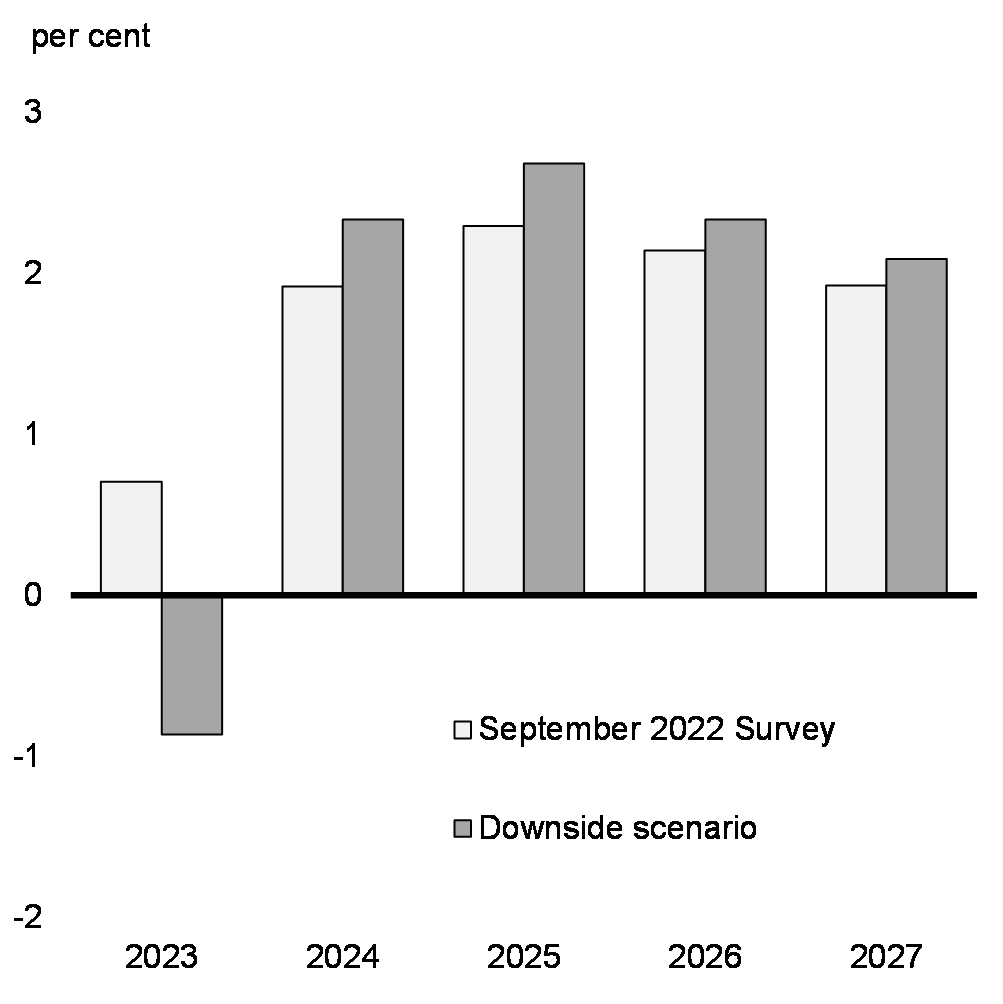
Overall, the macroeconomic inputs of the September survey continue to provide a reasonable basis for economic and fiscal planning (see Annex 1 for details of the economic and fiscal projections). However, in light of recent developments and the significant downside risks to the near-term growth outlook, the Department of Finance has developed a downside scenario that considers the impact of more persistent inflationary pressures and further tightening in monetary policy, leading to a “hard landing” in the economy. In this scenario, elevated inflation becomes more deeply entrenched, particularly in the U.S., leading central banks to raise interest rates by more than anticipated to return inflation to target. This increases long-term interest rates and leads to a significant tightening in global financial conditions. Tighter financial conditions result in more adverse effects on confidence, wealth and activity, resulting in a sharper correction in housing markets and consumer activity in Canada, as well as larger spillovers from tightening and weaker economic activity in other countries.

In the downside scenario, CPI inflation is 1.8 percentage points above the September 2022 survey in 2023, and stays above 3 per cent until the first quarter of 2024—about six months longer than in the survey—before reaching 2 per cent by the end of 2024. In response, short-term interest rates reach 4.5 per cent in the first half of 2023 and are up by 0.7 percentage points over the entire forecast horizon. As a result, Canada enters a mild recession in the first quarter of 2023. Real GDP contracts by 1.6 per cent from peak to trough, well below the 4.4-per-cent contraction in 2008-09. Similarly, the unemployment rate rises 1.7 percentage points to 6.9 per cent in the second half of 2023, far lower than the peak of 8.7 per cent experienced following the 2008-09 contraction. For 2023 as a whole, real GDP declines by 0.9 per cent and the unemployment rate is 0.5 percentage point above the survey. At the same time, weaker global demand weighs on commodity prices, with oil prices US$8 per barrel below the survey in 2023. Despite higher CPI inflation, lower commodity prices lead to lower GDP inflation and, combined with slower growth, result in a level of nominal GDP that is $45 billion lower than the survey, on average.

Chart 1.22
Real GDP Growth
Chart 1.22: Real    GDP Growth

Sources: Statistics Canada; Department of Finance Canada September 2022 survey of private sector economists; Department of Finance Canada calculations.

Text version
  September 2022 Survey Downside scenario
2023 0.7 -0.9
2024 1.9 2.3
2025 2.3 2.7
2026 2.1 2.3
2027 1.9 2.1
Chart 1.23
Nominal GDP Level Difference Between the Downside Scenario and the September 2022 Survey
Chart 1.23: Nominal    GDP Level Difference Between the Downside Scenario and the September 2022    Survey

Sources: Statistics Canada; Department of Finance Canada September 2022 survey of private sector economists; Department of Finance Canada calculations.

Text version
  Downside scenario
2023 -67
2024 -53
2025 -45
2026 -41
2027 -38

1.3 Investing to Expand the Supply Capacity of the Economy

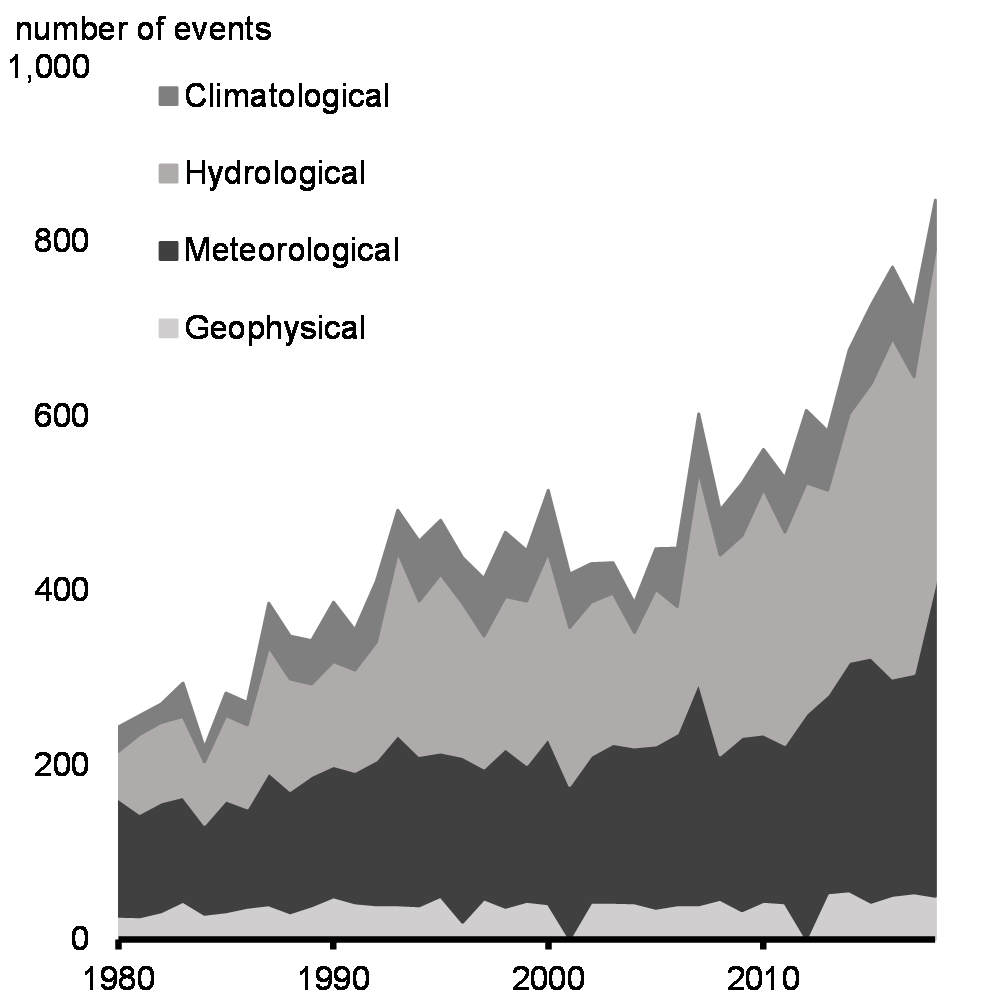
Recent events have demonstrated how sensitive the global economy can be to sudden changes in supply. While these disruptions are the outcomes of an extreme set of circumstances, moving forward, the global economy is likely to be shaped by trends that will create a drag on productive capacity and increase the frequency of supply chain disruptions.

Climate change will increase the frequency of extreme weather and natural disasters (Chart 1.24). Rising geopolitical tensions have the potential to lead to more frequent disruption of trading relationships and more volatile prices for commodities.

Domestically, population aging will make it harder for businesses to recruit workers. While harnessing demand for Canadian products and expertise in a net-zero world will create jobs and build a competitive Canadian economy, careful work must be done to support workers and businesses during this transition.

There is uncertainty about how each of these trends will unfold, but they all point to supply remaining an important constraint over the longer term.

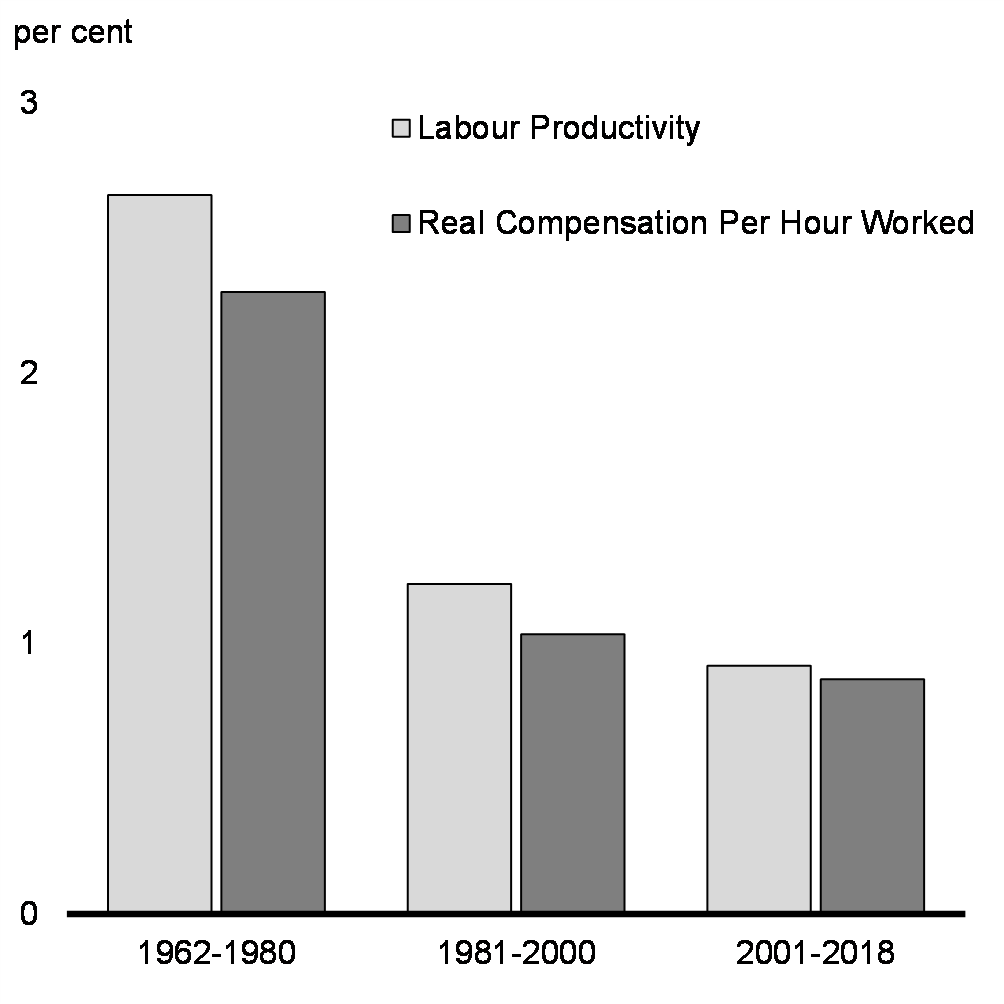
In the long run, Canadians’ ongoing prosperity and quality of life will depend on expanding the supply capacity of the economy to achieve robust growth. To do this, we will have to grow our workforce, ensure that workers have the skills they need for a changing global economy, and invest in helping businesses grow and create good jobs for Canadians. (Chart 1.25).

Chart 1.24
Rising Natural Disaster Events Worldwide
Chart 1.24: Rising Natural Disaster Events Worldwide

Note: Last data point is 2018.

Sources: NatCat Service; Department of Finance Canada calculations.

Text versionThe chart shows the number of natural loss events worldwide for each year, starting from 1980 until 2018. The events are sorted by four categories (1) climatological, (2) hydrological, (3) meteorological, and (4) geophysical. The number of events from the categories are layered on top of each other in the order of (1) to (4). The number of natural loss events has been increasing since 1980 with the rate of increase accelerating since late 2000s, with hydrological events accounting for the largest share of the increase.
Chart 1.25
Canadian Labour Productivity and Real Labour Compensation Rate Growth
Chart 1.25: Canadian Labour Productivity and Real Labour    Compensation Rate Growth

Notes: Labour productivity is real GDP per hour worked for the total economy. Total labour compensation includes wages and other forms of compensation. Nominal compensation is converted into real terms using the GDP deflator. Last observation is 2018.

Sources: Statistics Canada; Department of Finance Canada calculations.

Text version
  Labour Productivity Real Compensation Per Hour Worked
1962-1980 2.66 2.30
1981-2000 1.22 1.04
2001-2018 0.92 0.87

Canada Must Boost Investment

Canada faces the future with many strengths—a highly educated population, a way of life and society that attracts people from around the world, and abundant natural resources. But Canada will require capital to finance the enormous investments needed to meet the challenges ahead.

In Canada, the transition to a net-zero economy will require significant investment from both governments and the private sector. Investments will also be needed to limit strategic vulnerabilities in supply chains. Smart investments in areas like critical minerals, energy, agriculture, and electric vehicles are needed to help make Canada a leader in the clean and digital technologies that the world counts on. Likewise, education, training, and skills development will be crucial to ensure that Canadians thrive in a changing economy. In light of the U.S. Inflation Reduction Act, significant steps will need to be taken to ensure that Canada remains competitive in North America and the world.

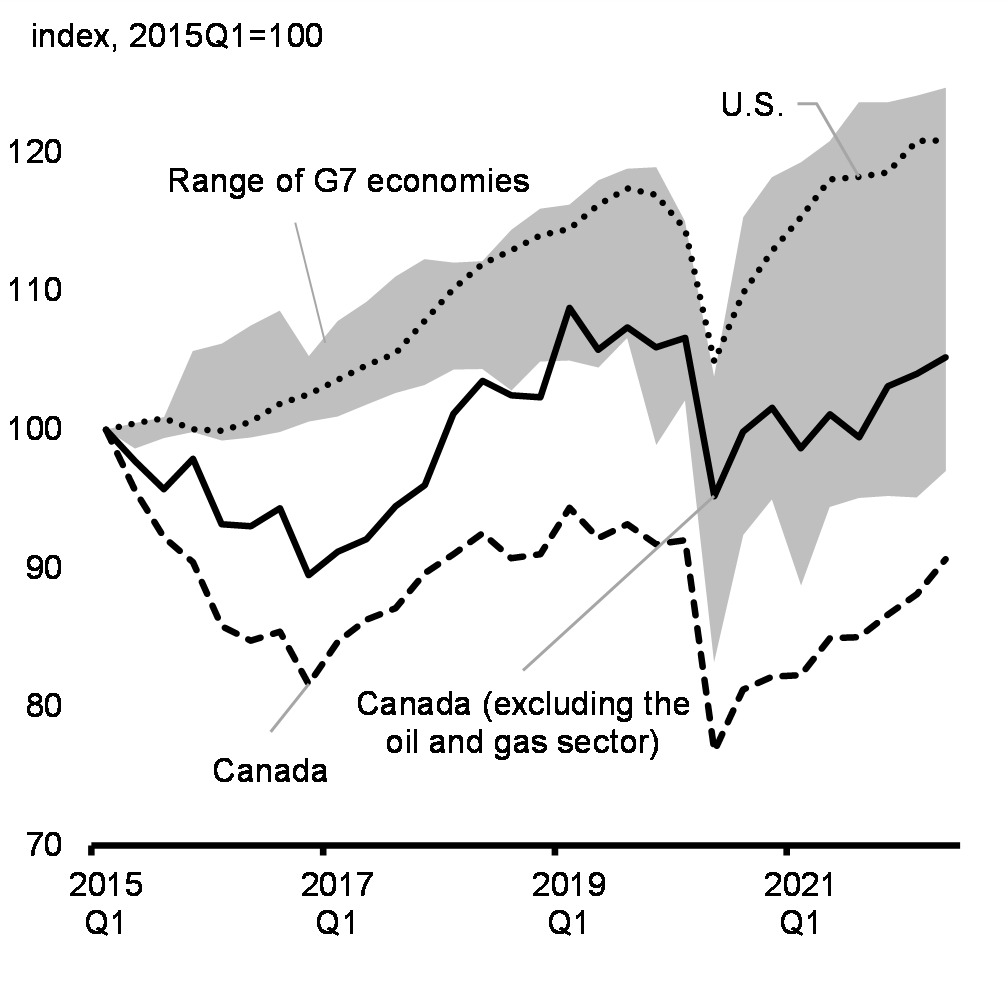
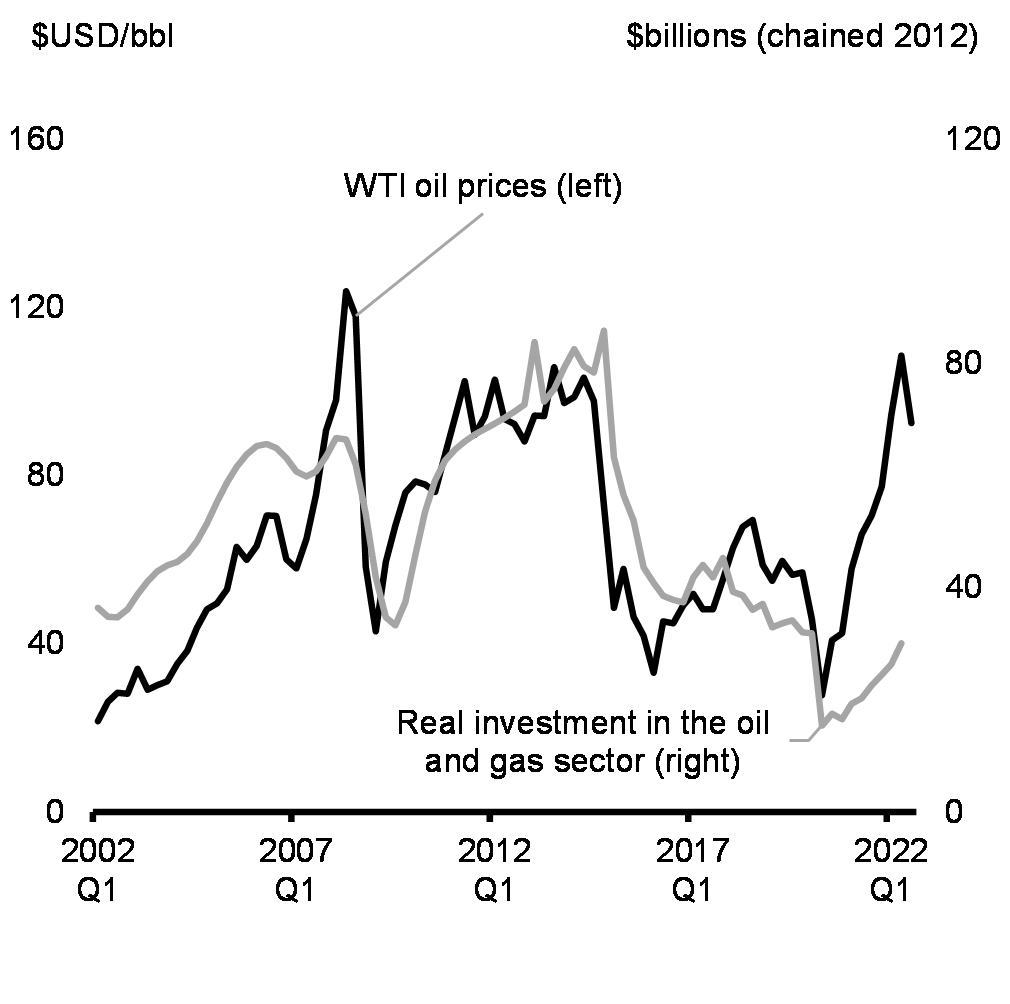
In the past, strong investment in the oil and gas sector compensated for weakness in other segments of the economy. As the world moves towards net-zero, global investment growth in that sector has declined, and the historical weakness of business investment in Canada has become more apparent (Chart 1.26). Canadian firms have invested in information and communication technology (ICT) at only half the rate of their U.S. counterparts. Likewise, research and development intensity has steadily fallen over the last two decades, to a level roughly one third that of the U.S. These types of investments drive productivity growth and are essential for equipping Canadian workers to succeed in the economy of the future. While some new investments have been made by leading businesses across the Canadian economy in the past 12 months, investment remains 1.2 per cent below its pre-pandemic level. Notably, investment in the oil and gas sector remains muted despite the sharp rise in oil prices following the illegal Russian invasion of Ukraine (Chart 1.27). This weakness in business investment has also been reflected in the performance of foreign direct investment (FDI) in new capital projects, the types of so-called greenfield investments that contribute to Canada’s productive capacity. Reversing this historical trend is an urgent priority for the government, as evidenced by significant investments in Budget 2022 and in the 2022 Fall Economic Statement.

Chart 1.26
Real Business Investment Since 2015 in Canada, the United States and G7 Economies
Chart 1.26: Real    Business Investment Since 2015 in Canada, the United States and G7 Economies

Notes: The G7 range excludes Italy due to data comparability issues. Last data point is 2022Q2.

Sources: Statistics Canada; Haver Analytics; Office for National Statistics; German Federal Statistical Office. Department of Finance Canada calculations.

Text version
  Can Can - Ex O&G U.S. Minimum G7 Maximum G7
2015Q1 100 100 100 100 100
2015Q2 95.589258 97.707525 100.45594 98.637999 100.45594
2015Q3 92.241565 95.703656 100.82069 99.40181 101.41003
2015Q4 90.419984 97.889528 100.00829 99.811429 104.88017
2016Q1 85.825494 93.181092 99.908812 99.221975 106.02166
2016Q2 84.788214 93.02996 100.55956 99.426983 105.98001
2016Q3 85.416482 94.317846 101.8735 99.828323 107.69318
2016Q4 81.654543 89.504771 102.52839 100.57165 104.58927
2017Q1 84.704659 91.191716 103.5812 100.94148 107.82722
2017Q2 86.292373 92.101234 104.64644 101.7953 109.21925
2017Q3 87.122449 94.466432 105.47957 102.63405 111.01271
2017Q4 89.645707 95.989911 107.83387 103.21575 112.30131
2018Q1 91.003858 101.14315 110.15916 104.31795 112.03868
2018Q2 92.506556 103.49586 111.93733 104.35013 113.67137
2018Q3 90.702547 102.4711 112.93625 102.80117 114.41574
2018Q4 91.000773 102.31299 113.98491 104.91014 115.2217
2019Q1 94.355893 108.77867 114.48645 104.96493 116.23133
2019Q2 92.152287 105.76364 116.21487 104.47182 117.99264
2019Q3 93.168546 107.3804 117.38788 106.57897 118.79423
2019Q4 91.714667 105.93998 116.90293 98.881817 118.92694
2020Q1 92.020604 106.6251 114.42427 102.07245 114.42427
2020Q2 76.801675 95.204939 104.89099 83.222277 104.89099
2020Q3 81.232342 99.839687 109.83586 92.390111 115.06208
2020Q4 82.186919 101.5625 112.86579 94.966494 118.45141
2021Q1 82.292591 98.633843 115.28641 88.766895 120.23815
2021Q2 84.955406 101.11195 118.03449 94.408057 122.47892
2021Q3 85.035228 99.429453 118.22101 95.055612 123.61395
2021Q4 86.658653 103.123 118.5526 95.215875 123.60893
2022Q1 88.1312 104.0286 120.82401 95.0894 124.07195
2022Q2 90.636482 105.19 120.84473 97.009808 124.6322
Chart 1.27
Real Investment in the Oil and Gas Sector and Oil Prices
Chart 1.27: Real Investment in    the Oil and Gas Sector and Oil Prices

Note: Last data point is 2022Q2.

Sources: Statistics Canada; Bloomberg; Department of Finance Canada calculations.

Text version
  WTI (RHS) Capital expenditure in oil & gas industries
2002Q1 21.6 36.40655
2002Q2 26.3 34.81667
2002Q3 28.3 34.73881
2002Q4 28.2 36.17456
2003Q1 34.1 38.8076
2003Q2 29.1 41.2009
2003Q3 30.2 42.94375
2003Q4 31.2 44.00607
2004Q1 35.2 44.66285
2004Q2 38.3 46.01966
2004Q3 43.8 48.31675
2004Q4 48.3 51.51481
2005Q1 49.7 55.33311
2005Q2 53.0 58.77236
2005Q3 63.1 61.58672
2005Q4 60.0 63.78654
2006Q1 63.4 65.28292
2006Q2 70.5 65.69143
2006Q3 70.4 64.97332
2006Q4 60.1 63.1717
2007Q1 58.0 60.80019
2007Q2 65.0 59.8384
2007Q3 75.5 60.73479
2007Q4 90.8 63.40568
2008Q1 98.0 66.7028
2008Q2 124.0 66.50704
2008Q3 118.0 61.96855
2008Q4 58.3 53.19991
2009Q1 43.0 41.90489
2009Q2 59.5 34.75295
2009Q3 68.2 33.33432
2009Q4 76.1 37.53797
2010Q1 78.7 45.98008
2010Q2 77.9 53.58555
2010Q3 76.2 59.15151
2010Q4 85.1 62.72916
2011Q1 94.0 64.64794
2011Q2 102.6 66.08461
2011Q3 89.7 67.32699
2011Q4 94.0 68.37327
2012Q1 102.9 69.28075
2012Q2 93.5 70.27974
2012Q3 92.3 71.43095
2012Q4 88.2 72.73997
2013Q1 94.4 83.88105
2013Q2 94.2 73.25364
2013Q3 105.8 75.50452
2013Q4 97.3 79.25849
2014Q1 98.7 82.63516
2014Q2 103.3 79.56124
2014Q3 97.8 78.39323
2014Q4 73.0 85.85122
2015Q1 48.6 63.2373
2015Q2 57.8 56.60899
2015Q3 46.4 52.06986
2015Q4 42.0 43.6137
2016Q1 33.2 40.89421
2016Q2 45.4 38.59163
2016Q3 44.9 37.86902
2016Q4 49.1 37.44063
2017Q1 51.9 41.88339
2017Q2 48.3 44.14103
2017Q3 48.2 41.89149
2017Q4 55.4 45.32977
2018Q1 62.9 39.28573
2018Q2 67.9 38.70227
2018Q3 69.5 36.12219
2018Q4 58.8 37.11079
2019Q1 54.9 32.98781
2019Q2 59.8 33.69324
2019Q3 56.4 34.174
2019Q4 57.0 32.0453
2020Q1 45.8 31.86257
2020Q2 27.8 15.37122
2020Q3 40.9 17.53525
2020Q4 42.5 16.54725
2021Q1 57.8 19.35336
2021Q2 66.1 20.31621
2021Q3 70.6 22.66743
2021Q4 77.4 24.51702
2022Q1 94.4 26.36089
2022Q2 108.6 30.11679
2022Q3 92.6  

Strengthening Canada’s economic prospects will depend on the government continually working to attract skilled immigrants and increase labour force participation, continuing to invest in education and training, making productivity-improving investments in infrastructure, and creating the conditions for Canada to attract further investment—both domestic and international.

Government can play an important role in spurring these types of investments and growing Canada’s productive capacity, while also reducing emissions and fighting climate change. However, government actions must strike the right balance between promoting the investments needed for Canada’s long-term prosperity and ensuring that it does not amplify inflation in a way that would make it harder for Canadians to keep up with the cost of living.  Building on the measures from Budget 2022, the government will ensure that new investments are balanced and targeted to enhance Canada’s productive capacity,create good-paying jobs, and build an economy that works for everyone.

1.4 Fiscal Outlook

A Responsible Fiscal Plan

Since 2015, the government has demonstrated that it can responsibly support Canadians while also investing in people and the long-term capacity of Canada’s economy. As we emerge from the pandemic, the government is running a tighter fiscal ship. Canada has an enviable position amongst its peers, with the lowest net debt and deficit as a share of the economy in the G7. Given current economic conditions, continuing fiscal prudence will be important to ensure that inflation is not made worse or longer lasting, while also ensuring the government retains the fiscal capacity to provide targeted support to Canadians, if required.

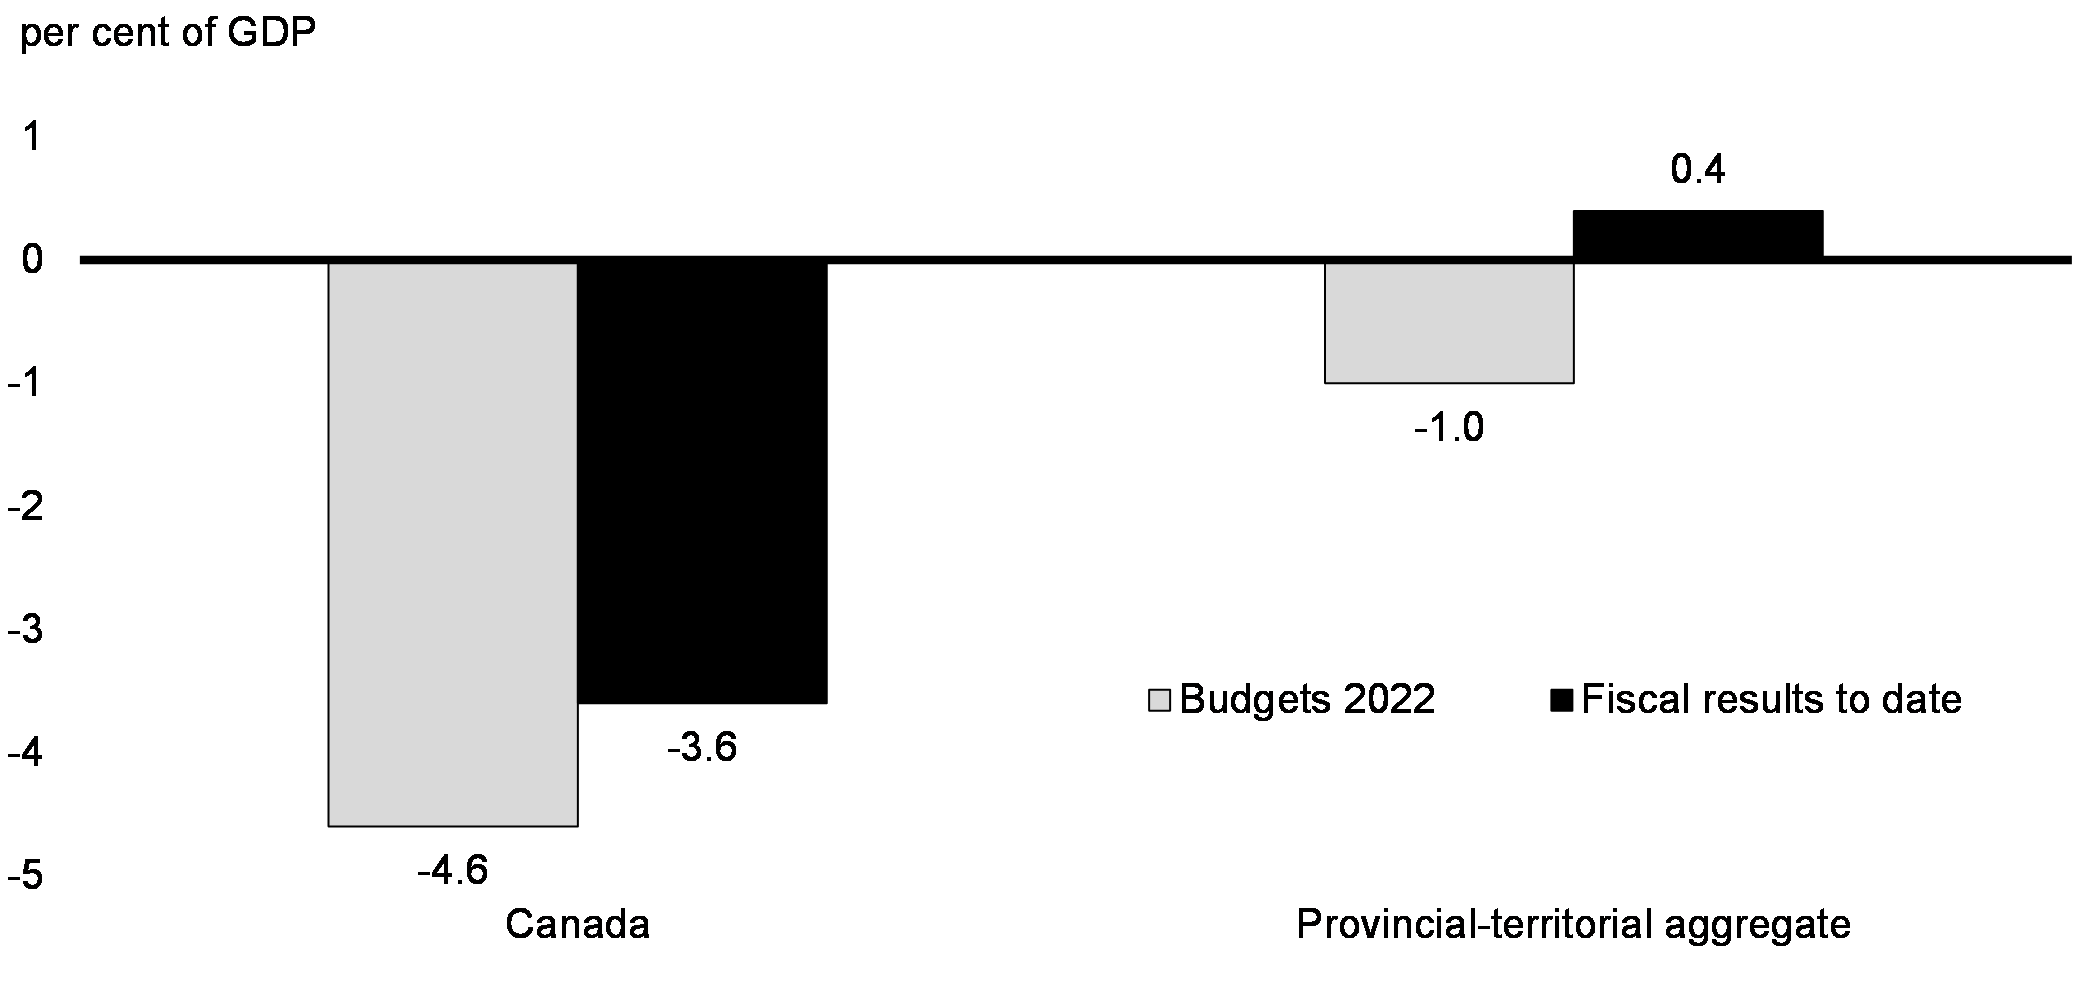
Provincial and territorial governments continue to significantly outperform fiscal projections. Fiscal results to date show that the aggregate provincial-territorial budgetary balances moved into a surplus position in 2021-22, as opposed to the 1 per cent of GDP deficit that had been expected at the time of 2022 budgets. The improvement in provincial-territorial budgets was in line with, but somewhat larger than, the better-than-expected result at the federal level of a deficit of 3.6 per cent of GDP (Chart 1.28). 

Chart 1.28
2021-22 Budgetary Balances
Chart 1.28: 2021-22 Budgetary Balances

Sources: Budget 2022 documents; Fiscal Reference Tables; Public Accounts of New Brunswick and Yukon.

Text version
  Budgets 2022 Fiscal results to date
Canada -4.6 -3.6
Provincial-territorial aggregate -1.0 0.4

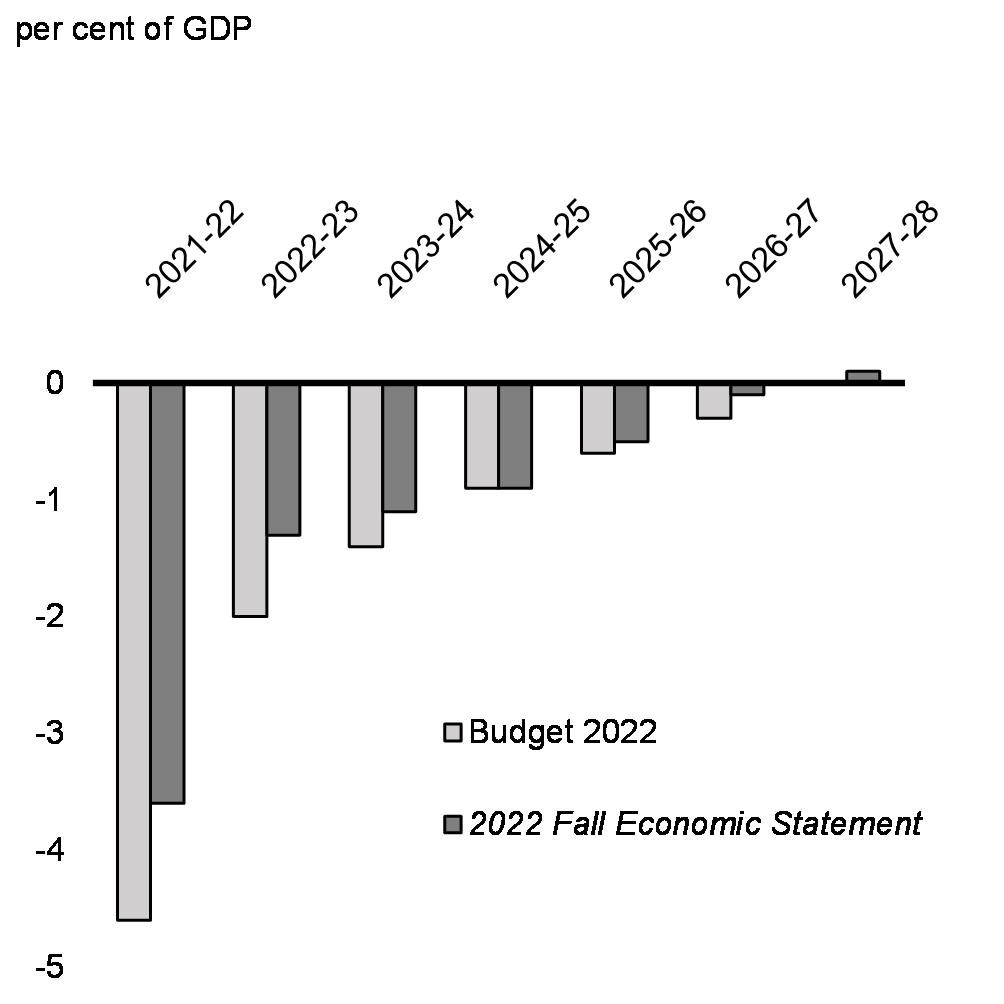
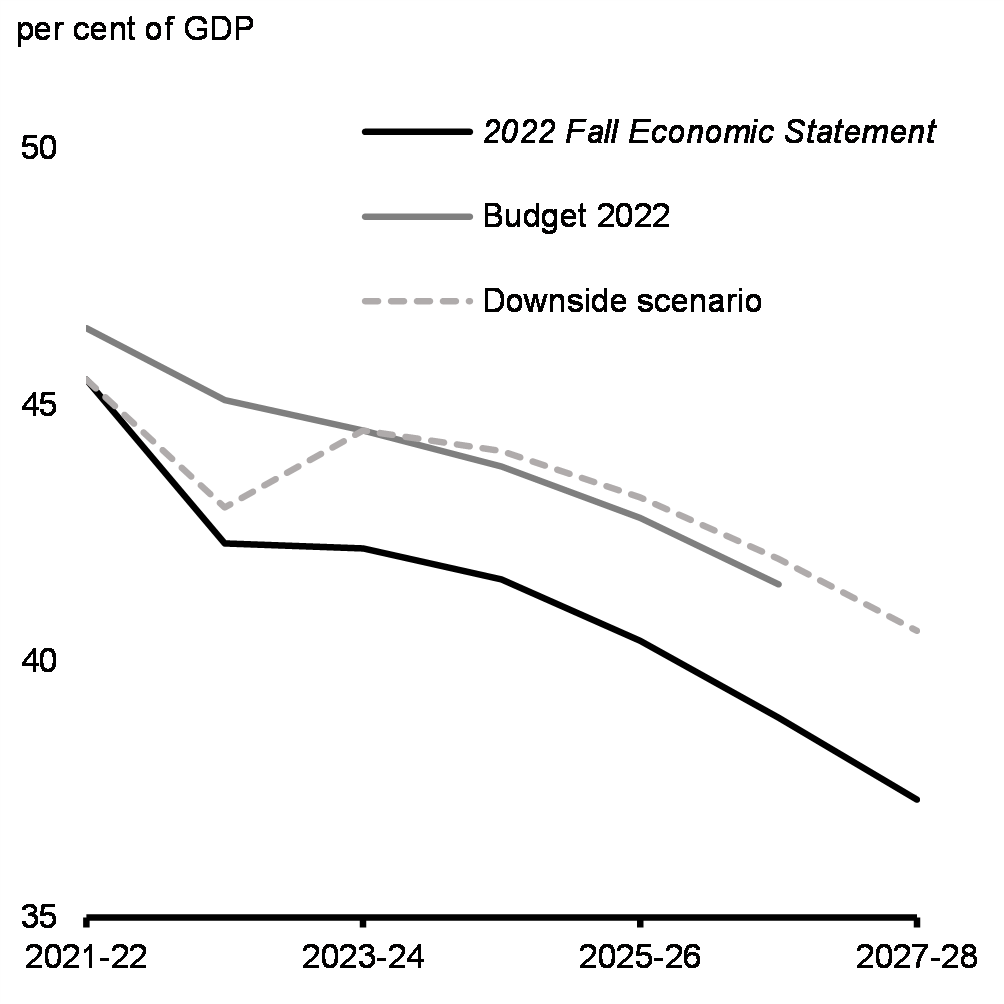
After accounting for better-than-expected fiscal results, measures in the 2022 Fall Economic Statement and other new policy actions since Budget 2022, and incorporating the results of the September 2022 survey of private sector economists, the budgetary balance is expected to remain below the $52.8 billion deficit projected in Budget 2022, with a $36.4 billion expected deficit in 2022-23, about -1.3 per cent of GDP, improving to a $4.5 billion surplus in 2027-28, or about 0.1 per cent of GDP (Table 1). Looking out over the next five years, the federal deficit (Chart 1.29) and federal debt (Chart 1.30) as a share of the economy are projected to be reduced each year and remain well below the Budget 2022 forecast.

The responsible approach outlined in this chapter builds on the plan outlined in Budget 2022 to ensure that the federal government can respond to the challenges that may face Canadians in the coming year—both those that are anticipated and those that remain unknown. The federal government made use of its accumulated fiscal firepower during the global pandemic to help Canadians stay safe and avoid many of the devastating consequences we witnessed elsewhere in the world. In the face of economic headwinds, Canadians should have the confidence that the government is able to deliver timely and effective support to families and communities, and build an economy that works for everyone. 

By maintaining our fiscal firepower, the government is ensuring that it will have the capacity to act if needed. That capacity to act in the near future, when combined with the measures introduced elsewhere in the 2022 Fall Economic Statement to help with affordability challenges, is at the heart of the government’s commitment to stand in support of all Canadians as we face the challenges of this unprecedented time together.

Table 1
Economic and Fiscal Developments, Policy Actions and Measures
billions of dollars
  Projection
2021–
2022
2022–
2023
2023–
2024
2024–
2025
2025–
2026
2026–
2027
2027–
2028
Budgetary balance – Budget 2022 -113.8 -52.8 -39.9 -27.8 -18.6 -8.4  
Impact of September private sector survey and other fiscal developments 23.6 29.8 18.8 11.0 10.2 11.4  
Budgetary balance before policy actions and measures -90.2 -23.0 -21.1 -16.8 -8.4 3.0 12.8
Policy actions since Budget 2022   -7.3 -4.3 -2.9 -1.8 -1.8 -3.5
2022 Fall Economic Statement measures (by chapter)
Making Life More Affordable
  -4.4 -1.3 -1.3 -1.3 -1.4 -1.4
Jobs, Growth, and an Economy That Works for Everyone
  -0.1 -2.1 -2.3 -1.8 -2.3 -2.4
Fair and Effective Government
  -0.6 -0.8 -0.2 0.4 0.5 0.6
Provision for anticipated near-term pressures1
  -1.0 -1.0 -2.0 -1.5 -1.5 -1.5
Total – 2022 Fall Economic Statement measures   -6.1 -5.2 -5.8 -4.2 -4.6 -4.7
Budgetary Balance – Baseline Scenario -90.2 -36.4 -30.6 -25.4 -14.5 -3.4 4.5
Fiscal impact of downside economic scenario   -12.7 -21.8 -16.8 -15.9 -15.3 -12.8
Budgetary Balance – Downside Scenario -90.2 -49.1 -52.4 -42.3 -30.4 -18.6 -8.3
Baseline Scenario
Budgetary Balance (per cent of GDP) -3.6 -1.3 -1.1 -0.9 -0.5 -0.1 0.1
Federal Debt (per cent of GDP) 45.5 42.3 42.2 41.6 40.4 38.9 37.3
Downside Scenario
Budgetary Balance (per cent of GDP) -3.6 -1.8 -1.9 -1.5 -1.0 -0.6 -0.3
Federal Debt (per cent of GDP) 45.5 43.0 44.5 44.1 43.2 42.0 40.6
Budget 2022 Projections
Budgetary Balance (per cent of GDP) -4.6 -2.0 -1.4 -0.9 -0.6 -0.3  
Federal Debt (per cent of GDP) 46.5 45.1 44.5 43.8 42.8 41.5  

Note: Totals may not add due to rounding.

1 Provision of $8.5 billion over six years, for pressures that are expected to materialize in the near term.

Chart 1.29
Budgetary Balance
Chart 1.29: Budgetary    Balance

Note: Budget 2022 forecast ended in 2026-27.

Source: Department of Finance Canada.

Text version
2021-22 2022-23 2023-24 2024-25 2025-26 2026-27 2027-28
2022 Fall Economic Statement -3.6 -1.3 -1.1 -0.9 -0.5 -0.1 0.1
Budget 2022 -4.6 -2 -1.4 -0.9 -0.6 -0.3
Chart 1.30
Federal Debt
Chart 1.30: Federal Debt

Note: Budget 2022 forecast ended in 2026-27.

Source: Department of Finance Canada.

Text version
2021-22 2022-23 2023-24 2024-25 2025-26 2026-27 2027-28
2022 Fall Economic Statement 45.5 42.3 42.2 41.6 40.4 38.9 37.3
Budget 2022 46.5 45.1 44.5 43.8 42.8 41.5
Downside scenario 45.5 43 44.5 44.1 43.2 42 40.6

Downside Scenario

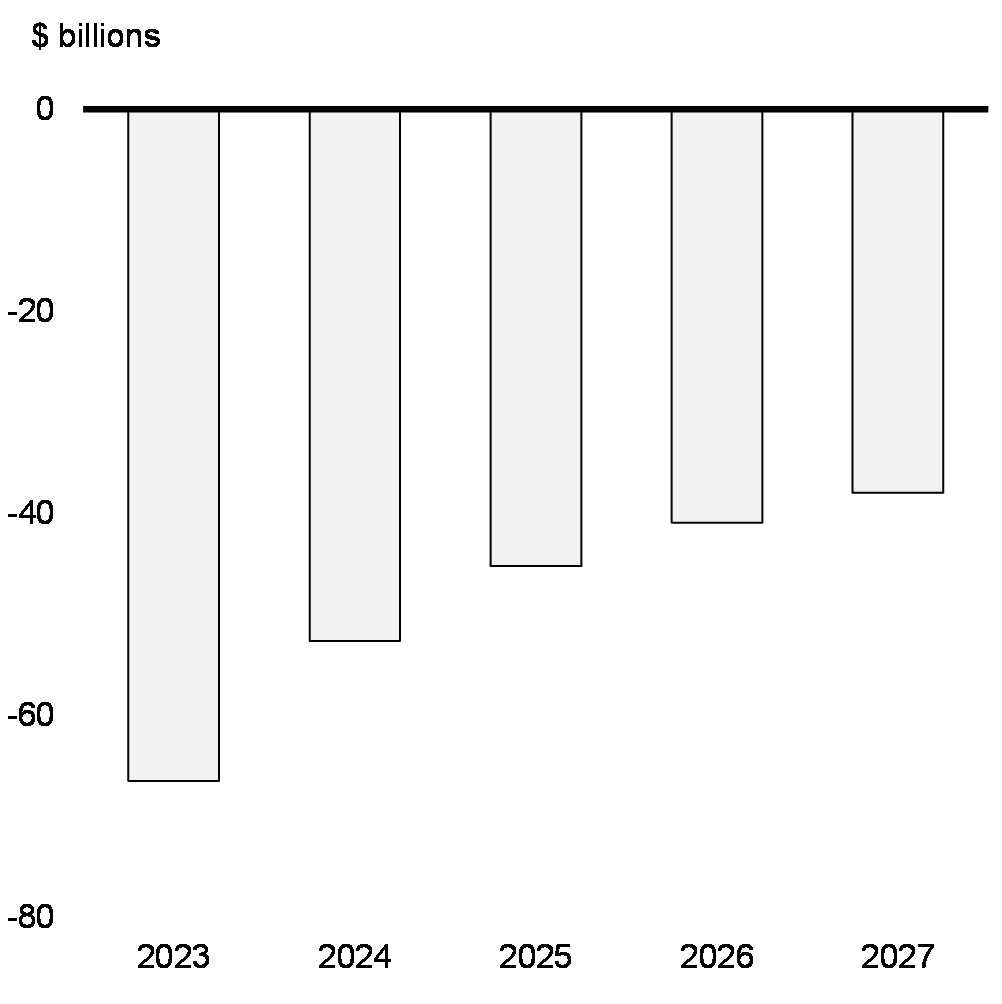
In the downside scenario (as presented in Section 1.2), the budgetary balance would deteriorate by an average of approximately $16 billion per year and add 3.3 percentage points to the federal debt-to-GDP ratio by 2027-28 (Chart 1.30). The higher deficits under the downside scenario are driven by:

That said, even under the downside scenario, the federal debt-to-GDP ratio would still be on a downward trend over the medium term and be lower in 2027-28 than it is today. Details of the government’s fiscal outlook and the fiscal impact of the downside scenario can be found in Annex 1.

The Fiscal Anchor

The federal government’s fiscal anchor—the unwinding of COVID-19-related deficits and reducing the federal debt-to-GDP ratio over the medium term—remains unchanged and is being acted upon.

This fiscal anchor is helping and will continue to help ensure Canada’s low-debt advantage and enviable credit ratings are preserved, and that future generations have the fiscal capacity necessary to respond to the challenges they will face. 

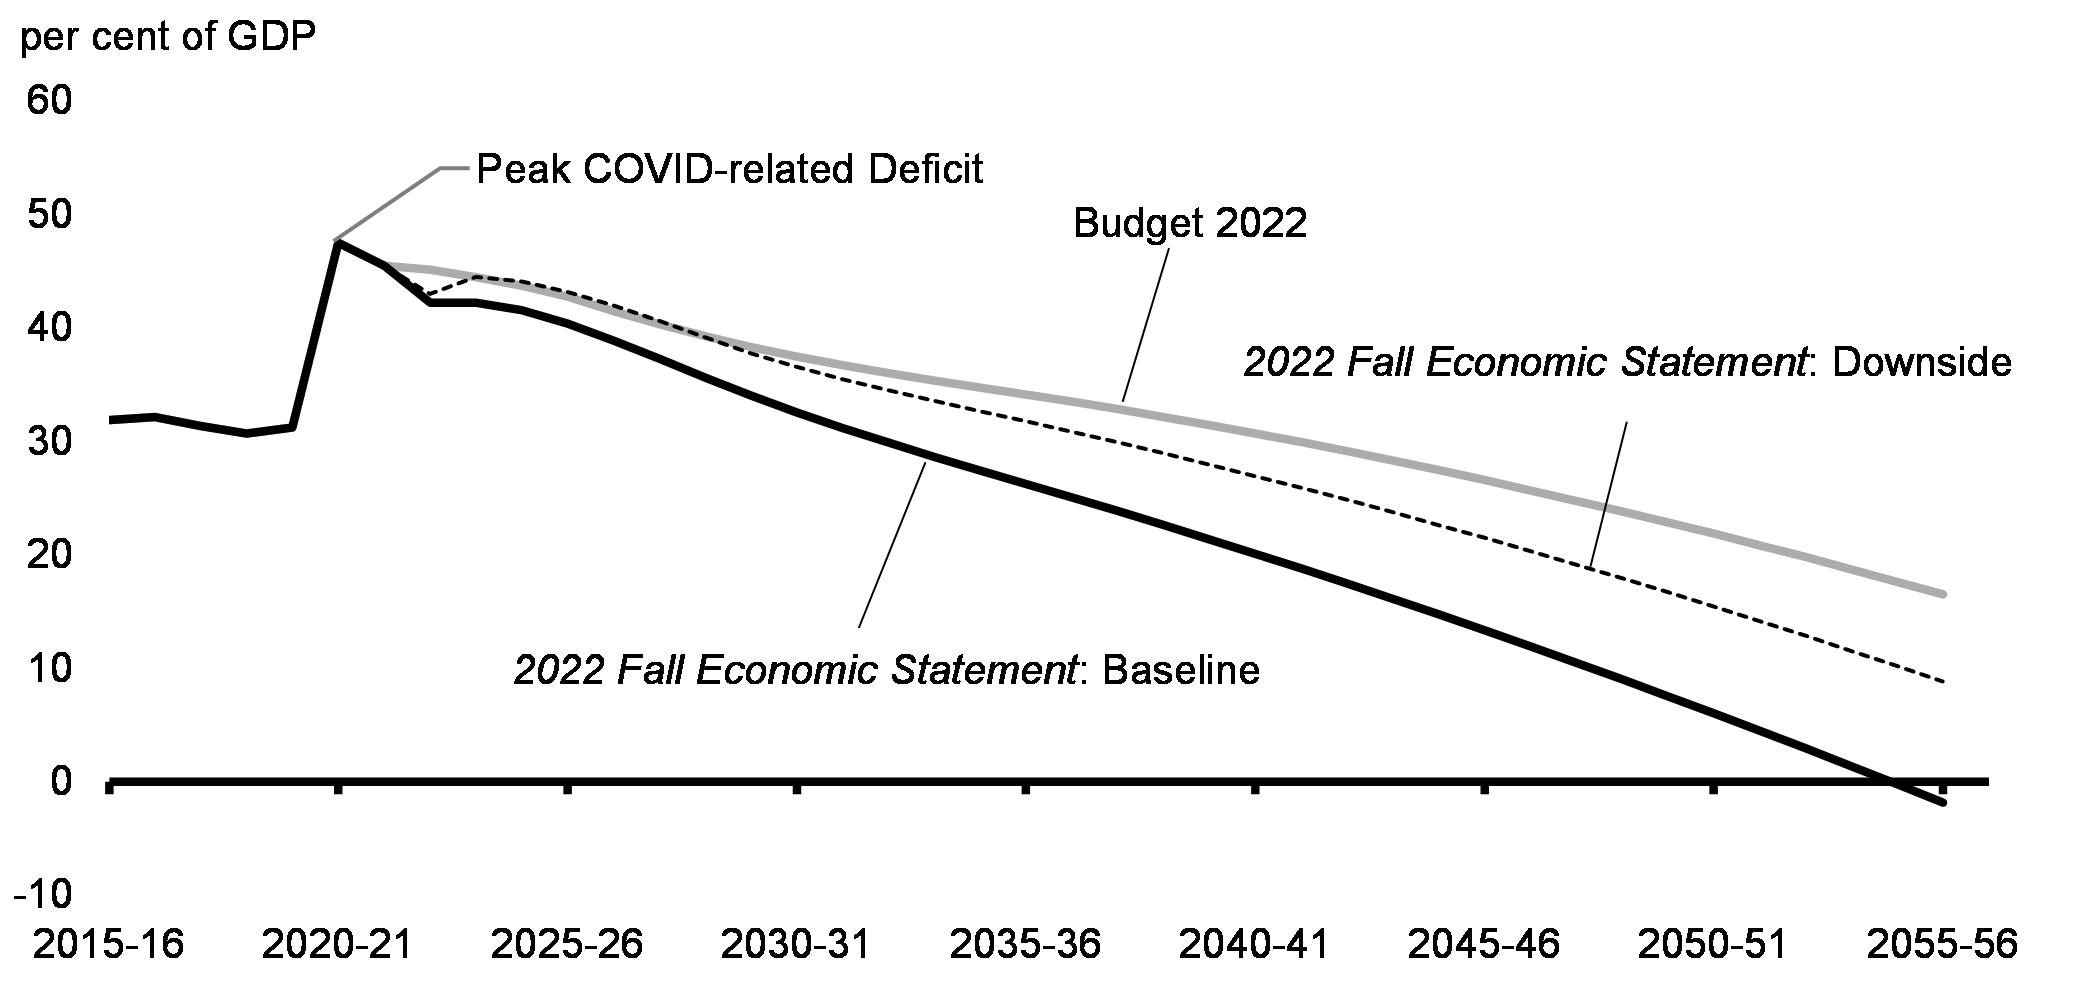
Considering the government’s fiscal anchor and using the 2022 Fall Economic Statement forecasts as a starting point, the government’s plan is fiscally sustainable over the long term. Over the next three decades, the federal debt-to-GDP ratio is projected to continuously decline and be on a steeper downward track than projected in Budget 2022 (Chart 1.31). Sensitivity analysis around these long-term fiscal projections also suggests fiscal sustainability would be preserved under the downside scenario (see Annex 1 for details).

Chart 1.31
Long-Term Projection of the Federal Debt
Chart 1.31: Long-Term    Projection of the Federal Debt

Notes: Rather than being viewed as a forecast, this long-term projection should be viewed as a modelling scenario based on a set of reasonable economic and demographic assumptions, assuming no future changes in policies. See Annex 1 for more details.

Sources: Statistics Canada; Department of Finance Canada.

Text version
Year 2015-16 2016-17 2017-18 2018-19 2019-20 2020-21 2021-22 2022-23 2023-24 2024-25 2025-26 2026-27 2027-28 2028-29 2029-30 2030-31 2031-32 2032-33 2033-34 2034-35 2035-36 2036-37 2037-38 2038-39 2039-40 2040-41 2041-42 2042-43 2043-44 2044-45 2045-46 2046-47 2047-48 2048-49 2049-50 2050-51 2051-52 2052-53 2053-54 2054-55 2055-56
Budget 2022 31.9 32.2 31.4 30.7 31.2 47.5 45.50 45.1 44.5 43.8 42.8 41.5 40.4 39.3 38.3 37.5 36.7 36.0 35.4 34.8 34.1 33.5 32.8 32.2 31.4 30.7 29.9 29.1 28.3 27.5 26.6 25.7 24.8 23.8 22.9 21.9 20.9 19.8 18.7 17.6 16.5
2022 Fall Economic Statement 31.9 32.166 31.4 30.7 31.2 47.5 45.50479 42.25063 42.24384 41.59152 40.37063 38.8881 37.29821 35.63974 34.0396 32.54542 31.16959 29.88668 28.65106 27.44639 26.26067 25.07156 23.86178 22.63011 21.37805 20.1065 18.81339 17.4944 16.14566 14.77107 13.37632 11.95604 10.51118 9.044787 7.55648 6.048971 4.516954 2.960184 1.38103 -0.21974 -1.83734
Downside 31.9 32.2 31.4 30.7 31.2 47.5 45.50479 43.00569 44.48618 44.10608 43.17791 41.98655 40.6104 39.16508 37.78728 36.56191 35.48627 34.50191 33.57244 32.66077 31.75858 30.84653 29.90875 28.94403 27.95428 26.94263 25.90834 24.84723 23.75571 22.63791 21.50041 20.33715 19.14846 17.93754 16.70456 15.45257 14.17537 12.8715 11.54374 10.19319 8.827798

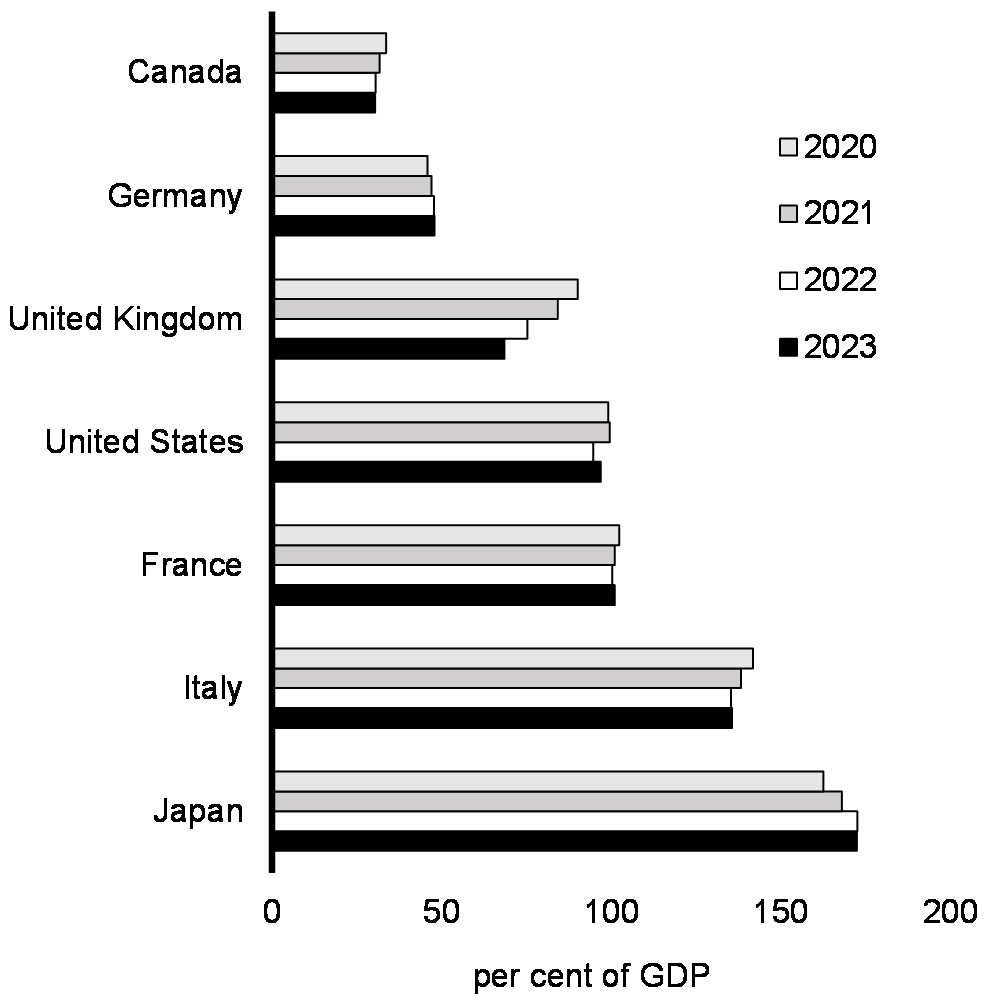
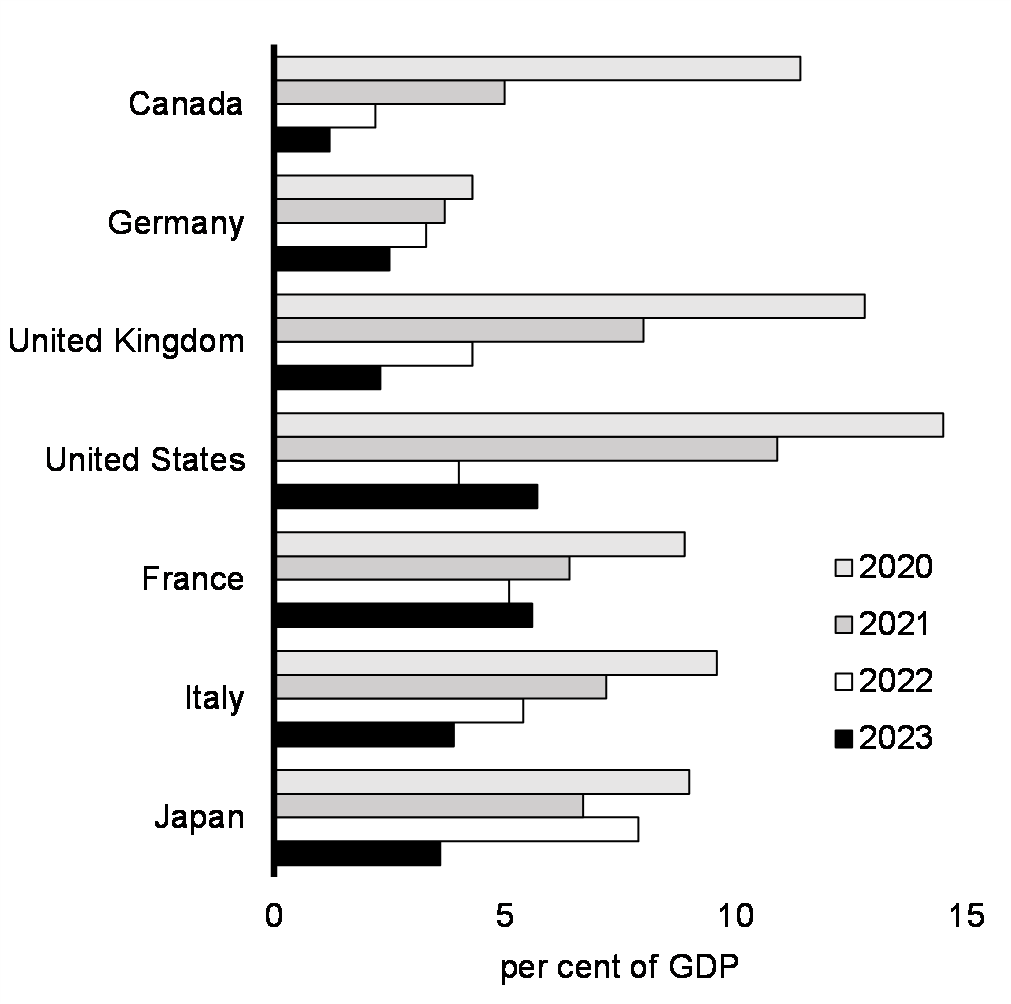
Compared to Canada’s international peers, the federal fiscal outlook and the better-than-expected provincial-territorial fiscal results position Canada to continue to have the lowest net debt-to-GDP ratio in the G7 (Chart 1.32). Canada is also expected to post the second largest fiscal consolidation (i.e., improvement in its budgetary balance) among G7 countries between the beginning of the COVID-19 pandemic and next year, resulting in Canada having by far the smallest deficit of the group this year and next (Chart 1.33).  

Chart 1.32
General Government Net Debt Forecasts, G7 Countries
Chart 1.32: General    Government Net Debt Forecasts, G7 Countries

Notes: The internationally comparable definition of “general government” includes the central, state, and local levels of government, as well as social security funds. For Canada, this includes the federal, provincial/territorial, and local and Indigenous government sectors, as well as the Canada Pension Plan and the Quebec Pension Plan.

Sources: International Monetary Fund, October 2022 Fiscal Monitor; Department of Finance Canada calculations.

Text version
2020 2021 2022 2023
Japan 162.6 168.1 172.6 172.4
Italy 141.8 138.3 135.4 135.6
France 102.3 101.1 100.3 101
United States 99.1 99.6 94.7 96.9
United Kingdom 90.2 84.3 75.3 68.5
Germany 45.8 47 47.7 47.8
Canada 33.6 31.6 30.5 30.3
Chart 1.33
General Government Deficit Forecasts, G7 Countries
Chart 1.33: General Government    Deficit Forecasts, G7 Countries

Notes: The internationally comparable definition of “general government” includes the central, state, and local levels of government, as well as social security funds. For Canada, this includes the federal, provincial/territorial, and local and Indigenous government sectors, as well as the Canada Pension Plan and the Quebec Pension Plan.

Sources: International Monetary Fund, October 2022 Fiscal Monitor; Department of Finance Canada calculations.

Text version
Region 2020 2021 2022 2023
Japan 9 6.7 7.9 3.6
Italy 9.6 7.2 5.4 3.9
France 8.9 6.4 5.1 5.6
United States 14.5 10.9 4 5.7
United Kingdom 12.8 8 4.3 2.3
Germany 4.3 3.7 3.3 2.5
Canada 11.4 5 2.2 1.2


Report a problem on this page
Please select all that apply:

Thank you for your help!

You will not receive a reply. For enquiries, please contact us.

Date modified: