
Archived - Annex 4:
Gender,
Diversity, and Quality of Life Statement
Gender equality and diversity are fundamental to creating a thriving and successful country that reflects Canadian values and achieves its potential. When every Canadian has the opportunity to succeed, all Canadians benefit.
Gender Equality and Diversity as Means to a Stronger Society
The past half century has seen major advancements in gender equality and diversity in Canada, but the COVID-19 pandemic has put that progress at risk. Canada’s challenge now is to ensure an inclusive, intersectional recovery that builds a truly equitable society.
“Now is the time to make sure that every voice is heard. Now is the time to teach our children so that human rights, and gender equality become part of who they are and how they will live. Our lives are better thanks to the efforts of the women who came before us. If we are to honour their legacy and our daughters’ futures, we must continue the fight for gender equality in our communities, our workplaces, our schools and our homes.”
Progress over the last half century has been real. Women have broken barriers in positions of leadership, taking on roles as entrepreneurs, scientists, educators, and CEOs. LGBTQ2, Indigenous, and minority rights have also been greatly expanded, enshrined in the Canadian Charter of Rights and Freedoms and the Canadian Human Rights Act. But there remains a range of gaps and barriers that threatened equality even before the pandemic.
The government’s recovery plan is feminist and intersectional, and makes targeted investments to support those most affected by the pandemic and address long-standing inequities. In laying out its plan, the government remains committed to Canada’s broad gender equality goals and to a decision-making process that considers the impacts of policy proposals on Canadians from all angles, as enshrined in the Gender Budgeting Act. The Task Force on Women in the Economy has been established to advise the government on priorities for gender equality.
Two important gender budgeting tools have also helped to guide the preparation of Budget 2021: the Gender Results Framework (GRF), which helps to identify policy gaps and priorities, and the process of factoring gender and diversity considerations into decision making (gender-based analysis plus, or GBA Plus, which encompasses numerous identity factors such as ethnicity, region of residence, age, biological sex, income level, gender, educational attainment, sexual orientation, race, immigrant status, and mental or physical ability).
Gender Equality Goals for Canada
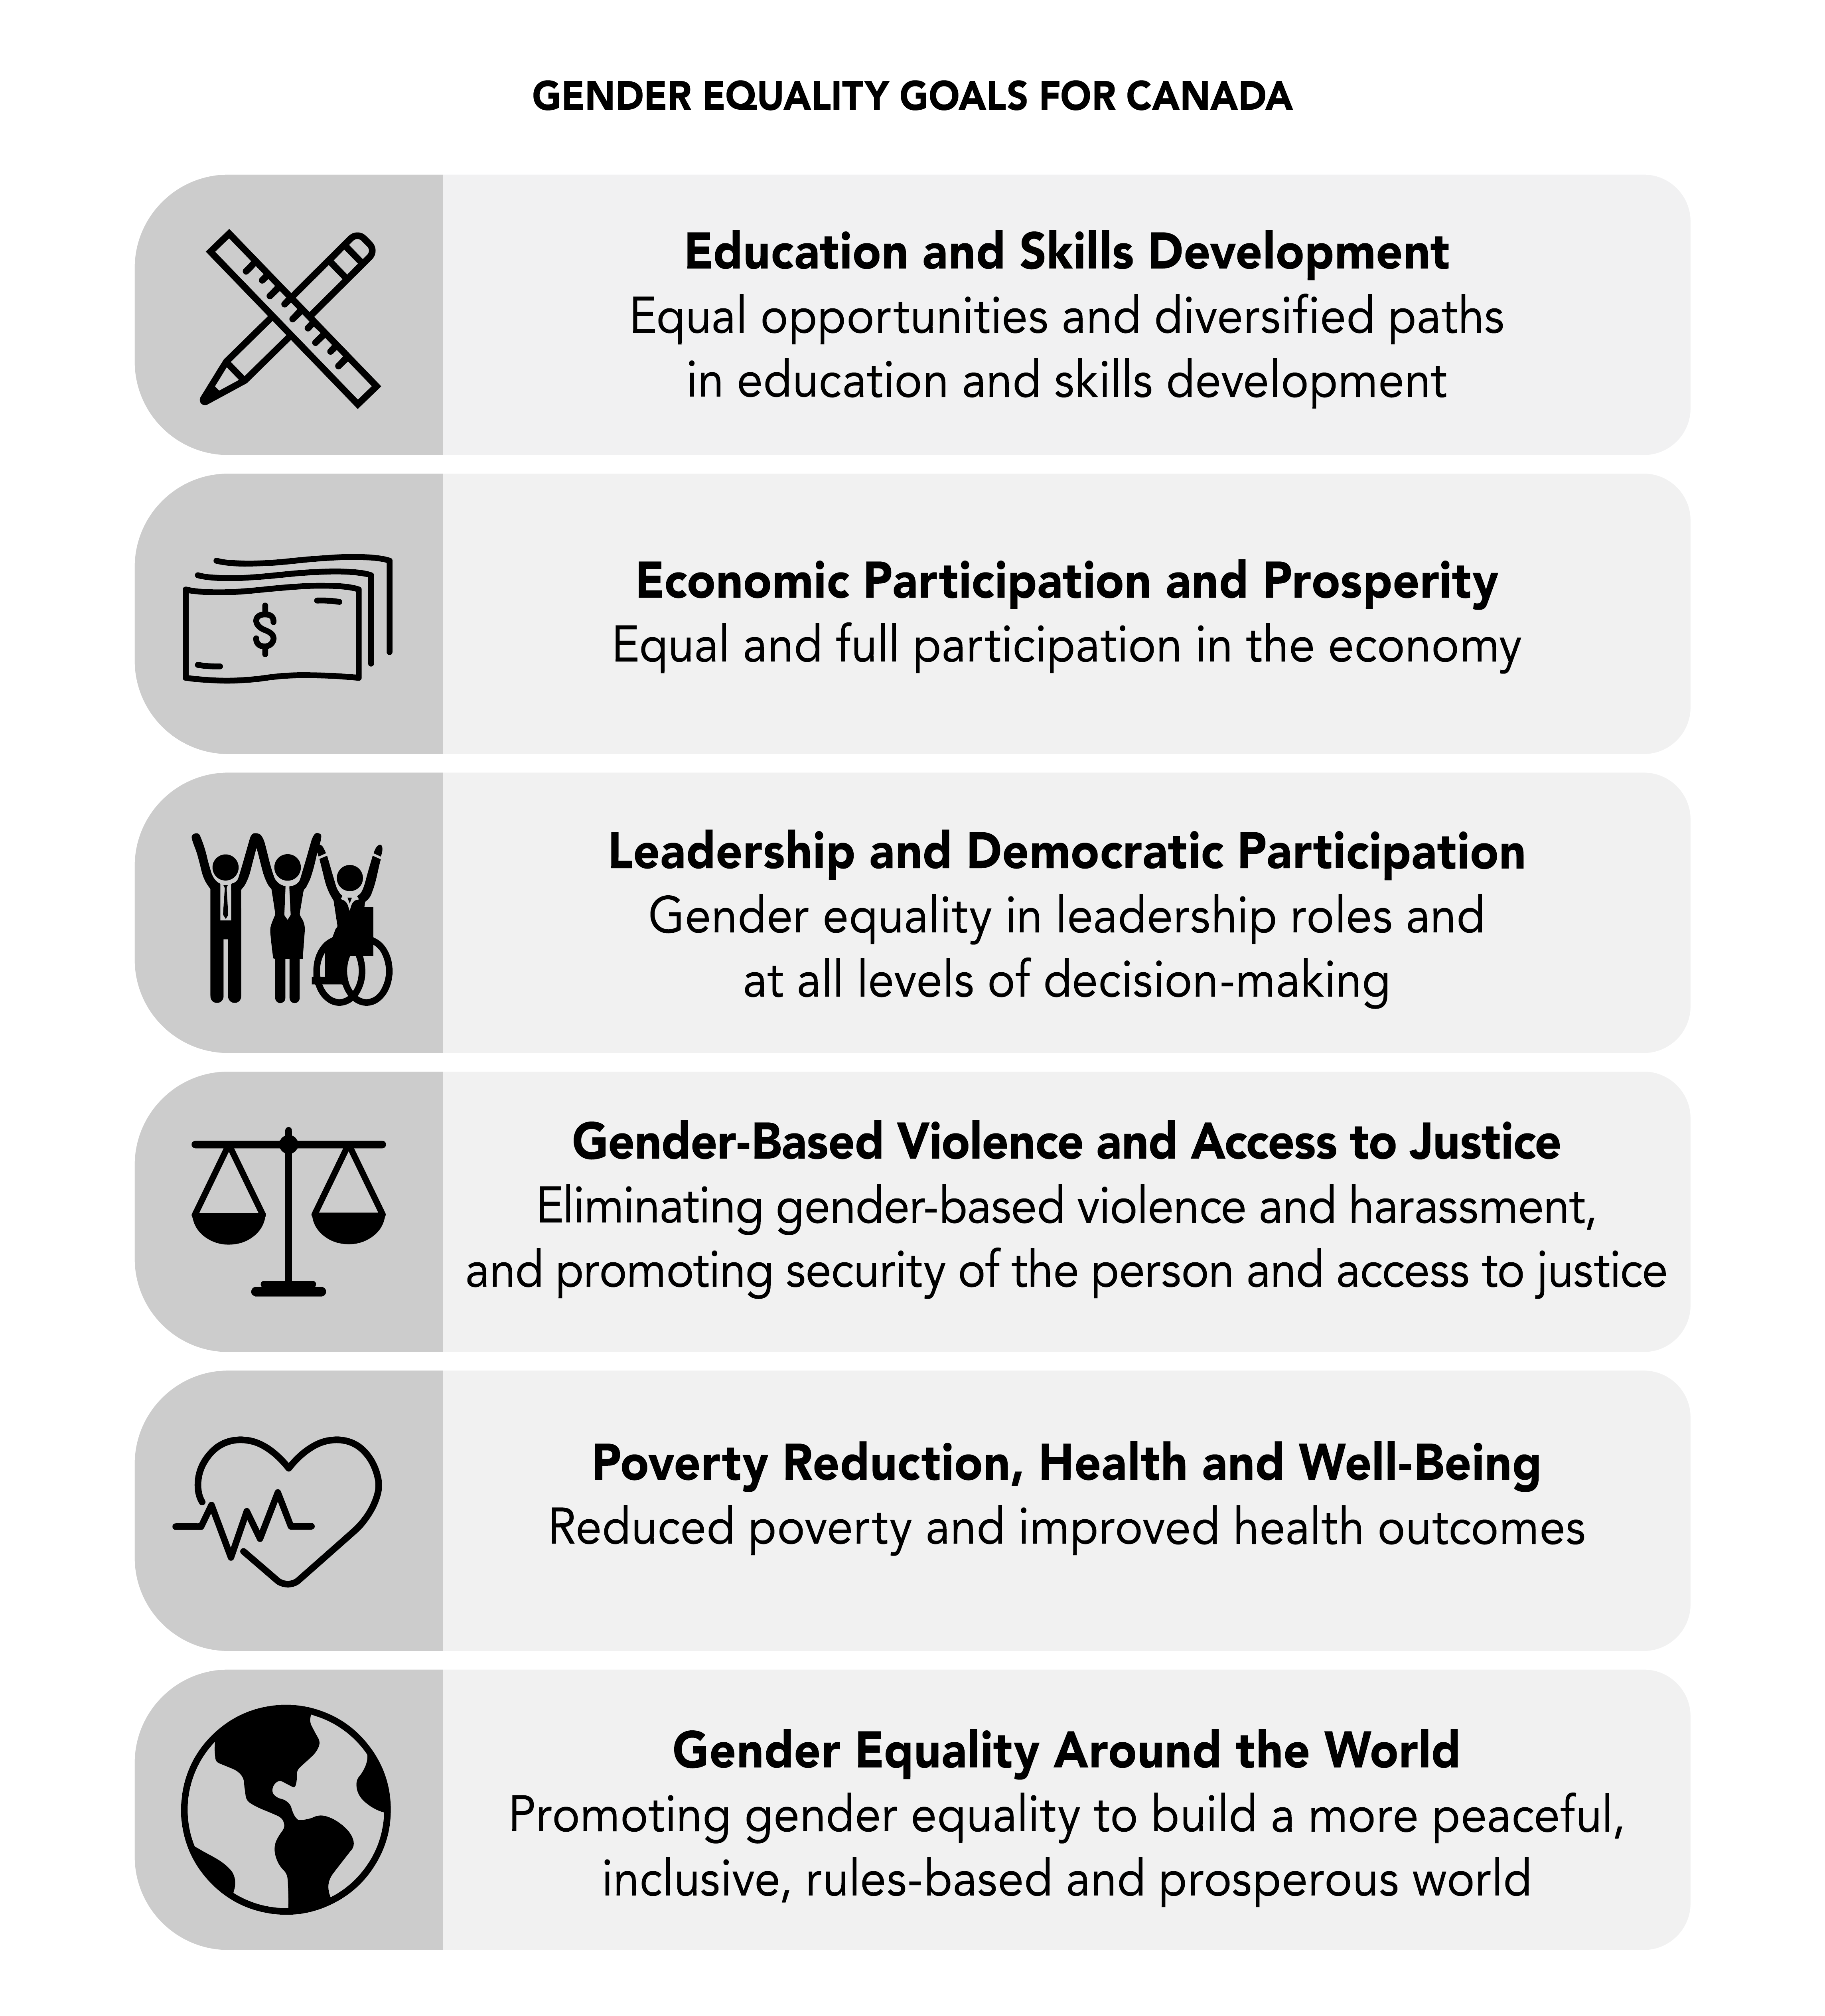
Canada’s Gender Results Framework (GRF) was introduced in Budget 2018 as a whole-of-government articulation of gender equality priorities and goals with matching indicators to track developments toward these goals. This statement includes a summary of where Canada stands on these priorities.
Reflecting that gender is only one aspect of identity, and that systemic discrimination, racism, ableism, and ageism, among other many factors, compound the impacts of gender issues, this section also presents statistics on additional identity characteristics to enable a deeper understanding of the experiences of diverse groups of people, such as Indigenous peoples, people with disabilities, racialized peoples, and members of LGBTQ2 communities. By reporting on indicators in the GRF, Canadians and the government can see where Canada was, where it is now, and where it can be in relation to gender equality and diversity.
As in previous years, this statement also highlights some of the key actions the government is taking in this budget to improve fairness and inclusion within each priority area, and provides a summary of the aggregate gender and diversity impacts of all new and renewed measures in this budget.
Budget 2021’s Impacts Report, which follows this Statement, includes an assessment of the impact of every budget measure included in Budget 2021. To support the government’s efforts to address existing inequalities and make more inclusive decisions, this budget makes significant investments in Statistics Canada to improve the availability of data.
Note on Terminology
In this section, the term "visible minorities" is occasionally used because it is the official demographic category defined by the Employment Equity Act and used by Statistics Canada in their surveys. With the commitment to support a task force on modernizing the Employment Equity Act, the question of appropriate terminology will be taken up by the members.

Gender Results Framework
Education and Skills Development
Equal opportunities and diversified paths in education and skills development
Education and skills development are critical for participation in the job market, and a key source of opportunities for Canadians to pursue a better life. Educational paths should be chosen based on interests and aptitudes, free from gendered expectations and stereotypes.
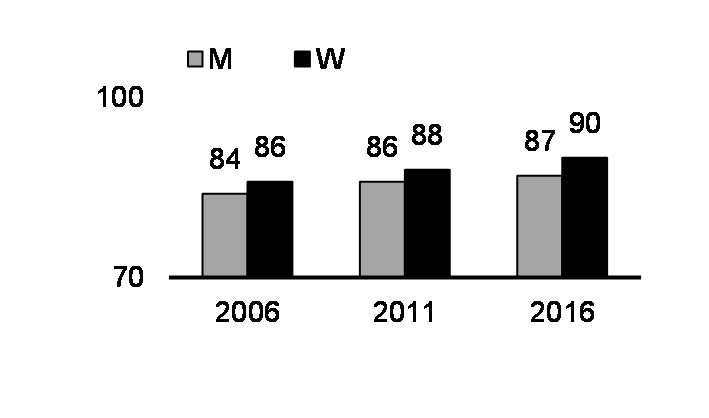
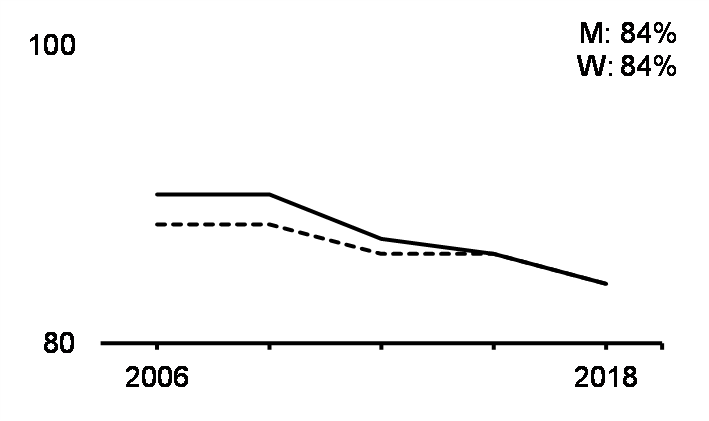
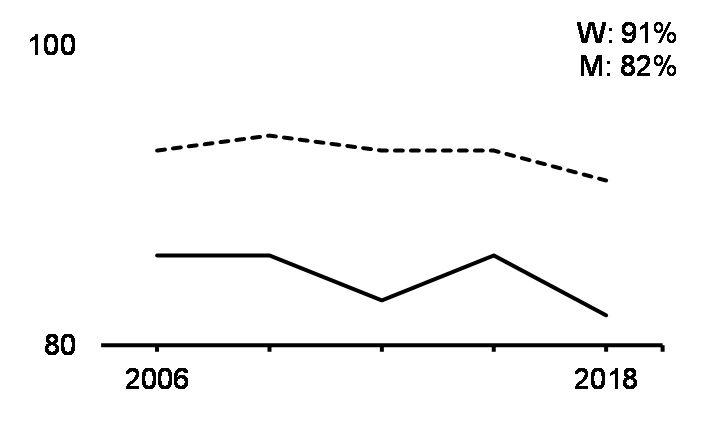
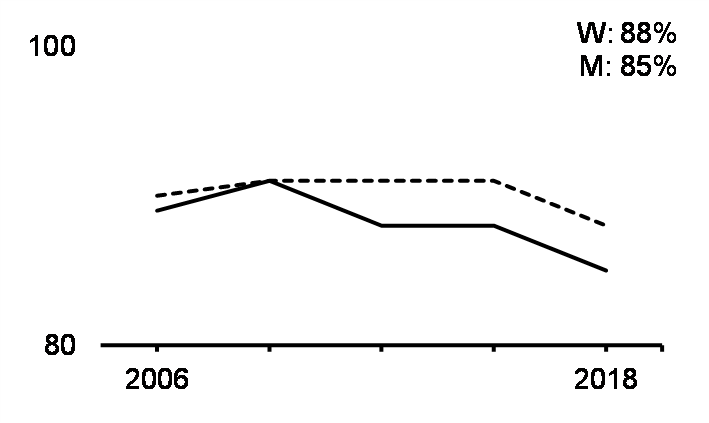
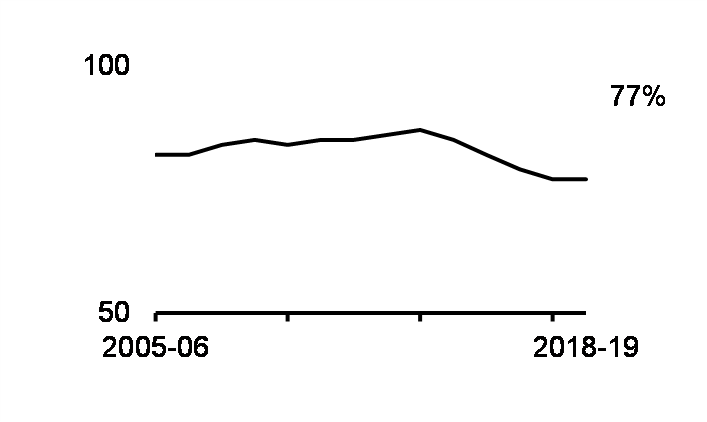
Share aged 25-64 with a certificate, diploma or degree.
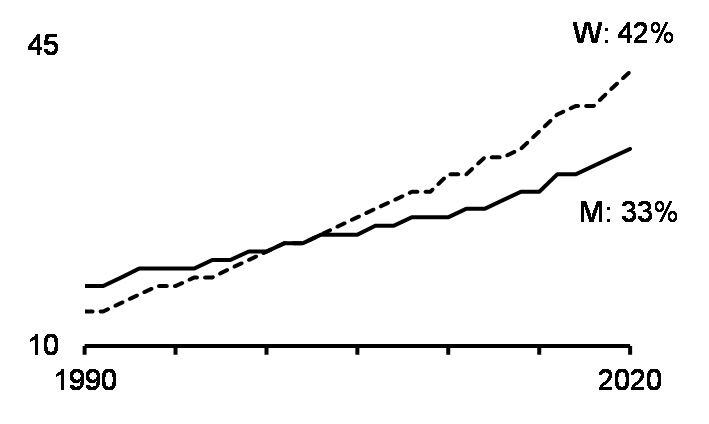
Share aged 25-54 with a university degree.
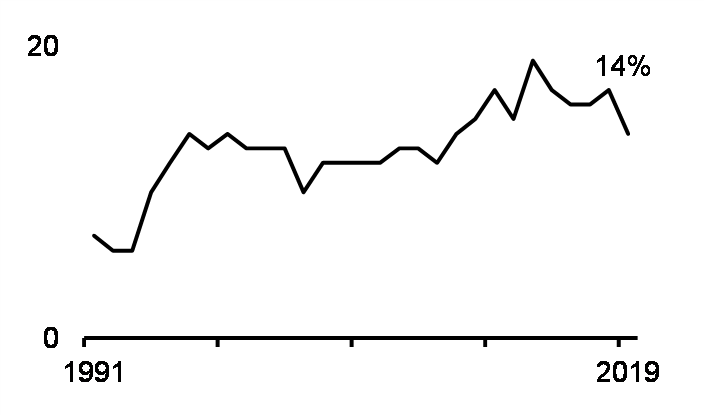
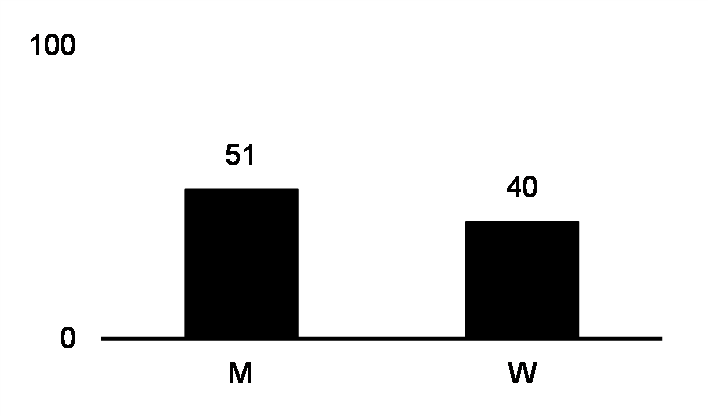
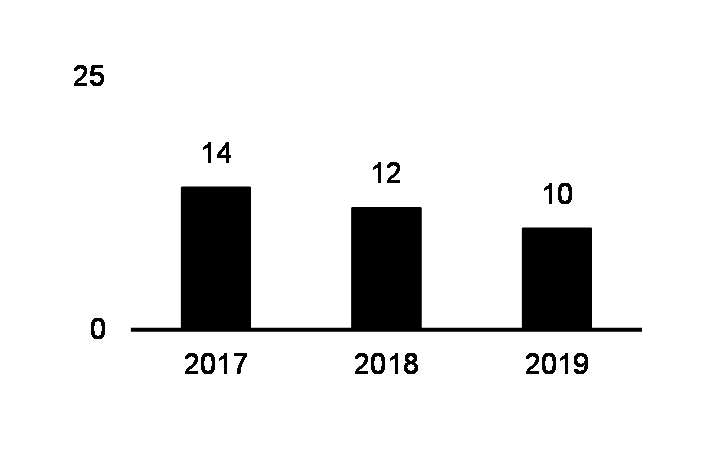
Share of newly certified tradespeople who are women.
Share aged 15 at proficiency level 2 or above in mathematics.
Share aged 15 at proficiency level 2 or above in reading.
Share aged 15 at proficiency level 2 or above in science.
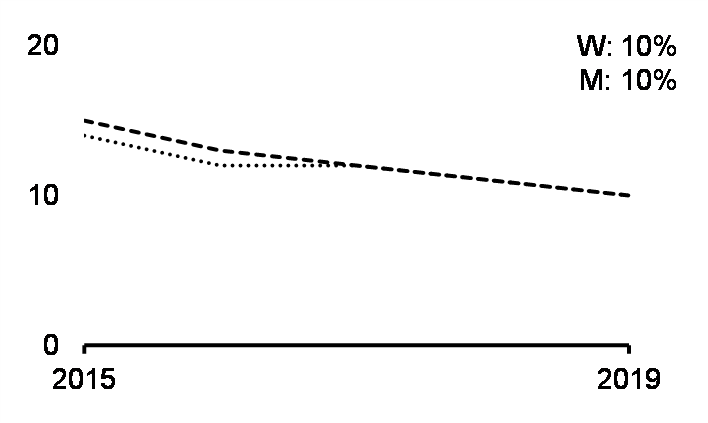
Share aged 16-65 at proficiency level 3 or above in 2012.
Share aged 16-65 at proficiency level 3 or above in 2012.
| Education | 76 |
|---|---|
| Health | 76 |
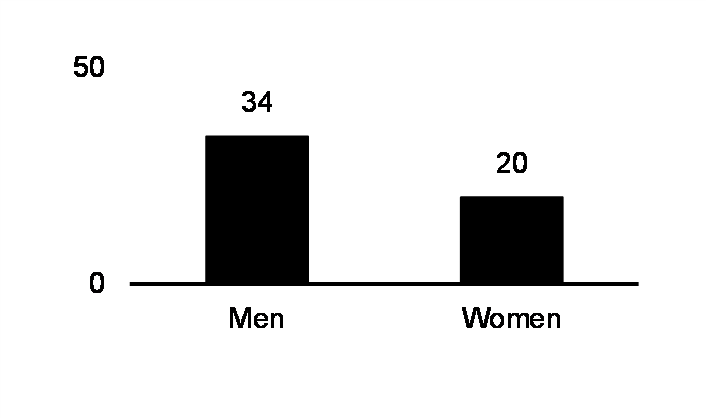
| Math and comp. science | 27 |
| Arch. and engineering | 25 |
Sources: 2016 Census, Labour Force Survey, Registered Apprenticeship Information System, 2018 Programme for International Student Assessment, 2012 Programme for International Assessment of Adult Competencies, and Post-Secondary Student Information System, 2018-19.
Prior to the COVID-19 pandemic, many significant gender gaps in education and skills development had narrowed. Women exceeded men in terms of high school graduation and university education, and many fields of study that were once male-dominated in the past had become far more equal. For example, women represented around one in 20 students in law and medicine in 1950, but now represent over one-half of students in these fields. Despite marked improvements, women were still significantly under-represented in some fields of study, like engineering, math, and computer science, and were much less likely to pursue high-paying jobs in the trades. For example, only about 1 in 4 engineering students and about 1 in 7 newly certified registered apprentices are women. There were also a number of important education and skills development gaps from a diversity perspective, such as lower rates of educational attainment among people with disabilities, and lower literacy and numeracy skills among Indigenous peoples.
Diversity Focus
- 26 per cent of Indigenous people had no educational credentials in 2016 compared to 11 per cent of non-Indigenous people. Inuit men were the most likely to report none.
- Off-reserve Indigenous peoples had lower literacy and numeracy skills than non-Indigenous people in 2012.
- University attainment varied substantially among racialized people in 2016. Canadians of Korean descent were the most likely to be university educated (57 per cent), while Southeast Asian Canadians were the least likely to have obtained a university degree (24 per cent). Gender gaps were the largest for Canadians of Filipino descent, where 47 per cent of women had completed a university degree, compared to 38 per cent of men.
- Between 2015 and 2018, gay men and lesbian women were more likely to have a post-secondary qualification than heterosexual men and women, while bisexual men and women were less likely to have a post-secondary qualification.
- Persons with disabilities, especially those with severe disabilities and men, were less likely to have obtained an educational credential in 2017 than those without disabilities.
- High school students’ socio-economic status was a weaker predictor of academic performance in Canada in 2018 than in other OECD countries, and disadvantaged students in Canada were more likely to be academically resilient.
Given that many postsecondary degrees or diplomas require at least one year or more to complete, the impact of COVID-19 and related public health restrictions on lifelong educational attainment is hard to measure in the short term. But it is clear that the pandemic has had large negative impacts on racialized women and youth, with both students and non-students seeing significant job losses, particularly young women, and many young people returning to school or staying in school longer in light of weaker job prospects. There is strong evidence that the effects of a recession on young people are long lasting and that the scarring effects of unemployment can reduce earnings for years after the economy has recovered. When young people experience periods of unemployment, or are forced to work at jobs for which they are overqualified, they miss out on opportunities to acquire valuable skills that help them advance, and decrease their connection to the labour market during formative years. All these challenges will be compounded for more vulnerable youth.
There is no silver bullet to address these challenges. Governments provide extensive supports aimed at helping youth achieve their full potential. Major federal investments in recent years have focused on making postsecondary education more affordable, including enhancements to the Canada Student Loans and Canada Student Grants programs, and improving skills development and job opportunities, including funding to assist provincial and territorial training and employment supports such as work-integrated learning placements. Countries whose youth perform better in the school-to-work transitions, such as Germany, tend to have a strong apprenticeship culture. In recent years, the government has made many investments in these areas — such as through Canada Apprentice Loans, Apprenticeship Incentive and Completion Grants.
The Task Force on Women in the Economy members have emphasized the opportunities for women to enter high paying fields in the trades and other well-paying jobs in the innovation sector. They also emphasized the importance of providing opportunities for up-skilling for mid-career women and training and employment opportunities to groups who systemically face fewer opportunities. The 2020 Fall Economic Statement provided funding to bolster training supports for those most affected by the pandemic, including marginalized women, Indigenous peoples, youth, persons with disabilities, and recent newcomers to Canada.
In an effort to build on that momentum and tackle long-standing gaps in education and skills development, and encourage lifelong learning and retraining among all groups of Canadians, the government has introduced a number of Budget 2021 measures, including:
- Additional funding and a pilot expansion of the Supports for Student Learning Program.
- Strengthening elementary and secondary education on reserve, including helping adults finish high school.
- Additional funding for Aboriginal Head Start programs.
- Enhancements to federal skills and employment training programs, including to strengthen foundational skills through Skills for Success.
- Providing enhanced student financial assistance and expanded student debt relief.
- Supporting Indigenous post-secondary students and institutions during COVID-19.
- Opportunities for businesses and young workers through Mitacs to expand work-integrated learning opportunities for post-secondary students.
- Helping youth and students build job skills and connect with employers through additional funding towards the Youth Employment and Skills Strategy, the Student Work Placement Program, and the Canada Summer Jobs program.
For the details of the impacts of these and more Budget 2021 measures which advance the Education and Skills Development Pillar, please see the Impacts Report.

Gender Results Framework
Economic Participation and Prosperity
Equal and full participation in the economy
Ensuring that every person has the opportunity and the support to participate fully in the economy will raise the incomes of Canadian families and benefit the country as a whole.
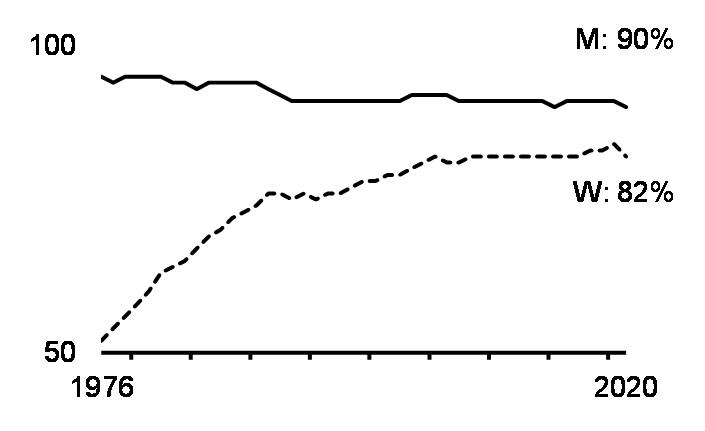
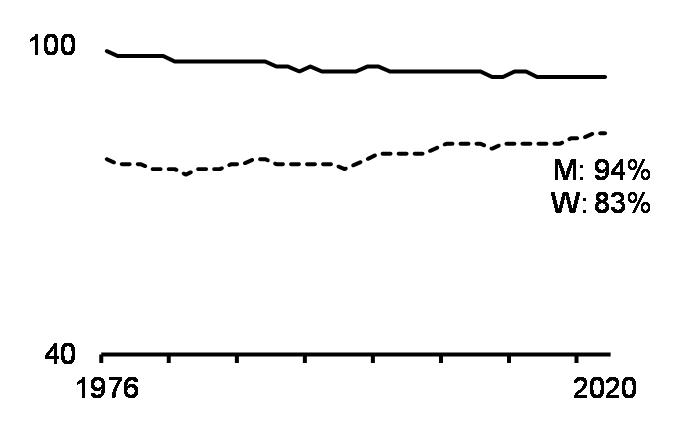
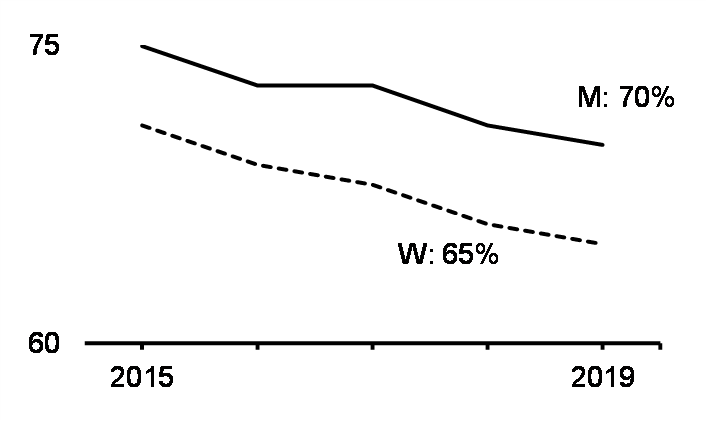
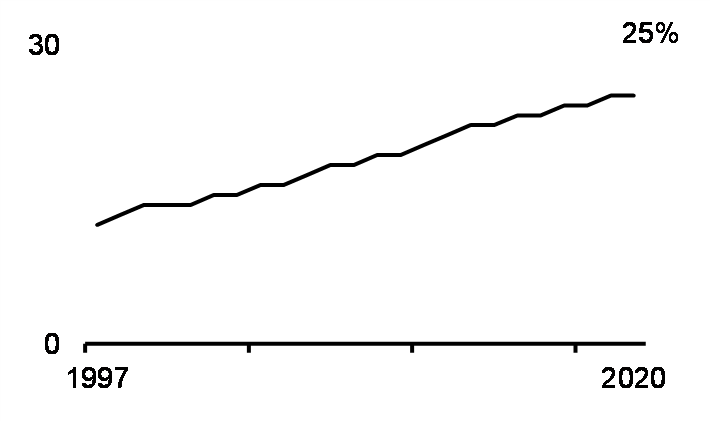
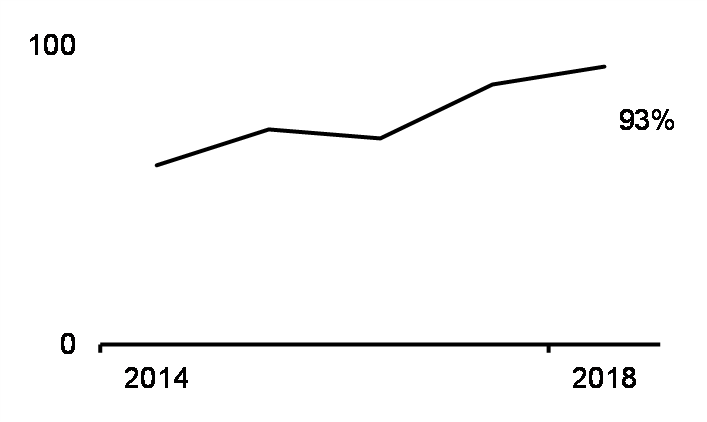
Share aged 25-54 in the labour force.
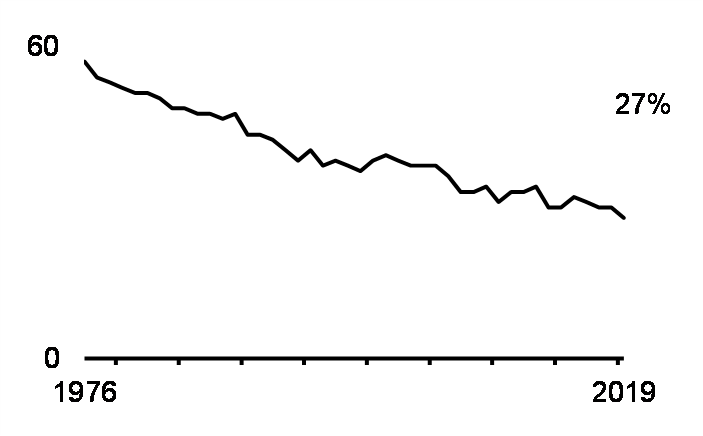
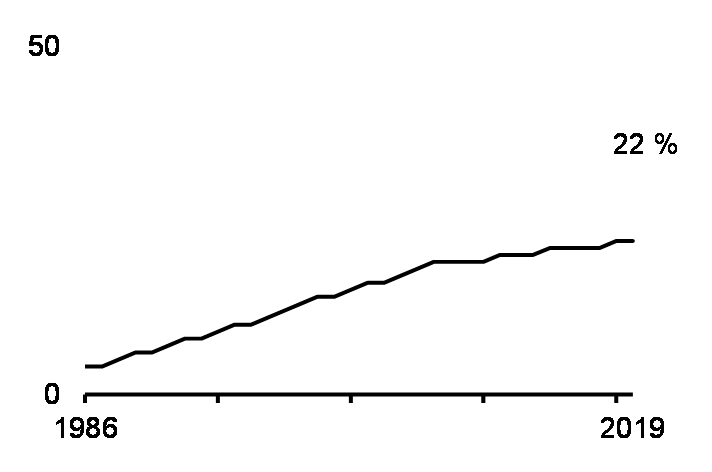
Gender gap in median employment income for those aged 25-54.
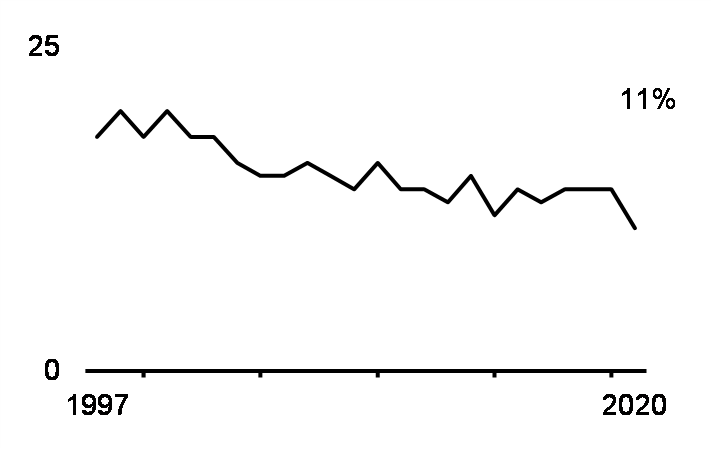
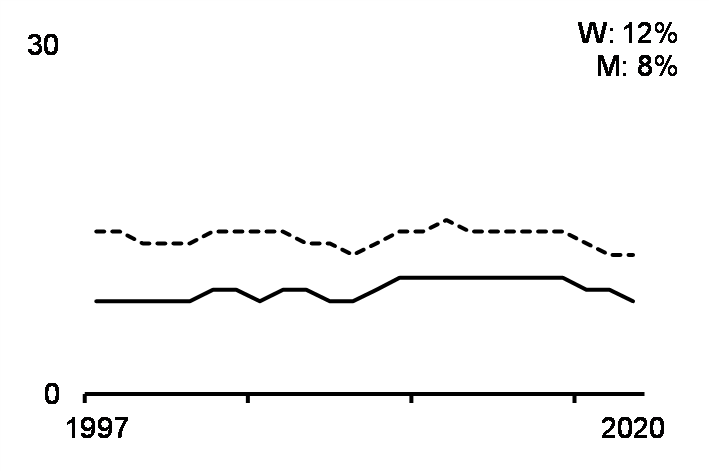
Median hourly full-time wage gap for those aged 25-54 years.
Share of employed aged 25-54 working full-time.
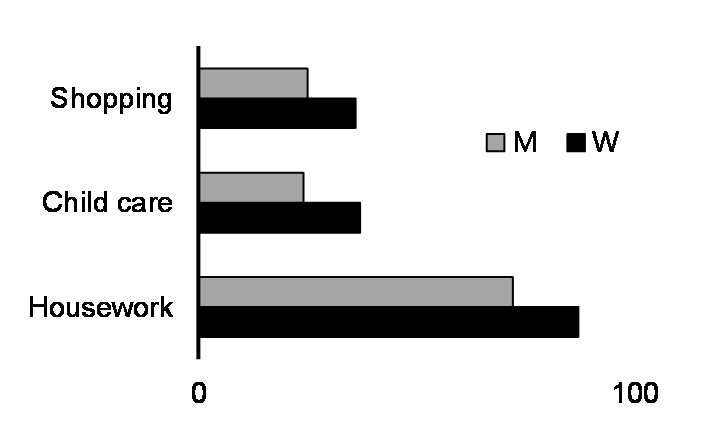
Share aged 25-54 engaging in unpaid work activities in 2015.
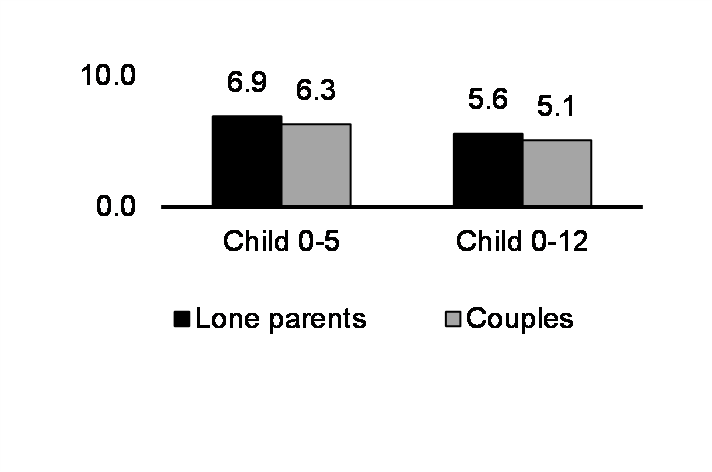
Average proportion of after-tax income spent on child care in 2019.
| Nursing | 89 |
|---|---|
| Office support | 87 |
| Front-line public protection services |
20 |
| Industrial, electrical and construction trades |
5 |
Share of employed who are women by occupation in 2020.
Share of employed aged 25-54 in temporary or involuntary PT work.
Share aged 25-54 with hourly pay less than two-thirds of the median.
Sources: Labour Force Survey, Survey of Consumer Finances, Survey of Labour and Income Dynamics, Canadian Income Survey, 2015 General Social Survey, and 2017 General Social Survey.
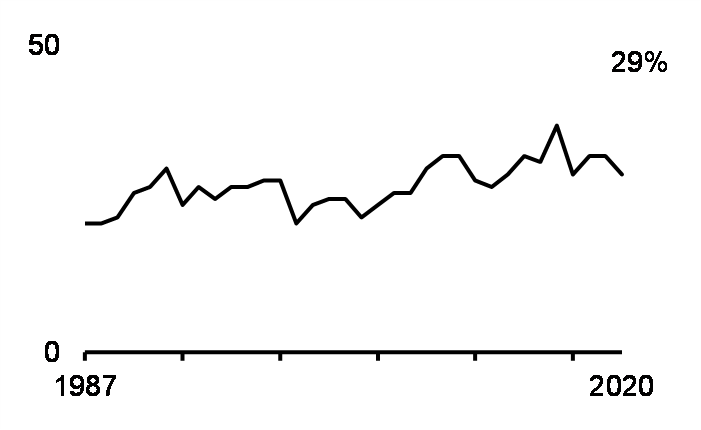
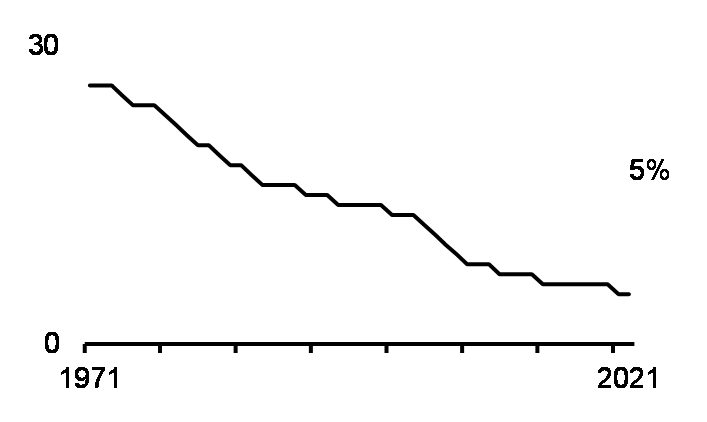
Fifty years ago, only half of Canadian women participated in the labour market and women’s annual income was almost 60 per cent lower than men’s. Today, over 8 in 10 women participate in the labour market and the gender gap in annual employment income has fallen to 27 per cent. These changes represent major progress toward gender equality in the labour market. However, persistent social norms mean that women continue to spend more time on caregiving and household responsibilities, and this unpaid work is not valued in traditional economic terms and cuts into the number of hours that women can spend in the paid workforce. Balancing work and family responsibilities may also lead some women to trade off more secure, high-paying jobs, for lower-paying, but more flexible positions. In addition, occupational segregation continues to limit career choices for women, making women more likely to work in low-wage jobs. Women from underrepresented groups, including Indigenous, Black, racialized and newcomer women, often face even greater barriers to equal and full participation in the labour market. Where women do succeed in predominantly male fields, there remain diparities between their compensation relative to their male counterparts.
Diversity Focus
- Indigenous women earned 44 per cent less than white men in 2015. Even after adjusting for differences in demographic and job characteristics, a large gap of over 30 per cent remained.
- Indigenous men and women had higher unemployment rates than non-Indigenous men and women in 2019.
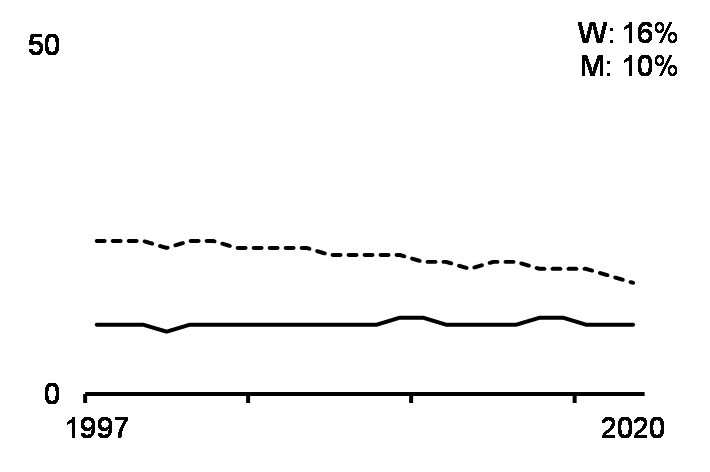
- In 2015, visible minority women earned 17 per cent less than white men. Demographic and job characteristics, like industry, occupation, age, and education, did not explain this gap.
- Unemployment rates were higher among racialized Canadians, but the rates varied significantly across groups. For example, in May 2016, about 1 in 7 Arab Canadian women were looking for work, compared to 1 in 25 Filipino Canadian women. Black Canadian men and women, Arab Canadian men, West Asian Canadian women and South Asian Canadian women, also had particularly high rates.
- In 2019, immigrant women, especially recent immigrant women (i.e. those who landed in Canada 5 or less years earlier), were less likely to work than women born in Canada. Compared to recent immigrant men, newcomer women from Africa and Asia experienced the largest gender gaps in employment.
- Visible minority newcomer women earned $26,600 in 2015, compared to $30,100 for non-visible minority newcomer women, $35,600 for visible minority newcomer men, and $42,600 for non-visible minority newcomer men.
- Between 2015 and 2018, lesbian women were more likely to work than heterosexual women, while gay men were slightly less likely to work than heterosexual men. Bisexual men and women had the lowest employment rates.
- Persons with disabilities were less likely to work than those without disabilities. Severity negatively impacts employment, with only 31 per cent of people with severe disabilities working in 2016.
In part reflecting these pre-existing inequalities, the COVID-19 pandemic and related public health measures have disproportionately affected women, especially women from underrepresented groups. As outlined in the Overview of Economic and Social Foundations, women’s jobs were affected earlier and more severely, and continue to recover more slowly, with especially notable negative employment impacts for Black and racialized women, newcomer women, low-wage women and young women. Even when women were not at risk of losing their jobs, the essential nature of the services they provide – e.g. nursing, child care – put them at a greater risk of transmission of COVID-19. Although the overrepresentation of women in low-wage work has been a long-standing contributor to gender inequity in Canada, COVID-19 has highlighted the essential nature of many of these jobs, especially front-line care work. For women who are mothers, the closure of schools and child care centres exacerbated work-life balance challenges and increased barriers to labour market entry.
The Task Force on Women in the Economy has been clear in advising the government that this pandemic requires a stimulus and recovery response tailored to the unique nature of this crisis on women. Members placed a high priority on investments in the care economy to address the burden of unpaid work on women, to facilitate women’s participation in the paid labour force, and to create good jobs in sectors of the economy where women work. This includes investments in early learning and child care, and in supportive care, where the pandemic exposed inadequacies in the quality of care being provided to seniors and in the wages and working conditions of care workers.
“Any job can be a great job. The social infrastructure on which we all depend will be a growing driver of GDP for decades, the result of population aging and the needs of a shrinking but increasingly valuable working-age cohort. The caring economy could power a better life, not just a bigger economy, if we address issues revealed by the pandemic. Just as manufacturing generated Canada’s middle class from the 1950s to the 1970s, the care sector could be the source of our next middle class.”
In recognition of these challenges, Budget 2021 is investing in a feminist and inclusive recovery and working toward tackling gender inequities and systemic discrimination in the labour market in a number of ways, some of which include:
- Establishing a Canada-wide Early Learning and Child Care system.
- Supporting Black Canadian communities through additional investments for Black-led non-profit organizations and establishing a Black-led Philanthropic Endowment Fund.
- Strengthening long-term and supportive care across Canada by investing to support the implementation of standards for long-term care, improved access to quality palliative care and improved data infrastructure to lay a better foundation for coordinated action across the sector.
- Also see actions listed under Poverty Reduction, Health and Well-Being to raise the federal minimum wage and enhance the Canada Workers Benefit.
- Investing in distinctions-based, culturally appropriate child care for Indigenous children.
- Deploying the Social Finance Fund to mobilize private capital and grow the social finance market in order to create thousands of new jobs in this women-dominated sector, provide much-needed services for vulnerable Canadians, and drive positive social change.
- Renewing the Investment Readiness Program to continue helping charities, non-profits, and other social purpose organizations to develop the necessary skills and capacity to access social finance opportunities.
- Funding to my65+ by the Service Employees International Union Healthcare to provide incentives for worker participation.
For the details of the impacts of these and more Budget 2021 measures which advance the Economic Participation and Prosperity Pillar, please see the Impacts Report.

Gender Results Framework
Leadership and Democratic Participation
Gender equality in leadership roles and at all levels of decision-making
Gender equality and diversity in leadership positions in economic, political and judicial spheres is essential to a fair and democratic society.
Share of senior management positions filled by women.
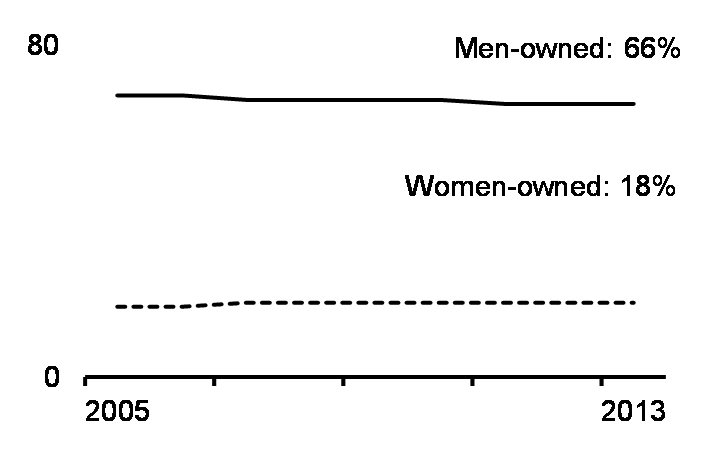
Share of private enterprises by majority-ownership.
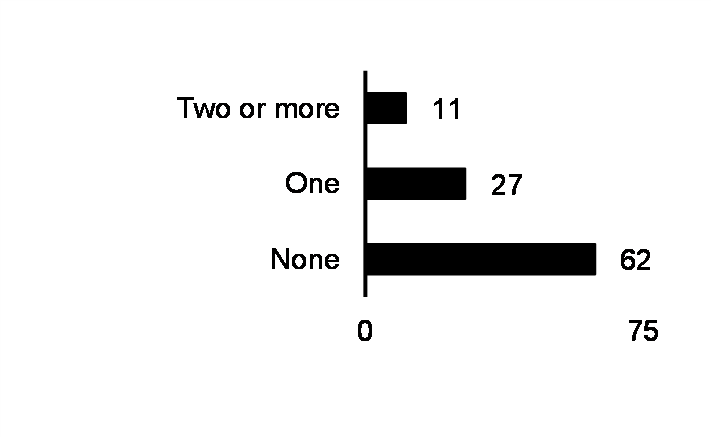
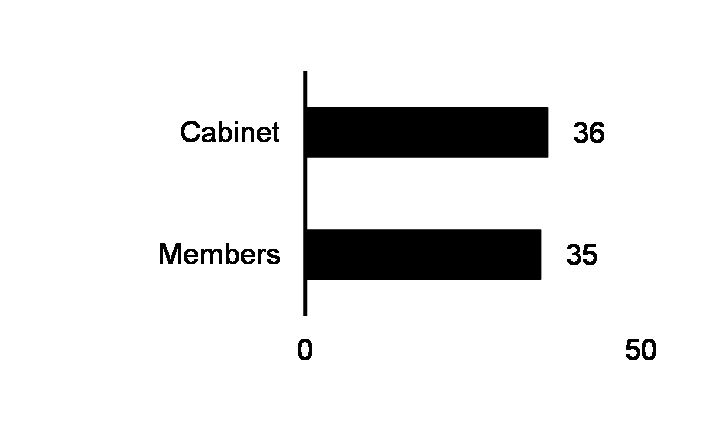
Share of boards by number of women directors in 2018.
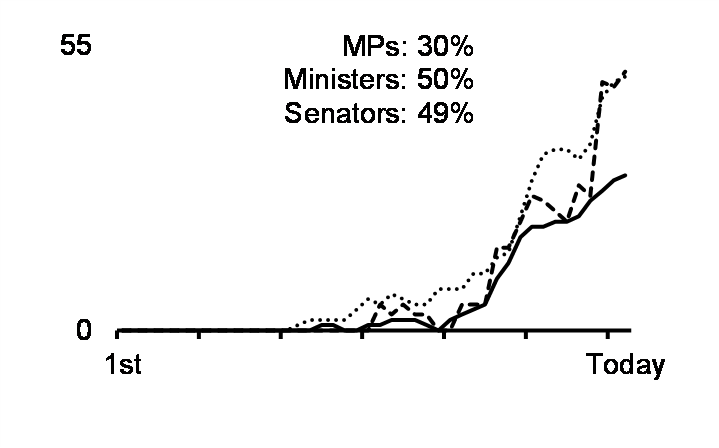
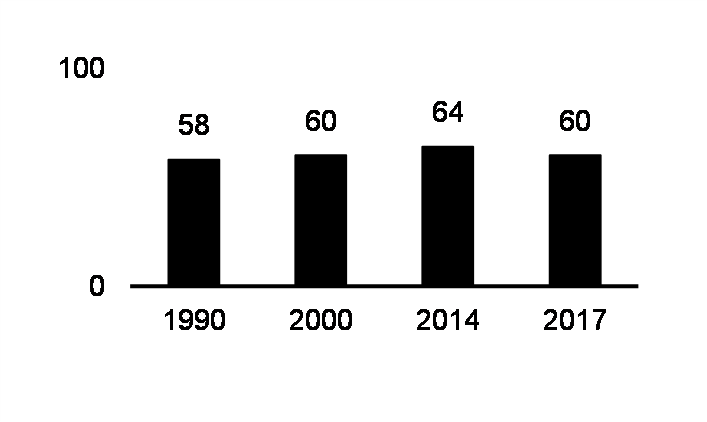
MPs, Ministers and Senators who are women by Parliament.
Share in PT governments who are women as of Feb. 16, 2021.
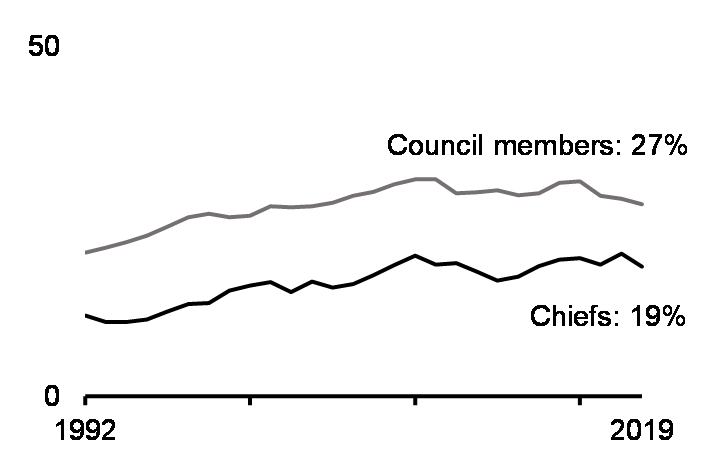
Share in First Nations Band Councils who are women.
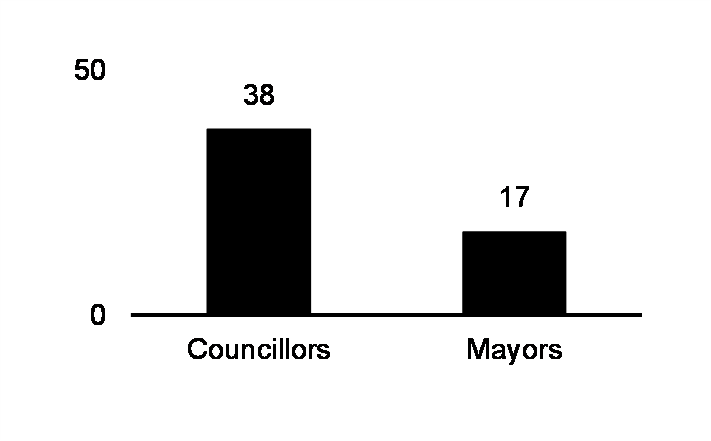
Share of city councillors who are women as of Feb. 16, 2021.
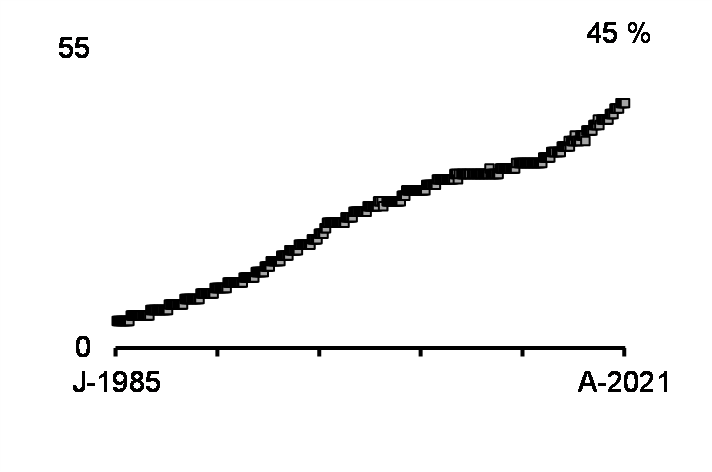
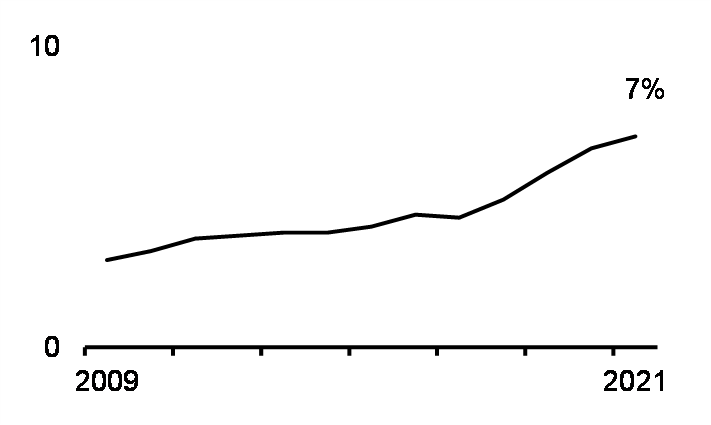
Federal judges who are women by month and year, Jan. 85 to Apr. 21.
Share of full-time equivalent police officers who are women.
Sources: Labour Force Survey, Canadian Employer-Employee Dynamics Database, Corporation Returns Act, Parliament of Canada, Indigenous Services Canada, municipal, provincial and territorial websites, Office of the Commissioner of Federal Judicial Affairs, and Police Administration Survey.
Since most women won the right to run as candidates in the federal elections in 1920, there have been gradual improvements in gender representation in Canadian politics. For example, the number of women elected to Parliament has increased to 100 out of 338, and in 2015, Canada saw its first ever gender balanced Cabinet.
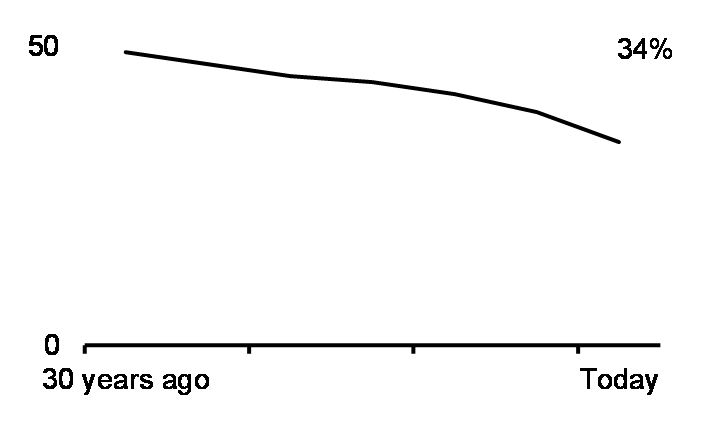
At the same time, there have been significant improvements in the judicial sphere, in part due to recent reforms to the superior courts’ judicial appointment process that emphasize transparency, merit, and the diversity of the Canadian population, while continuing to ensure the appointment of jurists who meet the highest standards of excellence and integrity. This process has helped to increased the share of federally appointed judges who are women from 34 per cent in 2015 to 45 per cent in 2020. It has also resulted in the appointment of 16 judges identifying as LGBTQ2 and 30 judges identifying as belonging to a visible minority group since October 2016.
However, the power gap persists. Business continues to be heavily male dominated, with only 1 out of every 3 senior management positions filled by a woman, and diversity is severely lacking in many leadership and decision-making roles. For example, Black, racialized people, Indigenous peoples and people with disabilities are much less likely to be business owners and serve on corporate boards. Racialized Canadians are also less likely to serve in law enforcement.
Diversity Focus
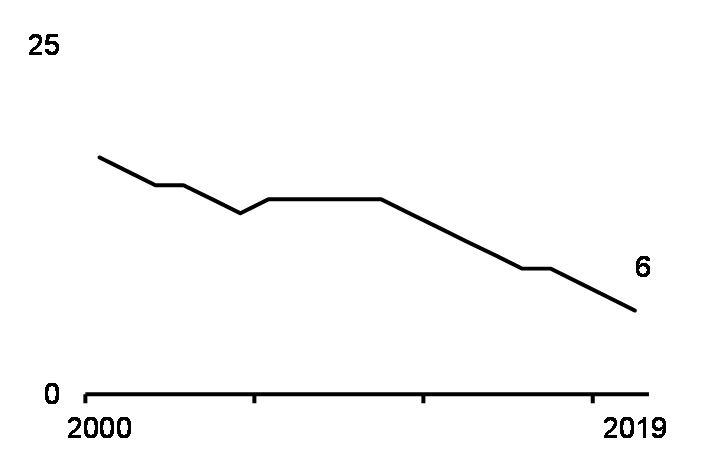
- Few small- and medium-sized enterprises (SMEs) were majority-owned by Indigenous people in 2017 (1 per cent).
- There are currently 5 First Nations, 2 Inuit, and 4 Métis Members of Parliament (MPs), representing 3 per cent of the House, compared to 5 per cent of the population. Of the 11 Indigenous MPs, 4 are women. Concurrently, the Senate has 5 First Nations, 1 Inuit, and 4 Métis Senators (10 per cent). Of these Indigenous Senators, 6 were female.
- Overall, 4 per cent of police officers and 3 per cent of recruits identified as Indigenous in May 2019. Within First Nation police services, 63 per cent of officers identified as Indigenous.
- Among the 403 distributing corporations that disclosed diversity information in 2020 to meet the new Canada Business Corporations Act (CBCA) regulations, only 0.3 per cent of 2,411 board directors were Indigenous and only 0.2 per cent of 2,158 individuals in senior management positions were Indigenous.
- While over 1 in 5 people reported belonging to a visible minority group in Canada in 2016, only about 1 in 8 SMEs were majority-owned by visible minorities in 2017.
- In mid-May 2019, visible minorities were underrepresented as police officers (8 per cent) and recruits (11 per cent).
- Members of visible minorities held 4 per cent of board seats and 9 per cent of senior management positions among the 403 distributing corporations that disclosed diversity data in 2020.
- According to the Annual Report Card 2018, published by the Canadian Board Diversity Council, only 1 per cent of board directors self-identified as LGBTQ2.
- Although over 1 in 5 people reported a disability in 2016, SMEs were rarely majority-owned by persons with a disability (1 per cent) in 2017.
- Only 0.3 per cent of board seats and 0.6 per cent of senior management positions among the 403 distributing corporations that disclosed data in 2020 were held by persons with disabilities.
COVID-19 has had a disproportionate impact on women, especially racialized women. Beyond all the direct impacts, their underrepresentation in politics, business, and justice has meant that their voices are muted in many political and economic discussions. This has created additional challenges in securing the change needed to help women and diverse groups overcome systemic barriers and discrimination.
Women, however, have taken a leading role in the charitable and non-profit sector. According to a recent report by the YWCA, organizations in this sector employ over 2.4 million people in Canada, 70 per cent of whom are women. Of that, Canada’s human and community service organizations employ approximately 315,000 people.
Governments play a key role in facilitating and encouraging improved gender equality in politics, business, and justice. To support and build toward gender equality and diversity in Canada’s public institutions, the federal government introduced a commitment to selecting Governor in Council appointees that are reflective of Canada’s diversity in terms of linguistic, regional, and employment equity groups in open, transparent and merit-based processes in February 2016. And, more recently, to support gender equality and diversity in business, the federal government launched the 50-30 Challenge, an initiative that asks that organizations aspire to gender parity on their boards and in senior management and to significant representation of other underrepresented groups. As of April 13, 2021, there were 1,172 participating organizations. For similar reasons, the federal government also recently introduced new disclosure requirements for gender and diversity concerning director and senior manager positions and diversity policies in corporations governed by the Canada Business Corporations Act.
Since women’s entrepreneurship reflects broader industrial gender segregation patterns in the economy, business owners who are women have also been particularly negatively affected by the pandemic, as have business owners who are racialized Canadians. Structural barriers for many women entrepreneurs amplified the greater impacts of the pandemic.
Reflecting that the needs of women entrepreneurs are unique, the Women Entrepreneurship Strategy was introduced to increase women-owned businesses’ access to the financing, talent, networks and expertise they need to start up, scale up and access new markets. The Task Force on Women and the Economy and other stakeholders have emphasized that the support networks and financing needs of women entrepreneurs are often different from those of men, with women valuing wraparound supports and smaller amounts of funding.
Recognizing that there continue to be challenges for women and diverse groups in attaining and maintaining positions of leadership, the government has introduced a number of Budget 2021 measures, including:
- Accelerating the Women’s Entrepreneurship Strategy.
- Providing additional funding to support the Black Entrepreneurship Program.
- Consultations on corporate governance diversity in federally regulated financial institutions.
- Supporting small and medium-sized businesses including non-profit and charitable social enterprises through enhancements to the Canada Small Businesses Financing Program.
- Legislative amendments to the Public Service Employment Act to address potential bias and barriers in staffing processes.
- Investing in companies led by Canadians from typically underrepresented groups through a new Inclusive Growth Stream of the Venture Capital Catalyst Initiative.
- Additional Indigenous Business Supports to increase opportunities for Indigenous entrepreneurs to start and grow their businesses, and increase the proportion of Indigenous businesses owned and operated by Indigenous women.
- Strengthening Indigenous voices in federal decision-making by supporting their capacity to engage in federal consulations and engagements.
- Supporting Indigenous Governance and Capacity for First Nations communities with the most acute needs, resulting in better administration and access to services and programs.
- Supporting entrepreneurs, including underrepresented entrepreneurs through the Small Business and Entrepreneurship Development Program.
For the details of the impacts of these and more Budget 2021 measures that advance the Leadership and Democratic Participation Pillar, please see the Impacts Report.

Gender Results Framework
Gender-Based Violence and Access to Justice
Eliminating gender-based violence and harassment, and promoting security of the person and access to justice
Gender-based violence has long-lasting, negative health, social, and economic effects that span generations, often leading to cycles of violence within families and potentially whole communities. All Canadians should be safe and free from physical, emotional or sexual violence, discrimination, and harassment, regardless of where they live.
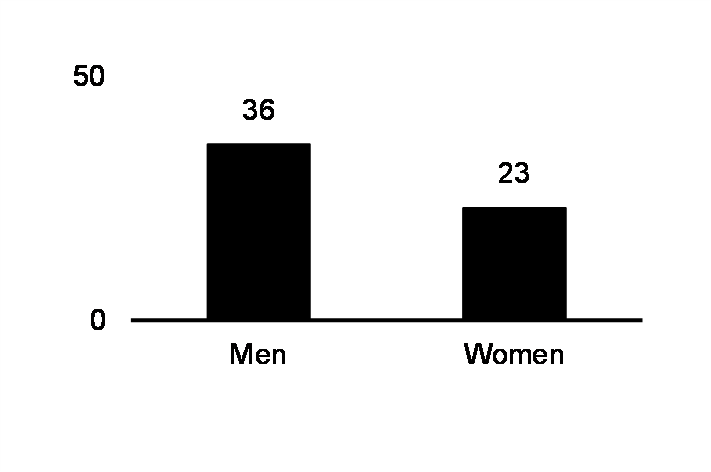
Share self-reporting harassment in the workplace in past year in 2016.
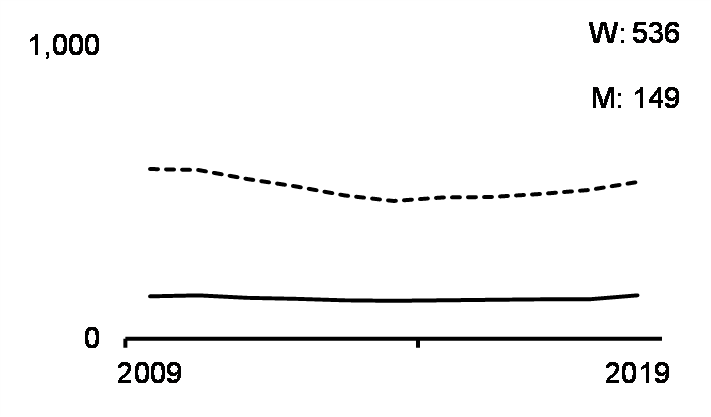
Police-reported intimate partner violence, rate per 100K population.
Share self-reporting sexual assault in 2018.
Share aged 15+ self-reporting childhood abuse in 2018.
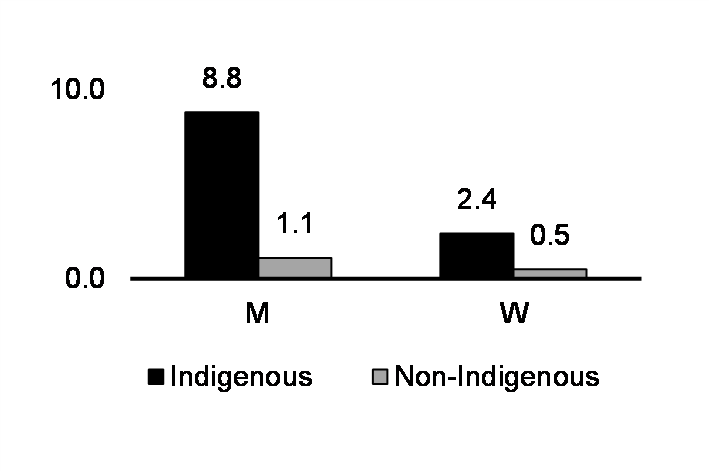
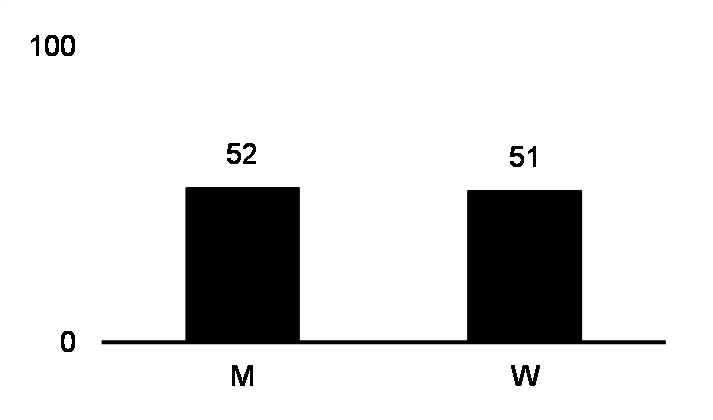
Homicide rates per 100K population in 2019.
| M | W | |
|---|---|---|
| Intimate partner | 6 | 47 |
| Other family member | 15 | 26 |
| Other relationship | 52 | 13 |
| Stranger or unknown | 26 | 13 |
Share of homicides by relationship to perpetrator in 2019.
Share of violent victimization reported to police in 2014.
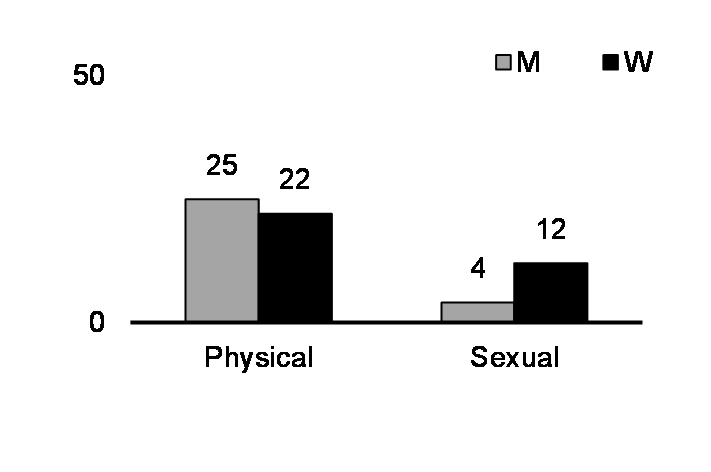
| Sexual | Physical | |
|---|---|---|
| First Nations | 48 | 45 |
| Métis | 40 | 44 |
| Inuit | 25 | 26 |
| Non-Indigenous | 26 | 30 |
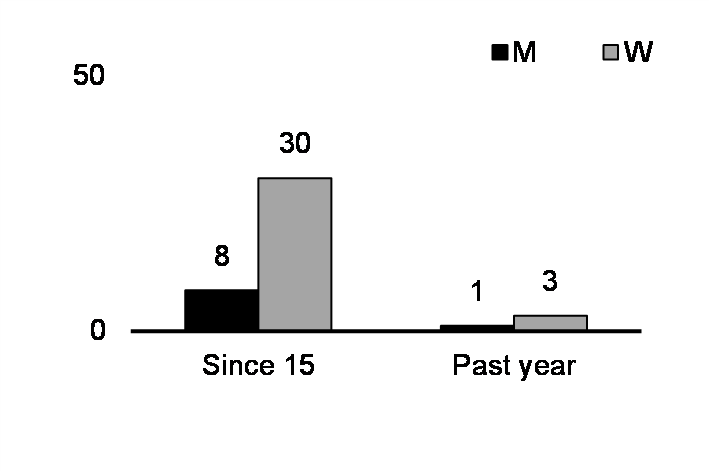
Share self-reporting assault since age 15 years in 2018.
Per cent of incidents of sexual assault deemed to be unfounded.
Sources: 2016 General Social Survey, Uniform Crime Reporting Survey, 2018 Survey of Safety in Public and Private Spaces, Homicide Survey, 2014 General Social Survey.
Gender-based violence is defined as violence that is committed against someone based on their gender identity, gender expression, or perceived gender and includes a range of behaviours from unwanted sexual attention, harassment, and neglect, to physical and sexual assault, and homicide. Experiences of gender-based violence are quite common in Canada, with women reporting about 536 incidents of police-reported intimate partner violence per 100,000 population in 2019 and about 1 in 3 women reporting in 2018 that they had experienced at least one incident sexual assault since the age of 15 years.
Some groups of women and girls are disproportionately affected by gender-based violence, including Indigenous women and girls, Black women, and LGBTQ2 community members. For example, in 2018, 43 per cent of Indigenous women reported experiencing sexual assault since the age of 15 years, compared to 26 per cent of non-Indigenous women. Those living in northern, rural, and remote communities and people with disabilities are also at an elevated risk of experiencing gender-based violence.
Diversity Focus
- In 2016, Indigenous women were more likely to report workplace sexual harassment in the past 12 months (10 per cent) than non-Indigenous women (4 per cent).
- In a 2018 survey, more First Nations and Métis adults reported experiences of childhood abuse than Inuit and non-Indigenous people.
- Compared to non-Indigenous women, Indigenous women were more than three times as likely to self-report an experience of spousal violence between 2009 and 2014. Indigenous victims of spousal violence were also more likely to report the most severe forms of spousal violence.
- When surveyed in 2018, visible minority men and women were slightly less likely to report experiences of childhood abuse. In this same survey, they were much less likely to report adult experiences of physical or sexual assault.
- In 2014, recent experiences of spousal violence were reported slightly less often by people belonging to a visible minority group than by those that did not.
- Immigrants reported adult experiences of physical or sexual assault since age 15 years less often than non-immigrants when asked in 2018, but were only marginally less likely to report experiences of childhood abuse.
- In a 2016 survey, lesbian and bisexual women reported elevated rates of sexual harassment at work compared to heterosexual women.
- Transgender individuals reported inappropriate workplace behaviour (69 per cent) in a 2018 survey at three times the rate of cisgender individuals (23 per cent).
- Gay, lesbian, and bisexual people reported higher rates of childhood abuse than heterosexual people when surveyed in 2018. They were also more like to report experiences of physical or sexual assault since age 15 years.
- In this same 2018 survey, transgender people were significantly more likely to report having had experiences of physical or sexual assault since age 15 years (59 per cent) than cisgender people (37 per cent).
- When asked in 2018, persons with disabilities were more likely to report having experienced physical or sexual assault as adults than persons without disabilities, with women with disabilities reporting sexual assault since age 15 years at three times the rate of men with disabilities. People with disabilities were also more likely to report experiencing childhood abuse.
COVID-19 and the resulting financial stresses and self-isolation has created conditions that led to a rise in intimate partner and family violence. Increased call volume at violence help lines and a rise in the number of calls for police services related to domestic disturbances and disputes indicate that gender-based violence was exacerbated by the public health crisis. Recognizing that many Canadians' safety was at risk during the pandemic, the Government of Canada acted quickly to ensure that front-line organizations that support women and families facing violence had the resources they needed to keep their doors open and continue providing their vital services, with dedicated funding for those organizations serving Indigenous women both on and off reserve.
Like many of the other structural challenges faced by women, eliminating gender-based violence will take sustained efforts over the long-term, as it is firmly grounded in gender and social norms around femininity and masculinity, including patriarchal views of the family, sexism, and gendered expectations regarding behaviour.
Knowing that many women and girls continue to face violence, the government has made significant investments towards eliminating gender-based violence and supporting victims and survivors, including through the It's Time: Canada's Strategy to Prevent and Address Gender-Based Violence. Federal government actions have also included introducing a National Framework to Prevent Gender-Based Violence on Campus, changes to the treatment of unfounded sexual assault cases, and legislation to ensure that federally regulated workers are protected from workplace harassment. In 2019, the federal government also introduced its National Strategy to Combat Human Trafficking.
Improving access to and confidence in the justice system is also key to supporting survivors of gender-based violence and other acts of physical, sexual, or psychological harm or suffering, such as race-based hate crimes. And it is vital to a safe and secure Canada.
Recent federal government actions and investments to improve access to justice and build confidence in the justice system have included boosting legal aid to support victims of sexual harassment in the workplace, amending legislation to increase access to family justice in the official language of one's choice, investing in an assessment of the impact of race and culture on sentencing, and supporting the growing demand for Public Legal Education and Information Services.
To continue to address the ongoing challenges related to gender-based violence in Canada, and the structural and systemic barriers that limit access to justice for many disadvantaged groups, the government has introduced a range of Budget 2021 measures, some of which include:
- Expanding the work of the Department of National Defence and Veterans Affairs Canada to eliminate sexual misconduct and gender-based violence in the military and support survivors.
- Increasing funding for provinces and territories to divert youth away from the justice system.
- Supporting Indigenous policing and community safety.
- Improving access to justice for Indigenous peoples.
- Addressing systemic racism in institutions.
- Supporting a range of measures to end the national tragedy of missing and murdered Indigenous women and girls.
- Supporting community-based organizations and the LGBTQ2 Secretariat to advance greater equality for LGBTQ2 communities.
- Enhancing access to legal support for racialized communities.
- Advancing a National Action Plan to End Gender-Based Violence to support at-risk populations and survivors and ensure that victims have reliable and timely access to protection and services.
For the details of the impacts of these and more Budget 2021 measures which advance the Gender-Based Violence and Access to Justice Pillar, please see the Impacts Report.

Gender Results Framework
Poverty Reduction, Health and Well-Being
Reduced poverty and improved health outcomes
All Canadians should have their basic needs met, access to good quality health care, and know that action is being taken to reduce poverty and create new opportunities for a better quality of life.
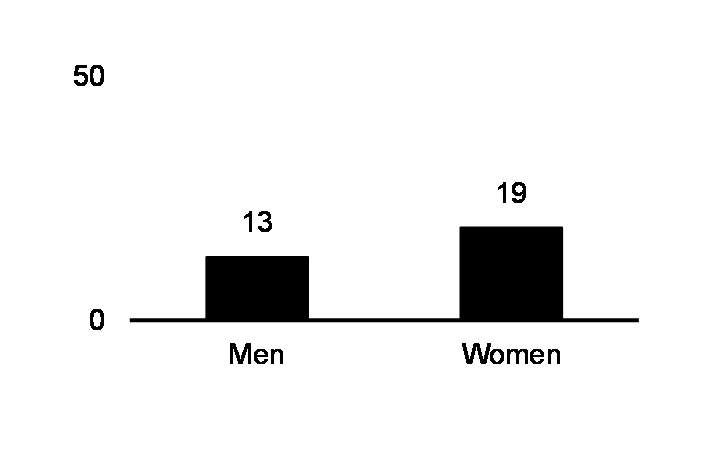
Share below the Official Poverty Line.
| M | W | |
|---|---|---|
| Living alone | 12 | 12 |
| Lone parent | 16 | 25 |
| All households | 9 | 9 |
| Couple, no kids | 3 | 3 |
| Couple, with kids | 7 | 7 |
| M | W | |
|---|---|---|
| All Canadians | 9 | 10 |
| Living alone | 19 | 19 |
| Lone parent family | 17 | 30 |
| Seniors | 8 | 11 |
Spousal and child support order payment collection rate.
| M | W | |
|---|---|---|
| Cancer | 1 | 1 |
| Heart diseases | 2 | 2 |
| Accidents | 3 | 5 |
| Chronic lower respiratory | 4 | 4 |
| Cerebrovascular | 5 | 3 |
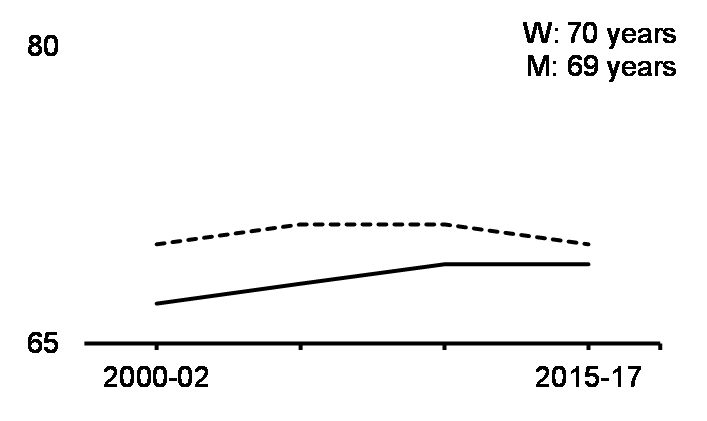
Health-adjusted life expectancy at birth.
Share aged 15+ participating in sports regularly in past year in 2016.
Share aged 12+ reporting very good or excellent mental health.
Number of live births per 1,000 females aged 15-19 years.
Sources: Canadian Income Survey, Canadian Community Health Survey, Survey of Maintenance and Enforcement Programs, Vital Statistics Death and Birth Databases, 2016 General Social Survey.
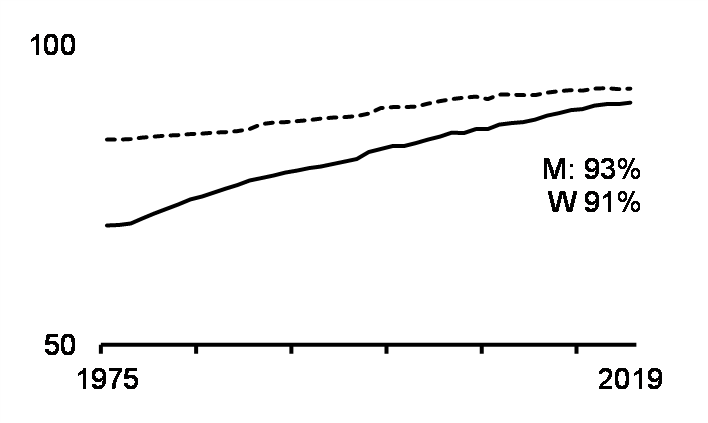
Poverty, especially long-term poverty, has deep and wide-ranging impacts. Individuals living with low income have a lower life expectancy, higher rates of suicide, as well as higher rates of heart disease, chronic conditions, and mental health issues. Poor mental and physical health – whether as a result of poverty or not – may affect an individual's well-being and earnings potential, and result in economic losses for individuals, families, and society.
In Canada, poverty and poor health are challenges faced by many, but some subgroups are at greater risk than others. For example, poverty is more prevalent among recent immigrants and racialized people, while poor mental health is more prevalent among Indigenous peoples and LGBTQ2 Canadians.
The prevalence of low wage, low quality jobs in certain sectors of the economy can also contribute to the incidence of poverty, and these low wage, low quality jobs are themselves the result of a number of factors, including the absence of bargaining power among workers, as evidenced by the decline of private sector unions, low or limited growth in real minimum wages, a rising return to investments in education and skills, and increased automation and globalization. Since women are more likely than men to be employed in low wage, part time, and precarious jobs, women are more at risk of being among the working poor.
Diversity Focus
- Indigenous people faced higher poverty rates (20 per cent) than non-Indigenous people (10 per cent) in 2018.
- Off-reserve Indigenous people reported lower levels of mental health in 2017-18 than non-Indigenous people.
- In 2016, Indigenous men reported regularly participating in sports less often than non-Indigenous men, but there were no notable differences for women.
- In 2017-18, people belonging to a visible minority group reported similar levels of positive (very good or excellent) mental health as those not belonging to a visible minority group.
- Poverty rates were higher among the visible minority population in 2016. West Asian Canadians had the highest poverty rates, but rates were also elevated among Arab, Korean, Black, and Chinese Canadians.
- Visible minority women regularly participated in sports less often than their counterparts in 2016, while visible minority men participated slightly more.
- Recent immigrants faced higher poverty rates (20 per cent) than non-recent immigrants in 2018.
- Immigrants and those born in Canada were nearly equally likely to report very good or excellent mental health in 2017-18.
- Compared to people born in Canada, immigrant individuals were less likely to regularly participate in sports in 2016.
- Bisexual women had the lowest rates of positive mental health in 2017-18, followed by bisexual men. Gay men and lesbian women had higher rates than bisexual men and women, but lower rates than heterosexual women, who themselves had lower rates than heterosexual men.
- In 2016, gay men and bisexual women reported regularly participating in sports less often than heterosexual men and heterosexual women.
- Transgender individuals had higher rates of negative mental health in 2018 and were significantly more likely to report having seriously contemplated suicide (45 per cent) than cisgender individuals (16 per cent).
- Persons with a disability had elevated poverty rates in 2017 (17 per cent), especially if they simultaneously belonged to another at-risk group.
- Babies born into the lowest income quintile in 2015-17 could expect to live about eight years less than those born into the highest income quintile.
- Mental health was worse among low-income people in 2017-18.
- People with less than a high school diploma had worse mental health in 2017-18 than those with a Bachelor's degree or higher.
The economic and health crisis brought on by COVID-19 and related public health measures has had devastating impacts on the physical and mental health and financial well-being of huge numbers of Canadians. As public health restrictions reduced social contacts, mental health declined and many Canadians increased their use of substances. Even for those Canadians fortunate enough to avoid COVID-19, physical health has still been negatively impacted as sports were cancelled and gyms were closed. And, although Canadians have been supported by strong and responsive income programs, like the Canada Response Benefit, which helped offset the income and employment effects of the pandemic, many Canadians continue to suffer from unemployment or face challenges meeting their essential needs.
While the Government has supported a comprehensive response to the pandemic, it has long been committed to policies aimed at reducing poverty, providing access to affordable housing and making investments in healthy communities. For example, recent investments in the Canada Child Benefit helped lift more than 400,000 children out of poverty, while an expansion of the Rental Construction Financing Initiative helped to increase the supply of affordable rental housing, and a redesigned federal homelessness program, called Reaching Home, helped to support people without access to safe and secure housing. Federal government actions also included supporting a Pan-Canadian Suicide Prevention Service with bilingual, 24/7 crisis support from trained responders and enhancing the response to the opioid crisis.
To support Canadians at risk of or facing poverty, food insecurity and core housing need as a result of the pandemic, the federal government has introduced a Canada Child Benefit and special GST Credit top-up payment, enhanced funding for the Reaching Home initiative, and supported food banks and other organizations providing hunger relief to affected individuals. Other actions have included additional investments for Distress Centres and the introduction of the Wellness Together Canada Portal to support Canadians struggling with mental health or a substance use disorder.
In the context of future actions to support a pandemic recovery, members of the Task Force on Women in the Economy have emphasized the issue of precarious work and the importance of policies to support better wages and working conditions, such as changes to minimum wage laws and paid sick leave. They also stressed the need over the long term for modernization of Canada's income support programs, such as Employment Insurance, the Canada Workers Benefit, and disability supports.
"The economic, health and social impacts of COVID-19 have been devastating for the communities we work with. From the loss of steady jobs to child care shortages to addressing discrimination, hate and violence in all its forms, we are seeing we can't go back to the old ways of doing things. We need a fresh approach that thinks about the economy and gender equity together."
To respond to immediate and ongoing challenges related to poverty, health and well-being, the government has introduced a number of Budget 2021 measures, including:
- Establishing a $15 federal minimum wage.
- Maintaining flexible access to Employment Insurance benefits as the labour market begins to improve.
- Emergency funding for homelessness programs to protect vulnerable Canadians experiencing – or at risk of – homelessness.
- Continued funding to emergency hunger relief organizations supporting food security for vulnerable Canadians.
- Supporting community organizations to improve access to sexual and reproductive health care information and services.
- Addressing the opioid crisis and problematic substance use by supporting a range of innovative approaches to harm reduction, treatment, and prevention.
- Extending the Racialized Newcomer Women Pilot.
- Enhancing the Canada Workers Benefit, which could provide about $1,000 more a year to low-wage, full-time workers and lift close to 100,000 Canadians out of poverty.
- Increasing funding for public health measures and the Indigenous Community Support Fund to respond to the immediate needs of Indigenous communities.
- Supporting communities in providing services for Indigenous peoples dealing with mental health issues through a distinctions-based mental wellness strategy.
- Investments in mental health to support populations disproportionately impacted by COVID-19 and to develop national mental health standards.
- Establishing a National Institute for Women's Health Research.
- Extending Employment Insurance Sickness Benefits to better support Canadians suffering from illness or injury
For the details of the impacts of these and more Budget 2021 measures which advance the Poverty Reduction, Health and Well-Being Pillar, please see the Impacts Report.

Gender Results Framework
Gender Equality Around the World
Promoting gender equality to build a more peaceful, inclusive, rules-based and prosperous
world
Full and equal access to resources, opportunities and security for women and girls around the world can lead to greater prosperity, improved quality of life, and peace and security for everyone. Women and girls are powerful agents of change and can improve their own lives and the lives of their families, communities and countries.
Share of UN peacekeeping personnel who are women.
Share of seats held by women in national parliaments globally.
Screened bilateral allocable aid targeted toward gender equality.
Share of girls in 31 countries who experienced genital mutilation.
Share of women aged 15-49 years using contraceptives.
- Canada-United States-Mexico Agreement
- Comprehensive and Progressive Agreement for Trans-Pacific Partnership
Canada-EU Comprehensive Economic and Trade Agreement - Canada-Chile FTA
- Canada-Israel FTA
Countries without equal spousal administrative authority over assets.
| Low- and middle-income countries | |
|---|---|
Americas |
30 |
Africa |
37 |
Europe |
25 |
Eastern Mediterranean |
37 |
South-East Asia |
38 |
Western Pacific |
25 |
| High-income countries | 23 |
Literacy rate of youth aged 15-24 years.
Sources: United Nations, Inter-Parliamentary Union, OECD, UNICEF, World Bank, WHO.
Gender equality around the world has continued to improve as international organizations and governments recognize the importance of the empowerment of women and girls. Not only is gender equality a fundamental human right but there is significant evidence that unlocking the potential of all women and girls is the most effective way to reduce poverty and create a world that is more inclusive, more peaceful and more prosperous.
Although significant progress has been made in many countries around the world over the last two decades, there are still millions of women and girls who continue to be held back from achieving their full potential due to unequal access to resources, opportunities, and security. These inequalities start at birth and follow women throughout their lives. For example, in many countries, boys receive access to health care, nutrition, and education to the detriment of girls. All combined, the impact of a preference for boys and men over girls and women has led to an estimated 100 million women missing due to excessive mortality. In addition, in 41 countries, inheritance laws do not treat daughters and sons equally; in 38 countries, there are no laws prohibiting the dismissal of pregnant workers; and in 32 countries, there is no legislation specifically addressing domestic violence.
Gender-based violence and sexual exploitation also continue to act as significant barriers to women and girls around the world. For example, 12 million girls are married before reaching adulthood each year, almost one in three women has experienced intimate partner violence, and over 200 million women and girls in 31 countries have experienced female genital mutilation.
To help in the fight for global gender equality and women's rights, the federal government undertook a number of important actions, including supporting the implementation of Canada's Feminist International Assistance Policy through the International Assistance Envelope, welcoming an extra 1,000 vulnerable women and girls from various conflict zones around the world as government-assisted refugees, launching Her Voice, Her Choice, to enable the fight against sexual and gender-based violence, and helping women's organizations and networks in over 30 developing countries through the Women's Voice and Leadership Program. Canada also took to the world stage as a leader in advancing gender equality by creating the G7's first Gender Equality Advisory Council and leading G7 partners in committing to meaningful action to help improve the lives of women and girls around the world, co-hosting the first formal Women Foreign Ministers' Meeting, and leading trade missions supporting women-owned businesses through the Business Women in International Trade program, as well as launching a new Partnership for Gender Equality, bringing together the Government of Canada, the philanthropic community, the private sector and civil society.
During the COVID-19 pandemic, the challenges that women around the world were already facing have been amplified. Unpaid care work – predominantly carried out by women – increased as schools and child care services closed, more meals needed to be cooked at home, and public health authorities recommended more cleaning and disinfecting. Access to modern contraceptives and family planning diminished due in part to the diversion of resources away from sexual and reproductive health services and in part due to public health restrictions that limited access to or temporarily cancelled certain services, leading to a rise in unintended pregnancies and maternal mortality. Job losses and economic hardships have been felt across the globe but are particularly affecting women as 40 per cent of all working women, globally, are in the sectors that have been most impacted by the pandemic. And, crucially, job loss impacts have the potential to be particularly traumatizing for women, who traditionally earn less, save less, and have less financial independence than men. Poor working conditions in many women-dominated health-care related jobs, such as nursing, have also put many women at greater risk of transmission. Finally, shortfalls in humanitarian aid funding amid the COVID-19 pandemic may have placed millions of women and children fleeing violence at risk of starvation. Recognizing the uneven impact of COVID-19 on women, the government has committed to ensuring that international efforts to fight the pandemic are invested in line with the Feminist International Assistance Policy.
As long as gender equality around the world remains elusive, Canada will have a role to play in eliminating barriers to equality and helping to create better opportunities for women and girls. Recognizing this, Budget 2021 proposes the following measures:
- Extending the Middle East Strategy for another year.
- Addressing growing international humanitarian assistance needs around the world.
- Additional funding for the Canadian Ombudsperson for Responsible Enterprise (CORE).
- Further enhancing Canada's contribution to the International COVID-19 Response.
- Supporting Canada's response to the Rohingya crisis and the situation in Myanmar.
- Sustaining Canada's effort on the Venezuelan migrant and refugee crisis.
For the details of the impacts of these Budget 2021 measures, please see the Impacts Report.
Summary of Budget 2021 Gender and Diversity Impacts
This year's budget is about securing the recovery and building a strong, more inclusive and more resilient economy. This government is committed to evidence-based decision making and taking into account impacts on people from a variety of perspectives. This approach has guided all decisions taken on the COVID-19 Economic Response Plan as well as all investments made in this budget.
Following the approach introduced in Budget 2019, the remainder of this chapter provides a summary of the impacts of the budget as a whole. This analysis is complemented by the comprehensive analysis of the impacts of individual budget measures in terms of gender, diversity and other factors as found in the Budget 2021 Impacts Report.
Timing of GBA+ and Responsive Approaches
When GBA+ was First Performed
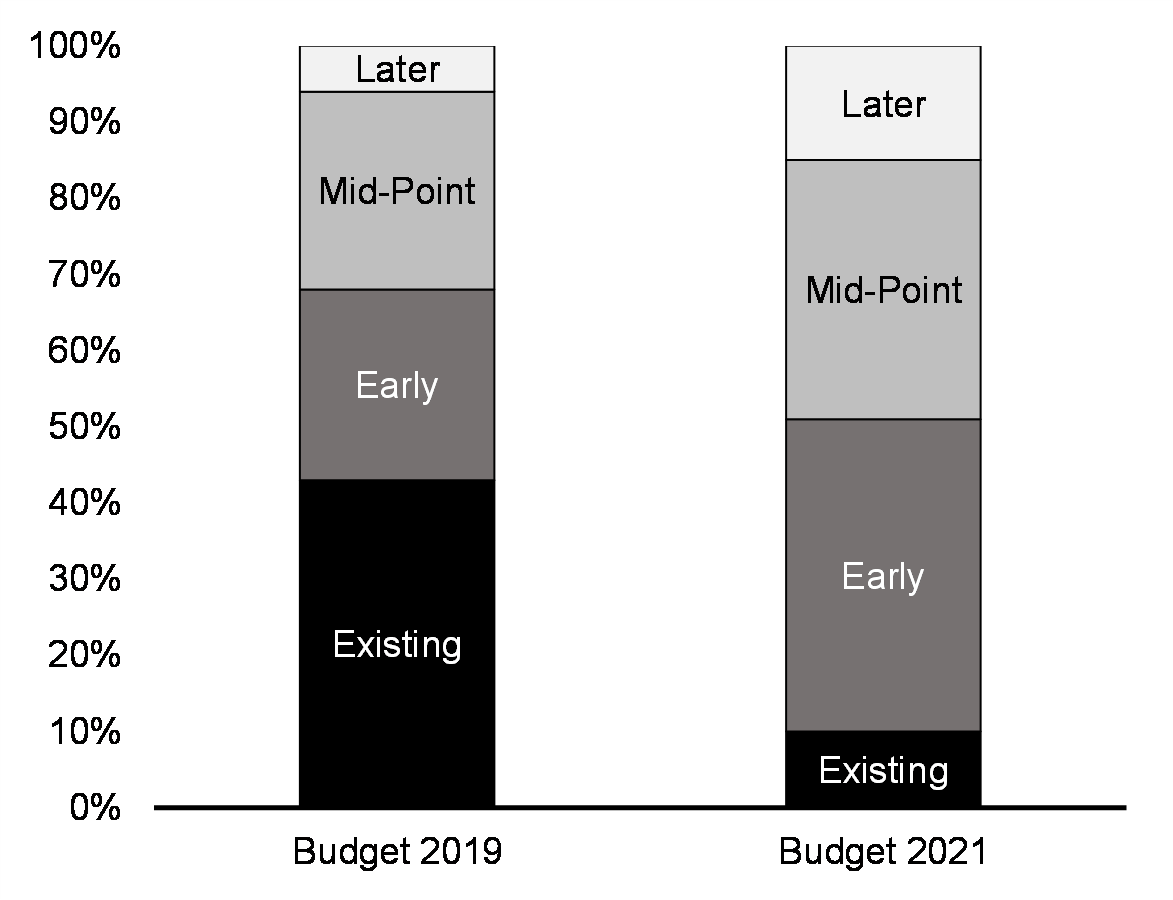
Budget 2021 saw a greater proportion of GBA+ being performed in earlier stages, which is indicative of the continuous efforts the government is making to integrate gender and diversity considerations in policy development. There remains room for further improvement, however, considering the number of measures that are still reporting this analysis being performed at the later stages.
Responsive Approaches
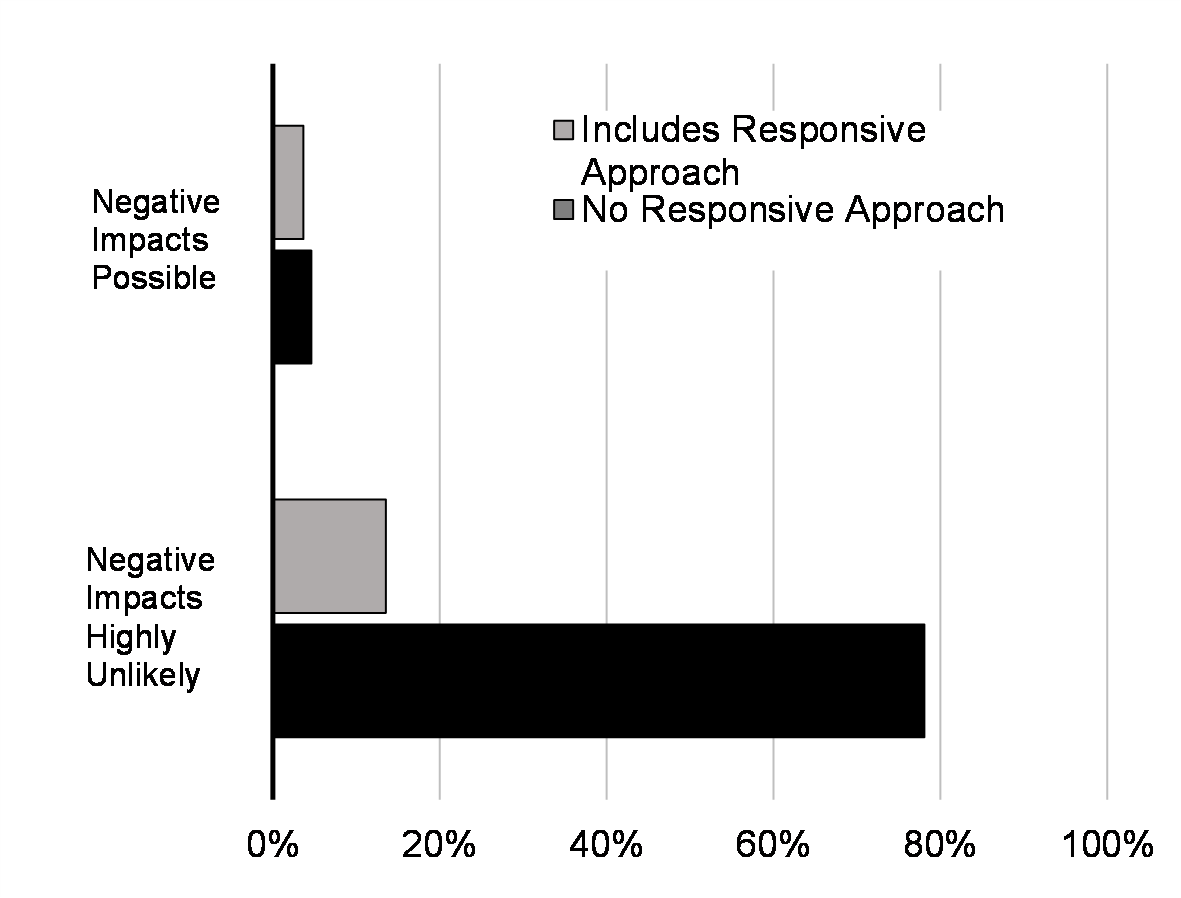
A key purpose of conducting a GBA+ is to identify barriers to access or unintended negative impacts for specific groups so that mitigation strategies or responsive approaches can be developed to respond to these. Just under 10 per cent of measures identified a possible negative impact on some groups. For roughly half of these measures, a responsive approach was developed. Where negative impacts were identified as unlikely, over 15 per cent of measures incorporated a proactive approach to reduce potential barriers to access, up from 8 per cent in Budget 2019. Other measures were explicitly targeted at vulnerable groups.
Target Population
Share of Budget 2021 Investments
($ value of measures*)
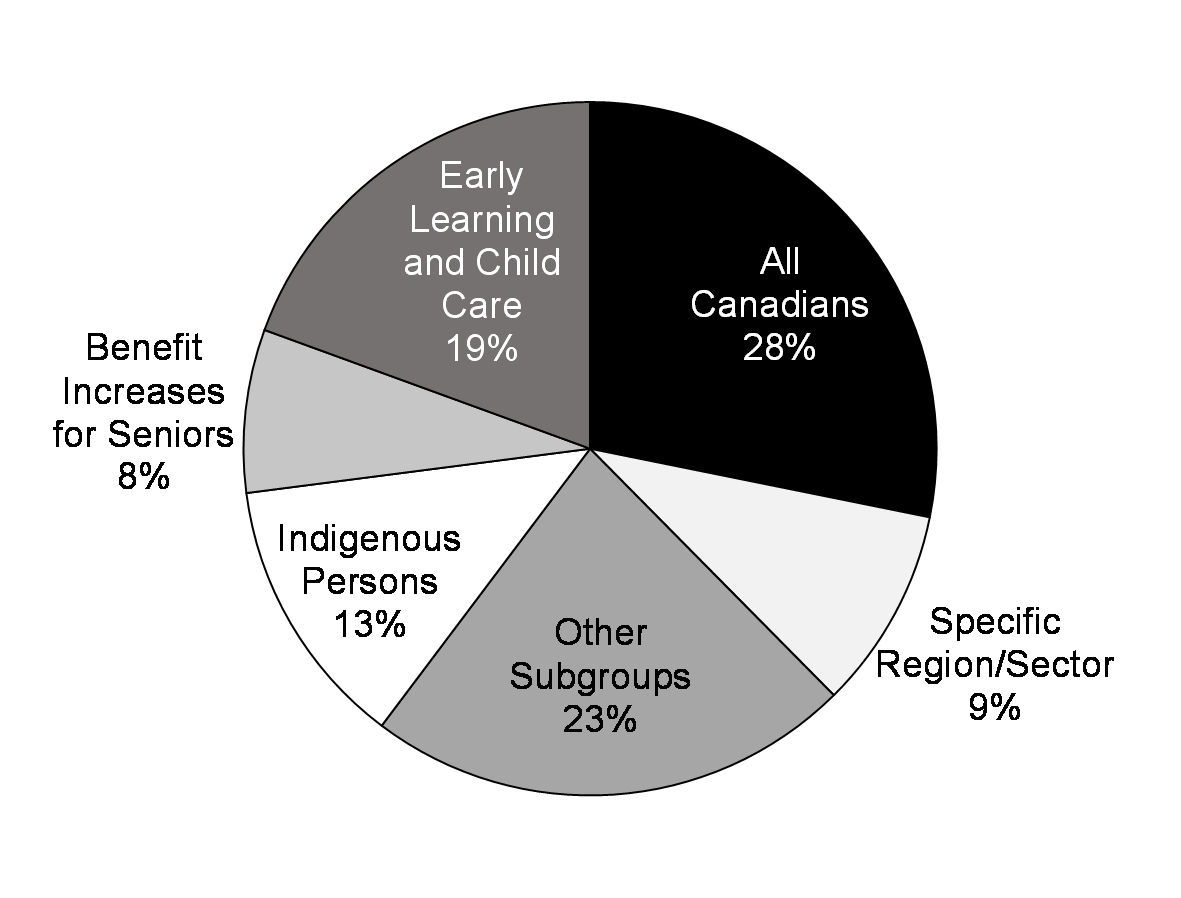
While many measures in the budget are aimed at all Canadians (28 per cent of the budget), some measures target support to a specific group of the population or region/ sector (9 per cent). Targeted support is aimed at challenges or opportunities unique to subgroups of Canadians. For example, this year's budget includes significant support for Indigenous communities and businesses (13 per cent of the budget) and beneficiaries of two specific measures: early learning and child care i.e. women and families with young children (19 per cent) and benefit increases for seniors i.e. seniors age 75+ (8 per cent).
Expected Benefits: Gender
Share of Budget 2021 Investments
($ value of measures*)
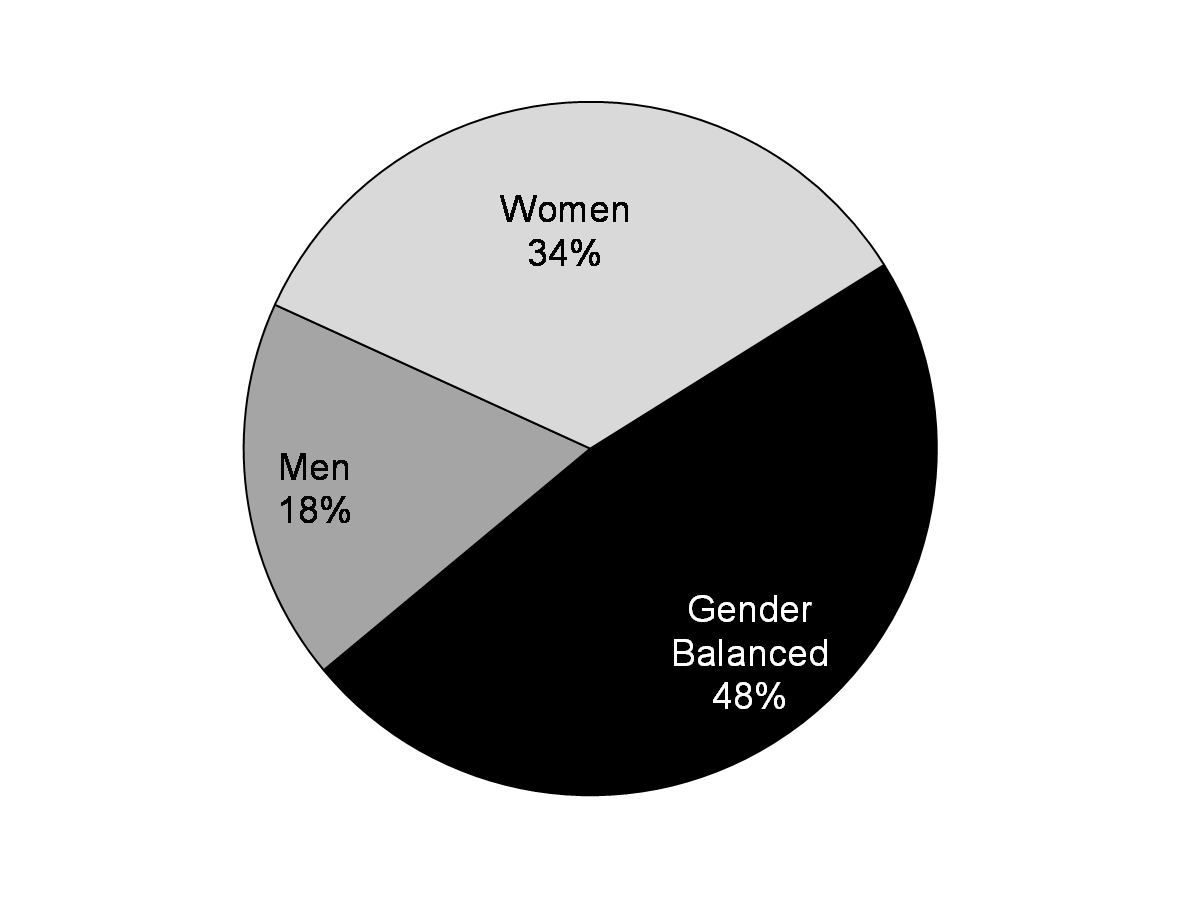
A large percentage of Budget 2021 directly benefits women and men in equal proportions (48 per cent), while others carry benefits that are likely to disproportionately benefit women or men. A significant proportion (34 per cent) of this year's budget is expected to directly benefit women. In particular this reflects up to $30 billion in investments to Establish a Canada-Wide Early Learning and Child Care System which will directly create jobs for women and will support women's labour market participation and their responsibilities as caregivers. Other measures in Budget 2021 will address challenges faced more by men, for example Ending Homelesness (men represent 72 per cent of shelter users).
Expected Benefits: Additional Characteristics
Expected Benefits by Subgroup,
Number of Measures
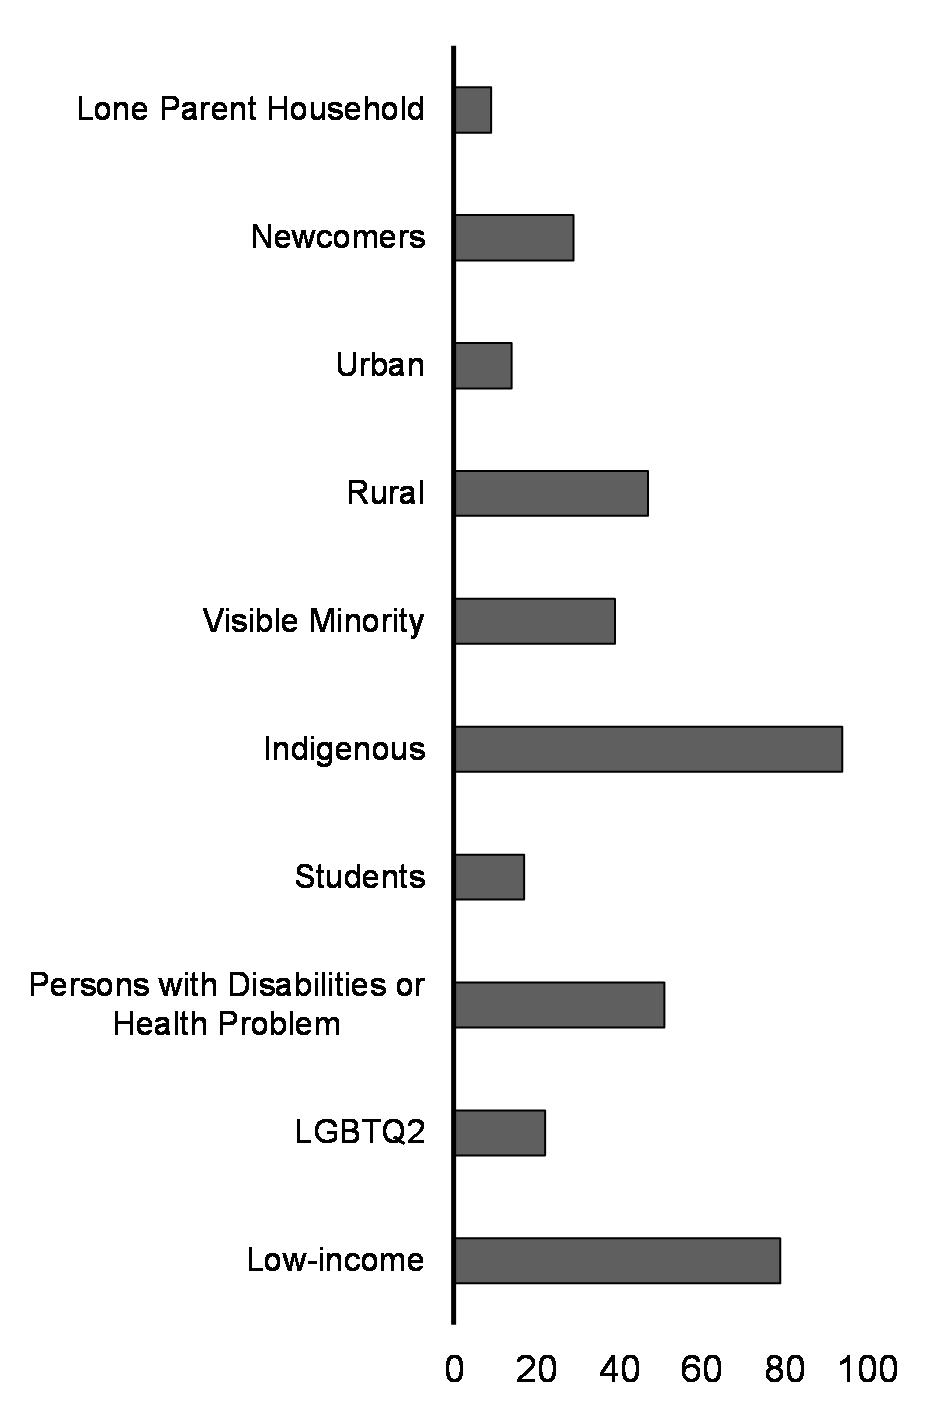
Budget measures were assessed in terms of expected direct and indirect benefits by various subgroups of Canadians. A number of measures in this budget are identified as helping Indigenous peoples, rural Canadians, and visible minorities. For example, Indigenous Early Learning and Child Care is expected to benefit Indigenous women, children and families while efforts to strengthen the Canadian Race Relations Foundation are expected to benefit racialized communities. Budget measures can also carry benefits for more than one group – for instance, improving Food Security of Vulnerable Canadians is expected to benefit Black, Indigenous and northern communities as well as low-income Canadians and lone-parent families.
Expected Benefits: Intergenerational and Income Distribution Impacts
Expected Intergenerational Impacts, Share of Budget 2021 Investments
($ value of measures*)
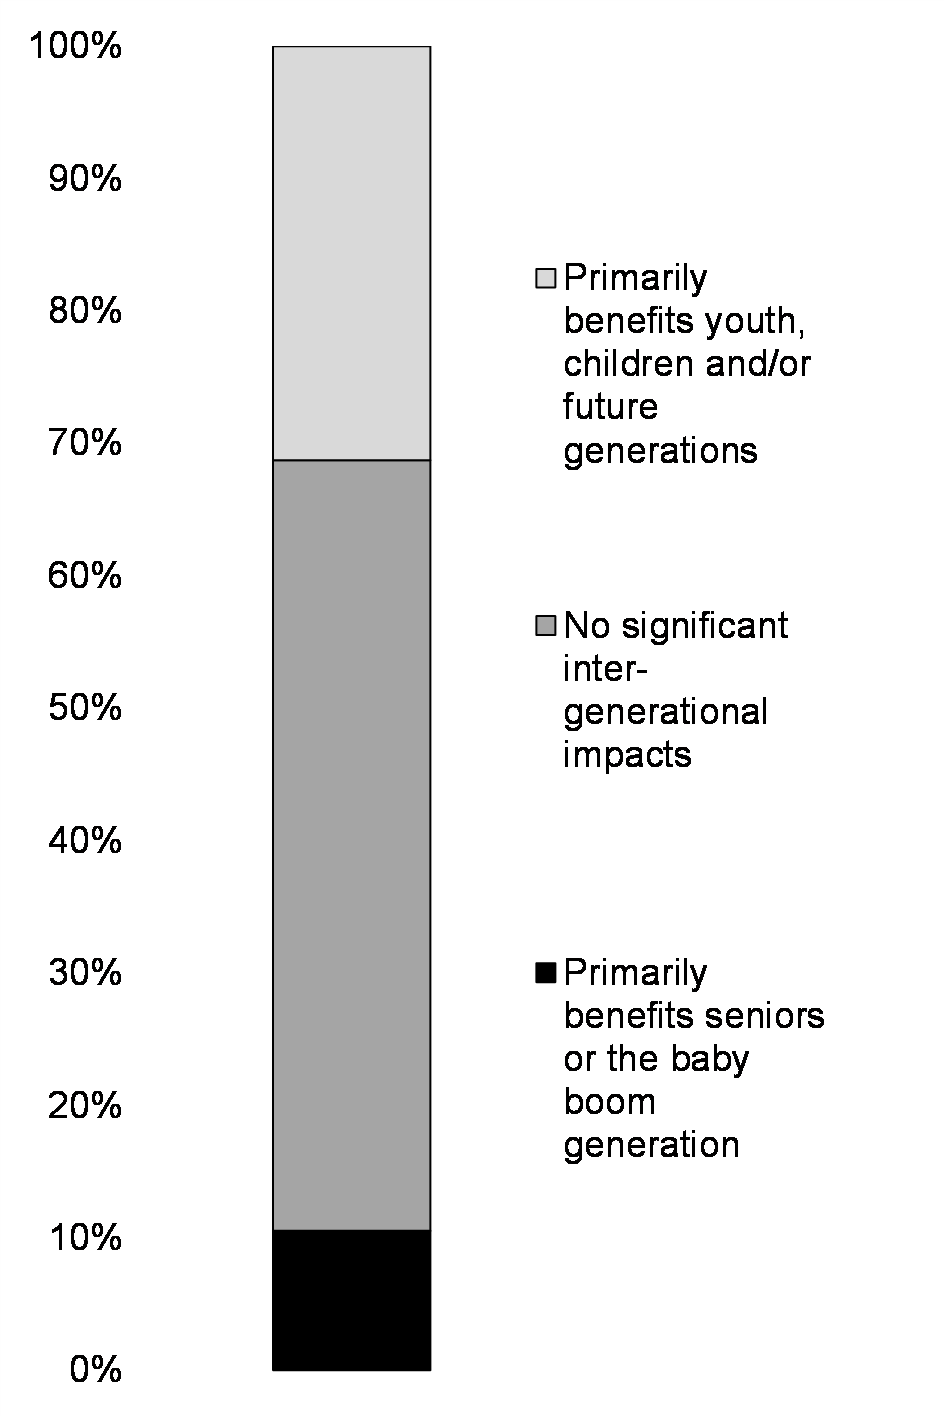
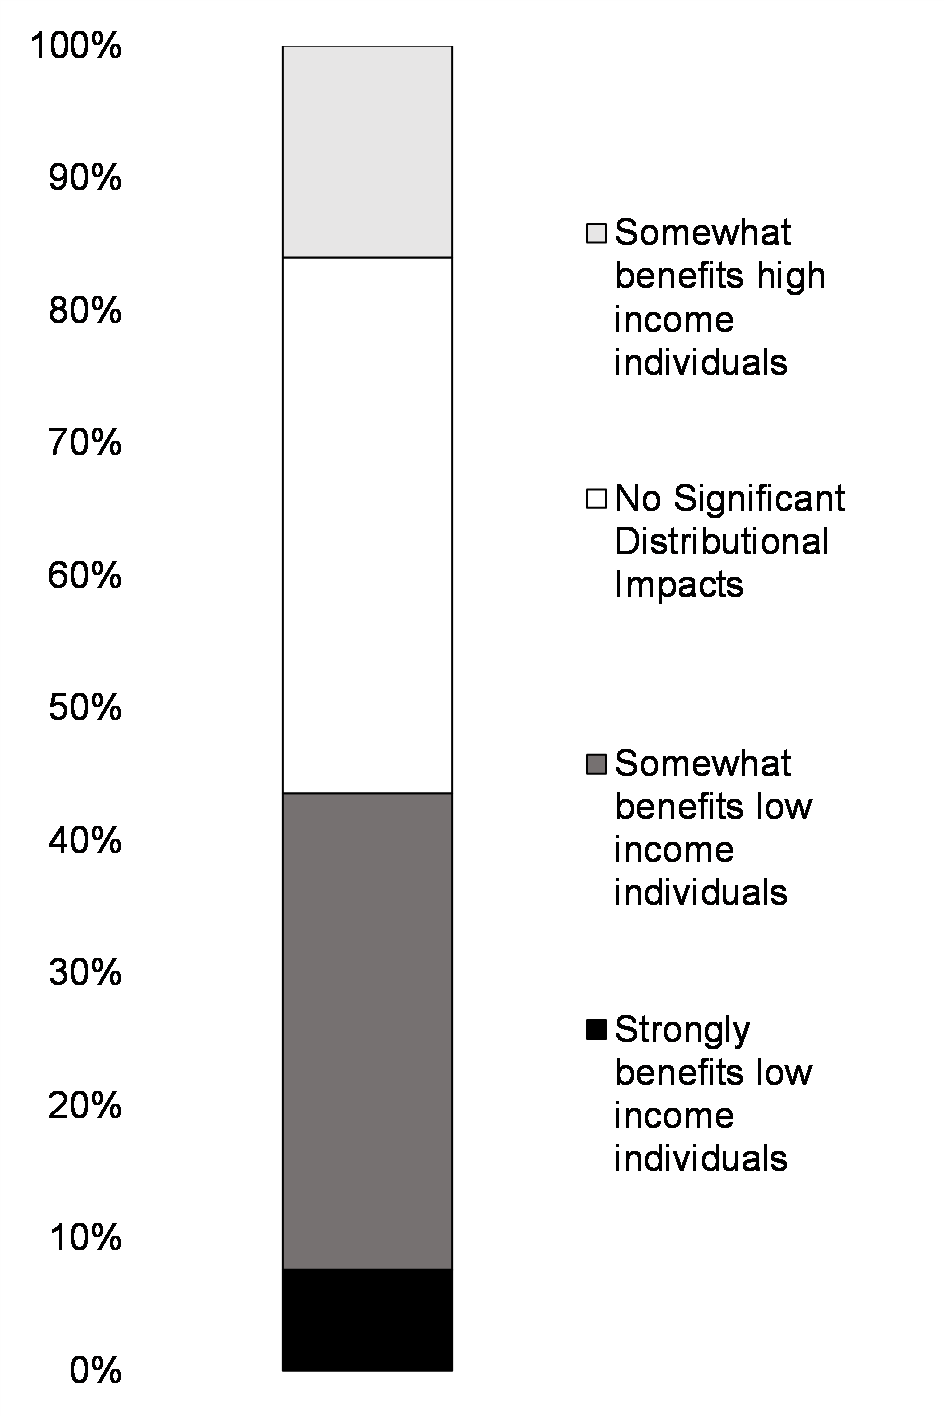
Expected Income Distribution Impacts, Share of Budget 2021 Investments
($ value of measures*)
Budget 2021 measures were also evaluated with respect to how they affected Canadians at different generational and income levels. More than half of Budget 2021 investments are expected to benefit Canadians broadly equally across generations. A significant share (30 per cent) are expected to particularly benefit youth or future generations. For example, Supporting Internships and Growing Businesses through Mitacs directly benefits youth entering the labour market by expanding access to work-integrated learning opportunities for post-secondary students. This category in part also reflects many of the environmental budget measures, such as Historic Investments in Canada's Natural Legacy which are designed to benefit all Canadians, but assessed as particularly benefitting youth and future generations given that the ultimate impacts of climate change and loss of biodiversity will not be felt for several years.
A large proportion of the budget benefits lower-income Canadians. For example, enhancements to the Canada's Workers Benefit will benefit three million low-and modest-income workers through direct income support and by promoting longer term attachment to the labour force. A smaller portion of the budget is expected to benefit higher income Canadians. For example, Growing Zero-emission Technology Manufacturing will benefit all Canadians in the long term but immediate benefits will accrue to higher income technology manufacturers as these groups receive disproportionately large amounts of investment income.
Measuring What Matters: Quality of Life
The Government of Canada is working to better incorporate quality of life measurements into decision-making and budgeting based on international best practice, expert engagement, evidence on what shapes well-being, and public opinion research on what matters to Canadians.
The Government of Canada has made important progress over the years in understanding how societal trends and budget investments affect people differently. A logical next step is to focus more on the nature of these impacts. This means assessing progress on multiple fronts so decisions about priorities and investments are based on evidence of what will most improve Canadians' quality of life.
The COVID-19 pandemic has affected many dimensions of Canadians' quality of life, from health impacts and job losses to mental health and social isolation. Inequalities in our society and gaps in our social safety net have been revealed, and many Canadians are reflecting on what they value most. Governments are also assessing how best to promote recovery and build back better.
The experience of the pandemic in Canada and around the world has highlighted the importance of thinking "beyond GDP." It has long been understood that standard measures of economic progress like GDP do not capture the full range of the factors that, evidence shows, determine a good quality of life. GDP tells us how overall economic activity is growing, but little about how growth is distributed across our society. It fails to account for non-market economic activity, like care responsibilities, and environmental harms.
Recognizing the importance of factors beyond GDP does not imply a reduced focus on investing in a strong economy or prudent fiscal management; in fact these are critical to achieving and sustaining quality of life. Increasing Canada's GDP through productivity growth, labour market participation, and investment is crucial for raising Canada's national standard of living now and into the future.
"One in two Canadians (53%) feel that stronger growth in Canada's GDP is important to their day-to-day life. However, far more (82%) feel that measures beyond economic growth such as health and safety, access to education, access to clean water, time for extracurricular and leisure activities, life satisfaction, social connections, and equality of access to public services are important to their day-to-day life. In fact, nearly three quarters (71%) of respondents feel it is important that the government move past solely considering traditional economic measurements like levels of economic growth, and also consider other factors like health, safety, and the environment when it makes decisions."
Objectives of the Quality of Life Framework for Canada
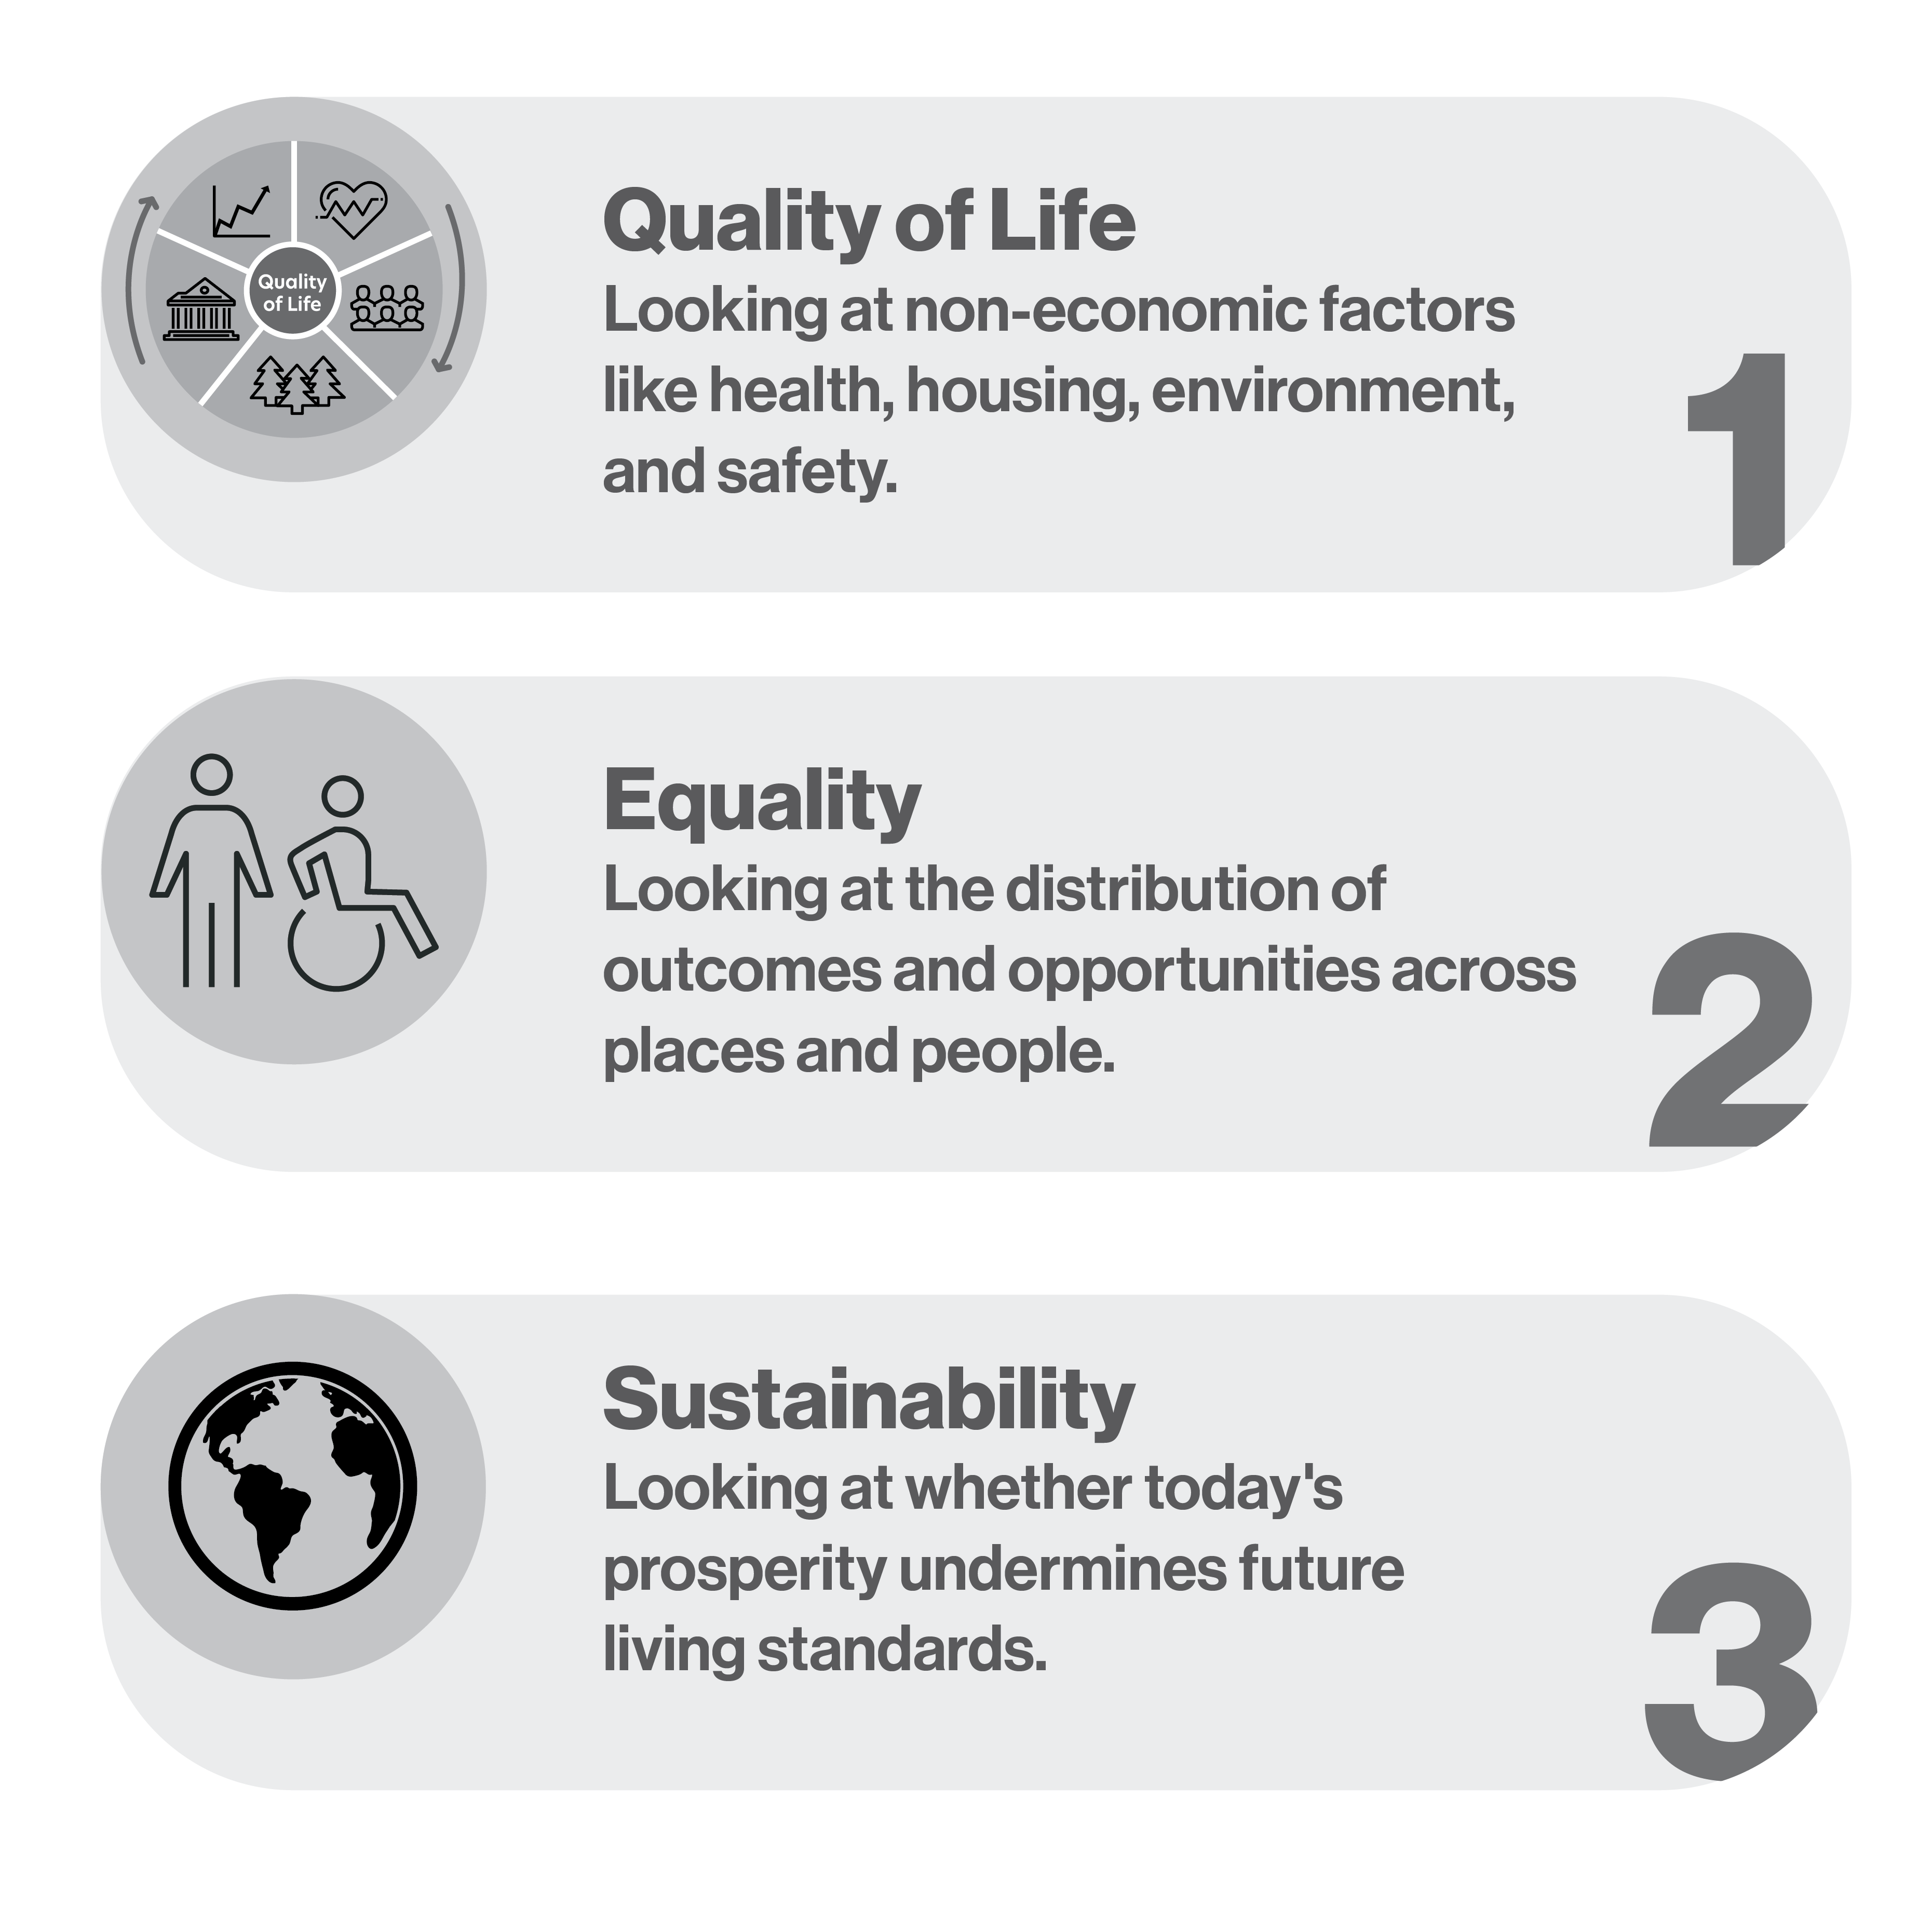
While economic growth is important, there is now growing international interest in adopting broader measures of progress for decision-making. Building on the OECD's "Better Life Initiative," more than half of its member countries now have "quality of life" or "well-being" policy initiatives. These differ in design and application, but share a common ethos: 1) a well-functioning society should focus on the well-being of its citizens, 2) the distribution of outcomes across society matters, and 3) governments should aim to achieve sustainable outcomes over time.
Governments have generally developed frameworks that track a set of indicators to monitor how the country is faring from a quality of life standpoint, using this evidence inform better policy and funding decisions based on the greatest opportunities for cost-effective interventions.
With renewed attention on what Canadians value most, the pandemic offers an opportunity to "build back better" toward a society that is more prosperous, inclusive, and sustainable. Canada has been working towards these objectives prior to the pandemic, making important investments in long-term economic growth, poverty reduction and housing, and taking action on the climate crisis.
The OECD's Better Life Initiative develops statistics that capture aspects of life that matter to people and that help shape the quality of their lives.
In 2019, New Zealand released the world's first Well-being Budget based on the NZ Treasury's Living Standards Framework, setting well-being priorities at the outset of the annual budget cycle.
Scotland's National Performance Framework articulates outcomes related to quality of life and sustainability, aligning the efforts of the public, private and not-for-profit sectors to achieve them.
In 2020, France announced its green budgeting initiative, evaluating its national budget against its Paris Agreement objectives.
A quality of life framework can bring together these and other objectives, such as social cohesion and resilience. This integrated approach can serve as a north star for policy development and budgeting; articulating priorities based on what matters most for Canadians' quality of life. Work to do this is well underway. In December 2019, the Minister of Middle Class Prosperity and Associate Minister of Finance was tasked with better integrating quality of life measurements into decision-making and budgeting. Guided by conversations with experts, nations that are advanced in their thinking about well-being, provinces and territories, Indigenous partners, and feedback from Canadians themselves, officials across the government have teamed up to create a draft "made-in-Canada" approach.
Architecture of the Quality of Life Framework for Canada
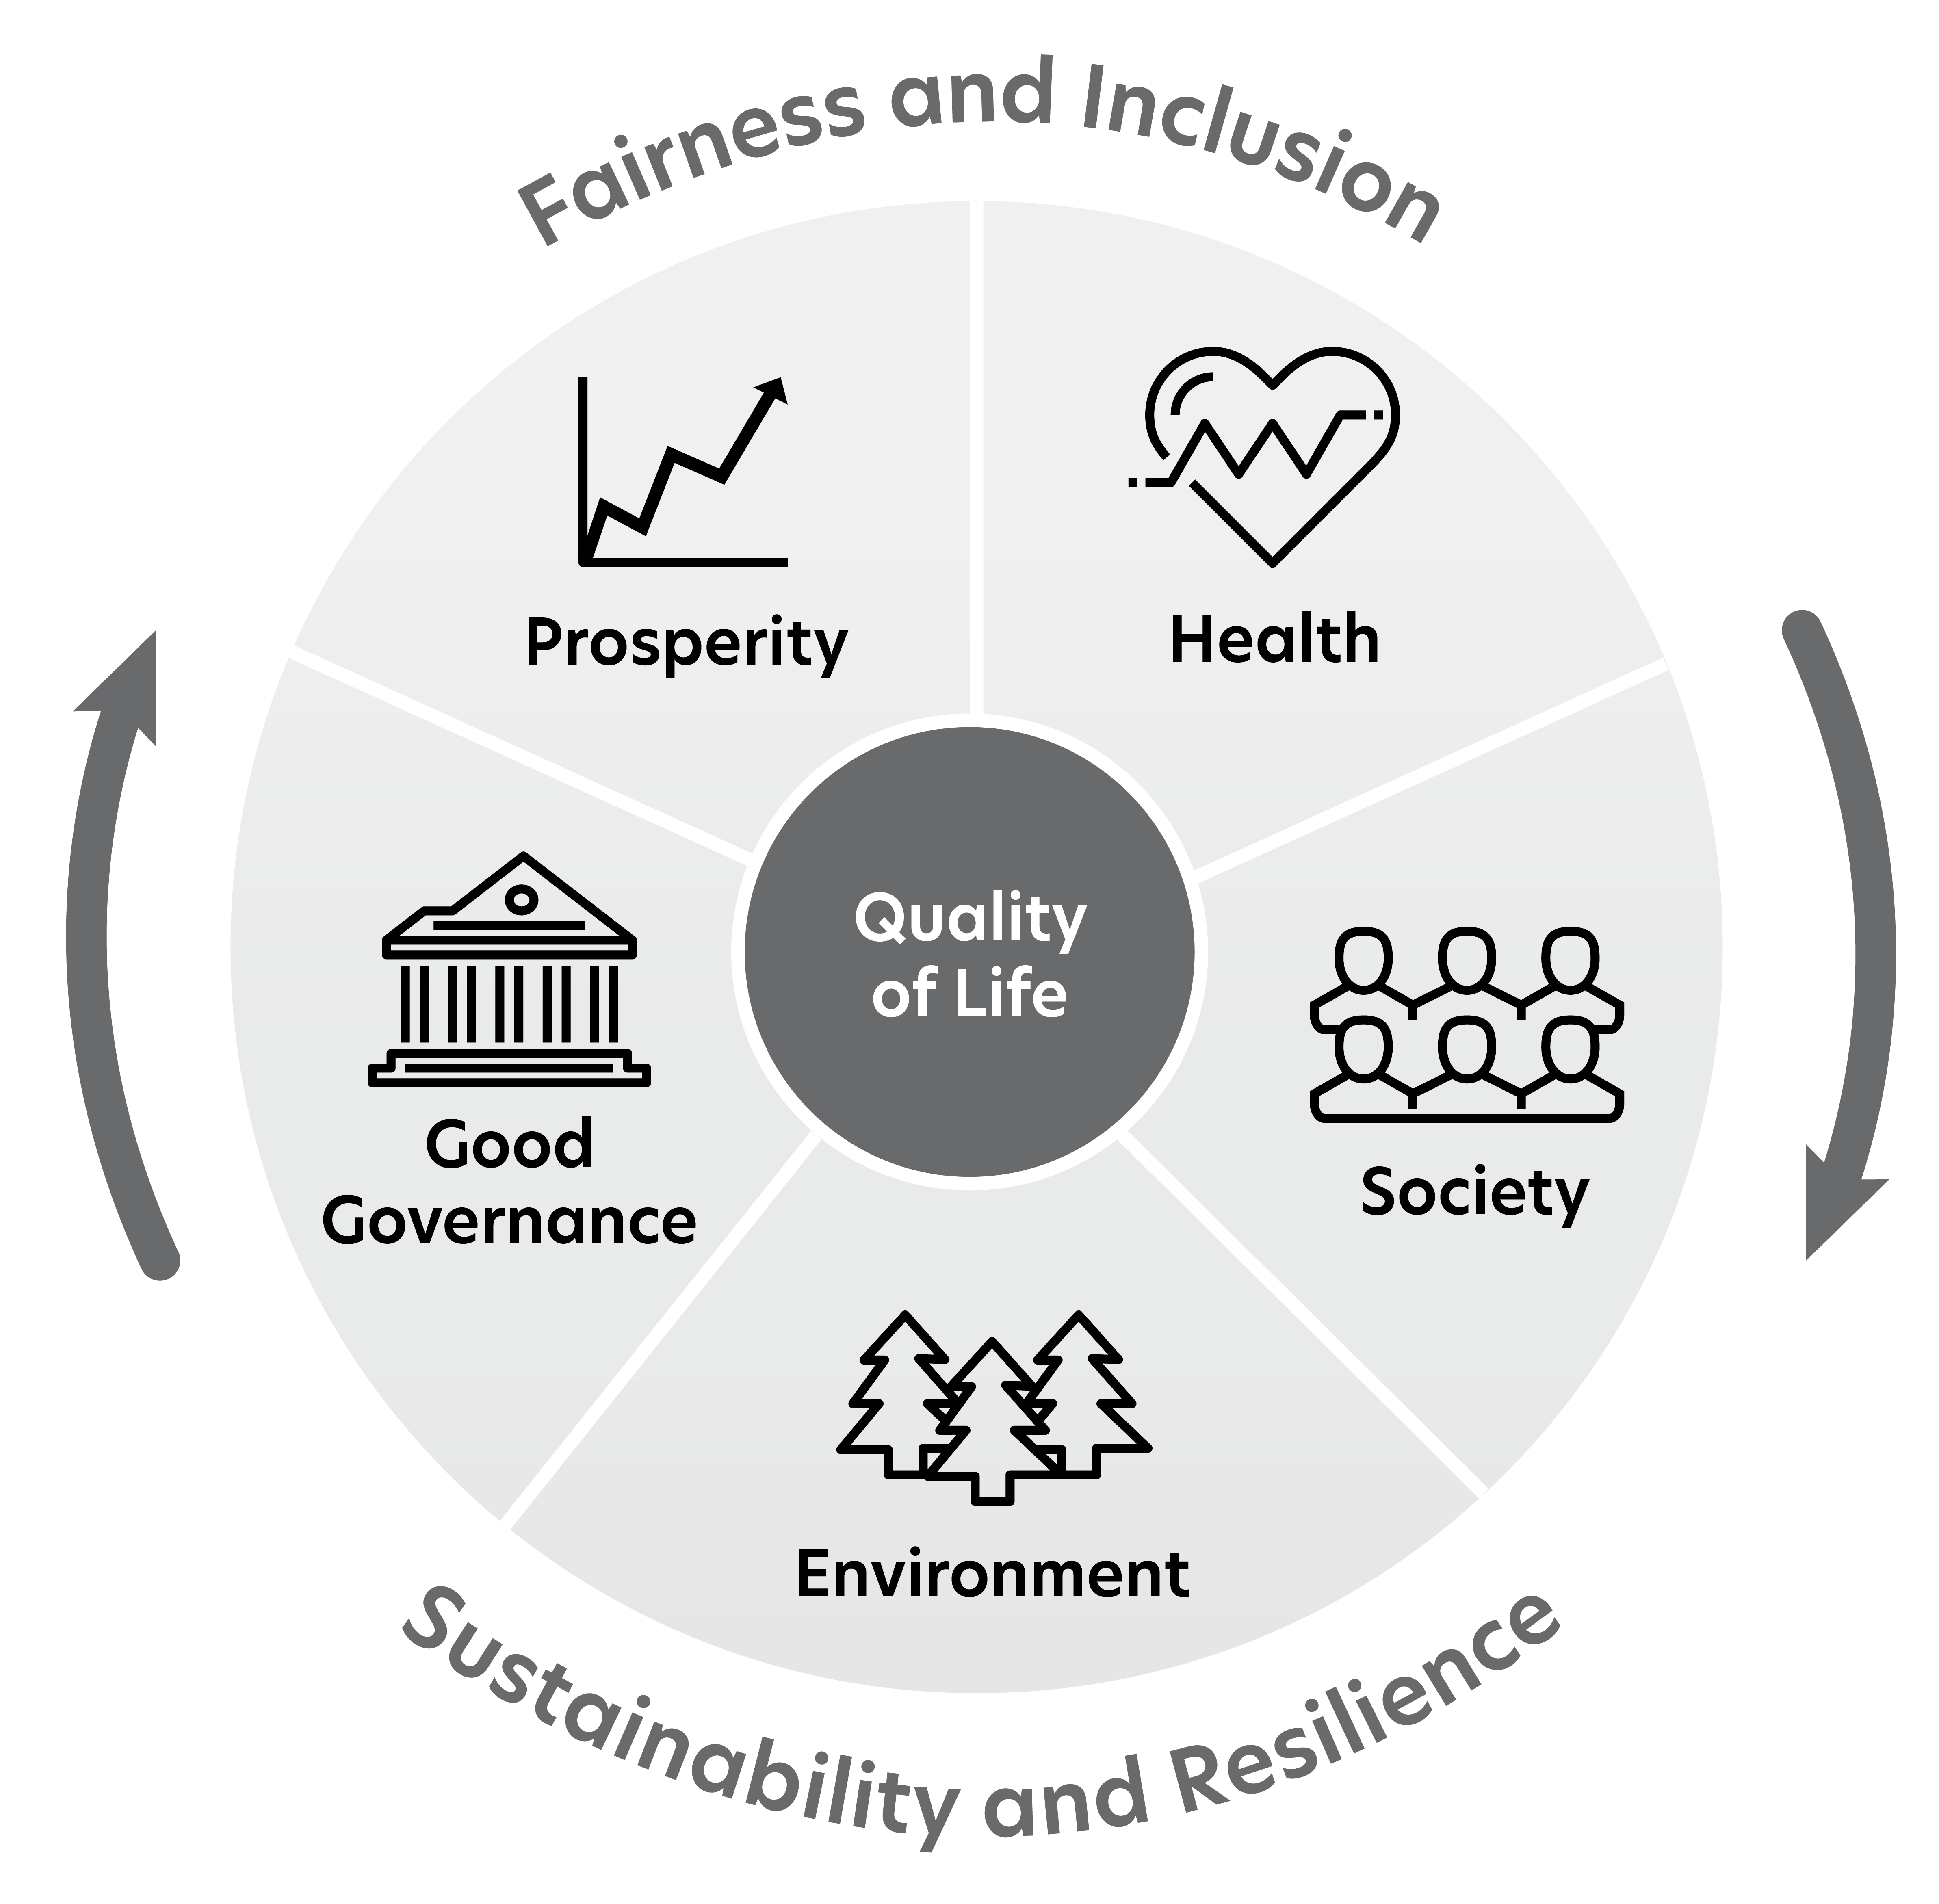
The Quality of Life Framework is based on evidence about the factors that matter most to Canadians: prosperity, health, environment, social cohesion, and good governance. It uses disaggregated data to look at the distribution of these outcomes through a "Fairness and Inclusion" lens, and considers long-term dynamics through a "Sustainability and Resilience" lens. You can learn more about the proposed framework in this discussion paper on the Department of Finance Canada website. Dialogue will continue on the framework and its evergreen set of indicators.
This framework is already beginning to inform decisions. Consideration of how each budget proposal affects the various dimensions and indicators of this framework helped achieve the right mix of measures with an appropriate focus on building a strong, inclusive and sustainable recovery. Moving forward, the framework will continue to underpin how we monitor progress in "building back better" to improve Canadians' quality of life now and into the future.
"Last but not least, hard-wiring well-being into policymaking could make an important contribution to "building back better". Our forthcoming Economic Survey looks at how measures of well-being can be used in policymaking. Canada's commitment to developing a well-being framework can help to ensure that the slogan of "building back better" is translated into an actionable set of outcomes and concrete measures."
Report a problem on this page
- Date modified: