
www.budget.canada.ca
Common menu bar links
- The Canadian economy has been expanding for 16 consecutive years
and our economic fundamentals are strong:
- The unemployment rate is at its lowest level in 33 years, with over 400,000 new jobs created since the end of 2006.
- Business and household finances are strong by historical and international standards.
- Federal and provincial-territorial governments remain in a strong fiscal position.
- Inflation remains low, stable and predictable.
- From this position of strength, the Government took decisive and timely action in the October 2007 Economic Statement to support the economy by providing permanent and sustainable broad-based tax relief to individuals and businesses, including to manufacturers.
- The actions taken in the Economic Statement provide more than $12 billion in incremental tax relief this year. Combined with actions taken by the Government since 2006, $21 billion in incremental tax relief—or 1.4 per cent of Canada’s economy—is being provided to Canadians and Canadian businesses this year.
- These actions will not only help bolster our economy in these uncertain times, they advance Advantage Canada , the Government’s economic plan to improve Canada’s longer-term competitiveness and secure the future of Canadians.
- As a result of weaker U.S. growth and ongoing financial market turbulence, private sector forecasters have revised down their outlook for the Canadian economy since the Economic Statement. Private sector forecasters expect real gross domestic product (GDP) growth of 1.7 per cent in 2008 and 2.4 per cent in 2009, down from 2.4 per cent and 2.7 per cent, respectively, at the time of the Economic Statement.
Note: This chapter incorporates data available up to February 12,
2008.
Figures in this chapter are at annual rates unless otherwise noted.
Overview
This chapter reviews recent domestic and international economic developments and prospects, describes the average private sector economic forecast that forms the basis for the fiscal projections, and discusses the risks and uncertainties associated with the economic outlook.
The fundamentals underpinning the Canadian economy remain strong. This strength, together with the decisive and timely tax relief announced in the October 2007 Economic Statement, will help Canada’s economy weather the economic challenges ahead. Indeed, current forecasts suggest that the Canadian economy will slow somewhat in the near term. This moderation reflects the materialization of some of the downside risks identified in the Economic Statement—particularly a weaker U.S. economy. Moreover, the outlook remains uncertain, given growing concerns about a larger-than-expected slowdown in the U.S. and uncertainty about the duration and impact of ongoing financial market turbulence.
Canadian Economic Developments
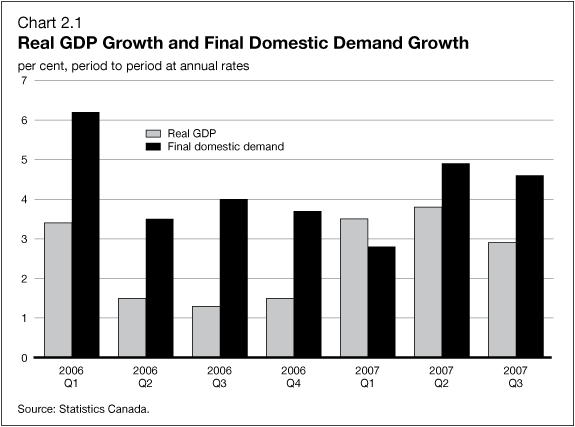
Growth in the Canadian economy has been strong. Through the first three quarters of 2007, the economy expanded at an average rate of 3.4 per cent. Strong final domestic demand has supported growth since 2001, reflecting rapid real income growth (Chart 2.1). Strong domestic demand growth reflected solid growth in consumption and non-residential investment as well as a healthy housing market, contrasting with falling residential investment in the U.S.
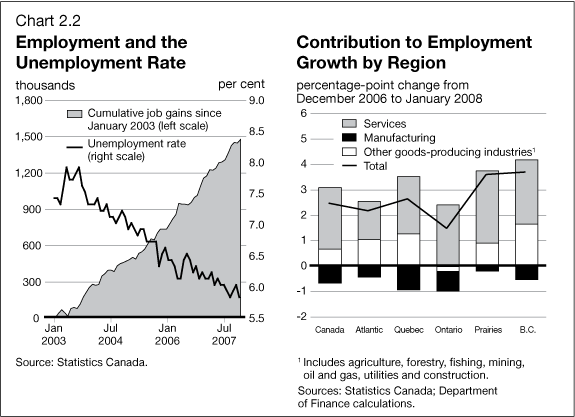
Labour markets remain healthy, with over 400,000 new jobs created since the end of 2006, including over 46,000 jobs created in January 2008. All regions of the country have benefited from this gain, and the national unemployment rate is down to its lowest level in 33 years (Chart 2.2). Employment growth has been particularly strong in B.C. and the Prairies, while weakness in manufacturing employment has been concentrated in Ontario and Quebec. Losses in the manufacturing sector, however, have been offset by strong gains in the service sector, particularly in high-wage industries such as professional, scientific and technical services and public administration.
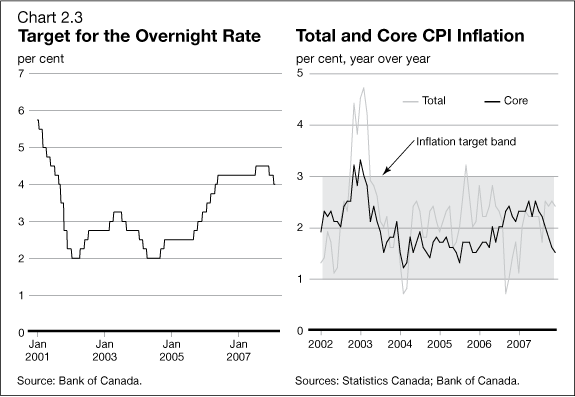
With inflation pressures well contained, and faced with further tightening in credit conditions and a weaker U.S. economy, the Bank of Canada lowered the target for the overnight rate (i.e. the key policy rate) by 25 basis points in both December 2007 and January 2008 (Chart 2.3). The Bank also indicated that "further monetary stimulus is likely to be required in the near term to keep aggregate supply and demand in balance and to return inflation to target over the medium term." Core Consumer Price Index (CPI) inflation—which excludes eight of the most volatile components of the overall index as well as the effect of indirect taxes, such as the Goods and Services Tax (GST)—has trended down to below the 2-per-cent target midpoint since September to reach 1.5 per cent in December, largely due to lower prices of imported goods as a result of the appreciation of the Canadian dollar.
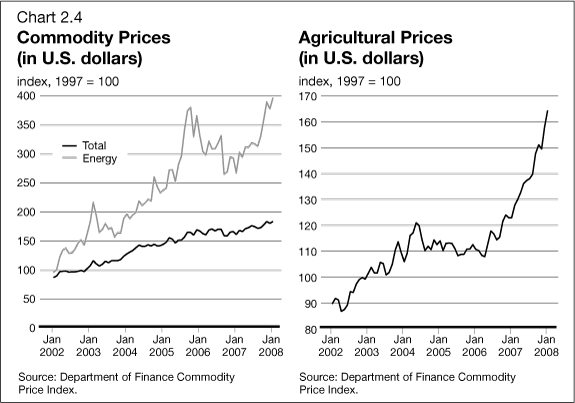
Sustained strength in global demand, combined with supply
constraints for agricultural commodities, base metals and crude oil,
has led to significant increases in commodity prices (Chart 2.4).
Since the beginning of 2006, the U.S. price of commodities produced in
Canada has increased over
11 per cent, led by higher prices for energy, grain and mineral
products. Prices of Canadian-produced commodities, which represent
40 per cent of the value of exported goods, are at record highs. While
these higher prices clearly benefit the Canadian economy, they do
raise input costs for producers in some sectors (for example,
non-energy manufacturing, forestry and livestock production).
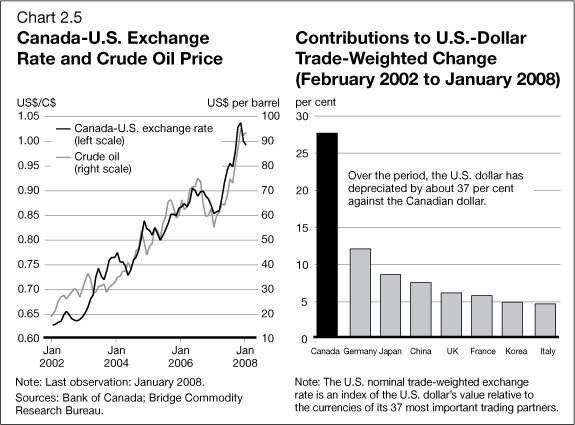
Strong growth in commodity prices has contributed to the significant appreciation of the Canadian dollar, which began early in 2002 (Chart 2.5). As well, the ongoing adjustment to global current account imbalances, which has resulted in U.S.-dollar weakness, has added to the strength of the Canadian dollar. Since the beginning of 2002, on a trade-weighted basis, the U.S. dollar has depreciated by 24 per cent against a broad group of currencies. Over this period, Canada has accounted for more of the U.S. depreciation than any other country, reflecting both the sharp increase in the Canada-U.S. exchange rate and Canada’s large share of U.S. trade.
The appreciation of the Canadian dollar has led to challenges for Canadian exporters, as discussed below. However, the strong dollar also brings some important benefits. For example, the stronger dollar has led to lower prices for imported capital goods, which in turn have led to a significant increase in real machinery and equipment (M&E) investment by Canadian businesses. This increase in M&E investment bodes well for future productivity growth.
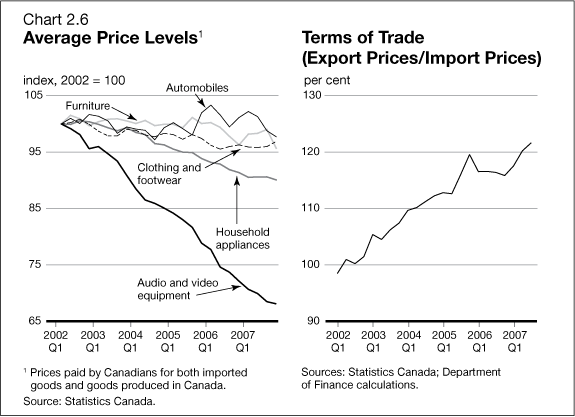
In addition, the prices of imported consumer goods have declined as a result of the rapid appreciation of the Canadian dollar and lower world prices for manufactured goods. Together with rising prices of Canadian-produced commodities, this has led to a sharp increase in Canada’s export prices relative to import prices—the terms of trade (Chart 2.6).
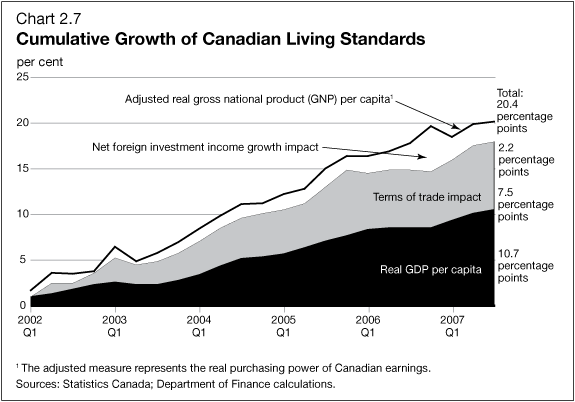
Sustained output growth and improvements in the terms of trade have contributed to a significant increase in Canadians’ living standards since the end of 2001. Canadians’ living standards have increased by more than 20 per cent since the end of 2001 (Chart 2.7). About half of this increase is due to growth in real GDP per capita, reflecting both productivity gains and a higher employment rate. A further 7.5 percentage points reflects higher purchasing power due to gains in the terms of trade. The remainder reflects the fact that a growing share of income generated in Canada is staying here, as governments are in surplus and net foreign indebtedness is falling. This accounts for another 2.2 percentage points of the increase in living standards.
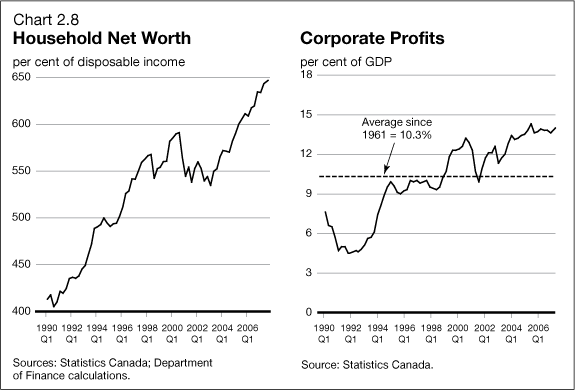
These gains in income have supported continued improvements in household and corporate financial positions. Household net worth as a share of disposable income has been growing at a rapid pace since the beginning of 2003, reaching record levels (Chart 2.8). As well, corporate profits continue to be strong, remaining near the record high of 14.3 per cent of GDP reached in the fourth quarter of 2005. Profits have been particularly strong in the financial, wholesale and retail trade, and oil and gas extraction sectors. Profits have been somewhat weaker in the manufacturing and forestry sectors.
Tax Relief Will Support the Economy
The October 2007 Economic Statement introduced broad-based tax reductions for individuals, families and businesses of $60 billion over this and the next five fiscal years.
Tax measures introduced by the Government will provide Canadians with relief each and every year, including important economic support this year. Measures announced in the 2007 Economic Statement are providing $12 billion in incremental tax relief this year (Table 2.1). This includes the reduction in the Goods and Services Tax (GST) rate to 5 per cent, as well as personal income tax relief for 2007, which most Canadians will receive in the spring of 2008 as a result of filing their 2007 income tax returns.
| Table 2.1 Incremental Tax Relief in 2008–09 1 (millions of dollars) |
|||||
|
Budget 2006 |
2006 Tax Fairness Plan |
Budget 2007 |
2007 Economic Statement |
Total | |
|---|---|---|---|---|---|
| GST | 6,020 | 6,020 | |||
| Personal income tax | 160 | 1,030 | 3,785 | 4,795 | 9,770 |
| Business income tax | 2,945 | 745 | 1,495 | 5,185 | |
| Total | 3,105 | 1,030 | 4,530 | 12,310 | 20,975 |
| 1 Includes measures that come into effect in 2008 and personal income tax relief effective for 2007 that will be realized by taxpayers as a result of filing their 2007 income tax returns in 2008. Includes incremental tax relief only. | |||||
Taking into account measures announced up to and including the 2007 Economic Statement, this provides Canadians and Canadian businesses with $21 billion in incremental tax relief—equivalent to 1.4 per cent of Canada’s economy—this year. This timely tax relief will help bolster the economy in these uncertain times.
Economic Challenges Ahead
Tax relief together with strong economic fundamentals mean that the Canadian economy is well placed to deal with the challenges that lie ahead—the weakening in the U.S. economy and ongoing global financial turmoil, as discussed in the next section, as well as the continuing adjustment to the higher Canadian dollar.
The higher Canadian dollar continues to present a challenge to export-intensive sectors, particularly the manufacturing and forestry sectors, which are also facing weaker U.S. demand, rising energy prices and increased competition from low-cost producers in developing countries. The higher dollar also presents a challenge to domestic producers that compete with foreign producers in the Canadian market.
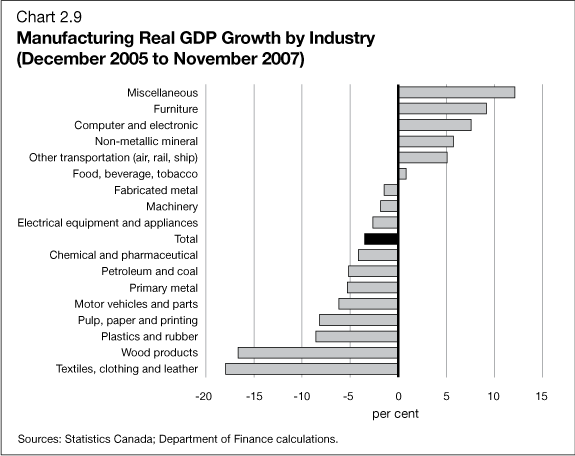
Over the past two years, real output in manufacturing has declined by 3.4 per cent (Chart 2.9). Declines have been registered in industries which account for over two-thirds of output in the sector, with the automobile, wood, pulp and paper, plastics, rubber and textile industries most affected. The decline in automobile industry production has reflected not only sluggish North American demand for automobiles but also restructuring by the Big Three U.S. automakers. The wood products manufacturing industry has experienced particularly steep declines in output in response to the deterioration in the U.S. housing market. With output expanding in industries accounting for about one-third of manufacturing output, there are sources of strength, such as the furniture and computer and electronic industries.
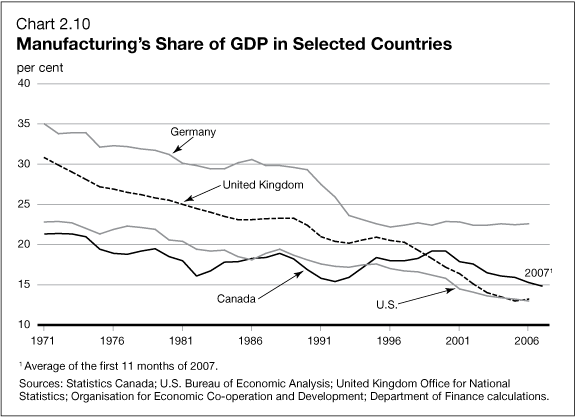
Manufacturing as a share of total output has been declining in most developed countries over the past 35 years (Chart 2.10). This trend decline was reversed in Canada between 1993 and 2000, as the low dollar temporarily boosted output in the manufacturing sector. Since then, the sharp appreciation of the Canadian dollar vis-à-vis the U.S. dollar and other currencies has put renewed downward pressure on the manufacturing sector and returned its share of output in the economy to its longer-term trend.
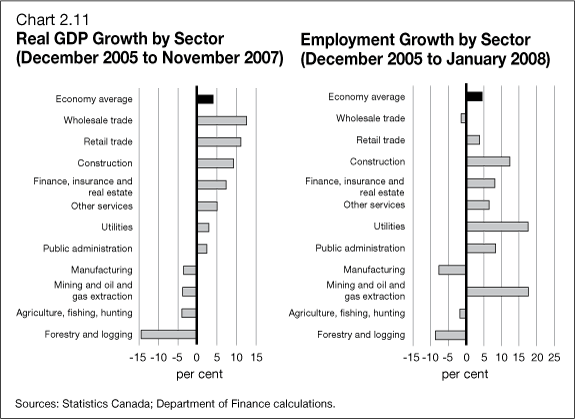
While job and output losses in manufacturing and forestry industries have been significant, these losses have been more than offset by strong gains in other sectors of the economy (Chart 2.11). Employment has grown strongly in high-wage industries such as utilities, mining, oil and gas, construction, and finance, insurance and real estate. The overall health of the economy has been easing the burden of adjustment for weaker sectors by creating job opportunities in all regions of the country.
U.S. and Overseas Economic Developments and Prospects
U.S. Economic Developments and Prospects
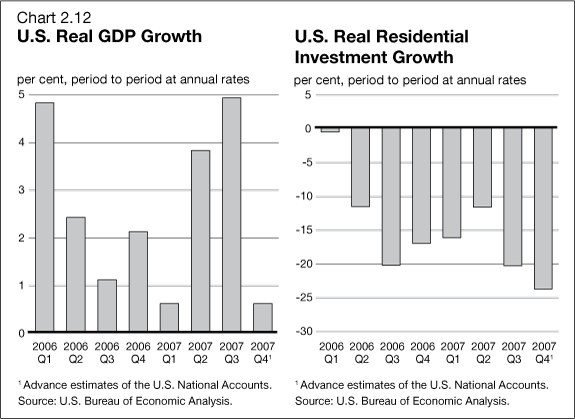
Economic activity in the United States has slowed considerably. Real GDP growth in the fourth quarter of 2007 dropped to just 0.6 per cent. Another large decline in residential investment, together with decelerating export growth and a sharp reversal in inventory accumulation, were the primary factors behind this slower growth (Chart 2.12). Consumer spending also moderated somewhat in the fourth quarter, reflecting declines in household wealth and a deterioration in consumer confidence.
The central questions for the U.S. outlook are how much further residential investment and house prices will decline, and whether consumer spending will slow significantly as a result.
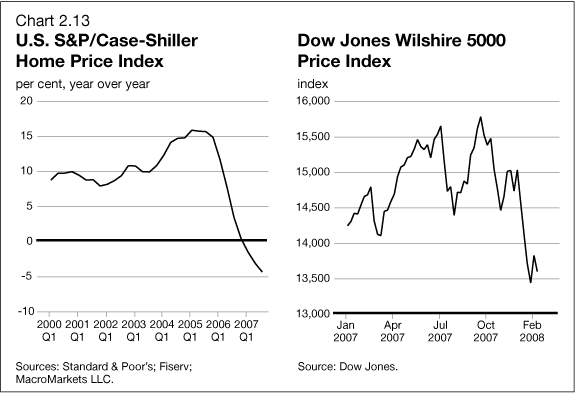
With house prices in the U.S. now falling (Chart 2.13), inventories at record highs, and delinquencies and foreclosures continuing to rise, the contraction in residential investment is projected to remain a drag on U.S. real GDP growth through the end of 2008, with many forecasters expecting the drag to carry into early 2009. More recently, concerns about the health of the U.S. economy in general have led to a marked decline in equity prices, with major indices down over 10 per cent from their recent October highs (Chart 2.13). Declines in equity prices since the beginning of 2008 have erased all of last year’s gains.
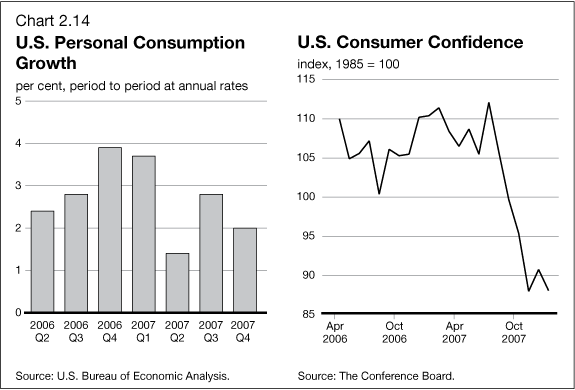
These significant declines in asset prices have the potential to reduce household wealth and consumer confidence and weaken consumer demand (Chart 2.14). In addition, rising mortgage delinquency and foreclosure rates have led financial institutions to tighten consumer-lending standards, reducing consumer access to credit and further depressing already weak housing demand. The ongoing turmoil in financial markets has also led to a widening of credit spreads resulting in a higher cost of funds and generally reduced credit availability for businesses. In general, credit conditions are expected to remain tight through 2008, dampening growth in U.S. business investment and consumer spending.
In response to indications of slowing growth, the U.S. Federal Reserve has lowered the target for the fed funds rate by a total of 225 basis points since September to 3.00 per cent. The U.S. Administration has also taken steps to support the U.S. economy with the Economic Stimulus Act of 2008. The Act is a one-year fiscal stimulus package equivalent to about 1 per cent of the U.S. economy, which includes temporary tax relief for both individuals and corporations.
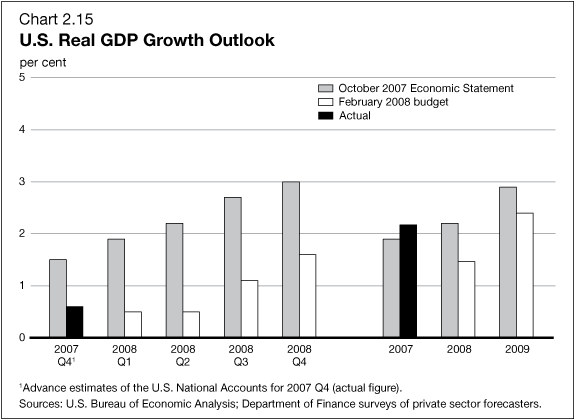
Private sector forecasters expect U.S. real GDP growth to average 1.5 per cent in 2008 and 2.4 per cent in 2009. Relative to the forecasts in the October 2007 Economic Statement, U.S. real GDP growth has been revised down significantly, by 0.7 percentage points in 2008 and 0.5 percentage points in 2009 (Chart 2.15).
Overseas Economic Developments and Prospects
Weaker U.S. growth and tighter credit conditions worldwide are expected to reduce global economic growth. After expanding by 4.9 per cent in 2007, the global economy is projected to grow at a slower rate of 4.1 per cent in 2008, according to the International Monetary Fund (IMF) January 2008 World Economic Outlook (WEO) Update (Table 2.2). The revised outlook for 2008 is 0.3 percentage points lower than in the October 2007 WEO, and largely reflects significant downward revisions to the growth forecasts for the advanced economies. The IMF has revised down its forecast for U.S. real GDP growth to 1.5 per cent in 2008, in line with the average private sector forecast discussed in the previous section.
The euro area has expanded at a brisk pace since mid-2006, aided by an upswing in investment (particularly in Germany) and strong export growth. After averaging 2.6 per cent in 2007, the IMF expects growth in the euro area to slow to 1.6 per cent in 2008, reflecting the recent tightening in credit conditions and slower global growth.
In Japan, economic growth has been dampened by slower residential investment, while consumer and business sentiment has weakened and is expected to remain soft. Moreover, while the trade-weighted value of the yen remains relatively low, its recent appreciation is projected to weigh on net exports. According to the IMF, Japanese real GDP growth is expected to be 1.5 per cent in 2008.
Solid growth in the emerging economies is projected to continue, although the U.S.-led slowdown will likely put some downward pressure on exports. Growth is expected to moderate slightly in China with a smaller contribution from the trade sector but remain strong overall. After registering robust growth of 11.4 per cent in 2007, the strongest increase since 1994, China’s economy is expected to expand at the slightly slower pace of 10 per cent in 2008.
| Table 2.2 World Real GDP Growth Outlook 1 (per cent, year over year) |
|||||
|
October 2007 WEO2 |
January 2008 WEO Update |
Change From October 2007 WEO |
|||
|---|---|---|---|---|---|
| 2006 | 2007 | 2008 | 2008 | ||
| World2 | 5.0 | 4.9 | 4.4 | 4.1 | -0.3 |
| Advanced economies | 3.0 | 2.6 | 2.2 | 1.8 | -0.4 |
| United States | 2.9 | 2.2 | 1.9 | 1.5 | -0.4 |
| Euro area (15) | 2.8 | 2.6 | 2.1 | 1.6 | -0.5 |
| Japan | 2.4 | 1.9 | 1.7 | 1.5 | -0.2 |
| Emerging market and developing economies |
7.7 | 7.8 | 7.1 | 6.9 | -0.2 |
| Developing Asia | 9.6 | 9.6 | 8.7 | 8.6 | -0.1 |
| of which China |
11.1 | 11.4 | 10.0 | 10.0 | n/a |
| 1 Aggregate growth rates
for groups of countries are calculated on a purchasing power
parity (PPP) exchange rate basis. 2 Department of Finance calculations. Country weights used to construct aggregate growth rates for groups of countries were revised from those reported in the October 2007 World Economic Outlook to incorporate updated PPP exchange rates released by the World Bank in December 2007. Source: IMF, World Economic Outlook Update (January 2008). |
|||||
Private Sector Canadian Outlook
The Department of Finance surveys private sector economic forecasters on a quarterly basis regarding their outlook for the Canadian economy. The Department’s survey of private sector forecasters forms the basis for economic assumptions that underlie the fiscal projections for the budget. The economic forecasts reported here are based on a survey of private sector forecasters conducted by the Department in December 2007 and updated in January.
Real GDP growth of 2.9 per cent in the third quarter of 2007 was higher than the 2.2-per-cent growth expected at the time of the October 2007 Economic Statement. However, private sector forecasters now estimate that real GDP growth slowed significantly in the fourth quarter of 2007 and expect growth to be moderate through 2008.
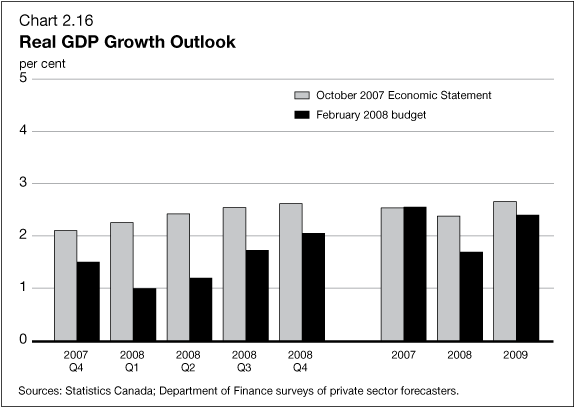
Private sector forecasters expect real GDP growth of 1.7 per cent in 2008, significantly lower than 2.4 per cent in the Economic Statement (Chart 2.16). This downward revision reflects expectations of weaker U.S. economic growth and tighter domestic credit conditions. Private sector forecasters have also lowered their forecast for real GDP growth in 2009, to 2.4 per cent from 2.7 per cent at the time of the Economic Statement, in part because of expectations of slower U.S. growth next year.
Private sector forecasters have revised down their outlook for GDP inflation in 2008 to 1.8 per cent from 2.4 per cent in the Economic Statement. This reflects downward revisions to their outlook for consumer prices as a result of the GST rate reduction and ongoing adjustments of import prices to the appreciation of the Canadian dollar, which are partially offset by higher energy prices than expected at the time of the Economic Statement. The outlook for GDP inflation in 2009 has been revised down slightly to 1.9 per cent from 2.0 per cent.
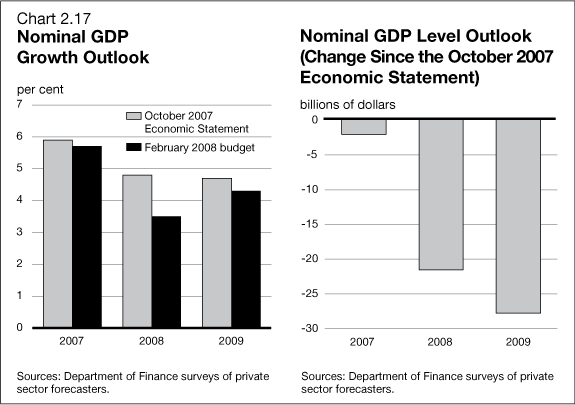
As a result of the lower forecasts for real GDP growth and GDP inflation, the outlook for nominal GDP growth in 2008 and 2009 has been revised down from 4.8 per cent and 4.7 per cent respectively in the Economic Statement to 3.5 per cent in 2008 and 4.3 per cent in 2009 (Chart 2.17). Relative to the private sector forecast presented in the Economic Statement, the level of nominal GDP is now expected to be close to $22 billion lower in 2008 and $28 billion lower in 2009.
At the time of the Economic Statement, private sector forecasters expected short-term interest rates to average 4.4 per cent in 2008 and 4.7 per cent in 2009. Forecasters have revised down their outlook for short-term interest rates to 3.2 per cent in 2008 and 3.8 per cent in 2009.
The outlook for long-term interest rates has also been significantly revised down to average 3.6 per cent in 2008 and 4.2 per cent in 2009, from 4.6 per cent and 5.0 per cent, respectively, at the time of the Economic Statement.
Private sector forecasters also anticipate that slower growth will translate into a modest increase in the unemployment rate. They expect the unemployment rate to rise to 6.3 per cent in 2008 and 6.4 per cent in 2009, compared to 6.2 per cent in 2008 and 2009 at the time of the Economic Statement.
| Table 2.3 Private Sector Forecasts (per cent, unless otherwise indicated) |
|||
|---|---|---|---|
| 2007 | 2008 | 2009 | |
| Real GDP growth | |||
| March 2007 budget | 2.3 | 2.9 | 3.1 |
| October 2007 Economic Statement | 2.5 | 2.4 | 2.7 |
| February 2008 budget | 2.6 | 1.7 | 2.4 |
| GDP inflation | |||
| March 2007 budget | 1.5 | 2.0 | 2.0 |
| October 2007 Economic Statement | 3.3 | 2.4 | 2.0 |
| February 2008 budget | 3.1 | 1.8 | 1.9 |
| Nominal GDP growth | |||
| March 2007 budget | 3.9 | 5.0 | 5.2 |
| October 2007 Economic Statement | 5.9 | 4.8 | 4.7 |
| February 2008 budget | 5.7 | 3.5 | 4.3 |
| Nominal GDP level (billions of dollars) | |||
| March 2007 budget1 | 1,503 | 1,578 | 1,660 |
| October 2007 Economic Statement | 1,532 | 1,605 | 1,680 |
| February 2008 budget | 1,529 | 1,583 | 1,652 |
| Change in nominal GDP (February vs. Statement) |
-2 | -22 | -28 |
| 3-month treasury bill rate | |||
| March 2007 budget | 4.2 | 4.2 | 4.3 |
| October 2007 Economic Statement | 4.2 | 4.4 | 4.7 |
| February 2008 budget | 4.2 | 3.2 | 3.8 |
| 10-year government bond rate | |||
| March 2007 budget | 4.1 | 4.5 | 5.2 |
| October 2007 Economic Statement | 4.3 | 4.6 | 5.0 |
| February 2008 budget | 4.3 | 3.6 | 4.2 |
| Unemployment rate | |||
| March 2007 budget | 6.3 | 6.4 | 6.3 |
| October 2007 Economic Statement | 6.1 | 6.2 | 6.2 |
| February 2008 budget | 6.0 | 6.3 | 6.4 |
| U.S. real GDP growth | |||
| March 2007 budget | 2.5 | 2.9 | 3.3 |
| October 2007 Economic Statement | 1.9 | 2.2 | 2.9 |
| February 2008 budget | 2.2 | 1.5 | 2.4 |
| 1 Nominal GDP levels have
been adjusted to reflect May 2007 revisions to Canada’s National
Income and Expenditure Accounts. Sources: March 2007 and October 2007 Department of Finance surveys of private sector forecasters; December 2007 survey of private sector forecasters, updated in January 2008. |
|||
Risks and Uncertainties
The downside risks identified in the October 2007 Economic Statement have, to some extent, materialized. Reflecting expectations of weaker U.S. growth and ongoing financial market turmoil, private sector forecasters have revised down their outlook for the Canadian economy since the time of the Economic Statement. The risks remain mainly tilted to the downside, and there is considerable uncertainty surrounding the economic outlook.
Despite the already weak outlook for the U.S. economy, there is the risk of a larger-than-expected U.S. slowdown. This could be brought about by substantial declines in house prices, further sharp drops in equity prices, tighter credit conditions or a rapid deterioration in the labour market, which could significantly impact U.S. consumer spending and business investment.
There is also the related risk that the turbulence in global financial markets could persist longer than expected, leading to higher business and consumer borrowing costs, reduced credit availability and weaker consumer and business confidence globally.
Heightened financial market volatility and recent developments in the U.S. economy have therefore increased the uncertainty surrounding the global economic outlook. Slower-than-expected global economic growth would put downward pressure on commodity prices, which would lead to weaker terms of trade and income growth for Canada.
This being said, the Canadian economy is well placed to deal with the challenges that lie ahead because of its strong economic and fiscal fundamentals. Further, actions taken in the Economic Statement are providing substantial incremental tax relief of more than $12 billion this year. Combined with actions taken by the Government since 2006, $21 billion—equivalent to 1.4 per cent of Canada’s economy—in incremental tax relief is being provided to Canadians and Canadian businesses this year.
These timely actions will not only continue to bolster the economy in these uncertain times, but they also advance the Government’s economic plan— Advantage Canada —to improve Canada’s long-term competitiveness and secure the future of Canadians.
Table of Contents - Previous - Next