Common menu bar links
Archived - Summary
This annex presents the fiscal situation of the federal and provincial-territorial government sector in Canada. It also compares Canada’s total government fiscal position with those of the other Group of Seven (G7) countries as well as several other countries from the Organisation for Economic Co-operation and Development (OECD).
Fiscal Performance of Canada’s Federal and Provincial-Territorial Governments
- The federal government posted a surplus of $13.8 billion in 2006–07, while the provincial-territorial governments posted a surplus of $16.5 billion, for a combined federal-provincial-territorial surplus of $30.3 billion. This is the third consecutive year that the provincial-territorial surplus has exceeded the federal surplus.
- In both 2005–06 and 2006–07, the federal government and all provincial-territorial governments posted surpluses. In 2006–07, the federal government and six of the provinces and territories recorded budgetary surpluses of 1.0 per cent of gross domestic product (GDP) or more.
- For 2007–08, the federal government is projecting a 10.2 billion surplus, while the provincial-territorial sector is forecasting a $7.8 billion surplus. If the $0.9 billion in contingency reserves currently included in provincial government budget plans are removed, the provincial-territorial surplus would be $8.7 billion.
- Federal cash transfers to the provinces and territories have been the fastest-growing component of federal spending over the past eight years. As a result, they are expected to rise to almost 19 per cent of federal spending in 2007–08, their highest level in almost 30 years.
Canada’s Fiscal Performance in an International Context
To enable international comparisons, the OECD publishes National Accounts data for the total government sector. For Canada, the figures include the federal, provincial-territorial and local government sectors, as well as the Canada Pension Plan and the Québec Pension Plan. Based on OECD data, Canada’s fiscal position is stronger than that of the other G7 countries (United States, United Kingdom, France, Germany, Japan and Italy).
- The OECD expects Canada to record the largest budgetary surplus as a share of GDP in the G7 in 2007, 2008 and 2009.
- It projects that Canada’s total government net debt-to-GDP ratio, which has been the lowest in the G7 since 2004, will continue to decline in future years.
- Canada is on track to eliminate its total government net debt by 2021. By doing so, it will be able to count itself among the few OECD countries that are in a net asset position.
The fiscal position of the federal and provincial-territorial governments remains strong
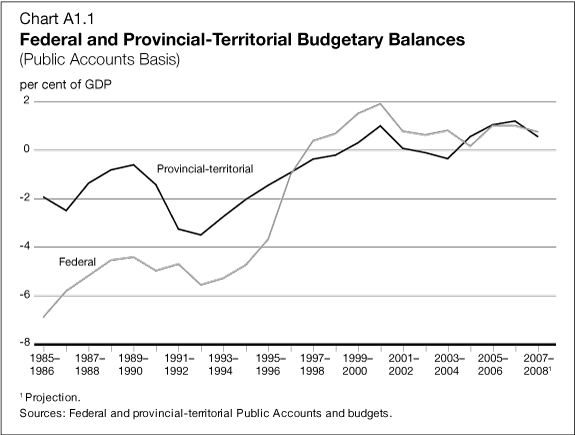
- Both the federal and provincial-territorial governments remain in a strong fiscal position.
- The federal government posted a surplus of $13.8 billion or 1.0 per cent of GDP in 2006–07, while the provincial-territorial sector recorded a surplus of $16.5 billion or 1.1 per cent of GDP. This is the third consecutive year that the provincial-territorial surplus has exceeded the federal surplus.
- In 2007–08, the federal government is projecting a surplus of 10.2 billion or 0.7 per cent of GDP, while the provincial-territorial sector is forecasting a surplus of $7.8 billion or 0.5 per cent of GDP. If the $0.9 billion in contingency reserves currently included in provincial government budget plans are removed, the provincial-territorial surplus would be $8.7 billion.
The federal government and all provincial-territorial governments recorded surpluses in 2006–07
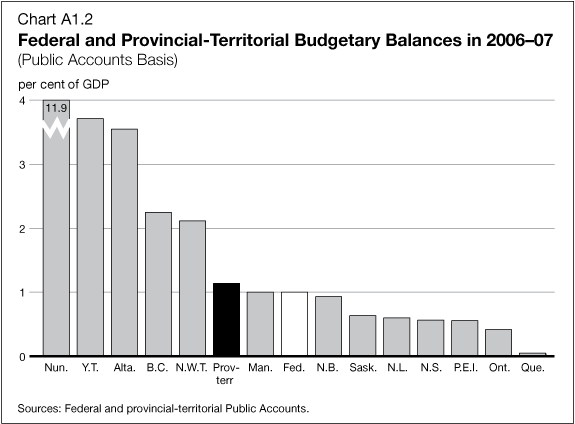
- The strong provincial-territorial fiscal performance is widespread. In 2005–06 (for the first time in 60 years) and in 2006–07, all provinces and territories recorded budgetary surpluses.
- All provinces and territories recorded better-than-expected budgetary surpluses in 2006–07, relative to the forecasts contained in their 2007 budgets, thanks largely to higher-than-forecast revenues and, to a lesser degree, lower-than-expected expenditures. The improvements are not limited to resource-rich provinces, as provinces with a large manufacturing base have also posted better-than-expected fiscal results.
- When the budgetary surpluses are expressed as a share of GDP, which enables country-wide comparisons that take into account the varying sizes of jurisdictions, the federal government and six of the provinces and territories recorded budgetary surpluses of 1.0 per cent of GDP or more in 2006–07.
- Ten of the 13 provinces and territories expect surpluses in 2007–08. These surpluses are generally forecast to be smaller than in 2006–07, reflecting both prudent forecasts of tax revenues and the impact of the slowdown in the U.S. economy.
Provincial-territorial revenues are increasingly higher than federal revenues
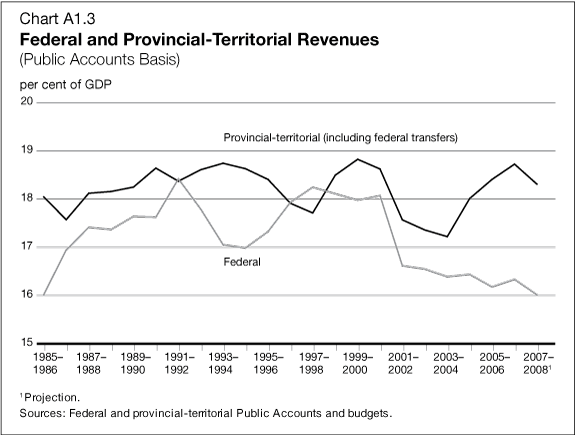
- Provincial-territorial revenues (including federal transfers such as Equalization and the Canada Health Transfer) continue to exceed federal revenues. The gap has widened in recent years as a result of federal tax relief and the impact of growing federal transfers and higher energy prices on provincial-territorial revenues.
- In 2000–01, provincial-territorial revenues stood at 18.6 per cent of GDP, compared to 18.1 per cent at the federal level. Since then, federal revenues as a share of GDP have been on a steady downward trend, declining by 2.1 percentage points to a projected 16.0 per cent in 2007–08, reflecting cuts in personal and corporate income taxes and the 2-percentage-point reduction in the Goods and Services Tax rate.
- In contrast, provincial-territorial revenues as a share of GDP increased significantly between 2003–04 and 2006–07 as a result of strong growth in personal and corporate income tax revenues, natural resource revenues and federal cash transfers. In 2007–08, provincial-territorial revenues are forecast to decline slightly as a share of GDP, to 18.3 per cent, reflecting personal income tax cuts and one-time gains in 2006–07.
- Thus, provincial-territorial revenues are forecast to be 2.3 percentage points of GDP (or almost $36 billion) higher than federal revenues in 2007–08, compared to a gap of just 0.5 percentage points (or $5 billion) in 2000–01. The gap will likely continue to grow over the coming years, reflecting the actions announced in Budget 2007 to restore fiscal balance, notably increased funding for Equalization, the Canada Social Transfer and Territorial Formula Financing.
Cash transfers to provinces and territories have been the fastest-growing component of federal spending
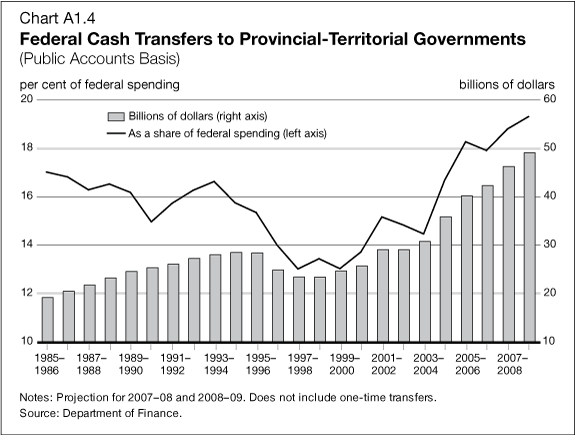
- After several years of fiscal retrenchment during the mid-1990s, the federal government has significantly increased cash transfers to the provinces and territories.
- Since 1999–2000, federal cash transfers to provincial and territorial governments have been the fastest-growing component of federal spending.
- In 2007–08, cash transfers are at an all-time high and have grown to almost 19 per cent of total federal spending, their highest level in almost 30 years.
- These transfers are expected to continue to increase as a share of federal spending in the coming years, reflecting the Government’s policies that restored fiscal balance.
The federal and provincial-territorial debt burdens continue to decline…
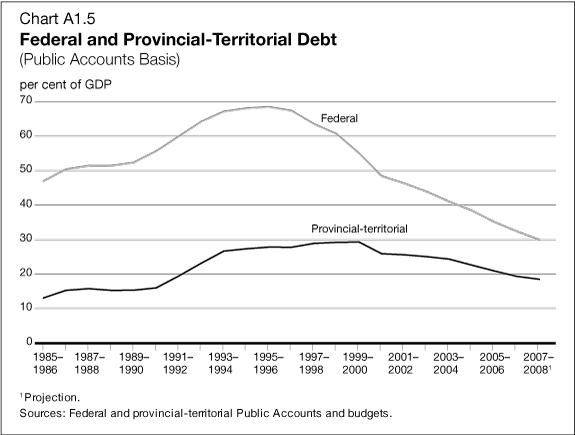
- As a result of their improved fiscal situations, the provincial-territorial and federal governments have made significant progress in reducing their debt burdens.
- The provincial-territorial debt-to-GDP ratio is expected to fall to 18.4 per cent in 2007–08, a decline of 10.8 percentage points or almost 40 per cent from its peak of 29.2 per cent in 1999–2000.
- The federal debt-to-GDP ratio is expected to fall to 29.9 per cent in 2007–08. Although it is significantly lower than its peak of 68.4 per cent in 1995–96, it remains higher than the provincial-territorial debt-to-GDP ratio. The Government remains on track to reduce the federal debt to 25 per cent of GDP by 2011–12.
…resulting in a steep decline in debt charges as a share of total revenues
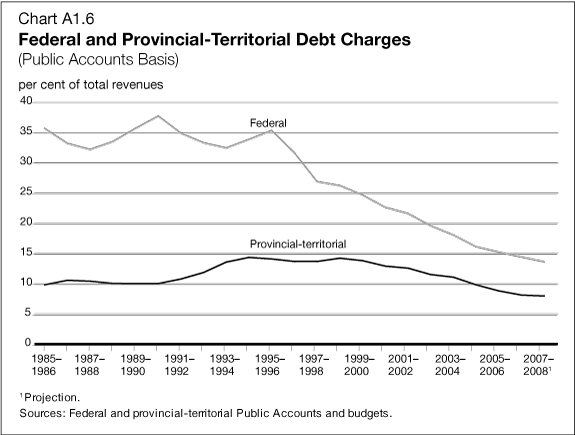
- Reflecting a reduction in public debt and lower interest rates, the federal and provincial-territorial governments are spending less of their revenues on debt-servicing costs.
- At the peak in 1990–91, 37.6 cents of each federal revenue dollar went to service the federal debt. This ratio is expected to fall to 13.6 cents in 2007–08, the lowest level since the late 1970s.
- Provincial-territorial governments continue to face much lower debt charges than the federal government. In 2007–08, they are expected to spend 8.0 cents of each revenue dollar on debt-servicing costs.
Canada is expected to have the strongest budgetary position in the G7 from 2007 to 2009
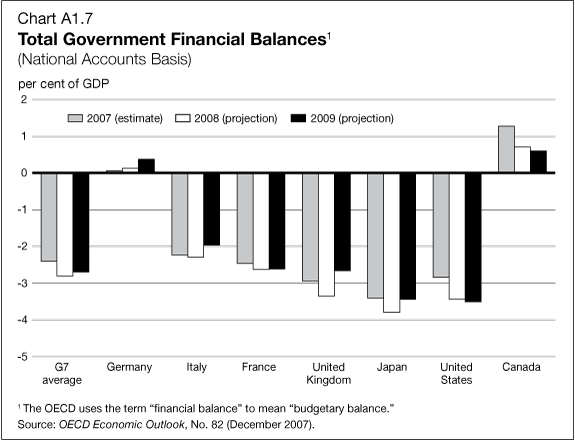
- International comparisons rely on the standardized System of National Accounts estimates for the total government sector (i.e. the combined national and subnational levels). The OECD produces a complete series of estimates based on this system. These figures facilitate international comparisons by taking into account two important factors: differences in accounting methods among countries, which affect the comparability of data, and differences in financial responsibilities among orders of government within countries.
- In 2007, Canada recorded a total government surplus of 1.3 per cent of GDP, which reflects surpluses at the federal and provincial-territorial-local levels, as well as in the Canada Pension Plan and Québec Pension Plan.
- The OECD expects Canada and Germany to be the only G7 countries in surplus from 2007 to 2009, although Canada’s surpluses as a share of GDP are projected to be considerably larger than Germany’s. The G7 as a whole is expected to record a deficit of approximately 2.6 per cent of GDP during that time.
Canada’s debt burden has declined from the second highest to the lowest in the G7
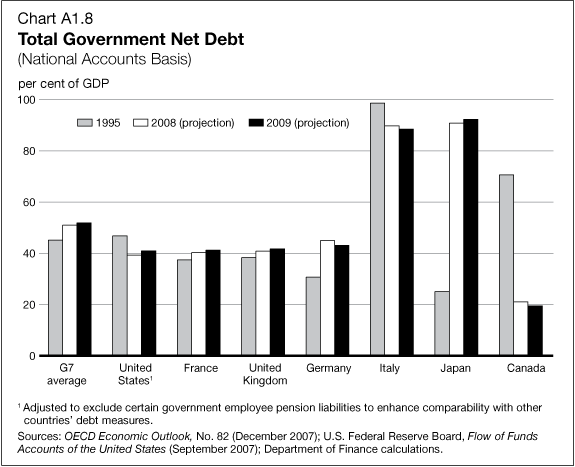
- Since 2004, Canada has had the lowest ratio of total government net debt to GDP in the G7.
- The OECD projects that Canada’s net debt-to-GDP ratio will decline to 19.5 per cent in 2009, less than half of the projected average of 51.9 per cent for all G7 countries. According to these projections, Canada’s debt burden will have fallen over 50 percentage points from the peak in 1995, when it was the second highest in the G7.
- In contrast, the debt burdens of all other G7 countries, except the United States and Italy, have increased since 1995. The average net debt-to-GDP ratio in the G7 is projected to continue to rise in 2008 and 2009.
Further debt reduction is necessary to better situate Canada to deal with the pressures of population aging
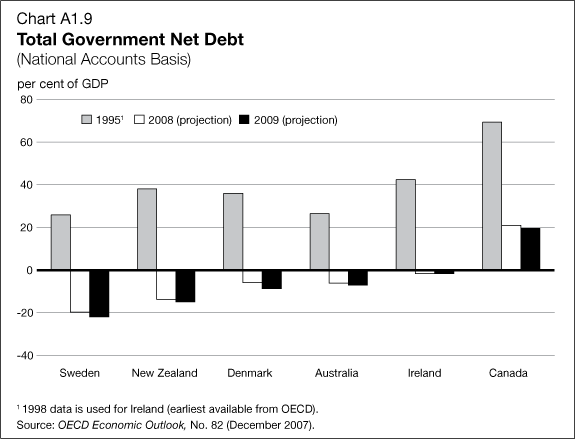
- Continued debt reduction will release resources currently allocated to debt-servicing costs and better enable Canada to deal with the fiscal pressures of population aging.
- Similar to Canada, other OECD countries have significantly reduced their debt levels as a share of GDP over the past decade and a few have recently moved into total government net asset positions.
