Common menu bar links
Table of Contents - Previous - Next -
Archived -
Annex 2
This Web page has been archived on the Web.
Canada's Financial Performance in an International Context
Summary
- This annex compares Canada’s financial position with those of the other Group of Seven (G7) countries (United States, United Kingdom, France, Germany, Japan and Italy) as well as several other countries from the Organisation for Economic Co-operation and Development (OECD). For Canada, this includes the federal, provincial-territorial and local government sectors, as well as the Canada Pension Plan and the Quebec Pension Plan.
- On a total government, National Accounts basis:
- Canada was the only G7 country in surplus in 2006, according to OECD estimates.
- The OECD projects that Canada will be the only G7 country to record a surplus in both 2007 and 2008.
- Canada’s total government net debt-to-GDP (gross domestic product) ratio, which has been the lowest in the G7 since 2004, is estimated at 27.6 per cent for 2006.[1] The OECD expects Canada’s debt burden to continue to decline in future years.
- Canada is on track to eliminate its net debt by 2021. By doing so, Canada will be able to count itself among the very few OECD countries that are in a net asset position.
- This annex also compares the fiscal situation of the federal governments in Canada and the United States:
- In 2005–06, the Canadian federal government posted a surplus of C$13.2 billion or 1.0 per cent of GDP, while the U.S. federal government incurred an on-budget deficit of US$434 billion or 3.3 per cent of GDP.
- For 2006–07, the Canadian federal government is forecasting a surplus of C$9.2 billion or 0.6 per cent of GDP, while the U.S. government is projecting an on-budget deficit of US$427 billion or 3.1 per cent of GDP.
- The federal market debt-to-GDP ratio in Canada has been below the U.S. figure since 2003–04, with the gap expected to widen further in 2006–07.
Canada is expected to be the only G7 country in surplus from 2006 to 2008
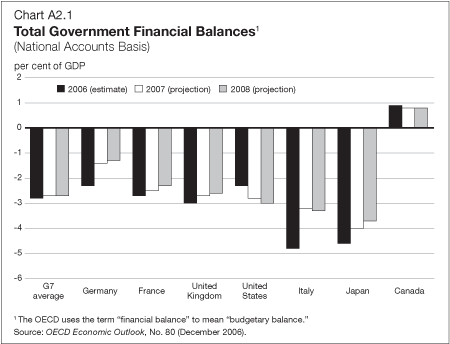
- International comparisons rely on the standardized System of National Accounts estimates for the total government sector (i.e. the combined national and subnational levels). The OECD produces a complete series of estimates based on this system. These figures facilitate international comparisons by taking into account two important factors: differences in accounting methods among countries, which affect the comparability of data, and differences in financial responsibilities among levels of government within countries.
- In 2005, Canada recorded a total government surplus of 1.4 per cent of GDP, which reflects the combined surplus at the federal, provincial-territorial and local levels, as well as in the Canada Pension Plan and Quebec Pension Plan.
- According to the most recent estimates from the OECD, Canada was the only G7 country to record a surplus in 2006 and is again expected to be the only country in surplus in 2007 and 2008.
- The OECD forecasts Canada’s surplus will be 0.8 per cent of GDP in both 2007 and 2008, compared to an expected average deficit of 2.7 per cent in the G7 countries.
Canada’s debt burden has declined from the second highest to the lowest in the G7
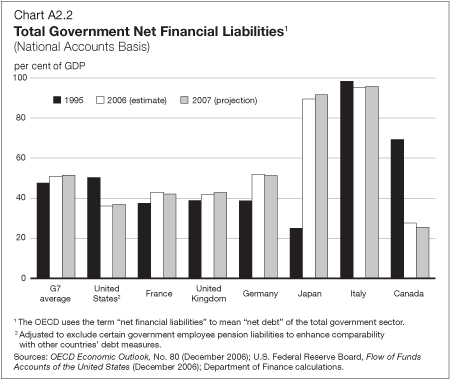
- Since 2004, Canada has had the lowest ratio of total government net financial liabilities to GDP in the G7.
- The OECD projects that Canada’s net debt-to-GDP ratio will decline to 25.5 per cent in 2007, compared to a projected average of 51.5 per cent for all G7 countries. According to these projections, Canada’s debt burden will have fallen more than 45 percentage points from its peak in 1995, when it was the second highest in the G7. This ratio is expected to fall further to 23.2 per cent in 2008.
- In contrast, the debt burdens of all other G7 countries, except the United States and Italy, have increased since 1995 and are expected to remain around current levels for at least the next two years.
However, other industrialized countries have also significantly reduced their debt burdens
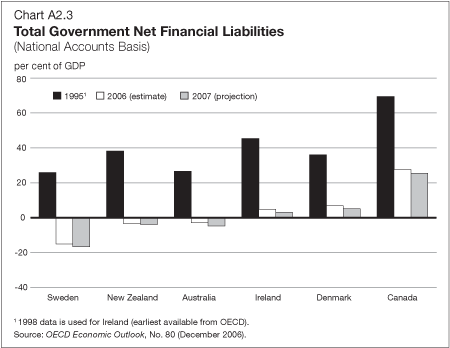
- Similar to Canada, other OECD countries have significantly reduced their debt levels as a share of GDP over the past decade and some countries, including Australia, New Zealand and Sweden, have recently moved into total government net asset positions.
- To strengthen Canada’s ability to deal with economic shocks and challenges such as the aging of the population, the Government believes that, as a country, we should aim to eliminate Canada’s total government net debt by 2021 at the latest. By doing so, Canada will be able to count itself among the very few OECD countries that are in a net asset position.
- Canada is on track to eliminate its national debt burden by 2021 if:
- The Canada Pension Plan/Quebec Pension Plan continue to build assets as currently projected.
- The provincial, territorial and local governments maintain balanced budgets in aggregate.
- The federal government continues to plan for annual debt reduction of at least $3 billion.
The federal government in Canada has maintained a budgetary surplus since 1997–98, unlike the U.S.
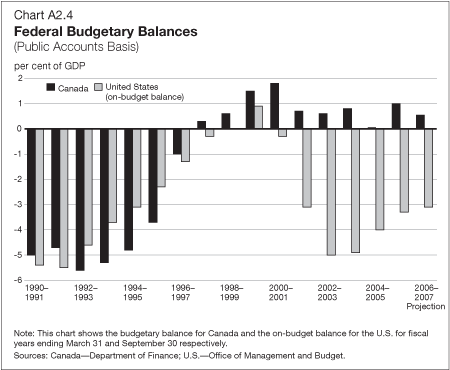
- There are significant differences in the accounting practices and expenditure responsibilities of the Canadian and U.S. federal governments. For example, the U.S. federal unified budget balance includes the substantial surpluses in the Social Security system, whereas surpluses in the Canada Pension Plan are not included in the Canadian federal figures. For this reason, the Canadian federal budgetary balance is more comparable with the on-budget balance in the U.S. (excluding Social Security).
- Like the Canadian federal budgetary balance, the U.S. federal on-budget balance moved from large deficits to surpluses in the latter half of the 1990s. However, since 2000–01, the U.S. has returned to deficits, whereas Canada has continued to record surpluses.
- In 2005–06, the Canadian federal government posted its ninth consecutive surplus, amounting to C$13.2 billion or 1.0 per cent of GDP. On the other hand, the U.S. federal government incurred an on-budget deficit of US$434 billion or 3.3 per cent of GDP (the U.S. unified budget deficit was US$248 billion or 1.9 per cent of GDP).
- The Canadian federal government is forecasting a surplus of C$9.2 billion or 0.6 per cent of GDP in 2006–07, while the U.S. government projects a small decline in its on-budget deficit to US$427 billion or 3.1 per cent of GDP, and a return to a unified budget surplus by 2011–12.
The federal market debt-to-GDP ratio is lower in Canada than in the U.S., and the gap is widening
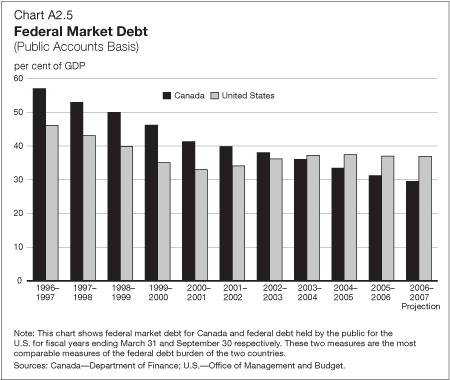
- Canadian federal market debt (rather than the accumulated deficit) and U.S. federal debt held by the public are the most comparable measures of the federal debt burden in the two countries.
- As a result of continued surpluses at the federal level in Canada and the deterioration in U.S. federal finances, the federal market debt-to-GDP ratio in Canada fell below the U.S. figure in 2003–04.
- The Canadian federal market debt-to-GDP ratio fell to 31.2 per cent in 2005–06, compared to 37.0 per cent in the U.S. With the Canadian ratio expected to fall to 28.8 per cent of GDP in 2006–07 and the U.S. ratio projected to remain fairly stable, the gap is expected to widen to more than 8 percentage points.
1 This figure is on a National Accounts basis for the total government sector and as such is not directly comparable to the Government of Canada’s target of reducing its debt burden (accumulated deficit) to 25 per cent of GDP by 2012–13, which is on a Public Accounts basis and covers only the federal government.[Return]
Table of Contents - Previous - Next -
