Common menu bar links
- The global economy is in the most synchronized recession in the post-war period and the ongoing financial market crisis is the worst since the 1930s.
- The economic slowdown is particularly evident in the United States and other advanced economies where the economic outlook has deteriorated markedly in recent months, but is also increasingly apparent in emerging market economies.
- Weaker expectations for global growth have led to a further decline in the prices of many of the commodities produced in Canada.
- Global credit markets remain seriously disrupted, with credit conditions remaining tight both in terms of the cost and availability of credit.
- As a result, the private sector outlook for real and nominal
GDP in Canada has been revised down significantly since the time
of the Economic and Fiscal Statement:
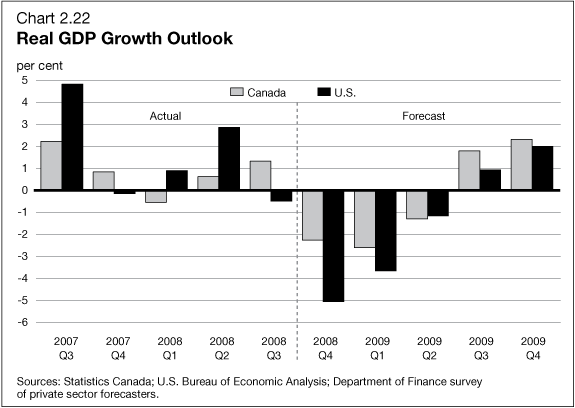
- There is now a broad-based consensus that the Canadian economy entered a recession in the fourth quarter of 2008. Private sector forecasters expect the recession to last three quarters.
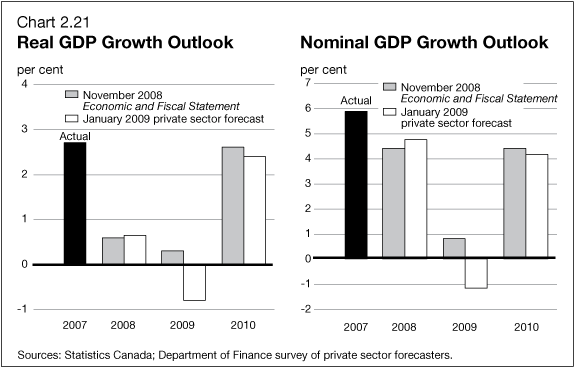
- Real GDP is now expected to contract by 0.8 per cent in 2009, compared to a forecast of 0.3 per cent growth at the time of the Statement.
- Nominal GDP is expected to fall by 1.2 per cent for 2009, compared to an increase of 0.8 per cent in the Statement.
- The risks to the outlook for real and nominal GDP remain tilted to the downside.
- In light of this risk, the Government has judged it appropriate to adjust downward the private sector forecast for nominal GDP for budget planning assumptions. The planning assumption is for a contraction of 2.7 per cent in nominal GDP in 2009, rather than the -1.2 per cent average private sector forecast.
- This means that the budget planning assumption for the level of nominal GDP is forecast to be about $30 billion lower than expected by the private sector in 2009 and 2010.
- The Government will continue to evaluate economic developments to determine whether or not it would be appropriate to maintain the adjustment for risk in future budgets and economic and fiscal updates.
Note: This chapter incorporates data available up to January 22, 2009, unless otherwise indicated. Figures in this chapter are at annual rates unless otherwise noted.
Introduction
The global economic outlook has deteriorated markedly in recent months. This is particularly evident in the United States and other advanced economies but is also increasingly apparent in emerging market economies. Weaker global growth has led to a further decline in the prices of many of the commodities produced in Canada. As a result, the near-term outlook for output, employment and income in Canada is also weaker than forecast in the November 27 Economic and Fiscal Statement.
This chapter reviews the major global and Canadian economic developments since the Statement, describes the economic forecast that forms the basis for the fiscal projections outlined in Chapter 4, and discusses the risks and uncertainties associated with this economic outlook.
To address the uncertainty about the economic outlook and the downside risks to that outlook, this chapter also proposes that the assumptions used for budget planning should be more prudent than suggested by the private sector average forecast.
Global Economic Developments and Outlook
The Canadian economy faces three major challenges:
- The impact of tighter credit conditions and equity market losses stemming from global financial market dislocations.
- The economic slowdown in the U.S. and other key economies, and its impact on demand for Canadian exports.
- The sharp drop in prices for many commodities produced in Canada, which is dampening Canadian profit and income growth.
All of these challenges are rooted in developments in the global economy. The negative impacts stemming from them have increased since the time of the November 2008 Statement.
Global financial markets continue to be characterized by very high risk aversion. As a result, credit markets remain seriously disrupted, with credit conditions remaining tight both in terms of the cost and availability of credit.
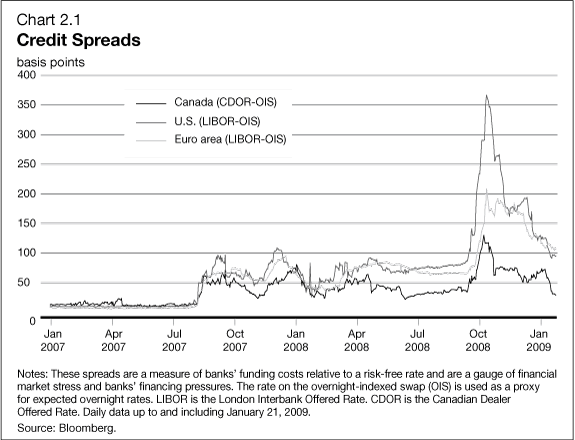
The Canadian financial system is better equipped to cope with the challenging global financial situation than financial systems in most other countries. Canada has a less-leveraged and better-capitalized banking sector compared with other countries. As a result, wholesale borrowing costs paid by Canadian banks have risen less than for banks in other countries (Chart 2.1).
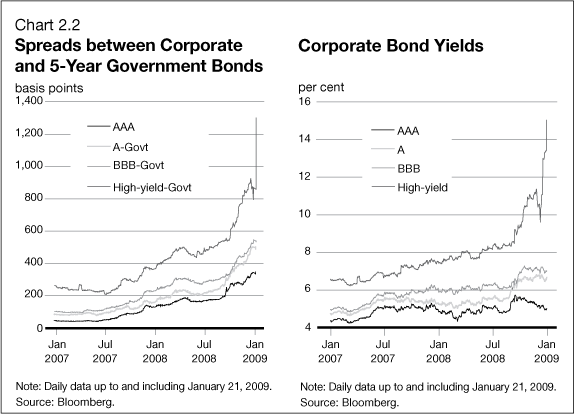
Nevertheless, Canadian banks’ wholesale costs remain high and this is affecting a wide range of consumer and business borrowing rates in Canada. Of particular concern is the fact that financing costs for businesses are elevated. Yields on Canadian corporate bonds remain significantly higher than pre-crisis levels, with yields increasing further after September 2008 (Chart 2.2). The increase has been highest for less creditworthy bonds, but even yields for AAA corporate bonds have risen significantly.
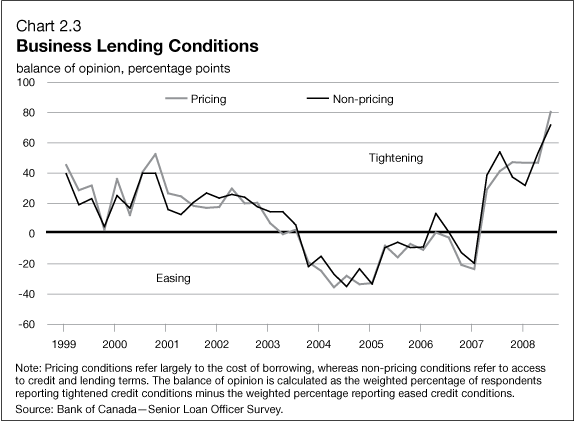
Further, over the past several months, Canadian businesses have seen their access to capital markets for financing impaired as a result of the global financial crisis. Surveys of senior loan officers in chartered banks also suggest that non-price borrowing conditions for Canadian businesses have tightened to the highest levels on record, along with the increase in the cost of borrowing (Chart 2.3).
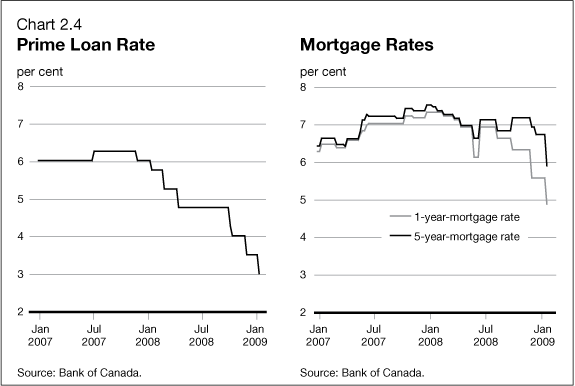
The credit situation for Canadian consumers is somewhat better. The prime loan rate, which influences a broad range of consumer loan rates, has declined by 300 basis points since the beginning of 2008 (Chart 2.4). Over this period, the conventional 1-year mortgage rate has decreased by 245 basis points, while the 5-year mortgage rate has declined by about 160 basis points. However, as a result of conditions in financial markets, the reduction in consumer borrowing costs relative to the sharp easing in the Bank of Canada’s policy rate has been somewhat less than in past easing periods. As well, consumer access to credit in some market segments, such as through financing companies, has been curtailed.
The impact of tighter credit conditions for businesses and consumers has begun to affect the domestic economy in Canada. This will likely intensify in coming months.
The Government and the Bank of Canada have taken a number of steps to help ensure the stability of the Canadian financial system and to improve access to credit. Since September 2007, the Bank of Canada has cut policy rates by a total of 350 basis points. As of January 22, the Bank had also added $33 billion in the provision of term liquidity to the Canadian financial system. In addition, since the fall of 2008 the Government has put in place a number of programs to help ease the tension in financial markets, including the purchase of up to $75 billion in insured mortgage pools from Canadian financial institutions through the Canada Mortgage and Housing Corporation and the provision of a guarantee for banks’ borrowings through the Canadian Lenders Assurance Facility. Late last year, the Government approved a $2-billion increase in the borrowing authority of EDC and a $1.8-billion increase in BDC’s borrowing capacity, which is enabling them to offer additional credit to their clients. This is in addition to $350 million in capital committed to each financial Crown Corporation to support about a further $3 billion in increased credit granting.
The global financial turmoil, together with the decline in commodity prices and weakening global economic outlook, has contributed to a decline of about 40 per cent in the Canadian stock market since the middle of 2008. As a result of the decline in equity prices, household net worth declined 3.2 per cent in the third quarter, with a further large decline likely in the fourth quarter. This reduction is significantly less pronounced than in the U.S. where a sharp decline in home prices combined with stock market declines have dramatically reduced household net worth (Chart 2.5).
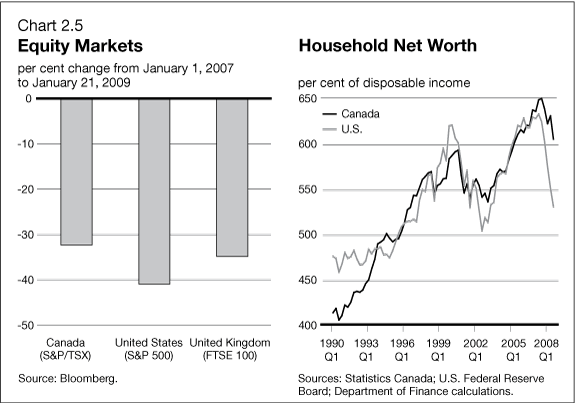
The fall in household net worth is expected to dampen consumer spending over the next year. The extent to which this materializes is difficult to estimate precisely. It will depend upon the extent to which consumer spending patterns were previously influenced by the past run-up in assets and the extent to which recent equity losses are perceived to be permanent. Also, a mitigating factor is that debt financing costs as a share of disposable income are low and likely to continue falling, given recent reductions in interest rates.
Recent Global Economic Developments and Outlook
United States
The sharp deterioration of the U.S. economy over the past few months points to a deeper and longer downturn than was previously expected. Private sector economists now expect that the loss of output in the current episode will match the loss experienced in the 1981–82 recession.
The current U.S. recession, which started in January 2008, was temporarily masked by a sharp increase in export growth as well as the positive boost to consumer spending from the 2008 Economic Stimulus Act. However, since June 2008, the impact of the temporary tax rebate has receded and personal consumer spending has contracted sharply (Chart 2.6).
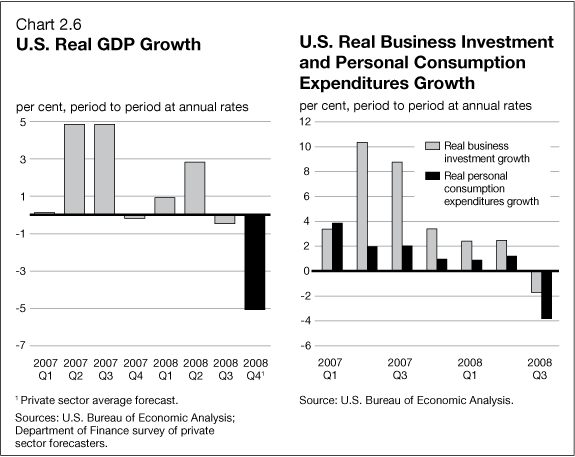
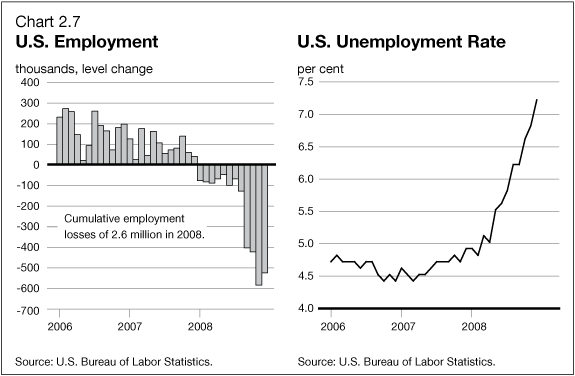
Output fell 0.5 per cent in the third quarter of 2008. Recent economic data suggest that the contraction intensified in the fourth quarter. Indeed, private sector forecasters currently estimate that output has contracted by 5 per cent at an annual rate. Employment losses have accelerated, reaching almost 2.6 million for 2008 as a whole, while the unemployment rate has reached 7.2 per cent, a 16-year high (Chart 2.7). Deteriorating employment prospects and tighter credit conditions have led to further substantial cutbacks in discretionary spending, as evidenced by the weakest level of auto sales since the early 1980s. Manufacturing activity has contracted sharply, while the export sector, which has supported the U.S. economy since early 2007, is now weakening as a result of the global downturn and the appreciation of the U.S. dollar since August 2008.
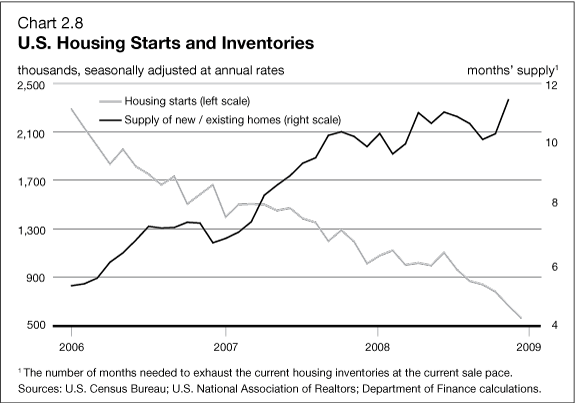
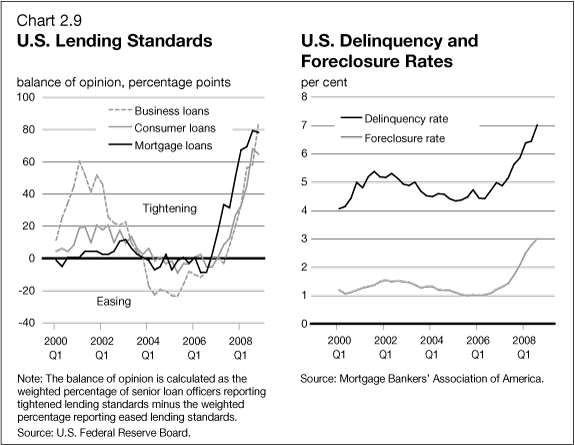
Housing starts and building permits have plunged to new record lows, while home sales and prices continue to decline (Chart 2.8). Housing-related losses have led to a further tightening in lending standards and delinquency and foreclosure rates for residential mortgages have reached record highs (Chart 2.9).
In response to the deteriorating outlook and ongoing financial market stresses, the Federal Reserve cut its target for the federal funds rate on December 16 from 1 per cent to a range of 0 to 0.25 per cent. The Federal Reserve has now lowered its key policy rate by 500 basis points since September 2007. The Federal Reserve has stated that weak economic conditions will likely warrant exceptionally low levels of the target rate for some time. Further, the Federal Reserve stated that it "will employ all available tools to promote the resumption of sustainable economic growth and to preserve price stability."
On the fiscal front, the American Recovery and Reinvestment Bill of 2009, which proposes US$825 billion in fiscal stimulus, was tabled in the U.S. House of Representatives on January 15, 2009 and is currently being discussed by Congress. The bill includes infrastructure spending, personal tax cuts for lower- and middle-income households, business tax cuts designed to boost investment, as well as additional transfers to state governments.
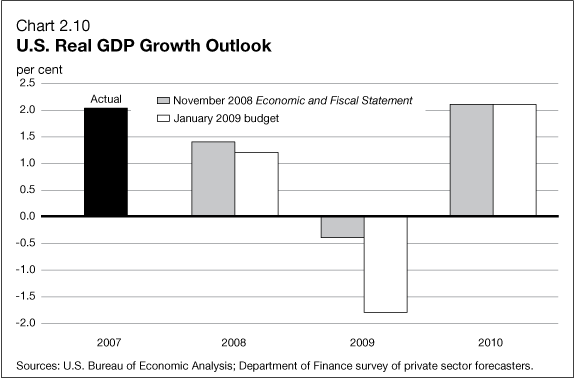
As a result of the developments reviewed above, the private-sector near-term outlook for U.S. real GDP growth has been lowered significantly since the publication of the Economic and Fiscal Statement. Based on the most recent projections of private sector forecasters surveyed by the Department of Finance, U.S. real GDP is now expected to decline by 1.8 per cent in 2009, before strengthening to 2.1 per cent in 2010 (Chart 2.10). Relative to the forecasts prepared at the time of the Statement, the private sector outlook for U.S. economic growth has been revised down by 1.4 percentage points in 2009 and is unchanged for 2010.
With U.S. housing construction now at extremely low levels, inventories of unsold houses should stabilize. Nevertheless U.S. housing demand and prices will likely decline further owing to the ongoing recession and rising unemployment. As inventories are worked off over the course of 2009 and in the first half of 2010, housing starts and house prices are expected to stabilize. The eventual stabilization and recovery of the housing market is also expected to help credit conditions return to normal.
However, there remains an unusually large degree of uncertainty surrounding the outlook. While it is expected that the new fiscal stimulus, together with actions taken to improve the functioning of credit markets, will begin to have an impact on economic growth in mid-2009, the ultimate magnitude and timing of the recovery remain uncertain. Moreover, the pace of economic recovery will also depend on the degree of improvement in the U.S. housing market together with a restoration of the smooth functioning of credit markets. This in turn should lead to a rebound in confidence and equity markets. This scenario underlies private sector expectations of moderate growth in the U.S. in 2010.
Global Economy
Similar to the situation in the U.S., prospects for the world economy have also deteriorated since the release of the Statement. At that time, the International Monetary Fund (IMF) was projecting world GDP growth to slow from 3.7 per cent in 2008 to just 2.2 per cent in 2009,1 well below the pace usually associated with a global recession. Since then, however, global conditions have continued to worsen and private sector forecasters now estimate, on average, that world growth in 2009 will slow to about 1 per cent (Chart 2.11).2 The recent deterioration of global prospects mainly reflects a downward revision to the outlook for advanced economies, linked to the ongoing global financial crisis. However, emerging markets are also projected to experience a more pronounced slowdown than previously expected as capital spending and export growth taper off.
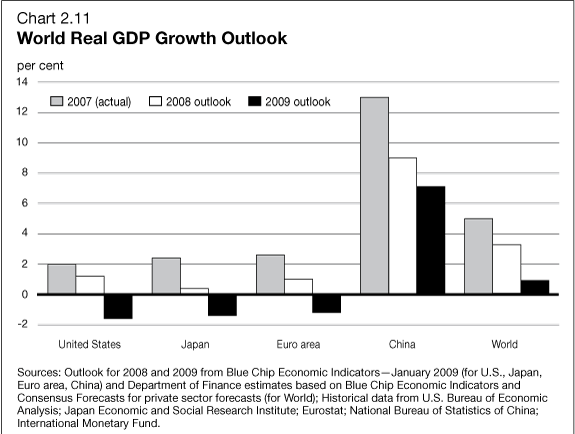
In the Euro area, output contracted in the second and third quarters of 2008. Recent data releases suggest that ongoing weakness is likely as labour markets, consumer spending, business investment and industrial production have all deteriorated more than expected. The European Commission has responded by announcing the European Economic Recovery Plan in which the Commission recommends that member countries implement €200 billion of fiscal stimulus measures (about 1.5 per cent of GDP) to restore confidence and stimulate investment and spending. In support of this recommendation, several individual member countries have already announced fiscal stimulus plans. As well, the European Central Bank has significantly eased monetary policy. After rising by 2.6 per cent in 2007, the Blue Chip consensus now estimates that real GDP growth in the Euro area was about 1.0 per cent in 2008, and is expected to contract by 1.2 per cent in 2009.
Japan is also in recession, reflecting weak consumer spending and declines in business investment and net exports. Japanese authorities cut policy rates for the first time in seven years and announced a series of stimulus packages to shore up the economy. With weaker external and domestic demand, economic activity is projected to remain weak in the coming quarters. According to the Blue Chip consensus, Japanese real GDP growth is expected to slow from 2.4 per cent in 2007 to 0.4 per cent in 2008 and then turn negative in 2009 at -1.4 per cent.
Growth in the emerging market economies has moderated further as the financial crisis has spread. In China, year-over-year growth slowed to 6.8 per cent in the fourth quarter of 2008. The slowdown mainly reflected weaker export growth and a slower pace of capital formation. For 2008 as a whole, growth slowed to 9.0 per cent from 13.0 per cent in 2007. The Blue Chip consensus projects growth in China to slow further to 7.1 per cent in 2009, the slowest pace of economic activity since 1990. In response, the Chinese government has introduced a significant package to stimulate demand and announced its biggest interest rate cut in 11 years.
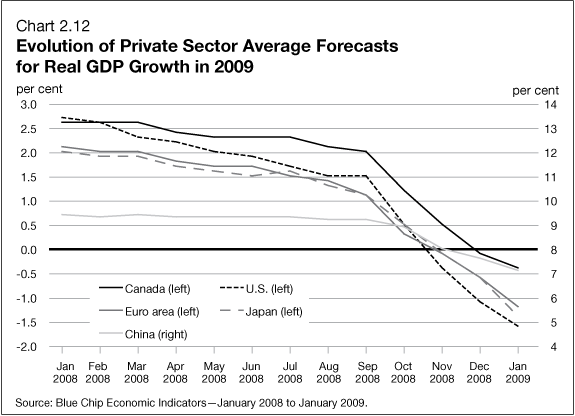
Overall, the global economy is facing an exceptional period of heightened volatility and uncertainty. Reflecting this, growth forecasts for 2009 for all the major advanced and developing economies have been marked down repeatedly and significantly over the past several months (Chart 2.12).
Canadian Economic Developments
Weaker U.S. and global demand, combined with the ongoing global financial market turbulence and lower commodity prices, are all weighing on the Canadian economy. These developments have resulted in declines in exports, slower income growth and upward pressures on borrowing costs, all of which are expected to have reduced output in the fourth quarter of 2008.
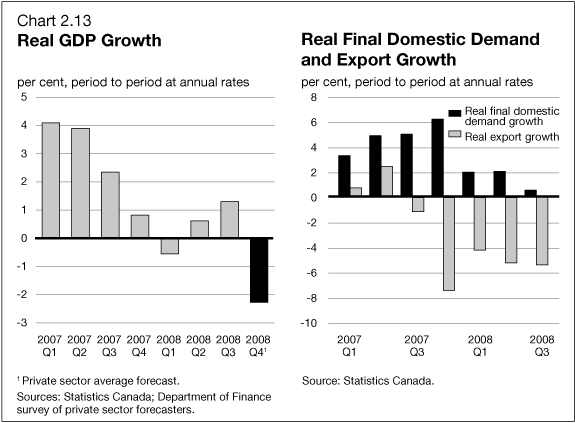
Over the first three quarters of 2008, output growth averaged just 0.4 per cent, largely reflecting continued declines in exports of goods in response to the U.S. slowdown and the lagged impact of a high Canadian dollar. This was offset by continued, albeit slower, growth in final domestic demand (the sum of household, government and business spending). However, starting in the third quarter of 2008, final domestic demand growth has also slowed further, as household and business spending growth continued to moderate (Chart 2.13).
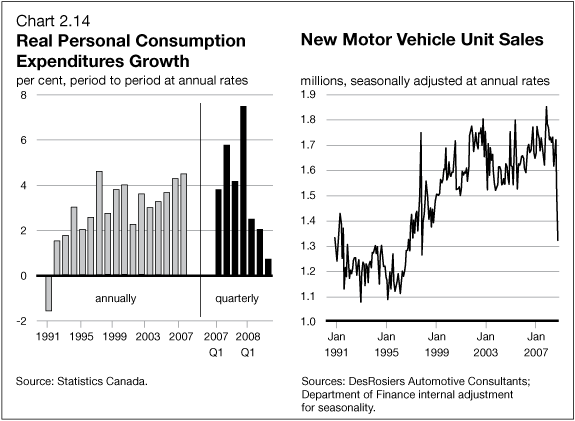
Growth in personal consumption expenditure on goods and services has decelerated over 2008 following strong growth in 2007 in response to a slowdown in real income growth. More recently, consumption growth has slowed further owing to the impact of weaker confidence and lower investment income. The impact of these factors has been particularly evident on spending on new motor vehicle sales, which fell to their lowest level in more than 10 years in December (Chart 2.14).
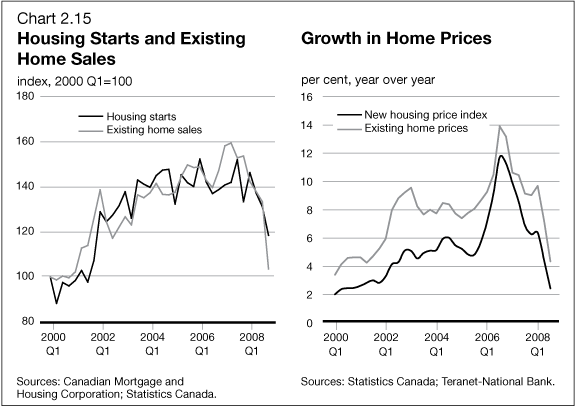
Following a period of rapid growth from 2002 to 2007, Canadian housing investment fell in the first three quarters of 2008, with both new construction and resale activity declining (Chart 2.15). More recently, housing starts fell to their lowest level in seven years in December while existing home sales also fell significantly in the fourth quarter. These recent declines have brought housing starts back to their historical averages from unusually high levels in the past six years. This has been accompanied by a moderation in price growth and some declines in prices in regions where prices had increased sharply. Some further weakening of housing activity and prices is likely as the current period of economic weakness depresses income growth and the demand for housing.
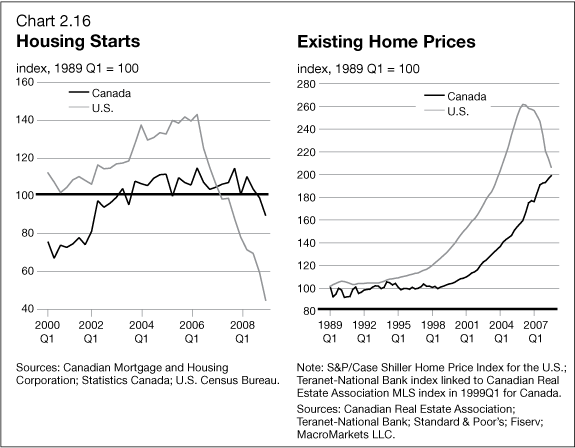
The current adjustment in the Canadian housing market is fundamentally different than the correction that has been underway in the U.S. since 2006. This reflects the fact that the conditions that led to the U.S. housing market collapse are not present in Canada. In particular, the growth of the Canadian housing market was not fuelled by aggressive marketing of high-risk, sub-prime mortgage products that led to unsustainable growth in demand and prices in the United States. As a result, while the United States is in the midst of a severe housing correction to compensate for excesses in previous years, the Canadian housing market is experiencing a cyclical slowing in prices and activity (Chart 2.16).
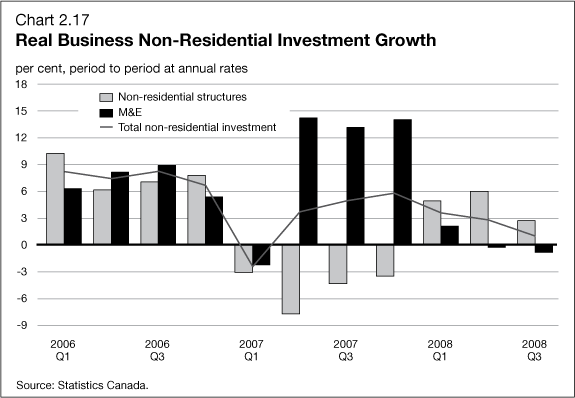
Growth in business investment has also slowed in 2008 in response to tighter credit conditions and a weaker economic outlook. In particular, investment in machinery and equipment (M&E) declined in the second and third quarters of 2008, following sharp declines in capacity utilization and the rising costs of imported M&E due to the depreciation of the Canadian dollar (Chart 2.17).
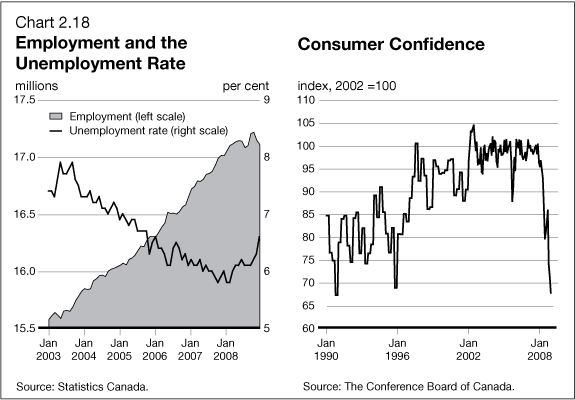
More recent information suggests that the Canadian economy weakened further in the fourth quarter. As a result of the slowdown in the domestic economy, employment losses in export-oriented sectors are no longer being offset by gains in domestically oriented industries. This has weakened labour markets noticeably in recent months. Total employment fell by 105,000 jobs in November and December, and the unemployment rate increased to 6.6 per cent in December, its highest level in almost three years (Chart 2.18). Some regional labour markets are more affected than others. For example, the unemployment rate in Ontario has risen sharply in recent months and has been above the national average unemployment rate for two years. Weaker labour markets together with recent sharp equity market declines resulted in Canadian consumer confidence falling to its lowest levels in more than a decade. These developments are being reflected in weaker consumer and residential spending.
But, overall, the domestic economic situation remains better than in most other major industrialized countries, in particular the United States.
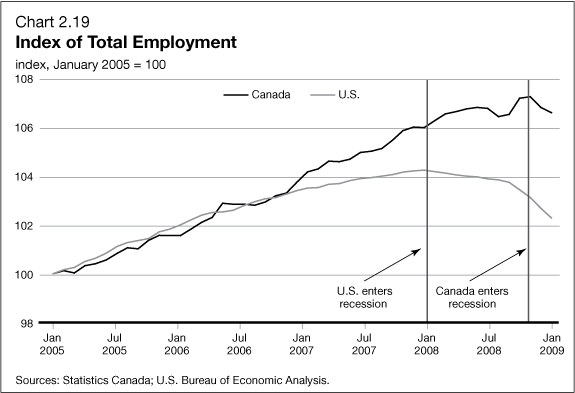
This is particularly evident when comparing labour market performance in the two countries. Since January 2008, the month when the National Bureau of Economic Research estimates that the U.S. recession began, the U.S. has lost more than 2.5 million jobs. Canada to date has fared much better with 98,000 net new jobs created in 2008, despite significant employment losses in November and December (Chart 2.19). As of the third quarter of 2008, Canada was the only G7 country to have posted positive real GDP growth over both the second and third quarters.
Canada’s relatively stronger outlook than that of the U.S. in part reflects the fact that Canada has not had the same excesses in spending and borrowing in recent years. For this reason, the financial position of households and businesses remains solid, both relative to their historical positions and relative to the U.S., where excessive debt and leveraging have led to significant retrenchment.
Commodity Prices
The deteriorating global economic conditions have led to sharp declines in commodity prices (Chart 2.20). While the declines have been broad-based, the fall in energy prices has been particularly large with oil declining the most despite announcements by the Organization of the Petroleum Exporting Countries of cumulative daily production cuts of 4.2 million barrels from the September production levels. Crude oil prices have been volatile in recent months, with daily closing prices having fluctuated in a range of US$31 to US$49 per barrel since the beginning of December. Future contracts suggest that crude oil prices will average about US$50 per barrel in 2009 which is about 30 per cent below levels anticipated by private sector forecasters in the November Economic and Fiscal Statement. Crude oil futures also remain extremely volatile.
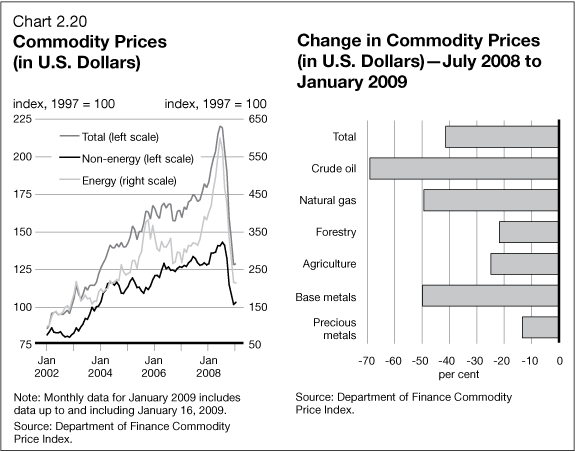
Low commodity prices are reducing Canadian export income and have put downward pressure on the Canadian dollar. This in turn is reducing nominal GDP, which is the broadest indicator of the tax base in Canada, and will ultimately mean lower-than-expected tax revenues. This will also translate into a deterioration of the country’s current account balance, net foreign indebtedness as well as Canadians’ purchasing power.
In this context, the volatility in commodity prices witnessed in recent months has introduced significant uncertainty into the outlook for nominal GDP, and therefore into the fiscal planning framework. Over the near term, the risks to the commodity price outlook are tilted to the downside, reflecting uncertainty over global economic conditions and continued financial market dislocation. Private sector economists expect that commodity prices will recover over the medium term, given the expected recovery in global demand together with tight supply conditions. However, the volatility of the past year and the current high degree of uncertainty underscores the need to assume a prudent path for commodity prices going forward.
Private Sector Canadian Outlook
The Department of Finance surveys private sector economic forecasters on a quarterly basis for their outlook of the Canadian economy. Due to the rapid deterioration of the global economic situation in recent months, private sector forecasters have frequently revised their forecasts downward. The economic forecasts reported here were updated as of January 16, 2009.
Private sector forecasters expect that the Canadian economy will contract by 0.8 per cent in 2009. This compares to a forecast of 0.3 per cent growth at the time of the November Economic and Fiscal Statement (Chart 2.21 and Table 2.1).
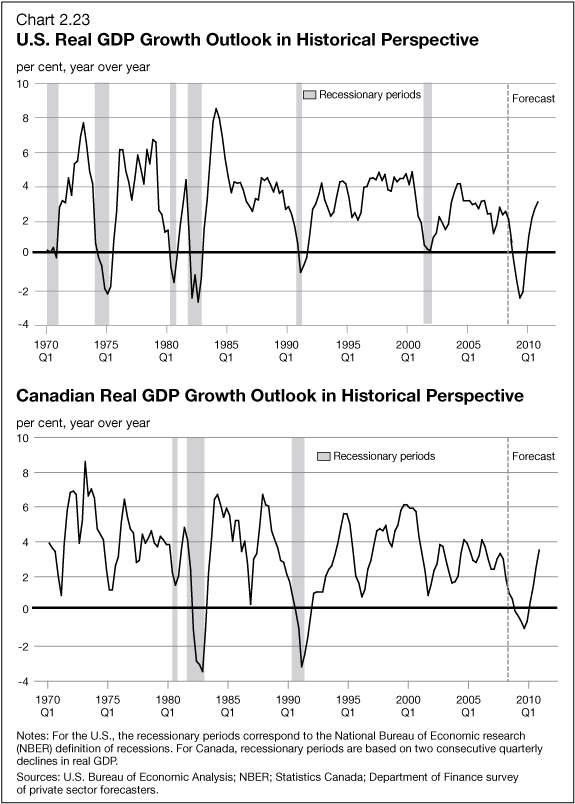
Private sector forecasters believe that the Canadian economy entered a recession in the fourth quarter of 2008 (Chart 2.22). Forecasters expect the recession to last three quarters with the deepest contraction occurring in the first quarter of 2009. Output is expected to reach bottom in the second quarter of 2009 and to start recovering thereafter. The recession is expected to be milder than the last two Canadian recessions and significantly less pronounced than the U.S. recession, which is forecast to be one of the deepest recessions in U.S. post-war history (Chart 2.23).
The outlook for GDP inflation in 2009 has been revised down to -0.4 per cent from 0.5 per cent in the 2008 Statement. This mainly reflects downward revisions to the outlook for commodity prices stemming from a weaker global economic outlook than expected at the time of the Statement. The outlook for GDP inflation in 2010 has been revised down to 1.7 per cent from 1.8 per cent in the Statement.
Weaker real economic growth combined with weaker GDP inflation has reduced the outlook for nominal GDP growth in Canada to -1.2 per cent in 2009 from 0.8 per cent just two months ago. As a result, nominal GDP, which is the broadest indicator of the tax base for government revenue, is forecast to be $25 billion lower in 2009 and $30 billion lower in 2010 than anticipated at the time of the Statement.
At the time of the Economic and Fiscal Statement, private sector forecasters expected short-term interest rates to average 1.9 per cent in 2009 and 2.7 per cent in 2010. Private sector forecasters have revised down the outlook for short-term interest rates to 0.8 per cent in 2009 and 1.7 per cent in 2010. The outlook for long-term interest rates has also been significantly revised down to average 2.8 per cent in 2009 and 3.4 per cent in 2010, from 3.7 per cent and 4.2 per cent, respectively, at the time of the Statement.
Slower growth is expected to translate into an increase in the unemployment rate to 7.5 per cent in 2009 and 7.7 per cent in 2010, compared to 6.9 per cent in 2009 and 6.7 per cent in 2010 as forecast in the Statement.
| 2008 | 2009 | 2010 | Average 2011–14 |
|
|---|---|---|---|---|
| (per cent, unless otherwise indicated) | ||||
| Real GDP growth | ||||
| February 2008 budget | 1.7 | 2.4 | 2.9 | n.a. |
| November 2008 Economic and Fiscal Statement | 0.6 | 0.3 | 2.6 | 2.8 |
| January 2009 private sector forecast | 0.7 | -0.8 | 2.4 | 3.0 |
| GDP inflation | ||||
| February 2008 budget | 1.8 | 1.9 | 1.8 | n.a. |
| November 2008 Economic and Fiscal Statement | 3.8 | 0.5 | 1.8 | 2.1 |
| January 2009 private sector forecast | 4.1 | -0.4 | 1.7 | 2.2 |
| Nominal GDP growth | ||||
| February 2008 budget | 3.5 | 4.3 | 4.7 | n.a. |
| November 2008 Economic and Fiscal Statement | 4.4 | 0.8 | 4.4 | 5.0 |
| January 2009 private sector forecast | 4.8 | -1.2 | 4.2 | 5.2 |
| Nominal GDP level (billions of dollars) | ||||
| February 2008 budget1 | 1,590 | 1,659 | 1,738 | n.a. |
| November 2008 Economic and Fiscal Statement | 1,603 | 1,615 | 1,687 | 1,914 |
| January 2009 private sector forecast | 1,609 | 1,590 | 1,657 | 1,893 |
| 3-month treasury bill rate | ||||
| February 2008 budget | 3.2 | 3.8 | 4.5 | n.a. |
| November 2008 Economic and Fiscal Statement | 2.4 | 1.9 | 2.7 | 4.2 |
| January 2009 private sector forecast | 2.3 | 0.8 | 1.7 | 4.0 |
| 10-year government bond rate | ||||
| February 2008 budget | 3.6 | 4.2 | 4.8 | n.a. |
| November 2008 Economic and Fiscal Statement | 3.7 | 3.7 | 4.2 | 5.1 |
| January 2009 private sector forecast | 3.6 | 2.8 | 3.4 | 5.0 |
| Consumer Price Index (CPI) inflation | ||||
| February 2008 budget | 1.5 | 1.9 | 2.0 | n.a. |
| November 2008 Economic and Fiscal Statement | 2.6 | 1.7 | 1.9 | 2.0 |
| January 2009 private sector forecast | 2.4 | 0.7 | 1.9 | 2.0 |
| Oil price level (US dollars per barrel) | ||||
| February 2008 budget | 82.1 | 79.8 | 82.3 | n.a. |
| November 2008 Economic and Fiscal Statement | 102.5 | 72.0 | 79.0 | 89.7 |
| January 2009 private sector forecast | 99.9 | 50.2 | 63.8 | 82.9 |
| Exchange rate (US cents/C$) | ||||
| February 2008 budget | 98.0 | 95.5 | 95.5 | n.a. |
| November 2008 Economic and Fiscal Statement | 94.9 | 85.6 | 88.7 | 96.0 |
| January 2009 private sector forecast | 94.1 | 81.2 | 85.5 | 94.4 |
| Unemployment rate | ||||
| February 2008 budget | 6.3 | 6.4 | 6.2 | n.a. |
| November 2008 Economic and Fiscal Statement | 6.1 | 6.9 | 6.7 | 6.2 |
| January 2009 private sector forecast | 6.1 | 7.5 | 7.7 | 6.4 |
| U.S. real GDP growth | ||||
| February 2008 budget | 1.5 | 2.4 | 3.0 | n.a. |
| November 2008 Economic and Fiscal Statement | 1.4 | -0.4 | 2.1 | 2.9 |
| January 2009 private sector forecast | 1.2 | -1.8 | 2.1 | 3.1 |
| 1 Nominal GDP levels have
been adjusted to reflect May 2008 revisions to Canada’s National
Income and Expenditure Accounts. Source: Department of Finance survey of private sector forecasters. |
||||
Risk Assessment and Planning Assumptions
There continues to be a large degree of uncertainty surrounding the global economic outlook, with the risks to that outlook tilted to the downside.
The main risk to the global economy is that financial market dislocations could be more prolonged than currently expected, resulting in a longer period of high business and consumer borrowing costs and reduced credit availability. Should this transpire, global consumer spending and business investment would be weaker than currently forecast.
For Canada, the risk to the global economy is compounded by the risk stemming from low and volatile commodity prices. As a result, there is considerable uncertainty about how commodity prices will affect nominal income growth in Canada. Overall, the outlook for commodity prices poses a significant downside risk to the average private sector forecast for nominal GDP, reported in Table 2.1. Nominal GDP is the broadest single measure of the tax base. Therefore, lower nominal GDP also reduces the projected level of budgetary revenues described in Chapter 4. The risks to the downside are larger for 2009 and 2010.
In light of these risks, the Government has judged it appropriate to adjust downward the private sector forecast for nominal GDP for budget planning assumptions.
With this adjustment, the budget economic planning assumption for 2009 is now close to the bottom of the range of individual private sector forecasts for nominal GDP growth (Chart 2.24).
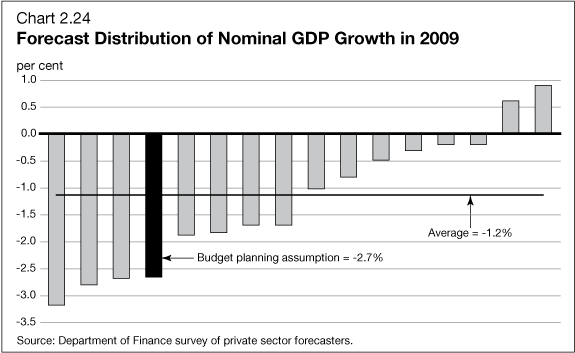
As a result, the planning assumption is for a contraction of 2.7 per cent in nominal GDP in 2009 (Table 2.2). This means that the budget planning assumption for the level of nominal GDP is about $30 billion lower than expected by the private sector in 2009 and 2010. Starting in 2011, the gap with the private sector forecast for nominal GDP begins to close and is closed by 2014 when risks to the private sector outlook are more balanced. The Government will continue to evaluate economic developments and risks to determine whether or not it would be appropriate to maintain the adjustment for risk in future budgets and economic and fiscal updates.
| 2008 | 2009 | 2010 | 2011 | 2012 | 2013 | 2014 | |
|---|---|---|---|---|---|---|---|
| Nominal GDP Growth (per cent) | |||||||
| January 2009 private sector forecast |
4.8 | -1.2 | 4.2 | 5.7 | 5.5 | 5.0 | 4.7 |
| Budget 2009 fiscal planning | 4.4 | -2.7 | 4.3 | 6.4 | 6.1 | 5.3 | 5.0 |
| Nominal GDP Level (billions of dollars) | |||||||
| January 2009 private sector forecast |
1,609 | 1,590 | 1,657 | 1,751 | 1,848 | 1,940 | 2,031 |
| Budget 2009 fiscal planning | 1,604 | 1,560 | 1,627 | 1,731 | 1,838 | 1,935 | 2,031 |
| Adjustment for risk | -5 | -30 | -30 | -20 | -10 | -5 | 0 |
1 The IMF reports world real GDP growth on both a purchasing power parity (PPP) and a market exchange rate basis. On a market exchange rate basis, the IMF expected world real GDP growth to ease from 2.6 per cent in 2008 to 1.1 per cent in 2009 in its November 2008 World Economic Outlook Update.
2 Estimated by the Department of Finance based on private sector forecasts (Consensus Forecasts and Blue Chip Economic Indicators) and IMF implicit PPP weights (2007 estimates for real GDP).
Table of Contents - Previous - Next